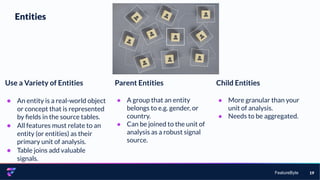
Data is a finite resource, and you want to get the most out of it. So feature engineering becomes vital for machine learning success. Yet we often lose important signals in our data when our data extracts are limited to the same old boring COUNT and SUM aggregations. We propose a new approach to feature engineering ideation, based upon a structure using data semantics and signal types, yet with the freedom to apply domain knowledge.
Maximizing Your ML Success with Innovative Feature EngineeringFeatureByte
Effective feature engineering is essential for achieving successful machine learning outcomes, but important signals within data are often missed. In this talk, Xavier will present his fresh and innovative approach to feature engineering ideation, exploring how to create features with different signal types, including timing, regularity, stability, diversity, and similarity. Using FeatureByte, a recently launched free and source-available feature platform that leverages popular data platforms like Snowflake, Spark, and DataBricks, Xavier will demonstrate the practical application of these techniques. Attendees can expect to gain valuable insights and techniques on how to creatively engineer features and unlock the full potential of their data for machine learning success.
Data Science Salon: Digital Transformation: The Data Science CatalystFormulatedby
Carnival is the world's largest travel leisure company, with a combined fleet of over 100 vessels across 10 cruise line brands and growing. We analyze social channels (Facebook, Twitter, Instagram), web analytics and booking data to predict customer behavior and develop marketing strategies. This session will discuss the challenges of mining all of this data and some of the Machine Learning techniques we use to segment our customers (e.g. Clustering) and predicting the value of a customer (e.g. Regression).
Next DSS MIA Event - https://datascience.salon/miami/
Presented by MANCHON (KEVIN) U Senior Director, Head of Marketing Analytics & Data Science at Carnival Cruise Line and MARC FRIDSON, former Principal Data Scientist at Carnival Cruise Line.
How to connect product management and software engineering.
In order to connect the time old divide between product management/sales with software development, Domain Driven Design contains a series of paradigm changes and techniques to deal with complexity which align the vision of the product and the learning that the development team get from it.
Contains code samples in Python to illustrate the concepts.
Presented at Python Floripa 2017 meetup.
Patterns for Success in Data Science EngagementsThoughtworks
This talk will focus on lessons learned over the last year during participation data science client engagements. A number of common themes emerged during these projects. Client maturity in terms of expectations, infrastructure and data history were all key contributors to success.
This presentation talks about challenges in typical supply chain processes, benefits of implementing analytics, few use cases, and our app-based development approach for addressing the challenges.
Some comments on data science in general. This is a super basic introduction to the topic. I shared these slides with my team members @reBuy to help them understand how can I, as the data scientist, can help them.
Calculating Your Customer Lifetime Value - Dawn of the Data Age Lecture SeriesLuciano Pesci, PhD
Not all customers are created equal. Finding the average customer lifetime value is a quick win for your organization, and you definitely have the data necessary to do it, but a closer inspection of your data will show that 1 in 5 of your customers is responsible for 80% of the total lifetime value. And that isn't even taking non-monetary CLV into consideration. To beat your competition for the best customers you need individual-level insights about the value of each customer.
This Lecture Will:
-TEACH YOU HOW TO USE YOUR DATA TO FIND AVERAGE CLV.
-EXPLAIN THE BEST PRACTICES WHEN DEALING WITH NON-MONETARY CLV.
-SHOW YOU HOW TO MOVE BEYOND AVERAGE CLV TO INDIVIDUALIZED CLV.
You can watch this lecture here: https://youtu.be/iCX-afWhmZ4
The New Role of Epertise: Open Science in a Web of Sensors, Senses and SemanticsJohn Blossom
John Blossom presentation from the 31 October 2014 National Research Council open science forum at the National Academy of Sciences in Washington, DC. Presentation focuses on the shifting value of expert insights in a global, mobile real-time economy, how existing models combining open and proprietary publishing have succeeded greatly, how the shifting role of experts into the realm of the collaborative has misplaced the value proposition for scientific publishing and how the concept of "signal" from trillions of Web-enabled sensors and semantic inputs pushes information services to provide more analytic and predictive information services to serve scientists needing to devise, implement and replicate scientific inquiry.
Analytics is Taking over the World (Again) - UKOUG Tech'17Rittman Analytics
In this presentation we'll look at some of the new industries and new technologies that are only possible today with analytics, how employee empowerment and improving your fitness are spin-offs of the same technology used to track boxes around a warehouse and spot fraudulent bank transactions, and how Oracle are embedding these new analytics capabilities in their cloud-based HR.
The business value of consumer analytics and big data is not just about what you can discover or infer about the consumer, but how you can use this insight promptly and effectively across multiple touchpoints (including e-Commerce systems and CRM) to create a powerful and truly personalized consumer experience.
For most organizations, mobilizing this kind of intelligence raises organizational challenges as well as technical ones.
This presentation reveals how some leading companies are starting to address these challenges, and describes the vital role of enterprise architecture in supporting such initiatives.
Using cloud-based software is standard practice for modern industries and most consumers, yet many local governments have still not fully understood and adopted this technology.
Topics:
* What are the major differences between traditional client/server and SaaS?
* How can SaaS improve internal efficiency and improve public services?
* How does the technology underlying SaaS address things like scalability, security, and adaptability?
* Lessons learned
Anatomy of an eCommerce Search Engine by Mayur DatarNaresh Jain
In this talk, the chief Data scientist of Flipkart will uncover the various challenges in running an e-commerce search platform like scale, recency, update rates, business shaping etc. He will also explain the overall system architecture of the search platform and get into the details of some of the sub-systems, including the query understanding and rewriting sub-system.
A multi sided marketplace platform for telco enabled products Werner EriksenAlan Quayle
TADSummit EMEA Americas 2021
A multi sided marketplace platform for telco enabled products
Werner Eriksen, CTO WorkingGroupTwo
Why has there been so much more innovation in the web- and mobile than other industries? One reason is that the internet and the two major mobile platforms have been great at enabling third party developers to build a wide range of products, as well as offering a great distribution channel towards end-users.
We believe this multi sided marketplace approach is the next step for the telecom industry as well. WGTWO has created a programmable mobile core network, built as a platform, API’ed and delivered as-a-service, along with marketplaces where operators, developers and end-users interact.
This enables 3rd party developers to create great products that people love – helping operators to start using and redistributing these products – and allowing subscribers to find, add, and manage extra products on top of their price plans.Making this a reality is not straightforward.
Let us share our journey, where we started – where we are right now – and the direction we are heading.
Lifetime Value - The Only Metric That Matters (DMC September 2018)Luciano Pesci, PhD
Lifetime value (LTV) is the single most impactful metric for marketers to know since 20% of customers predictably contribute 80% of the total lifetime value. To understand this "Pareto Persona" you need to map data from every touchpoint in the customer journey, break down internal data silos, and adopt powerful frameworks like LTV for organizing & explaining data.
With lifetime value, you can optimize cost of acquisition decisions based on a persona that will have the highest satisfaction, longest lifecycle, and greatest likelihood to recommend you to their network. As a bonus, your product, sales, and customer experience teams will also benefit from knowing lifetime value, making you the hero of the day for delivering unparalleled ROI with data (possibly for the first time in your organization's history).
You can watch this presentation here: https://youtu.be/6x3Z7uRtvFc
Luciano Pesci, PhD is the Chief Executive Officer of Emperitas which spoke on the subject of Lifetime Value the Only Metric that Matters and how it is beneficial to business.
For those that don’t understand much about marketing or business, the term Lifetime Value could be a little confusing. Lifetime Value has been defined by Google as a way to understand a customer’s revenue potential. Forbes has defined it as a measure of the profit you can expect to generate from a customer over the entire time they do business with you. It is one of the most impactful metrics for marketers to understand as 20% of customers predictably contribute 80% of total lifetime value.
How to bridge the gap between Statisticans and Business folks ? Flutura outli...fluturadsa
Flutura has always believed that when the world of business collides with the world of math, magic unfolds. As these 2 worlds collide, it also presents a set of unique challenges - bridging the semantic language gap between business and math. Modelling complex business outcomes using math requires an interdisciplinary team consisting of business folks, data folks and math folks. While doing so business folks are always at a loss because a language chasm exists. Math folks love their ”geek speak” ( Tanimoto coefficient, chi square, odds ratio) and business folks are focussed on impactful outcomes (Mean time between failure, Next best action etc.).
Multiquip is very good in managing our customer base, where we really lack insights is in what are we missing. What are the opportunities we don’t get and are we focusing on old tech and old customers instead of looking out for new customers?”
Better Living Through Analytics - Louis Cialdella Product SchoolLouis Cialdella
What does a successful partnership between product and analytics teams look like? What can analysts do to ensure a successful partnership with other teams? Some strategies and tips from my work at ZipRecruiter.
Unleash Your Campaign's Potential: Elevate Your Performance Marketing Game_Fi...Search Engine Journal
2023 has been a time of great change in the online space, driven by the increased adoption of AI and other technologies.
Are you doing enough to win over your audience and stay ahead in spite of these changes?
Looking to employ the right strategies to reach (and convert) your ideal customers with modern digital marketing tools?
Watch iQuanti’s Senior Vice President of Digital Solutions, and discover five key performance marketing trends you need to master to captivate your audience in a rapidly evolving digital landscape.
You’ll learn:
- How to integrate AI into your marketing strategies to stay ahead of the curve.
- Tools and new tactics for engaging your audience with brand new technologies.
- Recent advancements in marketing that can streamline your strategies for success.
With so many new technological advancements, your strategies must also evolve to meet the needs of your audience.
Ensure your performance marketing strategies are set up for success now and beyond with these emerging 2024 trends.
Overview of analytics and big data in practiceVivek Murugesan
Intended to give an overview of analytics and big data in practice. With set of industry use cases from different domains. Would be useful for someone who is trying to understand Analytics and Big Data.
Levelwise PageRank with Loop-Based Dead End Handling Strategy : SHORT REPORT ...Subhajit Sahu
Abstract — Levelwise PageRank is an alternative method of PageRank computation which decomposes the input graph into a directed acyclic block-graph of strongly connected components, and processes them in topological order, one level at a time. This enables calculation for ranks in a distributed fashion without per-iteration communication, unlike the standard method where all vertices are processed in each iteration. It however comes with a precondition of the absence of dead ends in the input graph. Here, the native non-distributed performance of Levelwise PageRank was compared against Monolithic PageRank on a CPU as well as a GPU. To ensure a fair comparison, Monolithic PageRank was also performed on a graph where vertices were split by components. Results indicate that Levelwise PageRank is about as fast as Monolithic PageRank on the CPU, but quite a bit slower on the GPU. Slowdown on the GPU is likely caused by a large submission of small workloads, and expected to be non-issue when the computation is performed on massive graphs.
Adjusting primitives for graph : SHORT REPORT / NOTESSubhajit Sahu
Graph algorithms, like PageRank Compressed Sparse Row (CSR) is an adjacency-list based graph representation that is
Multiply with different modes (map)
1. Performance of sequential execution based vs OpenMP based vector multiply.
2. Comparing various launch configs for CUDA based vector multiply.
Sum with different storage types (reduce)
1. Performance of vector element sum using float vs bfloat16 as the storage type.
Sum with different modes (reduce)
1. Performance of sequential execution based vs OpenMP based vector element sum.
2. Performance of memcpy vs in-place based CUDA based vector element sum.
3. Comparing various launch configs for CUDA based vector element sum (memcpy).
4. Comparing various launch configs for CUDA based vector element sum (in-place).
Sum with in-place strategies of CUDA mode (reduce)
1. Comparing various launch configs for CUDA based vector element sum (in-place).
Explore our comprehensive data analysis project presentation on predicting product ad campaign performance. Learn how data-driven insights can optimize your marketing strategies and enhance campaign effectiveness. Perfect for professionals and students looking to understand the power of data analysis in advertising. for more details visit: https://bostoninstituteofanalytics.org/data-science-and-artificial-intelligence/
Techniques to optimize the pagerank algorithm usually fall in two categories. One is to try reducing the work per iteration, and the other is to try reducing the number of iterations. These goals are often at odds with one another. Skipping computation on vertices which have already converged has the potential to save iteration time. Skipping in-identical vertices, with the same in-links, helps reduce duplicate computations and thus could help reduce iteration time. Road networks often have chains which can be short-circuited before pagerank computation to improve performance. Final ranks of chain nodes can be easily calculated. This could reduce both the iteration time, and the number of iterations. If a graph has no dangling nodes, pagerank of each strongly connected component can be computed in topological order. This could help reduce the iteration time, no. of iterations, and also enable multi-iteration concurrency in pagerank computation. The combination of all of the above methods is the STICD algorithm. [sticd] For dynamic graphs, unchanged components whose ranks are unaffected can be skipped altogether.
Opendatabay - Open Data Marketplace.pptxOpendatabay
Opendatabay.com unlocks the power of data for everyone. Open Data Marketplace fosters a collaborative hub for data enthusiasts to explore, share, and contribute to a vast collection of datasets.
First ever open hub for data enthusiasts to collaborate and innovate. A platform to explore, share, and contribute to a vast collection of datasets. Through robust quality control and innovative technologies like blockchain verification, opendatabay ensures the authenticity and reliability of datasets, empowering users to make data-driven decisions with confidence. Leverage cutting-edge AI technologies to enhance the data exploration, analysis, and discovery experience.
From intelligent search and recommendations to automated data productisation and quotation, Opendatabay AI-driven features streamline the data workflow. Finding the data you need shouldn't be a complex. Opendatabay simplifies the data acquisition process with an intuitive interface and robust search tools. Effortlessly explore, discover, and access the data you need, allowing you to focus on extracting valuable insights. Opendatabay breaks new ground with a dedicated, AI-generated, synthetic datasets.
Leverage these privacy-preserving datasets for training and testing AI models without compromising sensitive information. Opendatabay prioritizes transparency by providing detailed metadata, provenance information, and usage guidelines for each dataset, ensuring users have a comprehensive understanding of the data they're working with. By leveraging a powerful combination of distributed ledger technology and rigorous third-party audits Opendatabay ensures the authenticity and reliability of every dataset. Security is at the core of Opendatabay. Marketplace implements stringent security measures, including encryption, access controls, and regular vulnerability assessments, to safeguard your data and protect your privacy.
2. FeatureByte
Feature Ideation
2
Colin Priest, Chief Evangelist
Data is a finite resource, and you want to get the most out of it. So
feature engineering becomes vital for machine learning success. Yet
we often lose important signals in our data when our data extracts
are limited to the same old boring COUNT and SUM aggregations.
We propose a new approach to feature engineering ideation, based
upon a structure using data semantics and signal types, yet with the
freedom to apply domain knowledge.
5. FeatureByte 5
Why is Feature Engineering Important?
Clean Data
Feature engineering tells an
algorithm how to handle
data.
Improved Model
Performance
Better features lead to more
accurate models, which
leads to better predictive
power and ultimately, better
decisions.
Explainability
Feature engineering is a
creative process that
requires a deep
understanding of data to
create signals that
intuitively link to real world
characteristics and actions.
7. FeatureByte 7
Clumpiness Signals
Do events occur randomly across time,
or are there long gaps between intense
bursts of activity?
Metrics
● Coefficient of variation of
inter-event times
● Entropy of inter-event times
Examples
● Which customers are binge-watching TV
shows?
● Do equipment failures occur in cascades?
● After a long break without purchasing, does
a customer return to a store a few times
over several days to purchase items?
8. FeatureByte 8
Inventory Signals
What are the counts or amounts of
events or available resources,
cross-categorized by an item label?
Metrics
● Counts of item types
● Sum of values of item types
● Max values of item types
● Latest attribute of item types
Examples
● What are the counts of each item type in a
shopping basket?
● What is the total value of item type for each
customer’s shipping orders over 30 days?
● What is the maximum weight of each type of
item in a shipping order?
9. FeatureByte 9
Similarity Signals
How similar is one entity to a group of
others?
Metrics
● Ratio of one entity's numeric
value to the average or
maximum of values over a
group of entities.
● Cosine similarity of two
entities’ cross-aggregations
Examples
● How similar is one customer's purchases to
customers of the same age and gender?
● What is the ratio of a network antenna's
maximum temperature to that of all other
antennas that are the same model, or
located in the same geography?
10. FeatureByte 10
Stability Signals
Are an entity’s recent events similar to
the past for the same entity?
Metrics
● Ratio of latest numeric value to
the average or max of values
over a historical time window.
● Cosine similarity of two
cross-aggregations from
different time periods
Examples
● Are the contents of the latest shopping
basket similar to past purchases?
● Is the count or sum of numeric event data
over the most recent period similar to the
past?
● Is a recent data value anomalous?
11. FeatureByte 11
Change Signals
Have usually static attributes changed?
By how much?
Metrics
● Did an attribute change?
● How many times did an
attribute change?
● By how much did it change?
Examples
● Did a customer change address over the past
two years? How far?
● Has a password been reset in the past 48
hours?
● Was network equipment replaced with a
different make or model?
12. FeatureByte 12
Diversity Signals
How variable are the data values?
Metrics
● Coefficient of variation of
amounts
● Entropy of labels
Examples
● How variable are the monthly invoice
amounts over the past 6 months?
● How stable is a patient's blood pressure?
● Does a customer always purchase similar
products?
13. FeatureByte 13
Location Signals
The static or dynamic location of an
event or entity.
Metrics
● The latitude and longitude of an
event.
● Distance between locations, or
distance moved within a time
period.
Examples
● What is the distance between the shop and
the customer address?
● Is the shipping address in a remote location?
What is the population density in that state?
● How far has a vehicle moved in the past
hour?
14. FeatureByte 14
Regularity Signals
Any seasonality in the timing of events.
Metrics
● Entropy of day of the week of
events.
● Cross-aggregation of events by
hour or month
Examples
● Does a customer always shop on the same
days of the week?
● Do equipment failures tend to occur at
different times of the day or times of year?
15. FeatureByte 15
Recency Signals
Attributes of the latest event to occur.
Metrics
● Time since last event.
● Label of last event.
● Magnitude of last event.
Examples
● How much did a customer spend on their
last purchase?
● How long since the last equipment failure?
● Was a patient’s last visit for an emergency?
16. FeatureByte 16
Frequency Signals
How often do events occur?
Metrics
● Number of events occurring
over a time window.
Examples
● How many hospital admissions has the
patient had in the past 12 months?
● How many international phone calls has a
customer made in the past month?
17. FeatureByte 17
Monetary Signals
What are the monetary amounts of
events over a time window?
Metrics
● Total cost of events occurring
over a time window.
● Average cost of events
occurring over a time window
Examples
● How much did a customer spend over the
past 12 months?
● What was the average discount applied to a
customer’s purchases over the past month?
19. FeatureByte 19
Entities
Parent Entities
● A group that an entity
belongs to e.g. gender, or
country.
● Can be joined to the unit of
analysis as a robust signal
source.
Child Entities
● More granular than your
unit of analysis.
● Needs to be aggregated.
Use a Variety of Entities
● An entity is a real-world object
or concept that is represented
by fields in the source tables.
● All features must relate to an
entity (or entities) as their
primary unit of analysis.
● Table joins add valuable
signals.
21. FeatureByte 21
Conclusion
Use signal types and entities for
inspiration and information
Inspiration
● Lists of signal types and entities
can prompt and remind you to
engineer missing features
Information
● Features with different signal types tend to
be less correlated
● Business SMEs can intuitively understand
signal types