Download as PDF, PPTX


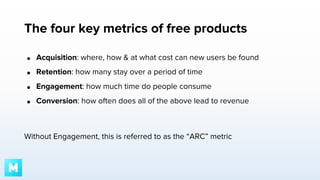
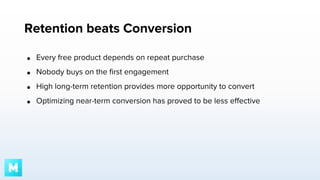


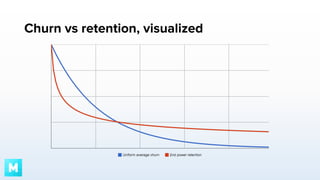


Game analytics can provide valuable insights into user acquisition, retention, engagement, and monetization. Key metrics include the acquisition cost of new users, how many users are retained over time, how engaged users are with the game, and how often engagement leads to revenue. Retention is particularly important as it provides more opportunities for conversion and repeat purchases over time. Analytics can help optimize the game experience and identify which users are most likely to engage and be retained by focusing on specific in-game events and behaviors rather than averages. The data collected should then be used to test changes, provide personalized experiences, and continuously improve the game.


