2. 78 K.C. McRoberts, D.J.R. Cherney / Animal Feed Science and Technology 187 (2014) 77–85
Table 1
Forage and silage samples included in the study.
Species Origin n
C3 grasses 40
Orchardgrass (Dactylis glomerata L.) New York State 11
Quackgrass (Elytrigia repens (L.) Desv. Ex Nevski) New York State 3
Tall Fescue (Festuca arundinacea Schreb.) New York State 3
Rice straw (Oryza sativa L.) Vietnam 3
Reed Canarygrass (Phalaris arundinacea L.) New York State 11
Timothy (Phleum pratense L.) New York State 9
C4 grasses 122
Big Bluestem (Andropogon gerardii Vitman) New York State 6
Brachiaria Cv. Mulato II (Brachiaria ruziziensis x B. decumbens x B. brizantha) Vietnam 75
Guinea Grass (Panicum maximum Jacq. (TD 58)) Vietnam 3
Switchgrass (Panicum virgatum L.) New York State 26
Paspalum atratum Swallen Vietnam 3
Elephant Grass (Pennisetum purpureum Schumach.) Vietnam 5
Maize (Zea mays L.) New York State 4
Legumes 21
Birdsfoot Trefoil (Lotus corniculatus L.) New York State 3
Alfalfa (Medicago sativa L.) New York State 14
Stylosanthes guianensis (Aubl.) CIAT 184 Vietnam 1
Red Clover (Trifolium pratense L.) New York State 3
Silages 13
Alfalfa silage (Medicago sativa L.) New York State 3
Maize silage (Zea mays L.) New York State 10
Whole Set 196
Numerous modifications of the original NDF technique (Van Soest and Wine, 1967) have been suggested (Mascarenhas
Ferreira et al., 1983; Van Soest et al., 1991; Giger-Reverdin, 1995; Mertens, 2002). An important modification that enabled
rapid processing while reducing technician error was a high throughput NDF technique in filter bags (Komarek, 1994). A
newer version of Komarek’s original approach consists of a pressurized chamber and more automated processing. Several
studies have provided evidence that filter bag techniques correlate well with conventional NDF analysis, often with lower
variation, and can be implemented as an acceptable alternative (Komarek, 1993; Vogel et al., 1999; Fay et al., 2005; Ferreira
and Mertens, 2007). However, the initial investment in infrastructure can be cost prohibitive, especially for laboratories in
developing countries and other low budget operations. Pereira et al. (2009) evaluated an alternative filter bag NDF technique
in a shaker water bath. Significant differences were not detected between their method and ANKOM for a limited NDF range
of ryegrass, rye, and oats samples.
Development of the technique proposed in this paper was motivated by an observed need in developing countries for an
efficient, low-budget NDF analysis alternative using materials that are often readily available in laboratories. Consequently,
the primary objectives of this study were: (1) to develop a low-infrastructure filter bag NDF technique, and, (2) to test the
technique versus a standard filter bag NDF technique (ANKOM) using a diverse set of temperate and tropical forages.
2. Methods
Forage samples (n = 196) were collected in New York State and Vietnam between 2010 and 2012 (Table 1), dried to
stable weight at 60 ◦C in a forced air oven, and ground in a Wiley Mill (Arthur H. Thomas Co., Philadelphia, PA) to pass a
1-mm screen. Samples (0.25 g) were weighed to nearest 0.0001 g, transferred into filter bags (ANKOM F57, 25 m porosity),
and analyzed separately for aNDF concentration (without sodium sulfite) in duplicate using a standard technique (ANKOM
Technology, 2011) and the proposed water bath technique (WB). Sodium sulfite was not added, because samples consisted
of forages and silages that did not contain high protein material, material of animal origin or heat damaged samples, and to
eliminate the possibility of sodium sulfite attacking and solubilizing lignin (Van Soest et al., 1991; Hintz et al., 1996). Results
were not ash corrected, but were blank bag corrected using the overall blank bag correction factor for each technique.
The blank bag correction factor for individual blank bags was calculated as the post-extraction 105 ◦C dry weight for each
bag divided by its pre-extraction weight. The overall blank bag correction factor (BBC) was the mean of individual blank
bag correction factors for each technique. Dry matter (DM) was determined for 1 g subsamples dried overnight in a forced
air oven at 105 ◦C, the temperature recommended in National Forage Testing Association Method 2.2.2.5 (Undersander
et al., 1993). aNDF concentration was calculated as: g aNDF/kg DM = ((R – BW × BBC)/(SW × SDM)) × 1000, where R = post-
extraction 105 ◦C dry weight of bag and residue, BW = pre-extraction blank bag weight, BBC = blank bag correction factor for
ANKOM or WB, SW = pre-extraction sample weight, and SDM = sample 105 ◦C DM. A standard Dactylis glomerata L. sample
was also included in each batch for both techniques to assess variability among batches and techniques for the same sample.
Sample processing order was completely randomized. ANKOM and WB batches (48 filter bags or 22 duplicate samples + 2
blank bags + 2 D. glomerata L. standards) were completed on the same days using the same neutral detergent solution
(NDS) batch. ANKOM guidelines (ANKOM Technology, 2011) for NDS preparation, equivalent to the procedure described by
3. K.C. McRoberts, D.J.R. Cherney / Animal Feed Science and Technology 187 (2014) 77–85 79
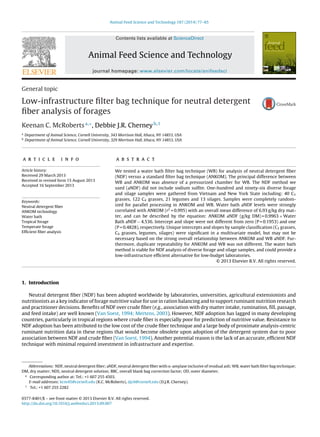
Fig. 1. A two-level stainless steel sandwich rack was used to process 48 bags per batch.
Mertens (2002), were used to prepare 8 L batches. pH tested between 6.9 and 7.1 for all batches. A volume of 4 mL heat-stable
alpha-amylase (activity = 17,400 Liquefon Unit/mL, FAA, ANKOM Technology) was added for 24 filter bags. Analyses were
completed at Cornell University (Ithaca, NY).
Excluding the use of filter bags and batch processing, the ANKOM and WB procedures are closest to the modified procedure
for neutral detergent residue (Robertson and Van Soest, 1981) with a modern heat-stable alpha-amylase or the aNDF method
(Mertens, 2002) without sodium sulfite.
2.1. Standard filter bag NDF procedure: ANKOM
The ANKOM A200 Fiber Analyzer NDF procedure (ANKOM Technology, 2011) was applied with four modifications: (1)
Sodium sulfite was not added. (2) Sample size was 0.25 g instead of 0.5 g. (3) Temperature for post-extraction sample drying
was 105 ◦C instead of 102 ◦C. (4) Conventional desiccators were used in lieu of desiccator pouches.
ANKOM samples were processed in the A200 Fiber Analyzer using the new bag suspender design available in 2013
(ANKOM Technology SKU: F11). Two A200 units were used to facilitate parallel batch processing with WB. Each unit contained
a vertical cylindrical stainless steel reservoir (2 L capacity) with a stainless steel lid that was closed during the extraction
to enable chamber pressurization at 100 ◦C. Twenty-four filter bags per batch were processed in each unit using the 8-level
vertical bag suspender. Each level (tray) was manufactured from heat resistant plastic. Trays were connected by a stainless
steel shaft that fit snugly through a center hole in each tray. Each tray contained three filter bags, and each bag was situated
in a small pocket where it could float in NDS without contacting other samples during the extraction. After adding ambient
temperature NDS (2 L) and alpha-amylase (4 mL), the bag suspender loaded with samples was submerged in the reservoir.
A weight was added to the top of the vertical stainless steel shaft to secure the unit and maintain rack submergence during
the extraction, and the lid was sealed. Extraction time was 75 min. The A200 units required approximately 15 min to reach
target temperature (100 ◦C), which was maintained for the remaining 60 min of the extraction. Units provided heat and
constant vertical agitation by raising and lowering the rack in solution using a mechanical rotating disc. After extraction,
heat and agitation were turned off and solution was drained through an exhaust valve at the bottom of the reservoir. The
reservoir was refilled with hot water (70 to 90 ◦C) from a Bunn Model H5E/H5X 18.9 L hot water dispenser (68.1 L boiling
water capacity per hour) to complete three rinse cycles (5 min each). Heat and agitation were used during the rinse cycles,
but the lid was not sealed. The first two hot water rinses were completed with alpha-amylase (4 mL per rinse). Following
the rinse cycles, bags were removed from the tray, gently squeezed to remove excess water, and submerged in acetone
(in a glass beaker) for 5 min. Bags were gently squeezed to remove excess acetone and placed on a glass tray to evaporate
remaining acetone. Samples were dried overnight at 105 ◦C before weighing through conventional desiccators.
2.2. Water bath
The water bath technique replicated the standard procedure (ANKOM) with the following exceptions: (1) Water bath
was conducted in a 20 L non-pressurized stainless steel water bath (VWR Scientific Model 1245) fitted with a 2 cm-thick
insulating lid. (2) Per batch (48 filter bags) 10 L NDS were used, 2.5 times the amount of solution needed to immerse bags in
the standard procedure. (3) The ratio of heat stable alpha-amylase to filter bags was equivalent to the standard procedure
(1 mL per 6 filter bags), but the concentration of amylase to NDS (0.8 mL per L NDS) was lower than the standard procedure
(2 ml per L NDS). Forty-eight samples were loaded in a 2-level stainless steel sandwich rack (Fig. 1), which was designed
to fit the interior dimensions of the water bath. The following materials were used to construct the rack: (1) Four sheets
of stainless steel type 304 welded wire cloth (0.2 cm thick wire) with 2.54 × 2.54 cm interior square gaps. The sheets were
4. 80 K.C. McRoberts, D.J.R. Cherney / Animal Feed Science and Technology 187 (2014) 77–85
cut to 44 × 26 cm to fit the interior water bath dimensions (49.5 × 29.2 × 15.2 cm). (2) Four stainless steel type 316 screws
(6.35 cm long, 0.635 cm diameter). (3) Flat washers: 32 stainless steel type 316 (3.8 cm outer diameter (OD), 0.635 cm inner
diameter, 0.127 to 0.203 cm thick) and 32 with 3.175 cm OD. (4) Twelve stainless steel type 316 thin hex nuts (0.635 cm
inner diameter). (5) Ten strips of stainless steel type 304 wire (33 cm long, 0.26 cm diameter). (6) Several packets of 9.7 cm
long heat tolerant nylon zip ties. (7) Heat tolerant nylon cord.
The rack was assembled and loaded according to the following steps:
(A) Two sheets of welded wire cloth (material 1) were prepared to hold filter bags for each level of the rack. Each sheet
was fitted with five strips of wire (material 5) oriented in parallel along the length of the welded wire cloth. The spacing
between each wire strip was slightly greater than 5.5 cm to permit filter bag movement and access to solution in the space
created between strips (ANKOM F57 filter bag dimensions = 5.0 × 5.5 cm). Each wire strip was attached to the welded
wire cloth using three zip ties (material 6) with tie ends clipped and turned to face away from the wire strips to avoid
interference with filter bags. Zip ties were added between each wire strip at an interval of two interior square gaps in the
welded wire sheet to maintain horizontal separation between filter bags. These zip tie ends were oriented perpendicular
to the face of the welded wire cloth and clipped at 2 cm to prevent horizontal movement of filter bags. The wire strips
and zip ties created a shallow pocket slightly larger than a single filter bag.
(B) Four screws (material 2) were fitted with a thin hex nut (material 4) tightened down to the head. A 3.175 cm OD flat
washer and a 3.8 cm OD flat washer (material 3) were added to the screw with the smaller OD washer facing the screw
head. Screws were inserted from below in each corner gap of one sheet of welded wire cloth (from step A). Screw heads
faced down and formed the base or “legs” of the rack. The square corner gaps in the welded wire cloth sheet rested on
the large OD flat washers. Two additional large OD flat washers were added to the screw after the welded wire sheet.
Their combined thickness was approximately equal to the diameter of the wire strips (material 5).
(C) Twenty-four filter bags were loaded in the pockets created by the wire strips and zip ties. Filter bags were oriented to
face the center of the rack (Fig. 1).
(D) One of the two welded wire sheets not prepared in step A was placed over the filter bags with care to ensure that the zip
tie ends remained perpendicular to the sheets and passed through the appropriate gaps in the upper sheet. The sheet
rested on the large OD washers added in step B, and on the wire strips. One large and one small OD flat washer were
then placed on each screw with the large OD washer facing the rack. The screw and rack were adjusted carefully and a
hex nut (material 4) was added to each screw (joint) and tightened to secure the lower level of the rack. A single zip tie
was added to further secure each outer long side of the rack to prevent filter bag escape.
(E) Five small OD washers and one large OD washer were added to each screw with the small OD washers resting on the hex
nut (from step D). These washers provided additional spacing for a total of approximately 2.54 cm between the lower
and upper levels of the rack. The second welded wire sheet prepared in step A was then added. It rested on the large OD
flat washer in each corner. Two additional large OD flat washers were added to each screw after the welded wire sheet.
Steps C and D were then repeated to finish preparation of the upper rack level. Protruding wire ends on one side of the
welded wire sheets were bent to accommodate a thermostat and thermometer in the water bath.
(F) Four pieces of heat tolerant nylon cord (material 7) were attached to the corners and short side of the loaded rack using
two zip ties at each attachment point. Cord purpose was to provide manual rack agitation in the water bath. Cord pieces
were fitted for quick attachment and ease in transfer through holes in the insulating lid to permit rack agitation in the
water bath without lid removal. The rack loading process required approximately 20 to 30 min per 48 filter bag batch.
VWR Scientific Model 1245 was pre-calibrated at 100 ◦C with the insulating lid. It required 2.5 h to heat 10 L ambient
temperature NDS to 100 ◦C. The insulating lid was then removed, 8 mL alpha-amylase were added, and the rack was quickly
inserted into solution by suspending and lowering it with the nylon cord. Approximately one minute of initial rocking
agitation was provided. The four pieces of nylon cord were then passed through pre-made holes in the insulating lid, and
the lid was quickly replaced. Four weights were added to secure the lid and a thermometer was inserted through the lid to
monitor temperature. The water bath temperature dropped to approximately 90 to 93 ◦C during the loading process, and
required 15 min to reheat to 100 ◦C. Thus, total time at 100 ◦C was 60 min of the 75 min extraction, equivalent to ANKOM
A200 units. During the extraction, samples were agitated in solution for one of every 5 min by manually rocking the rack
from front-to-back and side-to-side through the insulating lid using the attached nylon cord. The water bath was drained
using a 2.54 cm OD flexible PVC tube. Other components of the rinse sequence were identical to ANKOM. Continuous rocking
agitation was provided during rinse cycles. The rack unloading process required about 5 min per rack level. Bag removal,
acetone treatment, and drying processes did not differ from ANKOM.
Additional WB details including filter bag rack construction are available in the supplementary video (Supplementary
Video 1). During WB development process, numerous iterations were tested with the standard D. glomerata L. sample to
finalize the procedure before conducting the experiment. Criteria for success were identified (below).
2.3. Duplicate removal criteria
Based on within-laboratory variability in a collaborative study, Mertens (2002) reported that aNDF analyses in beakers
should be rerun if duplicate values differ by more than 2.9%, the repeatability or approximate 95% confidence interval for
5. K.C. McRoberts, D.J.R. Cherney / Animal Feed Science and Technology 187 (2014) 77–85 81
Table 2
Pre- and post-adjustment duplicate mean differences and repeatability for ANKOM and WB.
Pre-duplicate removal Post-duplicate removal
ANKOM WB ANKOM WB
n 196 196 190 191
Meana
(g aNDF/kg DM) 6.35 6.22 5.43 5.43
SDb
(g aNDF/kg DM) 6.86 6.54 4.20 3.72
SDr
c
(g aNDF/kg DM)) 6.60 6.38 4.85 4.65
Repeatabilityd
(g aNDF/kg DM) 18.48 17.85 13.58 13.01
n for mean comparison 196 186f
Pe
0.8189 0.7892
a
Absolute value of mean difference between duplicates.
b
Standard deviation of the mean difference between duplicates.
c
Repeatability standard deviation = ( di
2
/2L)0.5
, where di is the duplicate difference for sample i and L is the number of duplicate pairs (AOAC, 2002).
d
2.8 × SDr, the approximate 95% confidence interval for duplicate analyses in the laboratory for this study (AOAC, 2002; Mertens, 2003).
e
Two-tailed t test for paired mean difference between ANKOM and WB duplicate mean differences.
f
Different duplicates were removed for each procedure. Thus, n used in paired t test for mean differences was lower than post-duplicate removal n.
Table 3
Bivariate ANKOM vs. WB regression models for the whole dataset and individual sample classes.
Sample class n r2 RMSE
(g aNDF/kg DM)
Slope Intercept
b SEb Prob. b = 1 a SEa Prob. a = 0
Whole dataset 196 0.995 10.847 0.9963 0.0052 0.4828 −4.536 3.490 0.1953
C3 grasses 40 0.958 8.874 0.8532 0.0290 <0.0001 84.002 17.953 <0.0001
C4 grasses 122 0.988 8.151 0.9796 0.0100 0.0438 7.971 7.429 0.2854
Legumes 21 0.939 16.364 1.0532 0.0617 0.3996 −32.796 22.185 0.1557
Silages 13 0.902 11.760 1.0072 0.1002 0.9442 1.697 43.125 0.9693
C3 grasses without Oryza sativa L. straw 37 0.908 8.220 0.9410 0.0508 0.2533 31.312 30.765 0.3158
C4 grasses without Zea mays L. 118 0.973 7.882 1.0161 0.0158 0.3077 −19.651 11.842 0.0997
Legumes without Stylosanthes guianensis
(Aubl.) CIAT 184
20 0.812 16.477 0.9746 0.1105 0.8207 −6.149 38.171 0.8738
duplicates analyzed in a single laboratory (Mertens, 2003). Lower within-laboratory duplicate variability could be expected
using ANKOM filter bag methods based on lower standard deviations or standard errors for most forages and feedstuffs run
with ANKOM (Komarek, 1993; Vogel et al., 1999; Fay et al., 2005) versus conventional methods. Thus, ANKOM duplicates
and water bath duplicates differing by ≥21.0 g/kg were examined to identify erroneous individual aNDF duplicates (poor
filtration or open bag issues) based on case-by-case comparison to other duplicate values from both techniques and aNDF
concentrations for similar samples. All questionable individual duplicate values were removed. Total number of samples
was not impacted, because for each case the remaining duplicate was used in lieu of the duplicate mean for analysis.
2.4. Statistical methods
Simple and multiple linear regressions were undertaken in JMP® Pro 10.0.0 (SAS Institute Inc., Cary, NC) using the standard
least squares procedure. A bivariate model of ANKOM aNDF versus WB aNDF was constructed. Multivariate models were
also constructed to evaluate additional potential covariates (sample classification category and batch) and interactions. Two-
tailed t-tests were used to assess paired mean differences. Mean differences were considered statistically significant when
P < 0.05. Influential samples and outliers were analyzed using Cook’s distance measures and outlier box plots, respectively.
3. Results
Eleven total duplicates were removed from the dataset due to probable poor filtration or open bags by applying the
21.0 g/kg duplicate difference criterion explained above. Removed duplicates included: six ANKOM (three Zea mays L. silages,
one Medicago sativa L., and two Brachiaria Cv. Mulato II) and five WB duplicates (three M. sativa L. and two Z. mays L.
silages). Consequently, pre- and post-removal data for duplicate differences were analyzed separately (Table 2). Post-removal
duplicate mean differences and standard deviations were lower than pre-removal levels. Repeatability, a measure of within-
laboratory analytical precision based on variation in results for the same material exposed to similar treatment (e.g., duplicate
samples) (AOAC, 2002; Mertens, 2003), was also lower post-duplicate removal. Absolute value of duplicate differences was
not significantly different between ANKOM and WB based on a paired t test either before or after duplicate removal (Table 2).
The overall relationship between ANKOM and WB aNDF was strong and positive (Table 3). Intercept was not different
from zero and slope did not differ from unity (Table 3). Samples tended to group by sample classification category (C3 grasses,
C4 grasses, legumes, and silages) with several exceptions: (1) Oryza sativa L. samples had higher aNDF concentrations than
6. 82 K.C. McRoberts, D.J.R. Cherney / Animal Feed Science and Technology 187 (2014) 77–85
Table 4
ANKOM and WB descriptive statistics by sample type.
Species n Mean
differenceb
(%)
Pa
ANKOM aNDF
(g/kg DM)
WB aNDF
(g/kg DM)
Mean SD Mean SD
Whole set 196 −1.07 <0.0001 645.7 148.81 652.6 148.96
C3 grasses 40 −1.08 0.0007 610.4 42.70 616.9 48.98
Dactylis glomerata L. 11 0.24 0.5670 610.8 13.19 609.3 18.14
Elytrigia repens (L.) Desv. Ex Nevski 3 −0.78 0.4063 607.7 9.53 612.4 5.68
Festuca arundinacea Schreb. 3 −1.42 0.1256 632.7 15.73 641.6 9.66
Oryza sativa L. straw 3 −4.61 0.0293 726.8 28.06 760.3 19.24
Phalaris arundinacea L. 11 −0.52 0.1626 581.6 32.25 584.7 30.73
Phleum pratense L. 9 −1.93 0.0001 599.7 23.49 611.2 22.17
C4 grasses 122 −0.97 <0.0001 732.4 73.07 739.5 74.13
Andropogon gerardii Vitman 6 −0.31 0.0802 882.7 7.24 885.4 6.22
Brachiaria Cv. Mulato II 75 −1.26 <0.0001 729.2 23.55 738.4 21.90
Panicum maximum Jacq. (TD 58) 3 −0.32 0.0563 712.1 68.24 714.4 67.30
Panicum virgatum L. 26 −0.71 0.0004 762.5 46.35 768.0 47.33
Paspalum atratum Swallen 3 −1.11 0.2456 698.0 37.53 705.7 36.13
Pennisetum purpureum Schumach. 5 −0.43 0.2183 717.5 35.55 720.6 33.14
Zea mays L. 4 1.46 0.2555 429.5 18.71 423.2 18.67
Legumes 21 −4.09 0.0008 340.7 64.43 354.7 59.27
Lotus corniculatus L. 3 −0.62 0.8033 306.3 34.39 308.2 23.03
Medicago sativa L. 14 −6.27 0.0003 326.0 36.66 346.5 33.98
Stylosanthes guianensis (Aubl.) CIAT 184 1 0.91 – 573.7 – 568.5 –
Trifolium pratense L. 3 −0.53 0.4615 366.1 13.73 368.1 16.04
Silages 13 1.10 0.1523 433.9 35.93 429.1 33.88
Medicago sativa L. silage 3 0.85 0.2414 444.1 11.58 440.3 11.65
Zea mays L. silage 10 1.18 0.2428 430.9 40.58 425.8 38.03
a
Two-tailed paired t test for mean difference between ANKOM and WB.
b
Mean difference = ((ANKOM mean – WB mean)/ANKOM mean) × 100.
other C3 species, (2) Z. mays L. samples grouped more closely with silages and legumes than with other C4 grasses, and, (3)
Stylosanthes guianensis (Aubl.) CIAT 184 sample grouped with the bulk of C3 grasses. Numerical differences between ANKOM
and WB means broken down by species were low, although some paired mean differences were statistically significant
(Table 4).
Multivariate models predicting ANKOM aNDF were tested by adding additional covariates and interactions to the bivariate
relationship (ANKOM vs. WB). A processing batch effect was not detected (P = 0.2061). For multivariate models including sam-
ple classification, the categories were binary (e.g., silage = 1, all other categories = 0) and intercept was the overall intercept.
Sample classification was significant (P < 0.0001) and is described by the equation: ANKOM aNDF (g/kg DM) = 0.9722 × WB
aNDF−13.244 × legume + 7.531 × silage + 1.413 × C3 grass + 4.300 × C4 grass + 9.184. The sample classification by WB aNDF
interaction effect was also significant (P = 0.0003). Separate bivariate regression equations were generated by sample class
to simplify interpretation of this interaction (Table 3). Slopes did not differ from unity except for C3 grasses and C4 grasses.
The only intercept differing from zero was C3 grasses.
These outcomes may be strongly impacted by influential samples and outliers, which were evaluated for each sam-
ple class using an outlier box plot and Cook’s distance measures. Influential samples based on Cook’s distance measures
greater than 0.4 in decreasing order included: the S. guianensis (Aubl.) CIAT 184 sample, one O. sativa L., one Z. mays L.,
and one Z. mays L. silage. Outlier analysis identified the S guianensis (Aubl.) CIAT 184 sample, all O. sativa L. samples, two
Z. mays L. silages (not including the influential sample), and numerous C4 grasses including: all four Z. mays L. samples,
one Panicum maximum Jacq. (TD 58), all Andropogon gerardii Vitman, and four Panicum virgatum L. samples. Extreme out-
liers included all Z. mays L. samples, all O. sativa L. samples, and the S. guianensis (Aubl.) CIAT 184 sample. The extreme
outliers group included all influential samples except the silage. This was consistent with species that did not group
with others in their sample class (above). Therefore, these species were excluded from their respective sample classes,
and the ANKOM–WB bivariate regressions were reevaluated (Table 3). Coefficient of determination decreased in all cases
when these species were excluded. Root mean square error (RMSE) decreased for C3 and C4 grasses, and increased for
legumes. Slopes did not differ from unity and intercepts did not differ from zero. Influential samples were not detected
when the same Cook’s distance measures cutoff was applied to the full dataset bivariate model with pooled samples
classes.
Mean differences were not detected in WB for filter rack level (upper or lower) (P = 0.7822) or in ANKOM for processing unit
(P = 0.6514). ANKOM blank bag correction factor mean (0.9984 with SD ± 0.0015) was higher than WB blank bag correction
factor (0.9960 ± 0.0004) (P < 0.0001, n = 18). The D. glomerata L. standard was higher for ANKOM (603.2 ± 3.6 g aNDF/kg
DM) than WB (600.2 ± 3.8 g aNDF/kg DM) (P = 0.0025, n = 18), although the numerical difference was low (0.49% of ANKOM
standard mean).
7. K.C. McRoberts, D.J.R. Cherney / Animal Feed Science and Technology 187 (2014) 77–85 83
4. Discussion
Cost savings of WB over ANKOM consist of the initial investment in ANKOM processing units. Potential WB limitations
include processing time, labor, and required NDS. Additional processing time (as compared to ANKOM processing with two
A200 units) is required to complete a 48 filter bag aNDF extraction due to delays in heating NDS (dependent on water bath
model) and for loading and unloading samples in the stainless steel rack. Labor requirement for WB during extraction is
higher than ANKOM, because manual agitation must be provided, an approximate 30 min difference during each extraction
and rinse cycle. Rack loading introduces another 20 to 30 min delay for WB. Impact of labor differences could be low in
developing country laboratories.
Time differential noted above could be mitigated or shifted in favor of WB by adding additional vertical levels to the
stainless steel rack. Our rack contained two levels with 24 filter bags each (Fig. 1) to facilitate parallel processing with two
ANKOM A200 machines. Space remained in the WB rack for four additional bags on each level (two on either side). VWR
Scientific Model 1245 water bath depth would easily accommodate four vertical levels, thus permitting up to 112 filter bags
per batch processed with approximately 16 to 18 L NDS (1.7 to 2 times the amount of NDS required by ANKOM).
Chemical costs could become a limitation of the technique for high throughput laboratories. Other water bath or rack
designs may permit more economical use of NDS. Pereira et al. (2009) used a metallic basket to submerge 60 samples
per batch in a shaker water bath at 99 ◦C. No significant differences between their method and ANKOM were detected for
ryegrass, rye, or oats samples (overall ANKOM mean = 313.3 with SE ± 3.8 g NDF/kg DM). However, samples with greater
filtration issues (e.g., corn silages) could be problematic with many filter bags submerged loosely en masse in a metal basket.
Collection and reuse of NDS may be a possibility, especially for NDS from batches with high mean NDF concentration.
In an oven NDF technique test, Chai and Udén (1998) reported that NDS as low as 25% of the strength recommended
by Van Soest et al. (1991) would be adequate for most sample classes. Recycling expensive reagents such as sodium lauryl
sulfate, ethylenediaminetetraacetic acid, and acetone could further economize NDF analyses (Van Soest and Robertson, 1985
Laboratory Manual for Animal Science 613 at Cornell University: Analysis of forages and fibrous foods), possibly offsetting
differences in NDS volume requirements.
Modifications to the ANKOM NDF procedure described here should have no negative impact on overall results. Sodium
sulfite was not added (reasons described above). Sample size has been implicated as an important factor in conventional NDF
analyses (Cherney et al., 1985). Sample size reduction from 0.5 to 0.25 g was implemented to improve filtration by decreasing
potential for within-bag sample agglomeration, particularly with starch-containing samples (Cherney et al., 1989). Neutral
detergent fiber has been determined successfully using very small sample size, from 10 to 50 mg (Pell and Schofield, 1993).
After removal from acetone, samples were dried at 105 ◦C, instead of the 102 ◦C indicated in the ANKOM procedure, because
lower average bias was reported at this temperature using National Forage Testing Association Method 2.2.2.5 compared to
other common DM methods (Thiex, 2008).
Repeatability of duplicates for ANKOM and WB (Table 2) was numerically lower than aNDF within-laboratory repeatability
in a collaborative study (Mertens, 2002). This difference can probably be attributed to batch processing with filter bags, which
helps reduce technician error and provides more consistent treatment of duplicate samples. Furthermore, repeatability was
numerically lower for WB than ANKOM (Table 2), suggesting that in our laboratory with a single equipment operator, WB
precision did not differ from ANKOM precision. Operator conscientiousness is important to achieving acceptable precision
with WB, because the technique is less automated than ANKOM.
Numerical magnitude of aNDF mean differences between ANKOM and WB was generally low (Table 4), and potentially
inconsequential relative to other sources of variation in gravimetric techniques (e.g., within sample variation, DM measure-
ment, weighing inconsistencies, desiccator use, and sample size) (Mertens, 2003). For most purposes, WB sample deviations
of ± 20 g aNDF/kg DM from the standard technique would fall within acceptable levels (Table 4). Only 11 of 196 individ-
ual samples (5.6%) exceeded this threshold. However, certain sample types exhibited significant aNDF mean differences
between techniques (Table 4). For example, M. sativa L. and O. sativa L. WB means were higher than ANKOM (Table 4), and
the overall bivariate regression equation (Table 3) slightly overestimated ANKOM aNDF concentration for these samples. In
these cases, pressurization and agitation differences between techniques may affect filtration. There was also a significant
mean difference between ANKOM and WB for D. glomerata L. standards, but it was numerically low and consistent with
other D. glomerata L. samples in direction and magnitude of deviation from ANKOM (Table 4).
The impact of slightly greater deviation from ANKOM for some sample types would depend on desired laboratory accuracy.
Goering and Van Soest (1970) reported that samples containing high “starch, protein, or other mucilaginous materials” are
more likely to cause NDF filtration issues. Starch content in M. sativa L. and O. sativa L. samples was probably low, and
unlikely to be associated with observed differences since mean differences were not detected for samples likely to be high
in starch (e.g., Z. mays L. and Z. mays L. silages) (Table 4). Protein content in M. sativa L. was probably higher than most other
species analyzed, and may have contributed to higher aNDF values in WB. However, a mean technique difference was not
observed for M. sativa L. silages. O. sativa L. straw samples were probably high in NDF and silica, and low in protein (Van Soest,
2006). Relative to other straws, they would also be low in lignin. These typical characteristics of O. sativa L. straw should not
impact filtration. Thus, possible reasons behind the ANKOM–WB aNDF discrepancy for these samples are not known. Mean
differences for these species were still below 7% of the ANKOM aNDF mean. The impact on overall WB aNDF ranking of these
samples compared to other similar samples would be minimal. Thus, even for species with greater differences between
ANKOM and WB aNDF values, the practical significance may be low.
8. 84 K.C. McRoberts, D.J.R. Cherney / Animal Feed Science and Technology 187 (2014) 77–85
The statistical significance of the sample classification effect and its interaction with WB aNDF in a multivariate model
implicated alternative regression intercepts and slopes based on sample classification. Maximum difference from the overall
intercept in a model without the interaction effect was for legumes (−13.244 g aNDF/kg DM). Interaction assessment via
bivariate ANKOM–WB models by sample class indicated the greatest slope difference from the whole dataset regression for
the C3 grass model (Table 3). C3 grasses were the only sample class in which slope and intercept differed from unity and
zero, respectively. Significant slope and intercept differences were no longer detected after exclusion of extreme outliers
and influential samples (all Z. mays L., all O. sativa L., and the S. guianensis (Aubl.) CIAT 184). Notably, Z. mays L. samples
(C4) were grown in a temperate environment, O. sativa L. samples (C3) were grown in a tropical environment, and the S.
guianensis (Aubl.) CIAT 184 sample was the only legume grown in a tropical environment. Thus, sample class by environment
interactions may have contributed to these species not grouping well with others in their class. Furthermore, based on
strength of the overall WB–ANKOM relationship (Table 3, whole dataset) and the lack of influential samples, unique intercepts
and slopes by sample classification may not be necessary.
Several additional criteria were identified for WB success. First, the water bath unit must deliver uniform 100 ◦C heat
throughout the solution in order to achieve consistent within and across-batch aNDF results. Samples should also be exposed
to 100 ◦C temperatures for the same amount of time as A200 units (1 h). Water bath calibration using an insulating lid is
necessary for accurate temperature control. Lid removal should be avoided during the extraction to prevent rapid heat
loss and temperature fluctuations. Filter bag rack materials must be robust and not interact with boiling NDS. Stainless
steel (type 304 or 316) is suggested, although heat-resistant plastic could be considered (polyketone-type plastic). Typical
plastics (e.g., polyvinyl chloride) are not viable, because they reach the glass transition point below boiling. Regardless of
rack material, design should provide individual filter bags with consistent separation and ample NDS access to improve the
odds of successful filtration.
5. Conclusions
The water bath filter bag technique proposed in this paper generated aNDF concentrations and repeatability that were
consistent with the ANKOM Technology standard method for a variety of forages and silages. The method could be a viable
alternative to ANKOM for low-budget laboratories.
Acknowledgments
The authors thank Dr. J.H. Cherney for discussions and laboratory support in the development and execution of this
technique test, Dr. P.J. Van Soest for preliminary discussions leading to the development of the technique, and Ken Paddock
for assistance with sample collection and materials.
Appendix A. Supplementary data
Supplementary data associated with this article can be found, in the online version, at http://dx.doi.org/10.1016/
j.anifeedsci.2013.09.007.
References
ANKOM Technology, 2011. Method 6, 4/13/11: Neutral Detergent Fiber in Feeds Filter Bag Technique (For A200, A200I). Ankom Technology, Macedon, NY,
Accessed March 20, 2013 from http://www.ankom.com/media/documents/Method 6 NDF 4013011 A200,A200I.pdf .
AOAC, 2002. AOAC Official Methods of Analysis, 15th ed. Association of Official Analytical Chemists, Arlington, VA.
Chai, W.H., Udén, P., 1998. An alternative oven method combined with different detergent strengths in the analysis of neutral detergent fibre. Anim. Feed
Sci. Technol. 74, 281–288.
Cherney, D.J.R., Patterson, J.A., Cherney, J.H., 1989. Use of 2-ethoxyethanol and ␣-amylase in the neutral detergent fiber method of feed analysis. J. Dairy
Sci. 72, 3079–3084.
Cherney, J.H., Volenec, J.J., Nyquist, W.E., 1985. Sequential fiber analysis of forage as influenced by sample weight. Crop Sci. 25, 1113–1115.
Fay, J., Guaita, M., Danelón, J., Chifflet, S., Wawrzkiewicz, M., Fernández, H., Ross, D., 2005. Evaluation of two procedures to determine acid and neutral
detergent fibers in ruminant feeds of the temperate region of Argentina. J. AOAC Int. 88, 995–997.
Ferreira, G., Mertens, D., 2007. Measuring detergent fibre and insoluble protein in corn silage using crucibles or filter bags. Anim. Feed Sci. Technol. 133,
335–340.
Giger-Reverdin, S., 1995. Review of the main methods of cell wall estimation: interest and limits for ruminants. Anim. Feed Sci. Technol. 55, 295–334.
Goering, H.K., Van Soest, P.J., 1970. Forage fibre analyses (apparatus, reagents, procedures, and some applications). In: Agriculture Handbook No. 379.
Agricultural Research Service, USDA, Washington, DC, pp. 20.
Hintz, R.W., Mertens, D.R., Albrecht, K.A., 1996. Effects of sodium sulfite on recovery and composition of detergent fiber and lignin. J. AOAC Int. 79, 16–22.
Komarek, A., 1993. A filter bag procedure for improved efficiency of fiber analysis. J. Dairy Sci. 76 (Suppl. 1), 250, Abstract P309.
Komarek, A., 1994. Fiber analysis system. In: US Patent 5,370,007.
Mascarenhas Ferreira, A., Kerstens, J., Gast, C., 1983. The study of several modifications of the neutral detergent fibre procedure. Anim. Feed Sci. Technol. 9,
19–28.
Mertens, D.R., 2002. Gravimetric determination of amylase-treated neutral detergent fiber in feeds with refluxing in beakers or crucibles: collaborative
study. J. AOAC Int. 85, 1217–1240.
Mertens, D.R., 2003. Challenges in measuring insoluble dietary fiber. J. Anim. Sci. 81, 3233–3249.
Pell, A.N., Schofield, P., 1993. Computerized monitoring of gas production to measure forage digestion in vitro. J. Dairy Sci. 76, 1063–1073.
Pereira, A., Bungenstab, E., Lin, J., Schmidt, S., 2009. Water bath method for measuring NDF and ADF. J. Dairy Sci. 92 (E-Suppl. 1), 475, Abstract W298.
9. K.C. McRoberts, D.J.R. Cherney / Animal Feed Science and Technology 187 (2014) 77–85 85
Robertson, J., Van Soest, P., 1981. The detergent system of analysis and its application to human foods. In: James, W., Theader, O. (Eds.), The Analysis of
Dietary Fiber in Food. Marcel Dekker, Inc, New York, pp. 123–158.
Thiex, N., 2008. Evaluation of analytical methods for the determination of moisture, crude protein, crude fat, and crude fiber in distillers dried grains with
solubles. J. AOAC Int. 92, 61–73.
Undersander, D., Mertens, D.R., Thiex, N., 1993. Forage Analyses Procedures. National Forage Testing Association, Omaha, NE, Accessed March 25, 2013
from http://www.foragetesting.org/index.php?page=lab procedures .
Van Soest, P., Wine, R., 1967. Use of detergents in the analysis of fibrous feeds, IV. Determination of plant cell-wall constituents. J. Assoc. Off. Agric. Chem.
50, 50–55.
Van Soest, P.J., 1994. Nutritional Ecology of the Ruminant. Comstock Pub, Ithaca.
Van Soest, P.J., Robertson, J.B., Lewis, B.A., 1991. Methods for dietary fiber, neutral detergent fiber, and nonstarch polysaccharides in relation to animal
nutrition. J. Dairy Sci. 74, 3583–3597.
Van Soest, P.J., 2006. Rice straw, the role of silica and treatments to improve quality. Anim. Feed Sci. Technol. 130, 137–171.
Vogel, K., Pedersen, J., Masterson, S., Toy, J., 1999. Evaluation of a filter bag system for NDF, ADF, and IVDMD forage analysis. Crop Sci. 279, 276–279.