Download to read offline
![FDI as A Source of External Finance to Developing Countries: A Special Reference to India ….
DOI: 10.9790/487X-17117381 www.iosrjournals.org 79 | Page
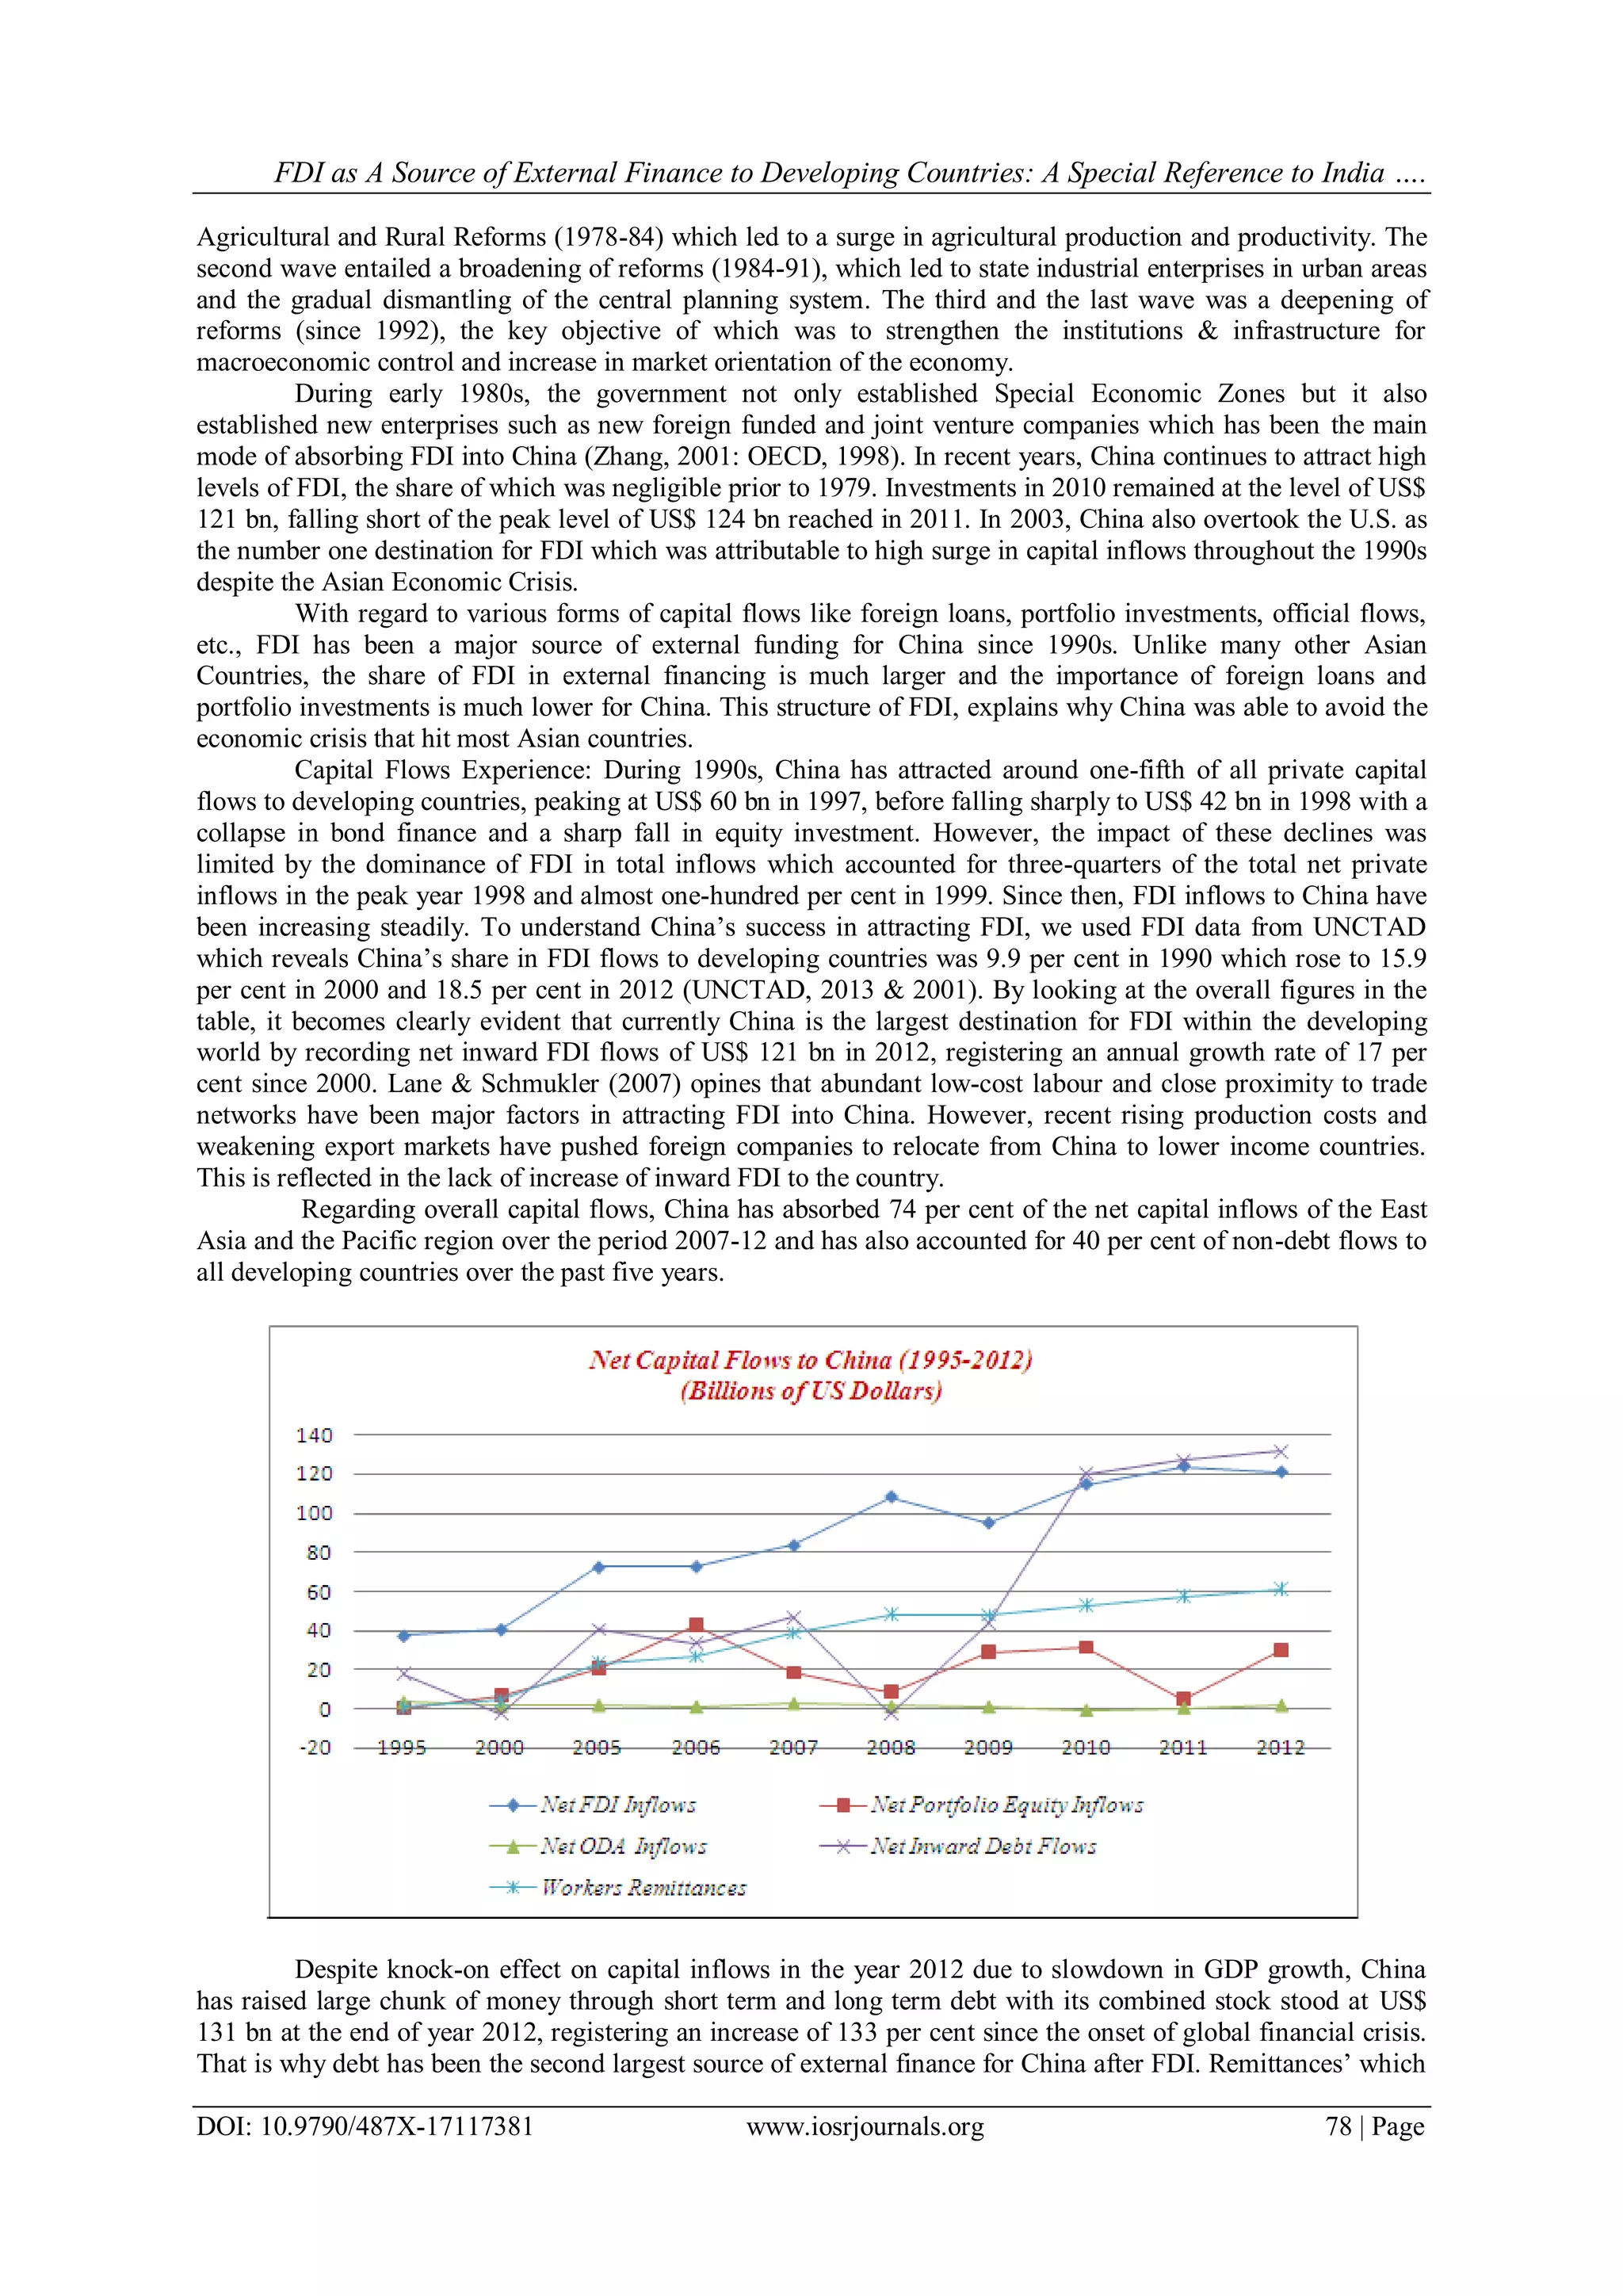
constitute one-third of net total private capital flows into the developing countries have also emerged as the third
most important type of private external finance to China after FDI and debt. In the year 2012, China has
recorded Workers‘ Remittance of US$ 61.1 bn, with an annual growth rate of 24 per cent over the seven year
period since 2005. On the basis of facts & figures presented in the Table (C), we can conclude that China has
shown more reliance on FDI as a source of external finance among the various forms of private capital flows,
whereas debt and Workers‘ Remittances have been the second & third most external sources of finance for
development.
VI. Discussion, Summary and Conclusion
Over the past several years, international capital flows to developing countries have been characterised
by extreme volatility. The collapse in capital flows during the global financial crisis was followed by a renewed
surge in inflows in 2010. Overall, the latest figures indicate that net private and official capital flows to
developing countries amounted to US$ 1121 bn in 2012 and are forecasted to total about US$ 1200 bn in 2013.
Looking at the structure of various forms of capital flows, official capital flows (ODA) used to be the main
important source of foreign finance to developing countries during early 1990s, whereas bank lending remained
subdued. During this period, total net official inflows amounted to an average of US$ 27 bn per year, whereas
net private capital flows were recorded at an average of US$ 14 bn per year. But as soon the Asian crisis erupted
in 1997, there was a sharp downward contraction in total capital flows except FDI. While looking at the
development of individual categories of capital flows to developing countries, it is striking that FDI not only
increased but has also remained the major source of external finance for developing countries since 2000.
Available data indicates that net FDI inflows increased from US$ 166 bn in 2000 to about US$ 612 bn in 2012,
an increase of 269 per cent since 2000, contributing on an average more than half of net private and official
flows to developing countries. The reasons for the higher magnitude of FDI might be linked to several factors
which contributed to this rapid growth, including the deregulation of financial markets in industrialised
countries, the important advances made in information and communication technologies and the move towards
economic liberalisation in the developing world. After FDI, Workers‘ Remittances have become an increasingly
important and second most source of external development finance for developing countries both in absolute
terms and relative to other sources of external finance. Remittances rose steadily in the 1990s, reaching more
than US$ 180 bn in 2000 and further increased to US$ 348 bn in 2012. Compared to other sources of private
capital flows, Workers‘ Remittances have been the most stable source of external finance to developing
countries after FDI and unlike foreign aid, they are not a burden on public budget.
Regarding the country experiences of India and China, both are presenting a completely contrasting
picture with regard to the structure of external financing. While China shown more reliance on FDI which has
been the largest source of external finance for it. Unlike many other Asian countries, the share of FDI in external
financing is much larger to China and the importance of foreign loans and portfolio investments is much
smaller. This becomes clearly evident from the fact that China overtook US as the number one destination for
FDI in the year 2003 and also remained a major global recipient of foreign capital since then. On the other hand,
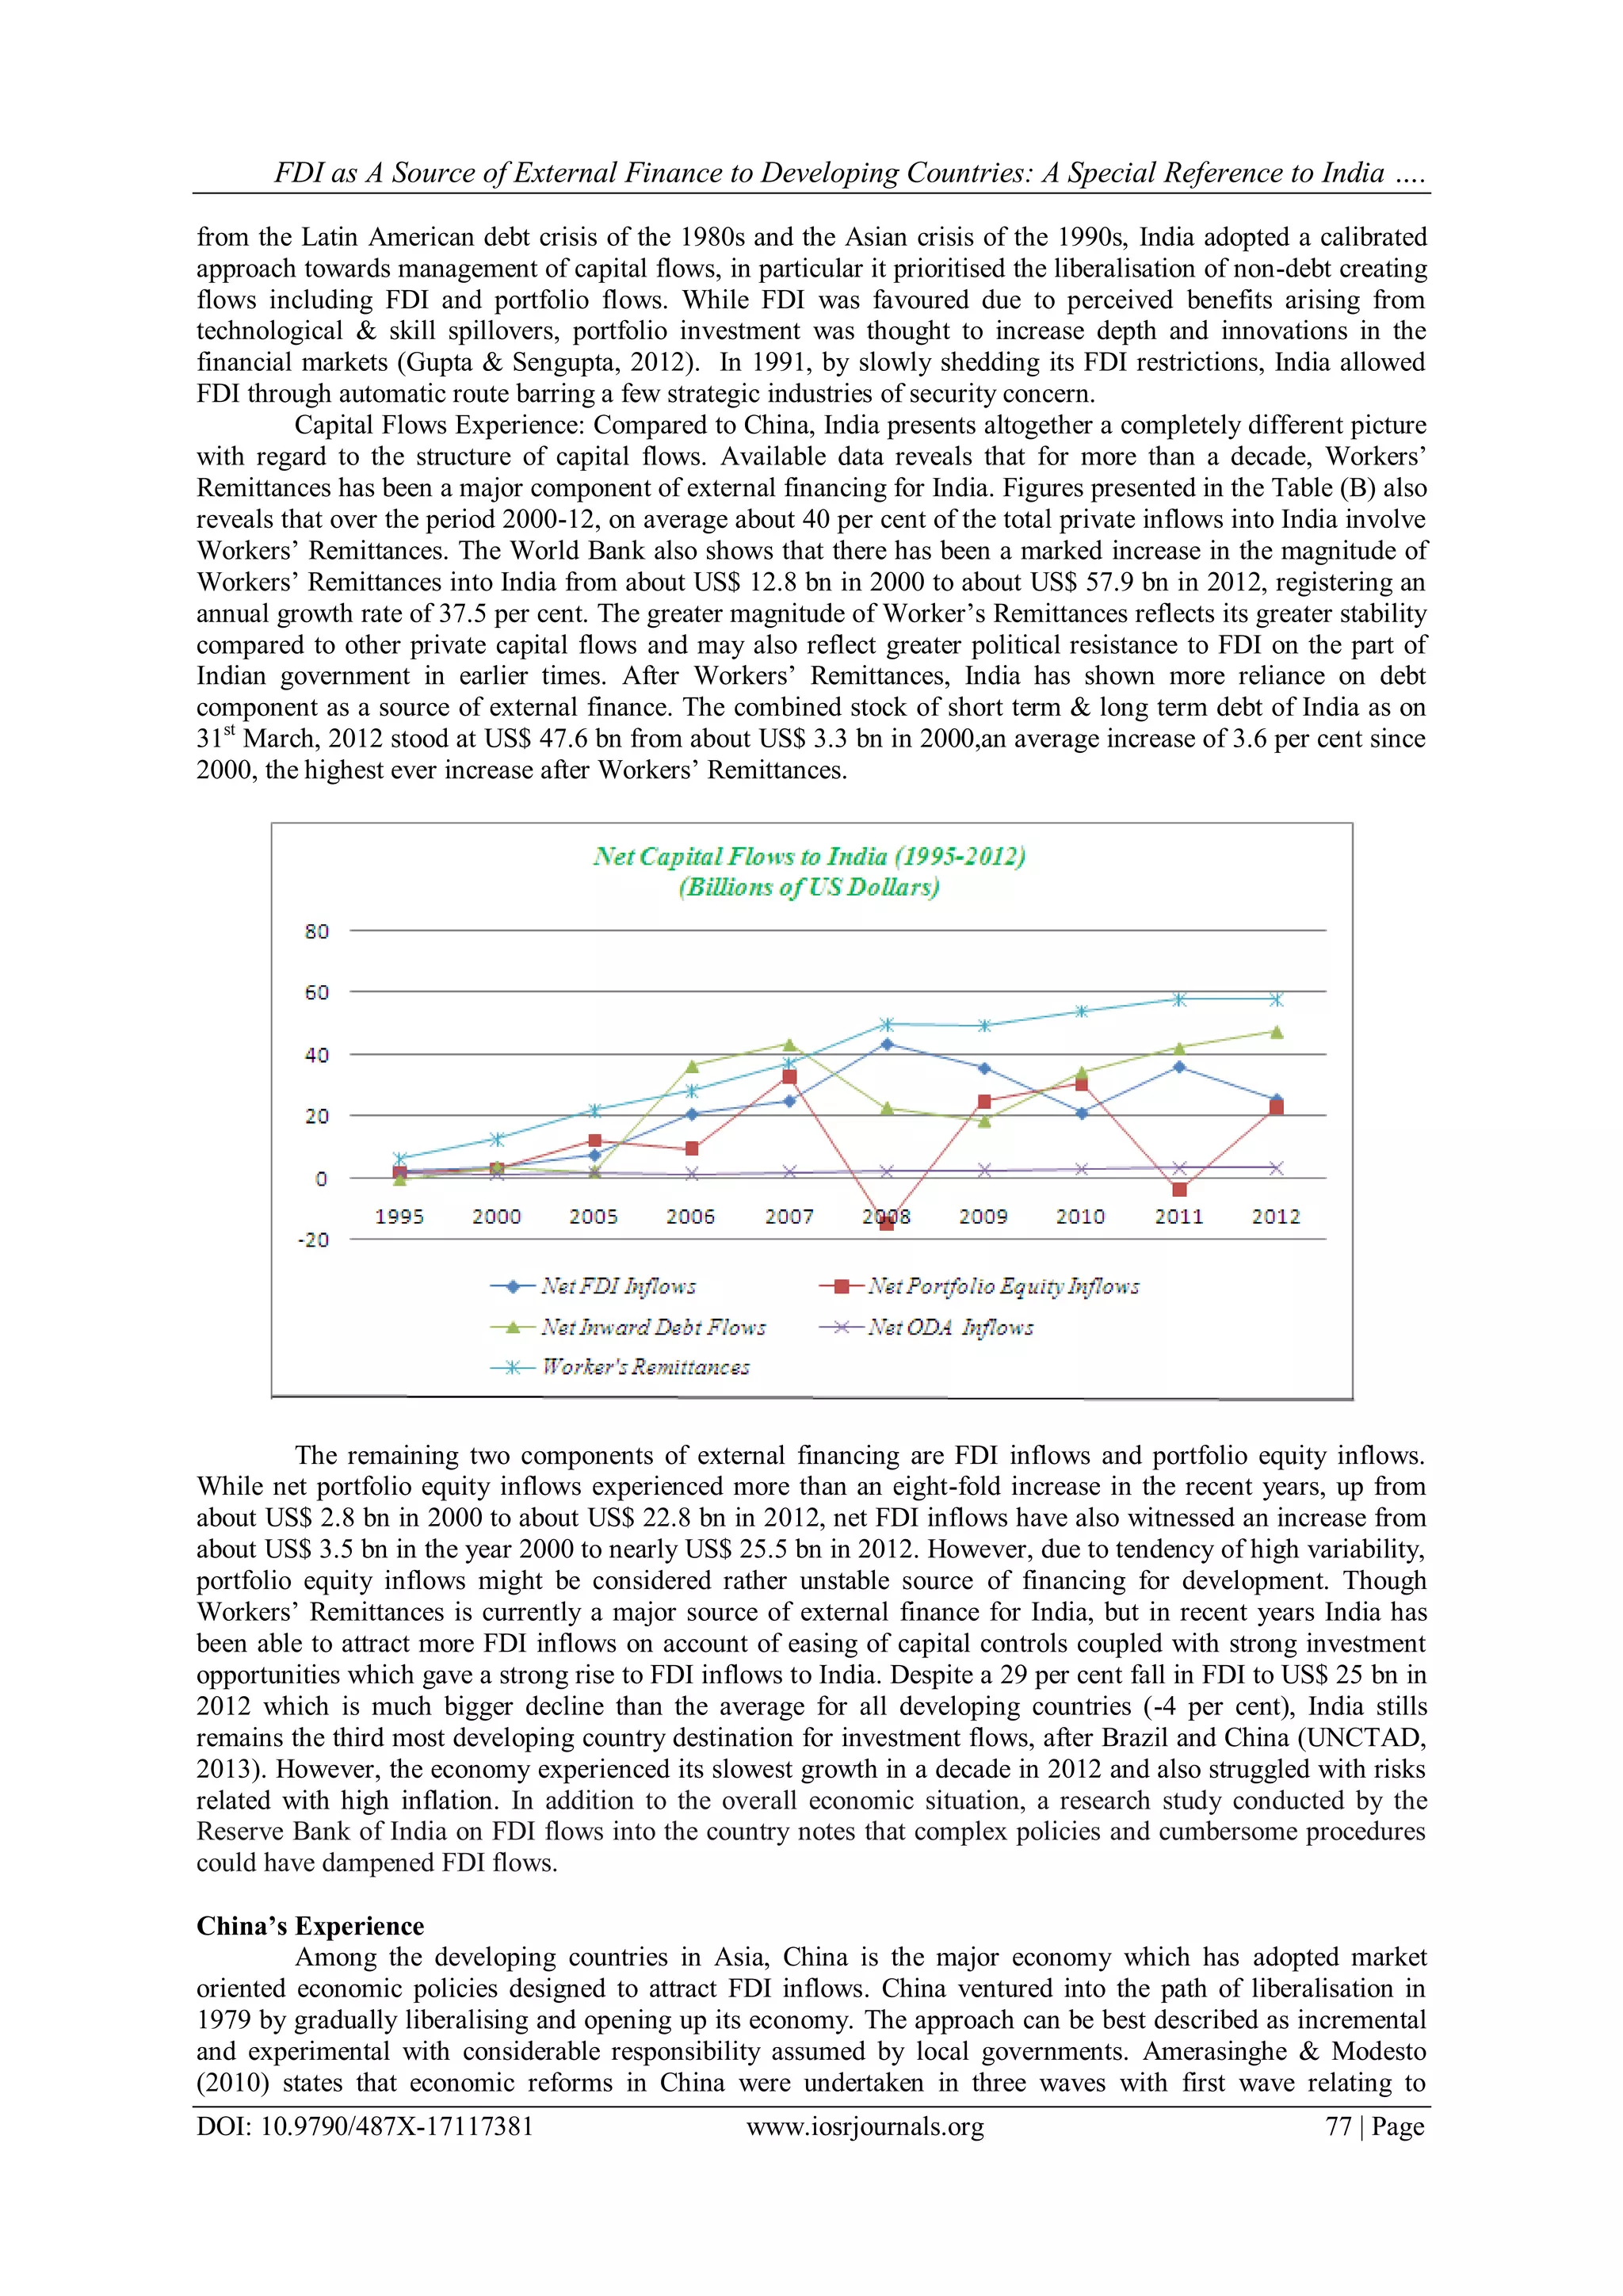
for India Workers ‗Remittances has been the major component of external financing for more than a decade.
The marked increase in Workers‘ Remittances from about US$ 12.8 bn in 2000 to about US$ 57.9 bn in 2012
with an annual average growth rate of 37 per cent makes it to the top of the structure of external financing for
India. The reason for higher magnitude of Workers‘ Remittances is reflected in its greater stability and may also
reflect greater political resistance to FDI on the part of Indian government in early times. Despite attracting
large amount of FDI inflows in recent years and despite being the third most developing country destination for
investment flows, debt component still accounts for the second largest source of external finance for India. To
conclude, both countries have shown more reliance on FDI as an external source of finance to boost domestic
investment & both are vying with each other to attract more and more FDI inflows.
References
[1]. Amerasinghe, N. & Modesto, J. (2011). Foreign Direct Investment in Asia: Lessons of Experience, Asian Institute of Management
(AIM), Working Paper 12-003.
[2]. Amerasinghe, N., and Espejo, M. (2006). Losing the Lead Role: Has Private Capital Flows Edged Out ODA? Centre for
Development Management, Asian Institute of Management: Nunnenkamp, P. (2001). Foreign Direct Investment in Developing
Countries: What Policymakers Should Not Do and What Economists Don‘t Know. Institute for World Economics, Kiel Discussion
Papers 380. Kiel.
[3]. Bajpai, N. and Dasgupta, N. (2003). Multinational Companies and Foreign Direct Investment in India and China, Columbia Earth
Institute, Columbia University.
[4]. Balasubramanyam, V.N., Salisu, M. and Sapsford, D. (1996). Foreign Direct investment and Growth in EP and IS Countries,
Economic Journal, 106(434), 92-105.
[5]. Bhattacharyya, B. & Palaha, S. (1996). Foreign Direct Investment in India: Facts and Issues, Indian Institute of Foreign Trade, New
Delhi.
[6]. Chen, C., Chang, L. & Zhang, Y. (1995). The Role of Foreign Direct Investment in China‘s Post-1978 Economic Development,
World Development 23(4), 691-73.](https://image.slidesharecdn.com/l017117381-151126042942-lva1-app6892/75/FDI-as-A-Source-of-External-Finance-to-Developing-Countries-A-Special-Reference-to-India-and-China-7-2048.jpg)
![FDI as A Source of External Finance to Developing Countries: A Special Reference to India ….
DOI: 10.9790/487X-17117381 www.iosrjournals.org 80 | Page
[7]. Chunlai, C. (1997). The Composition and Locational Determinants of Foreign Direct Investment in China‘s Manufacturing,
Working Paper, Chinese Economies Research Centre, University of Adelaide, Australia.
[8]. Deutsche BundesBank (2003). The role of FDI in Emerging Market Economies Compared to other forms of Financing: Past
developments & Implications for Financial Stability, International Relations Department, Frankfurt.
[9]. Gabriele, et al. (2000). Instability and Volatility of Capital Flows to Developing Countries, World Economy 23, 1031-1056.
[10]. Gupta, A.S. & Sengupta, R. (2012). Management of Capital Flows in India: 1990-2011.
[11]. Hernandez, L. & Rudolph, H. (1995). Sustainability of Private Capital Flows to Developing Countries, World Bank Policy Research
Working Paper 1518.
[12]. Huang, Y. (2001). Why more is actually less: new interpretations of China‘s labor-intensive FDI. Available at http://eres.bus.umich.
Edu/docs/workpap-dav/wp375.pdf.
[13]. IMF (2013a). Annual Report 2013. Promoting a More Secure & Stable Global Economy, International Monetary Fund.
[14]. IMF (2013b). World Economic Outlook: Hopes, Realities & Risks, International Monetary Fund, Publication Services, Washington
DC.
[15]. International Monetary Fund (2010a) Research Department‘s paper, February, Washington D.C.
[16]. International Monetary Fund (2010b) World Economic Outlook -Recovery, Risk and Rebalancing, Washington D.C.
[17]. Jones, S.G. & Leape, J. (2002). Capital Flows to Developing Countries: Does the Emperor Have Clothes? QEH Working Paper
Series 89 (QEHWPS89).
[18]. Kapur, D. (2003). Remittance: The New Development Mantra? Paper Prepared for the G-24 Technical Group Meeting.
[19]. Kregel, J. (2004). External Financing for Development and International Financial Instability, United Nations Conference on Trade
and Development, G-24 Discussion Paper Series.
[20]. Lahdhiri, M. & Hammas, M.A. (2012). The Effectiveness of External Financing Sources on Economic Growth: Case of the
Developing Countries of the MENA Region, Interdisplinary Journal of Contemporary Research in Business, Vol. 3, No. 9.
[21]. Lane, P.R. & Schmukler, S.L. (2007). The International Financial Integration of China and India, World Bank Policy Research
Working Paper 4132.
[22]. Lane, P.R. & Schmukler, S.R. (2007). The Evolving Role of China and India in the Global Financial System, Springer Publications.
[23]. Mohan, R. (2009). Capital Flows to India. Bank of International Settlements (BIS), Working Paper No. 44.
[24]. Nolan, P. (1995). Politics, Planning and the Transition from Stalinism: The Case of China, in Ha-Joon Chang and Robert Rowthorn
(Edi.) Role of State in Economic Change, Oxford: Oxford University Press.
[25]. Nunnenkemp, P. (2003). FDI as a Source of Finance for Development, CUTS Centre for International Trade, Economics and
Environment.
[26]. OECD (2002). New Horizons for Foreign Direct Investment, OECD Global Forum on International Investment, Paris.
[27]. Prime, P.B., Subramanyam, V. and Lin, C.M. (2012). Competitiveness in India and China: The FDI Puzzle. Asia Pacific Business
Review, Vol. 18, No. 3, PP. 303-333.
[28]. RBI (2013). Handbook of Statistics on Indian Economy 2012-13, Reserve Bank of India, Mumbai, India.
[29]. Siddiqui, K. (2014). Flows of Foreign Capital into Developing Countries: A Critical Review, Journal of International Business and
Economics, Vol. 2, No. 1.
[30]. Singh, S. (2009). Foreign Capital Flows into India: Compositions, Regulations, Issues and Policy Options, Journal of Economics
and International Finance, Vol. 1(1), Pp. 014-029.
[31]. Sun, X. (2002). Foreign Direct Investment and Economic Development: What Do the States Need to Do? Paper prepared by the
Foreign Investment Advisory Service (FIAS) for the Capacity Development Workshop (10-13, Dec.) held in Marrakech, Morocco,
Sponsored by the United Nations.
[32]. UN (2002). Final Outcome of the International Conference on Financing for Development, United Nations, New York,
(http://www.un.org/esa/ffd/0302finalmonetaryconsensus.pdf)
[33]. UNCTAD (2001), World Investment Report 2001: Promoting Linkages, Geneva, Switzerland.
[34]. UNCTAD (2010). World Investment Report 2010: Investing in a Low Carbon Economy, United Nations Conference on Trade and
Development: Geneva, Switzerland.
[35]. UNCTAD (2011). Foreign Direct Investment in LDCs: Lessons Learned from the Decade 2001-2010 and the Ways Forward.
United Nations Conference on Trade and Development: Geneva, Switzerland.
[36]. UNCTAD (2013a). Handbook of Statistics, United Nations Conference on Trade and Development, New York & Geneva,
Switzerland.
[37]. UNCTAD (2013b). World Investment Report 2013. Global Value Chains: Investment and Trade for Development, New York &
Geneva, Switzerland.
[38]. World Bank (2005). International Debt Statistics 2005, International Bank for Reconstruction and Development, Washington, D.C.
[39]. World Bank (2013). International Debt Statistics 2013, International Bank for Reconstruction and Development, Washington DC,
20433.
[40]. World Bank (2014). International Debt Statistics 2014, International Bank for Reconstruction and Development, Washington, D.C.
[41]. Zhang, K. H. (2001). How does foreign direct investment affect economic growth in China? Economics of Transition, 9(3), 679–
693.
Appendix Statistics
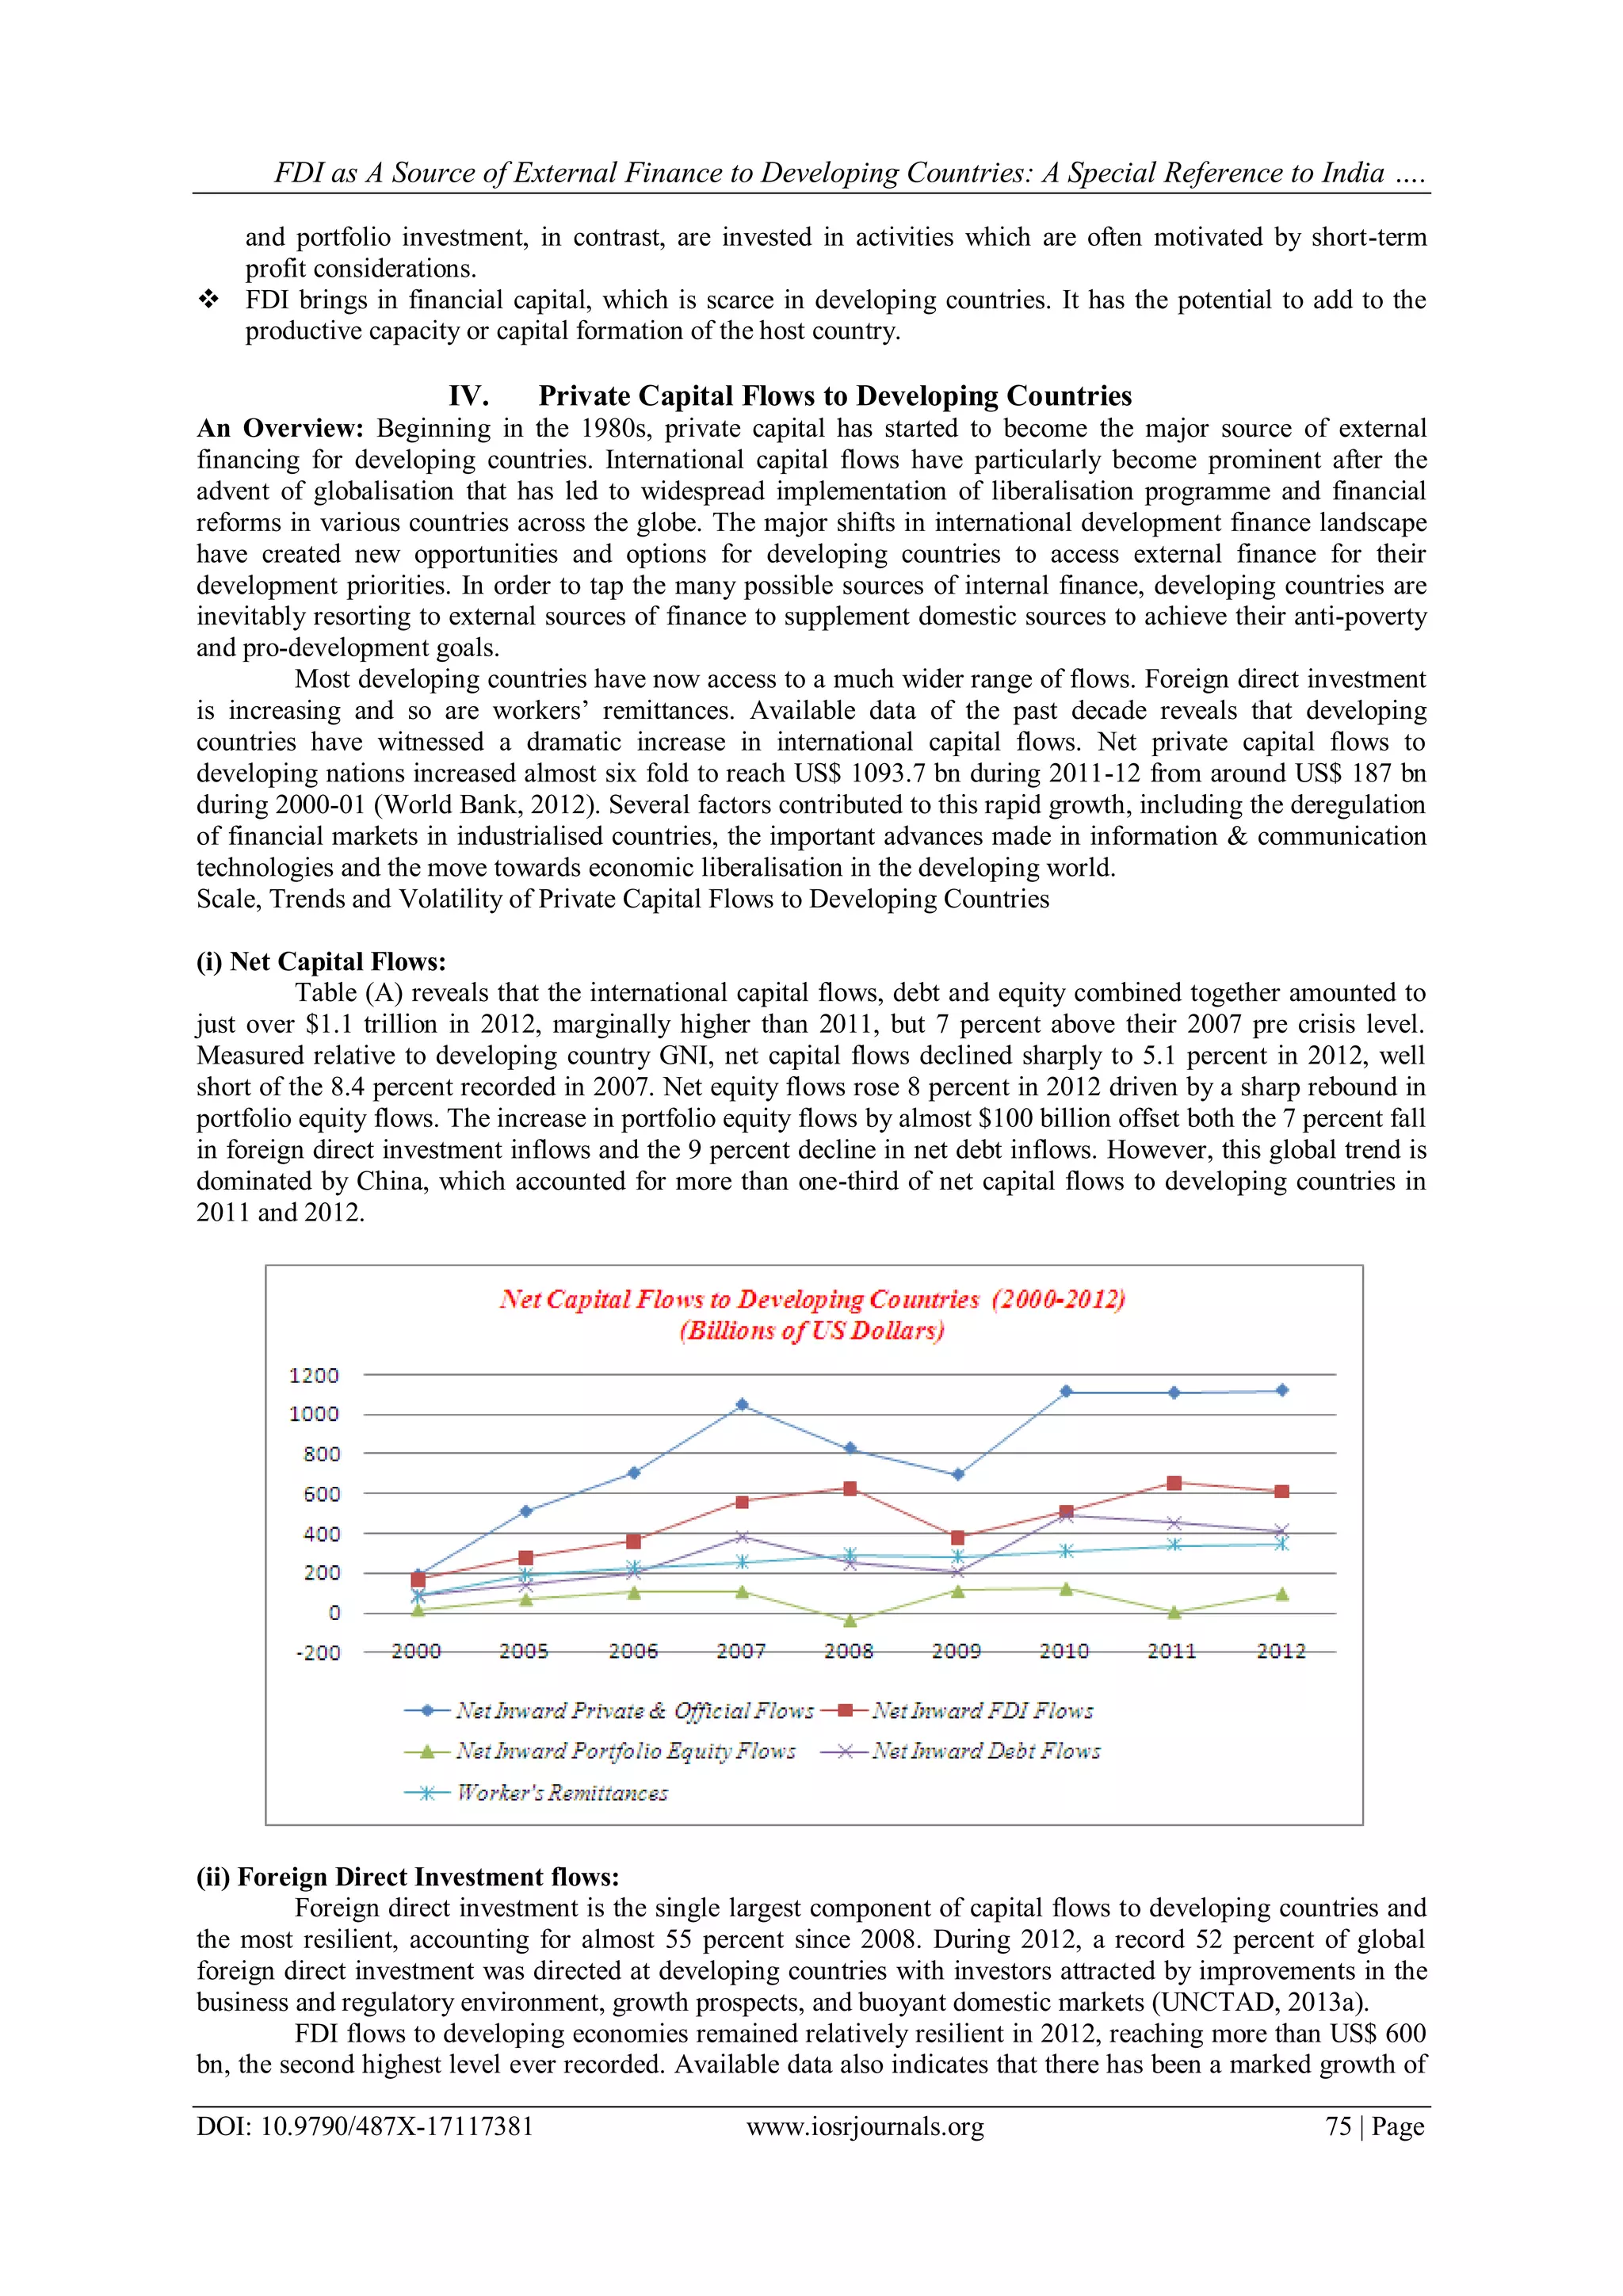
Table (A): Net Private Capital And Official Inflows To Developing Countries (2000-2012) (Billions of US
Dollars)
INDICATORS 2000 2005 2006 2007 2008 2009 2010 2011 2012
Net Private and Official Inflows 192.9 513.1 705.8 1049.8 831.2 698.0 1116.1 1109.3 1121.6
Percent of GNI (%) 2.1 5.4 6.3 8.4 5.6 4.7 6.2 5.3 5.1
Net FDI inflows 166.5 279.1 358.4 558.6 623.4 380.3 511.6 654.6 612.2
Net Portfolio Equity Inflows 13.4 68.1 104.3 109.0 -40.6 110.9 123.4 2.7 97.6
Net Debt Flows of which--
Official debt:
Private Debt:
87.0
-5.2
92.2
138.0
-64.3
203.1
200.1
-68.9
269.0
382.1
3.2
378.9
248.3
42.7
205.6
206.7
93.8
112.9
490.1
80.1
410.0
451.9
32.0
419.9
411.8
27.9
383.9
Change in Reserves -45.1 -385.5 -629.9 -898.5 -506.9 -632.8 -673.4 -475.8 -252.8
Workers’ Remittances 83.8 191.2 229.0 255.2 294.5 280.4 310.1 342.9 348.1](https://image.slidesharecdn.com/l017117381-151126042942-lva1-app6892/75/FDI-as-A-Source-of-External-Finance-to-Developing-Countries-A-Special-Reference-to-India-and-China-8-2048.jpg)

The document discusses the significance of foreign direct investment (FDI) as a primary source of external finance for developing countries, particularly India and China. It highlights the decline in official development assistance and commercial bank lending, leading to increased reliance on FDI, which is noted for its stability and potential to support long-term economic growth. The paper concludes that while China primarily depends on FDI and debt for financing, India relies on workers' remittances, demonstrating the contrasting external financing structures of the two countries.


