Analisi Evidence Based relativa al titolo FCA elaborata in data 17 settembre 2020 dal Team di ricerca e analisi Unbiased di Ambrosetti Asset Management SIM
NO1 Best kala jadu karne wale ka contact number kala jadu karne wale baba kal...
Fca 20200917
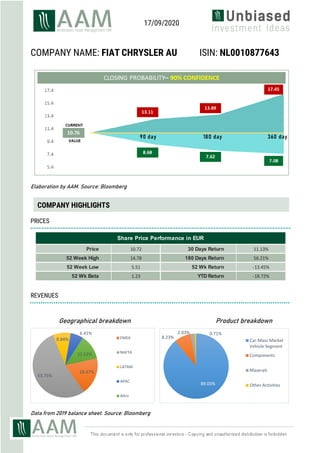
1. COMPANY NAME: FIAT CHRYSLER AU ISIN: NL0010877643
Elaboration by AAM. Source: Bloomberg
COMPANY HIGHLIGHTS
PRICES
REVENUES
Geographical breakdown Product breakdown
Data from 2019 balance sheet. Source: Bloomberg
89.03%
8.23%
2.03% 0.71%
Car-Mass Market
Vehicle Segment
Components
Maserati
Other Activities
18.47%
53.75%
8.84%
6.41%
12.52%
EMEA
NAFTA
LATAM
APAC
Altro
Price 10.72 30 Days Return 11.13%
52 Week High 14.78 180 Days Return 56.21%
52 Week Low 5.51 52 Wk Return -13.45%
52 Wk Beta 1.23 YTD Return -18.72%
Share Price Performance in EUR
17/09/2020
2. REPORT FIAT CHRYSLER AU
Max 2.06Min 0.26
Company 0.68
Eurostoxx50 1.43
PRICE TO BOOK
Max
3.06%
Min 0.12%
Company 0.41%
DIVIDEND YIELD
Max 1.69Min 0.58
Company 1.23
Eurostoxx50 1.00
BETA
Max
37.56%
Min -
27.29%
Company -5.31%
ROE
-100%
-80%
-60%
-40%
-20%
0%
20%
0% 20% 40% 60% 80%
Performance
Risk
VOLKSWAGEN-PREF
FIAT CHRYSLER AU
BMW AG
RENAULT SA
PORSCHE AUTO-PRF
PEUGEOT SA
DAIMLER AG
FERRARI NV
CONTINENTAL AG
MICHELIN
VALEO
COMPANY VS PEERS
The following charts show, for each analyzed indicator, the company position respective to the lowest (Min) and highest (Max) among the competitors.
Median values are also represented (short black vertical mark) as additional reference. The Eurostoxx50 index values are also shown in some of the charts.
Data from September 2020. Source: Bloomberg
The Price to Book ratio of the company is 0.68 (1st quartile).
With regard to the Profitability indicator ratios, the company has Return On Equity of -5.31%, while the
reference stock index (Eurostoxx 50 index) shows a value 6.08% for the ROE ratio.
The Dividend Yield value generated by the company is 0.41% while the Beta value belongs to the 2nd quartile
with 1.23.
Historical risk-reward (1 Year)
1 year risk/return ratio graph. Performance=result of 12 months period, Risk=annualized volatility. Monthly data from September 2019 to August 2020.
Source: Bloomberg