Download as PDF, PPTX


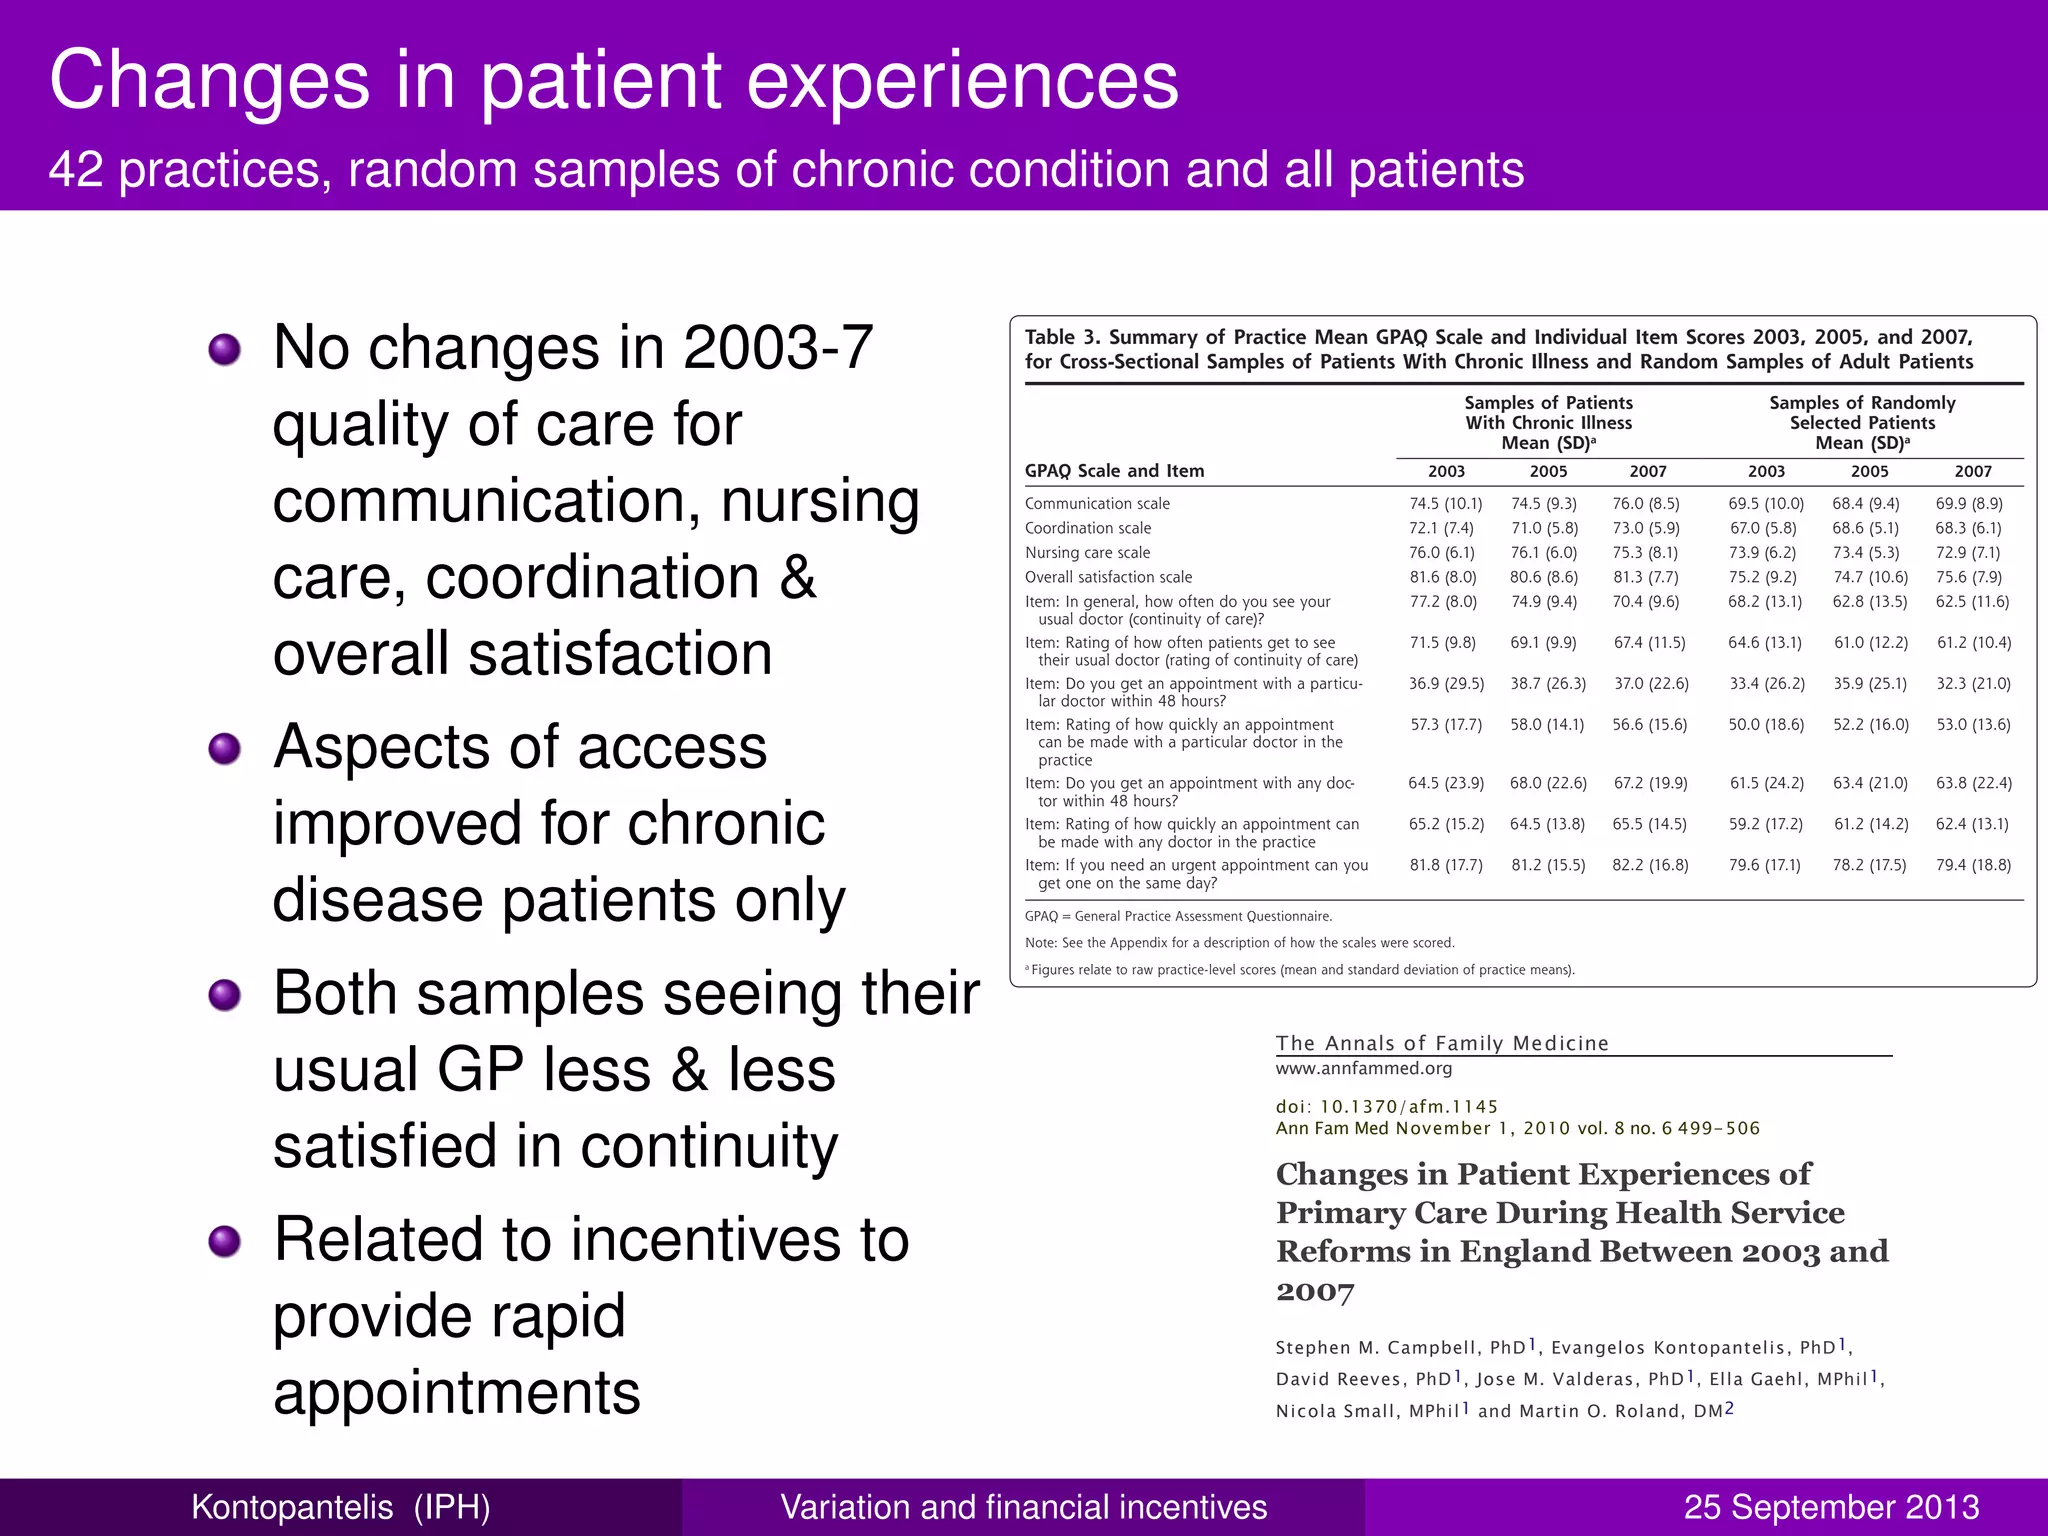
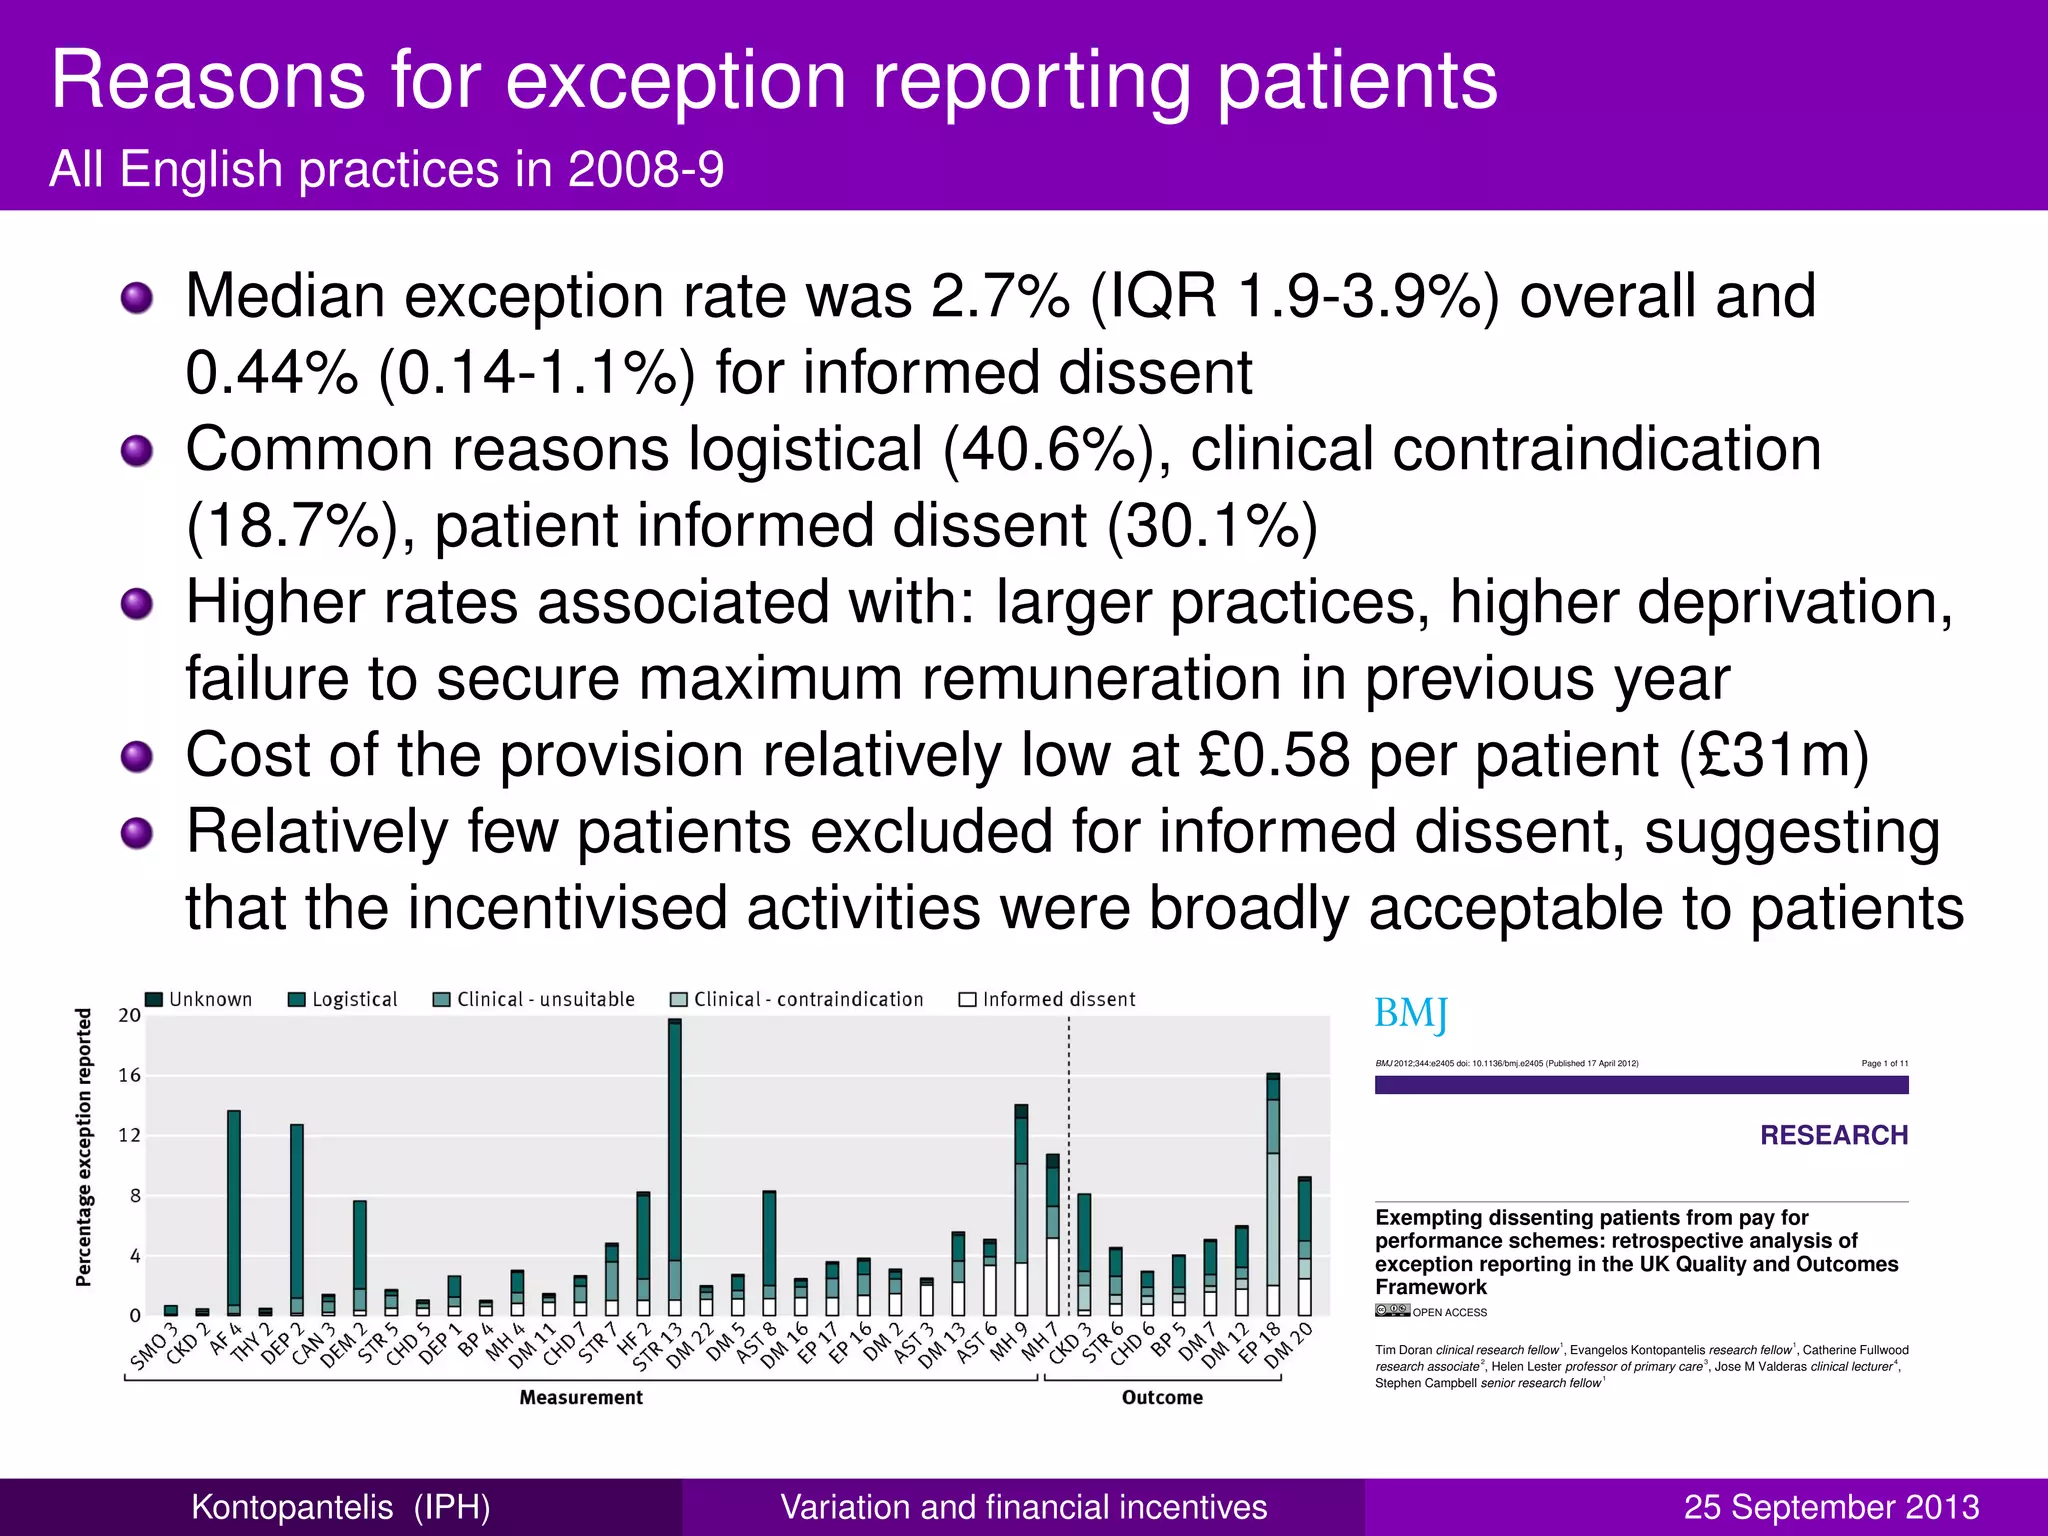
![Clinical computer systems
All English practices, 2007-8 to 2010-11
Seven clinical computer
systems consistently active
collectively holding ≈ 99% of
the market share
System choice strongest
predictor of performance on
62 stable care indicators
Differences greatest for
intermediate outcome
indicators
Particular system
characteristics facilitate higher
quality of care, better data
recording or both?
North East
North West
London
West Midlands
Yorkshire & the Humber
South West
East Midlands
East of England
South Central
South East Coast
(85.4,85.7]
(85.1,85.4]
(84.8,85.1]
(84.5,84.8]
(84.2,84.5]
[83.9,84.2]
LV
Vision 3
ProdSysOneX
PCS
Synergy
Practice Manager
Premiere
NOTE: Chart size proportional to number of practices in area
Average practice scores by Strategic Health Authority, 2010−11
Overall population achievement (62 indicators)
and GP systems products
Relationship between quality of care
and choice of clinical computing
system: retrospective analysis of family
practice performance under the UK’s
quality and outcomes framework
Evangelos Kontopantelis,1,2
Iain Buchan,3
David Reeves,1,2
Kath Checkland,1
Tim Doran4
To cite: Kontopantelis E,
Buchan I, Reeves D, et al.
Relationship between quality
of care and choice of clinical
computing system:
retrospective analysis of
family practice performance
under the UK’s quality and
outcomes framework. BMJ
ABSTRACT
Objectives: To investigate the relationship between
performance on the UK Quality and Outcomes
Framework pay-for-performance scheme and choice of
clinical computer system.
Design: Retrospective longitudinal study.
Setting: Data for 2007–2008 to 2010–2011, extracted
from the clinical computer systems of general practices
ARTICLE SUMMARY
Article focus
▪ Practice and patient-level characteristics are
known predictors of quality of care, as measured
by the Quality and Outcomes Framework (QOF)
indicators.
▪ Various general practitioner (GP) clinical com-
Open Access Research
group.bmj.comon September 13, 2013 - Published bybmjopen.bmj.comDownloaded from
Kontopantelis (IPH) Variation and financial incentives 25 September 2013](https://image.slidesharecdn.com/facultyshowcase2013-140606083146-phpapp01/75/Faculty-showcase-2013-Opening-up-clinical-performance-24-2048.jpg)


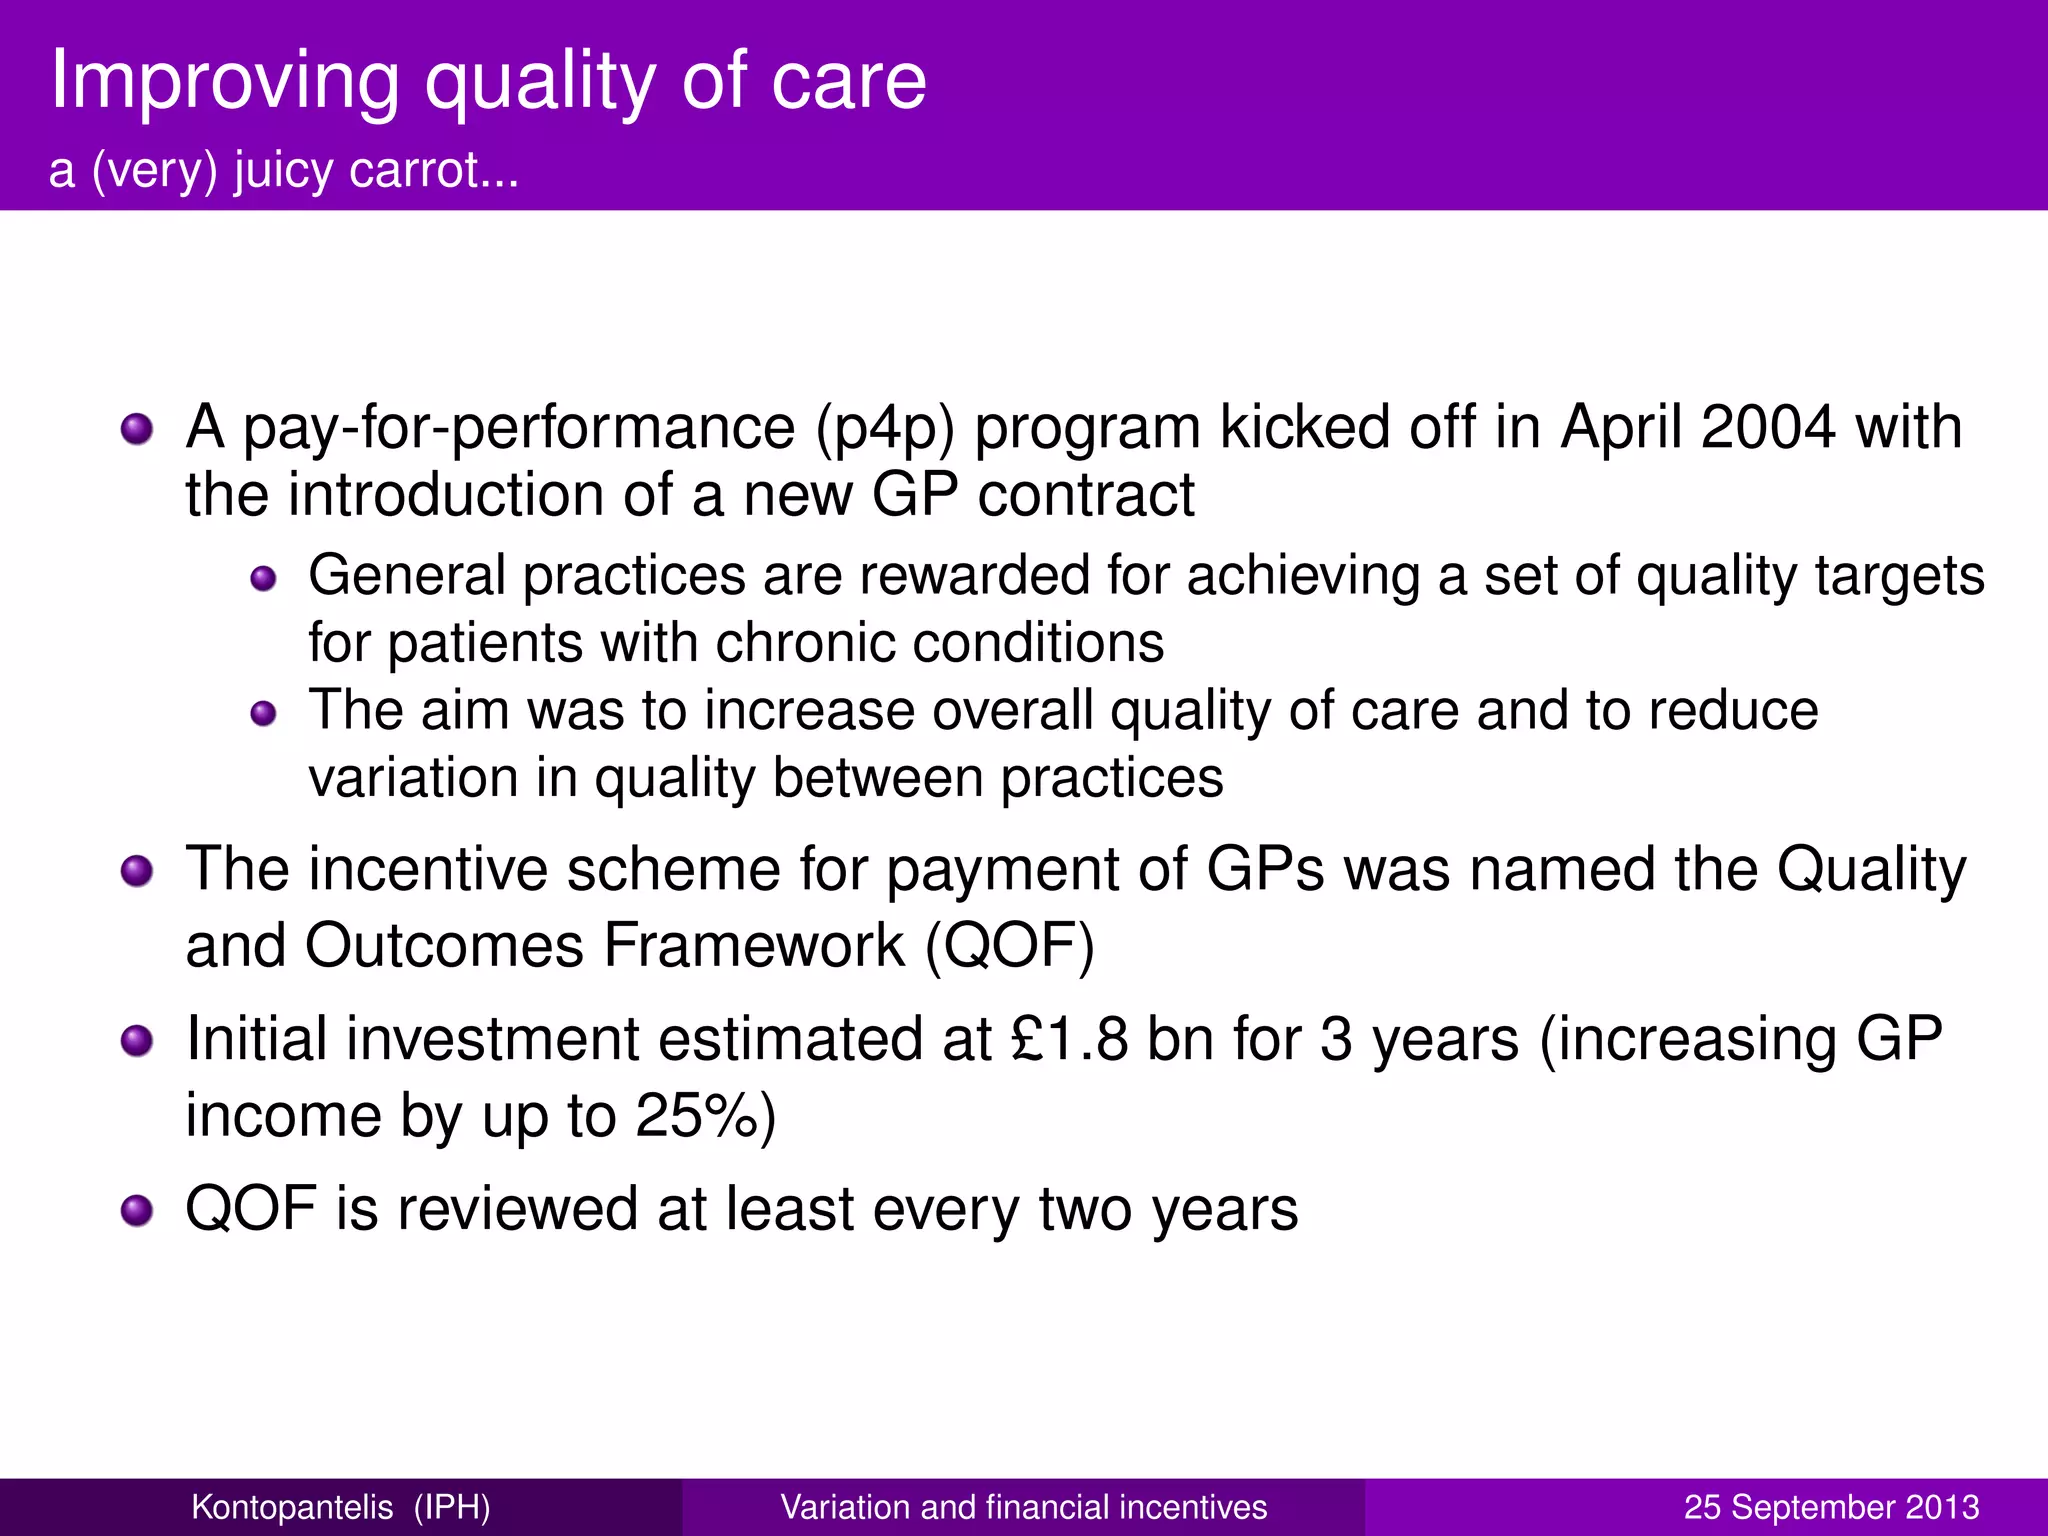
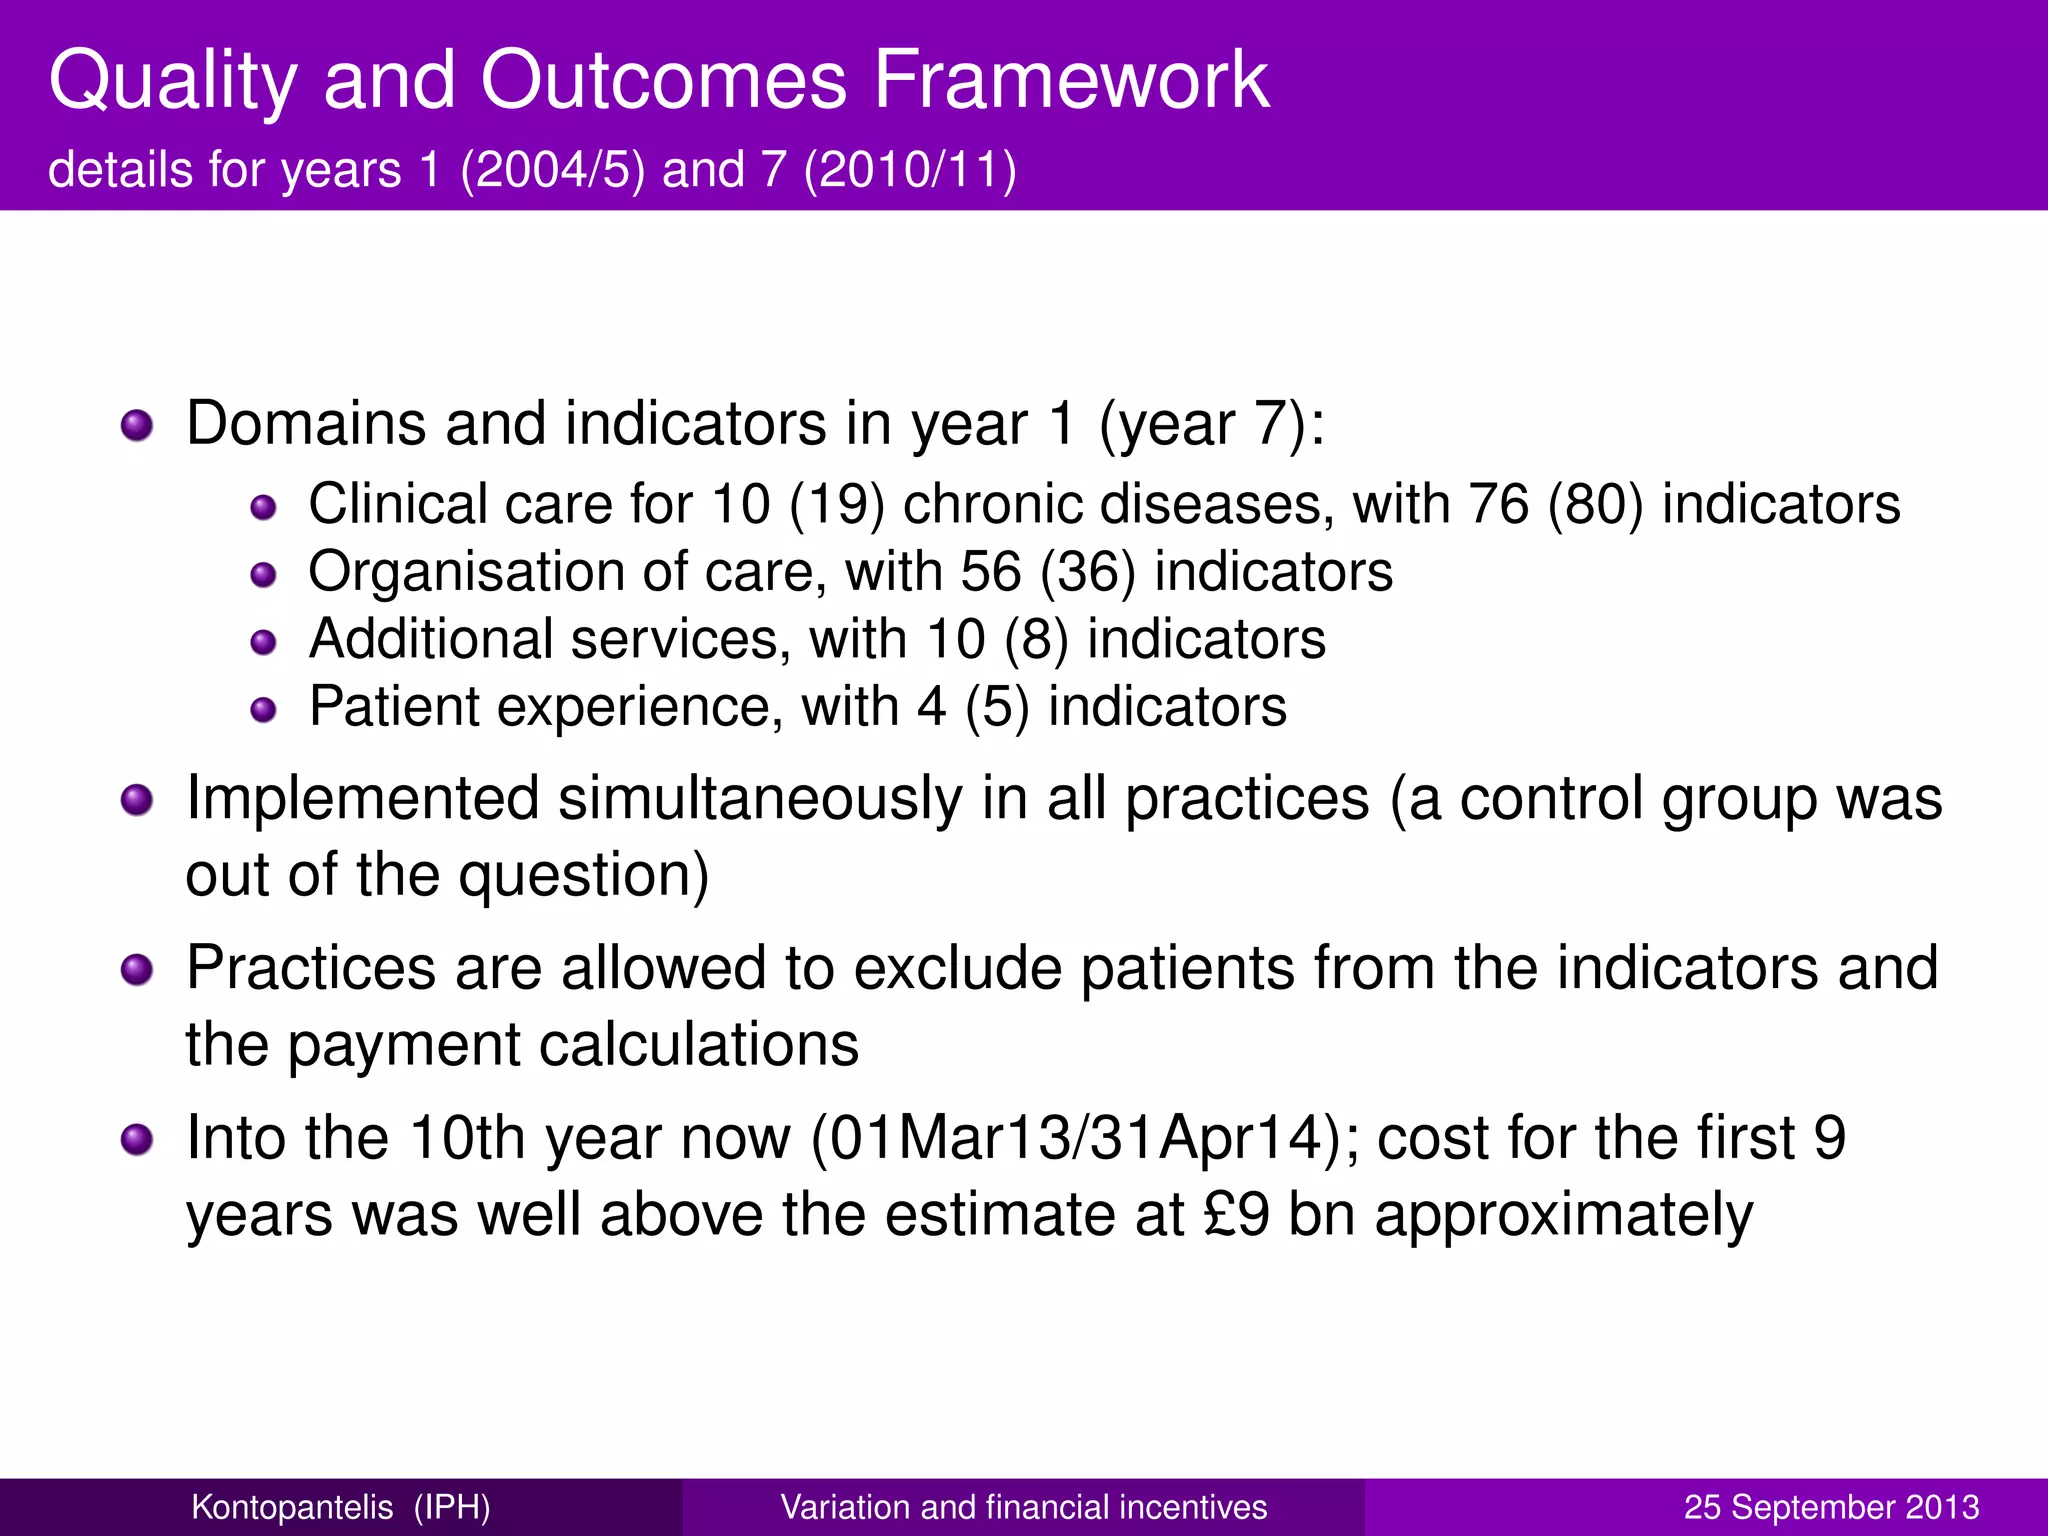
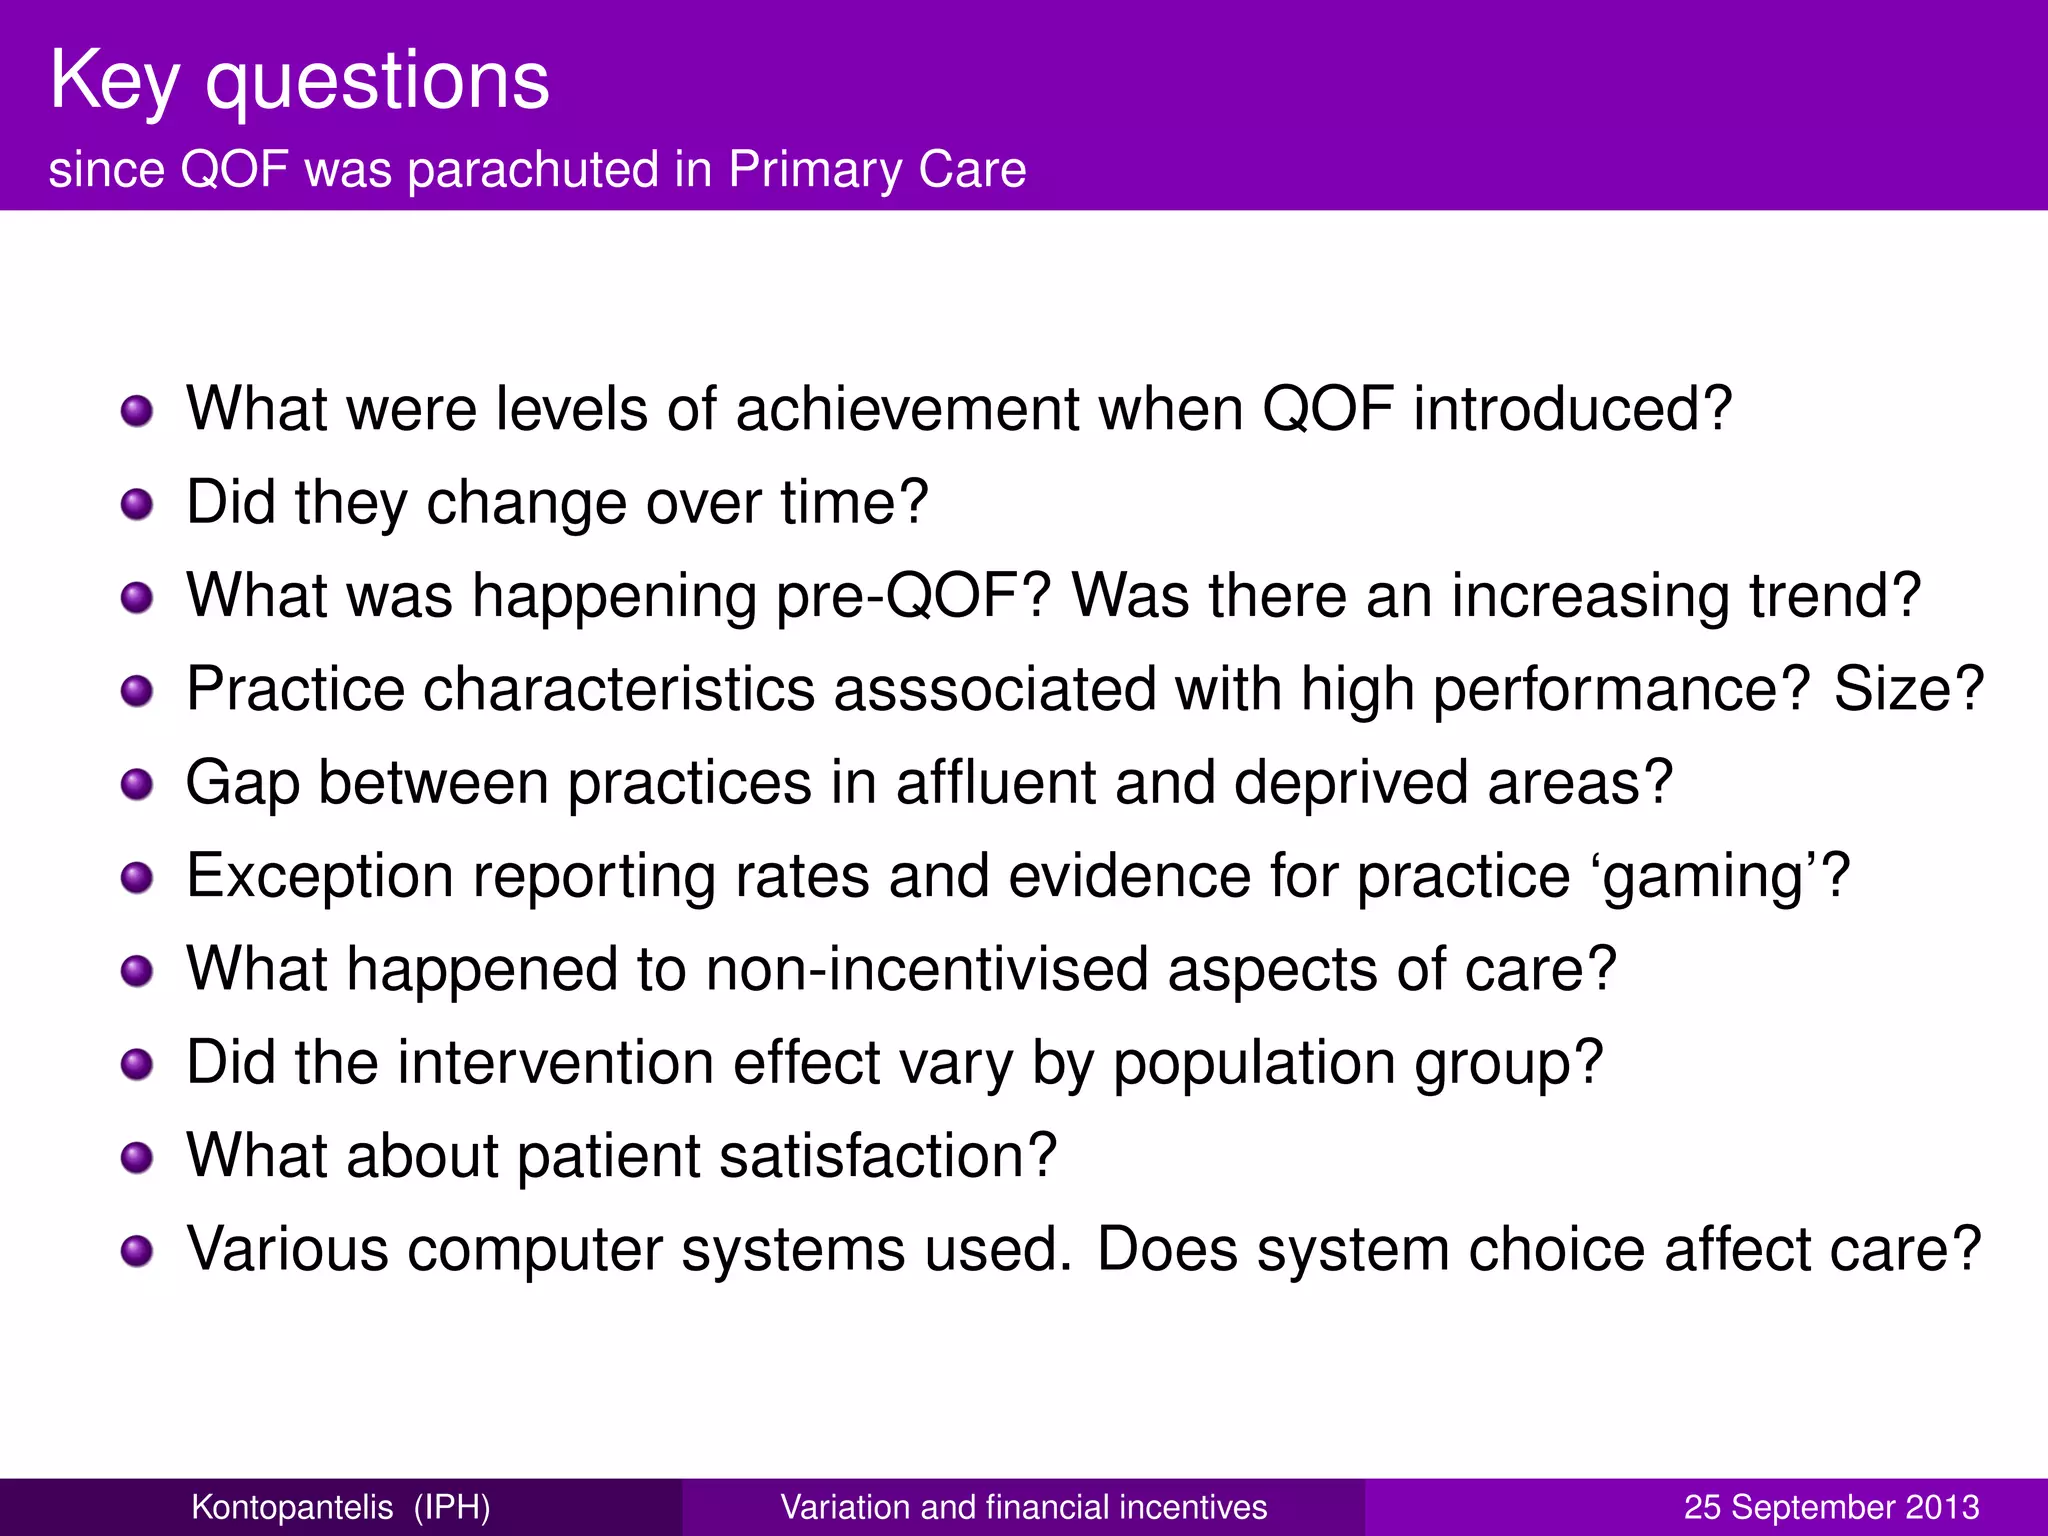
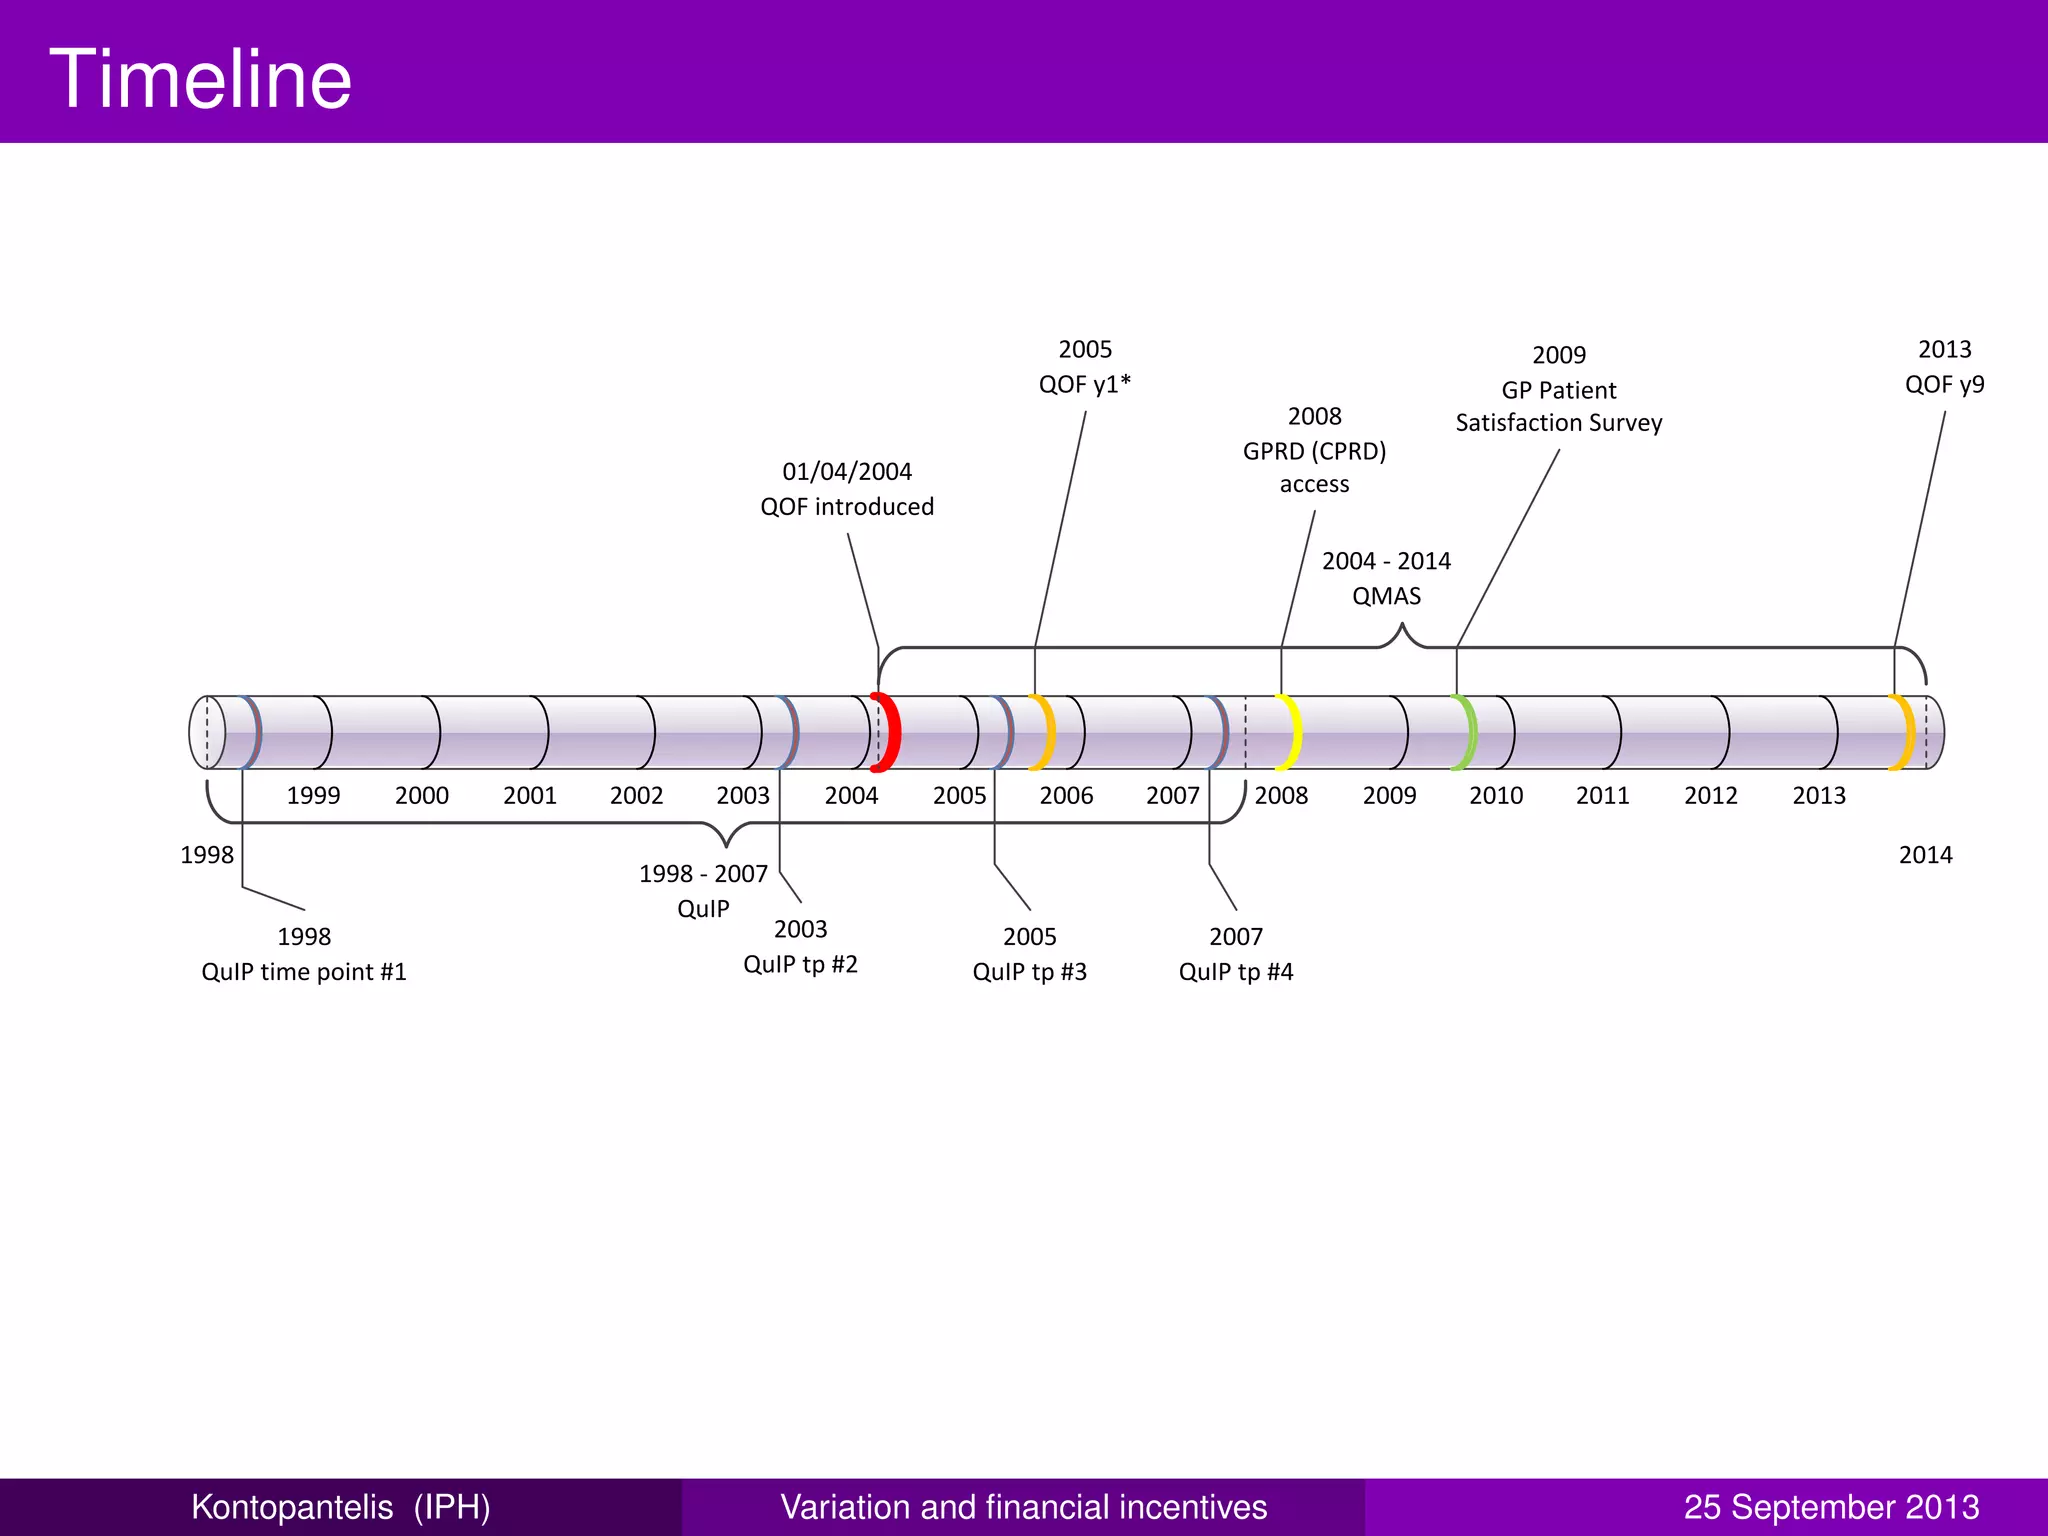
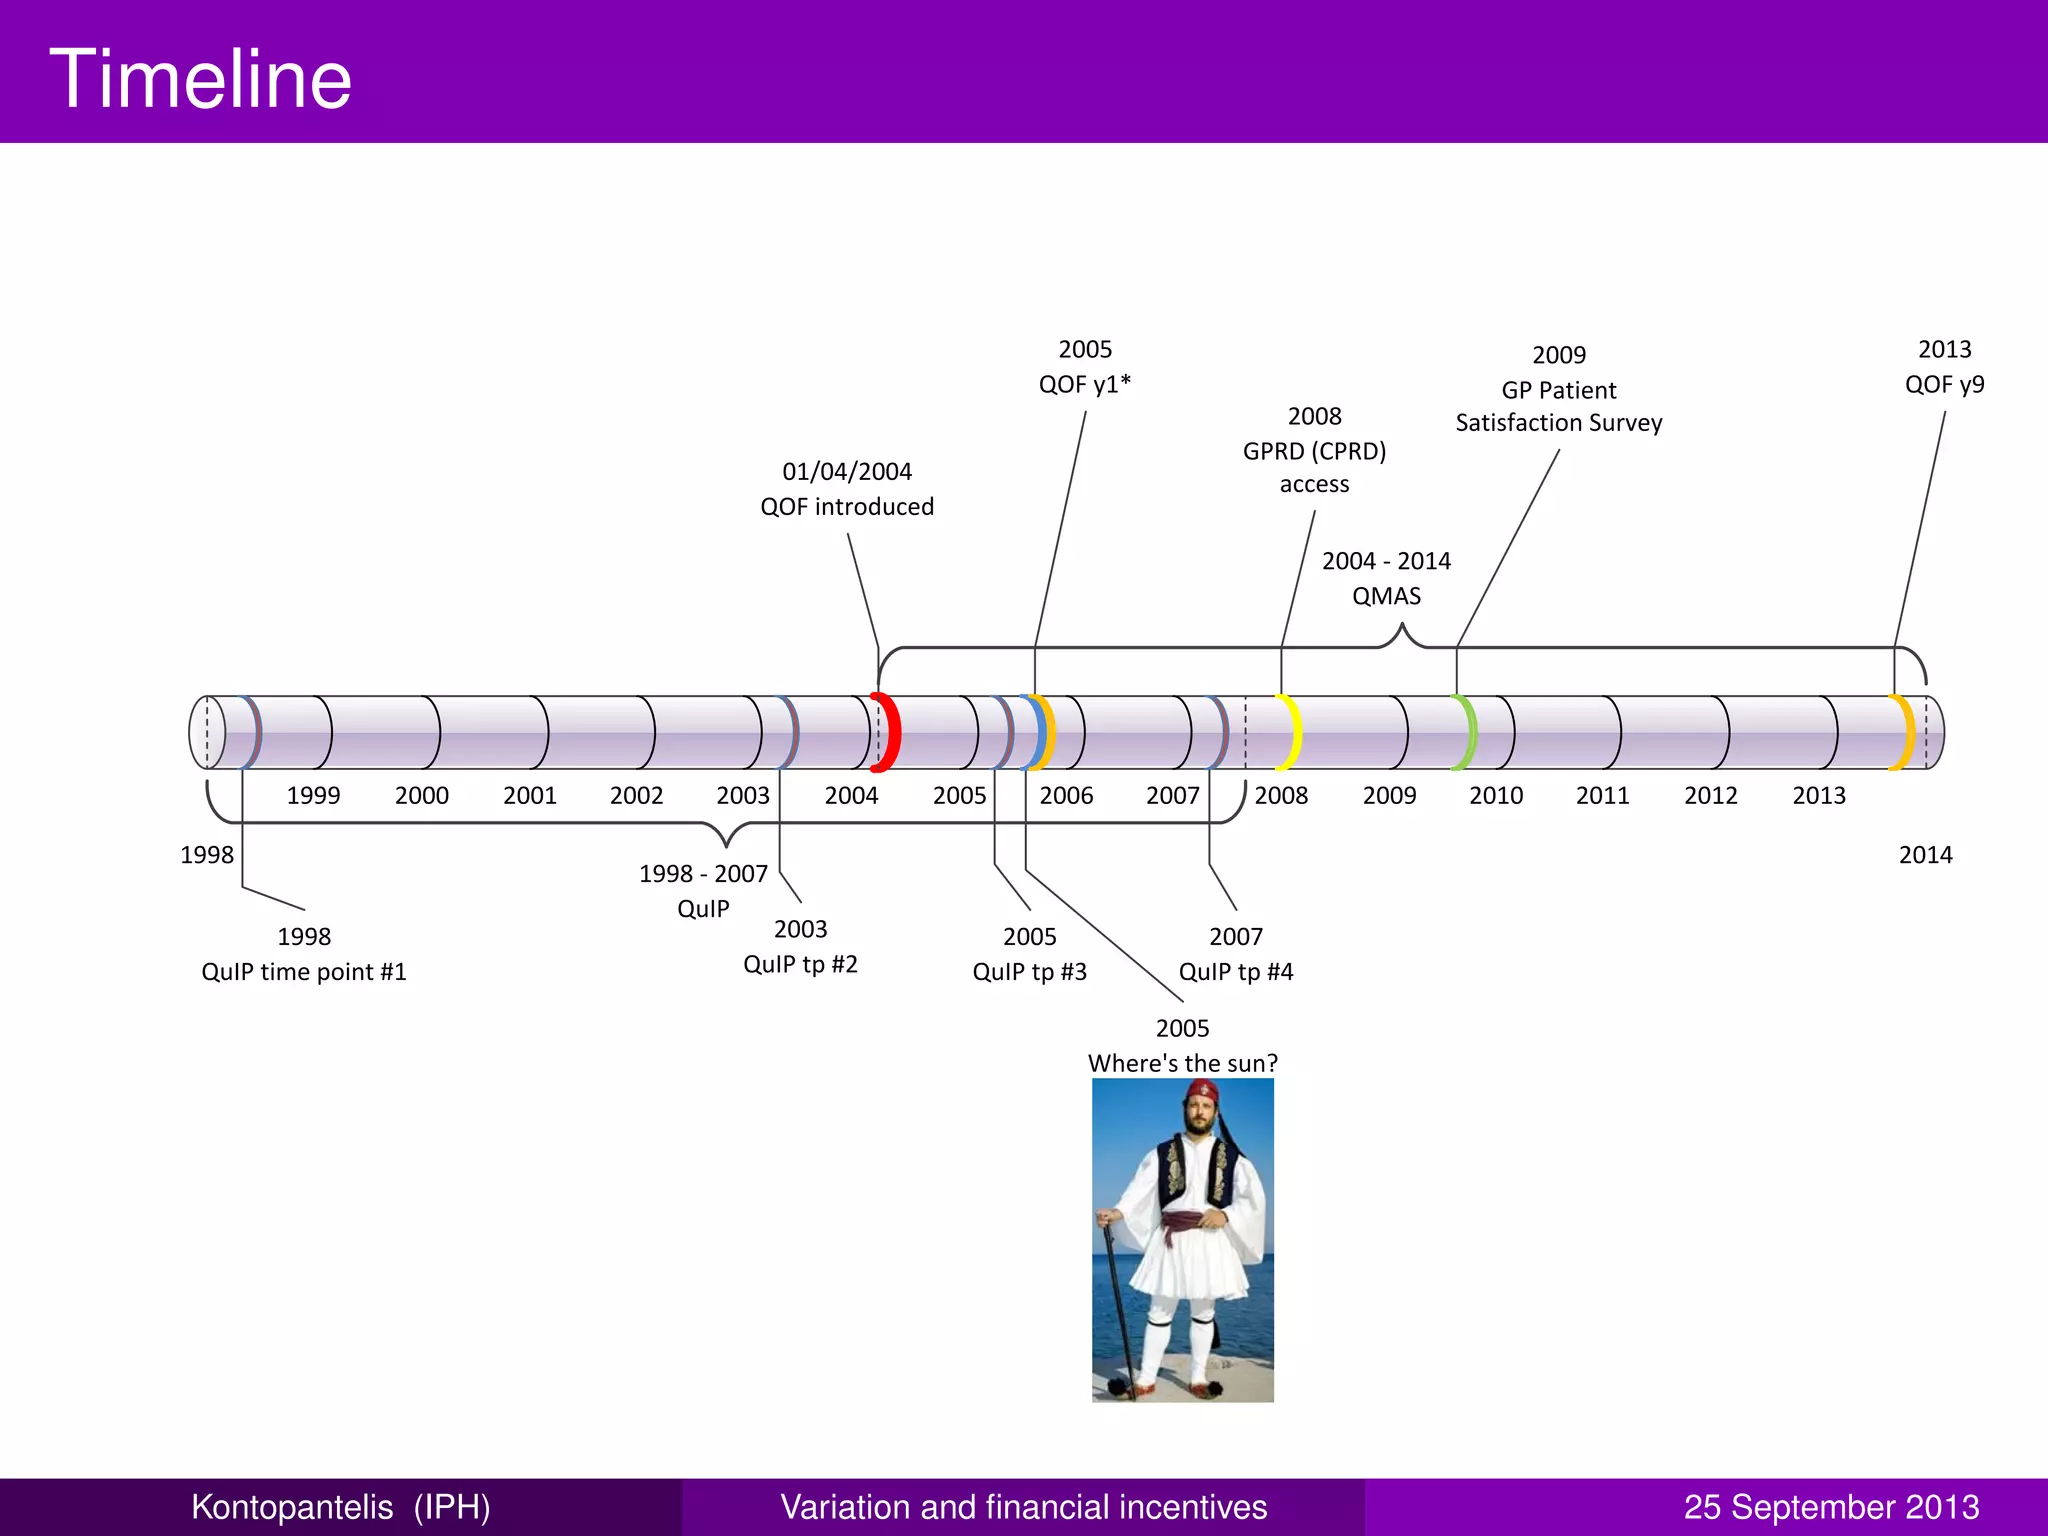
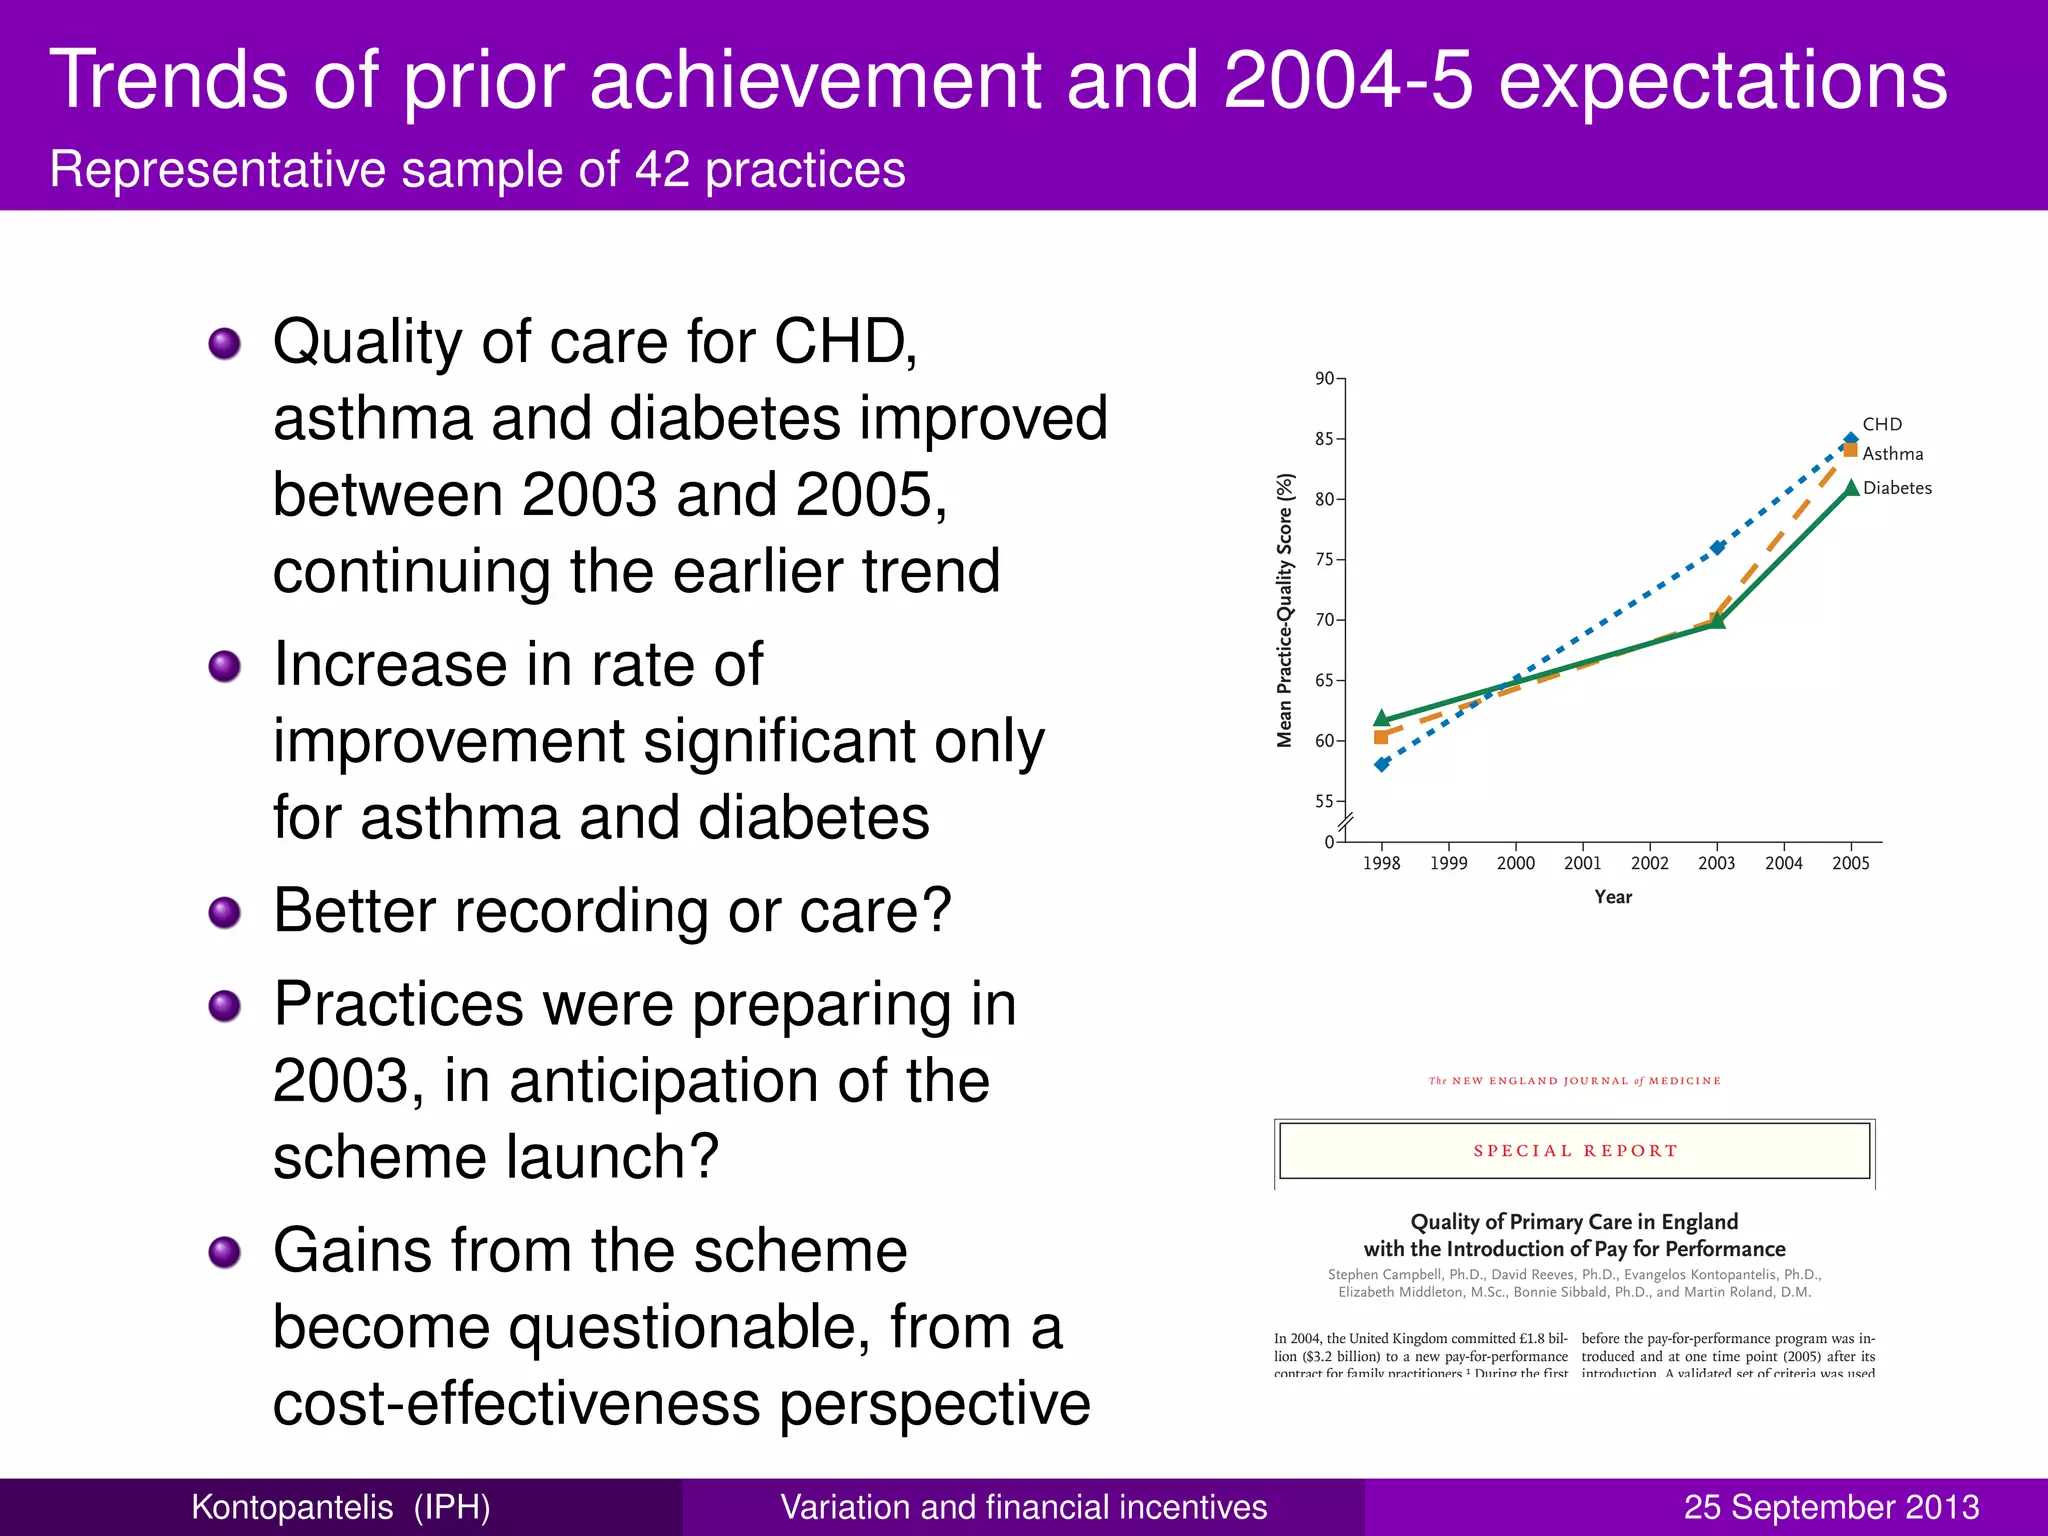
This document summarizes a presentation about opening up clinical performance variation and financial incentives in primary care quality of care. It discusses the Quality and Outcomes Framework (QOF), a pay-for-performance program introduced in 2004 as part of a new GP contract in the UK. The QOF rewards general practices for achieving quality targets in chronic disease care. It has expanded over time to include more indicators and domains. While initially estimated to cost £1.8 billion over 3 years, the program has cost over £9 billion after its first 9 years. The presentation examines research on the impact and effectiveness of the QOF program.


![RSS 2013 - A re-analysis of the Cochrane Library data]](https://cdn.slidesharecdn.com/ss_thumbnails/rssnewcastle3sep13-140606083345-phpapp02-thumbnail.jpg?width=640&height=640&fit=bounds)


