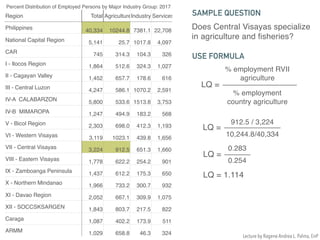
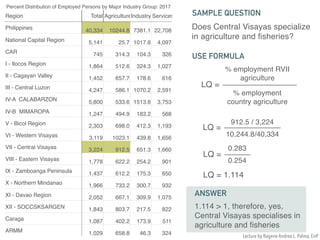
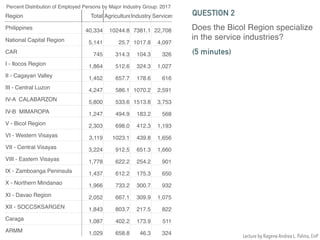
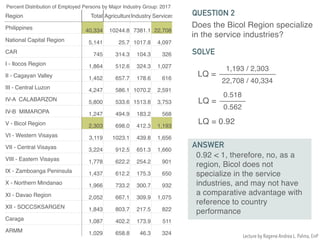
Download as PDF, PPTX


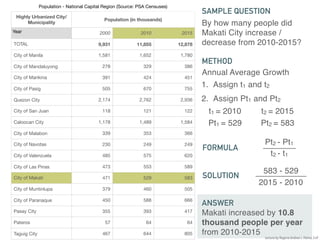
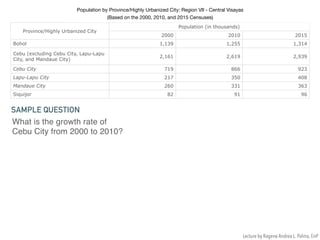
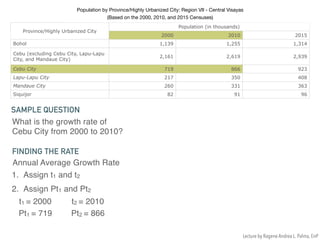
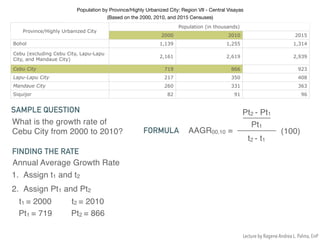
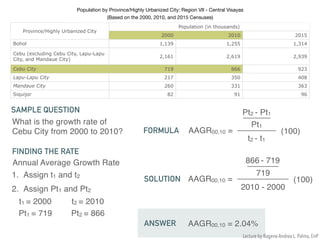

The document presents population data for various highly urbanized cities in the National Capital Region and Region VII - Central Visayas from 2000 to 2015, showcasing growth trends and methodologies for calculating annual average growth rates. It includes specific inquiries regarding population changes in cities such as Makati and Quezon City, detailing how to derive growth rates using assigned time frames and formulas. Additionally, it emphasizes the significance of demographic analysis in understanding urban growth patterns and planning.