Download as PDF, PPTX
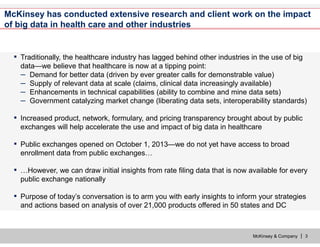
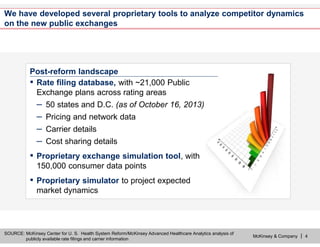
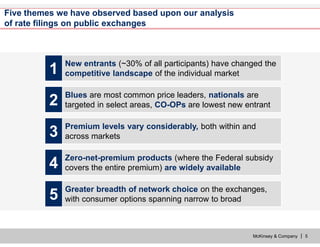
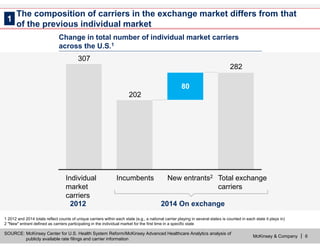
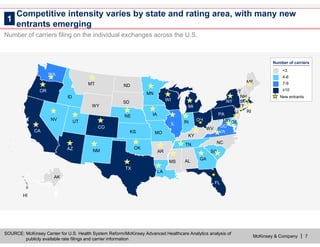
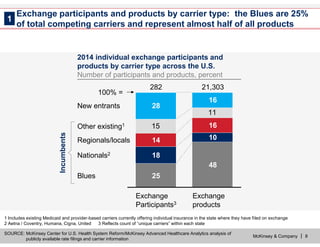
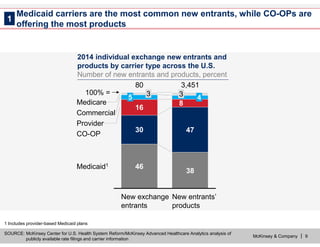
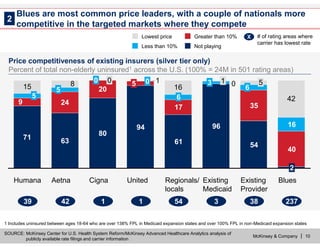
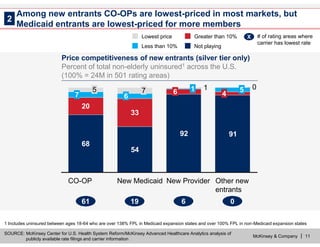
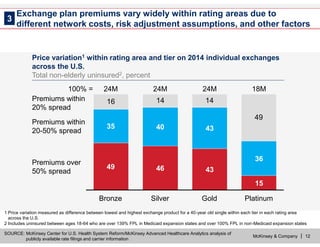

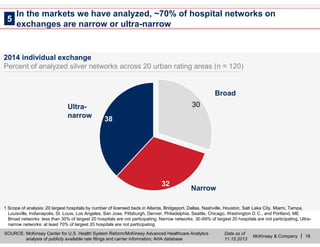
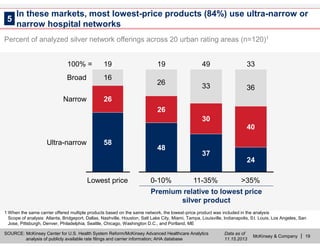
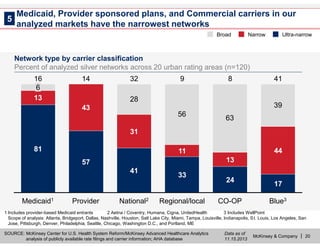
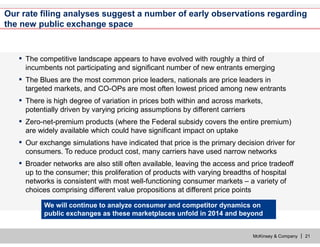

The document discusses the impact of public exchanges on the healthcare market, particularly following their launch on October 1, 2013. It highlights changes in competitive dynamics, including the emergence of new entrants, varied pricing strategies, and increased transparency of products. The analysis is based on extensive rate filing data and proprietary tools developed by McKinsey & Company to examine over 21,000 products offered across multiple states.


![Hypothalamus short notes on location, function and disorders by Dr. Neha [PT]...](https://cdn.slidesharecdn.com/ss_thumbnails/hypothalamusbydr-260124142231-2b48143d-thumbnail.jpg?width=640&height=640&fit=bounds)


