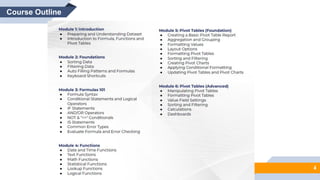
ZERO TO HERO IN
FORMULAS, FUNCTIONS,
AND PIVOT TABLES Excel
Prepared by Mohaimie Mosmin © 2023
TABLE OF CONTENTS – EXCEL FORMULAS, FUNCTIONS & PIVOT TABLES
3
1 3 5
6
4
2
INTRODUCTION FORMULAS 101
PIVOT TABLES
(FOUNDATIONS)
FOUNDATIONS FUNCTIONS PIVOT TABLES
(ADVANCED)
HERO
4
Course Outline
Module 1: Introduction
ZERO TO HERO IN FORMULA,
FUNCTIONS, AND PIVOT TABLES
1
6
7
Copyright © Mohaimie Mosmin
1: Introduction | 7
Preparing and Understanding Dataset
▰ Preparing and understanding the dataset is a critical step in
the data analysis process, and Microsoft Excel provides a
powerful platform for handling and exploring data effectively.
Before diving into data analysis or visualization, it is essential
to ensure that the dataset is clean, structured, and organized.
This involves importing the data into Excel, performing data
cleaning tasks like removing duplicates, handling missing
values, and correcting errors.
8
Copyright © Mohaimie Mosmin
1: Introduction | 8
Preparing and Understanding Dataset
▰ Understanding the dataset entails gaining insights into its
structure, variables, and relationships, which allows users to
make informed decisions on how to proceed with the analysis.
By investing time in preparing and comprehending the
dataset, Excel users can unlock its full potential and extract
valuable information, leading to more accurate and
actionable data-driven outcomes.
9
Copyright © Mohaimie Mosmin
1: Introduction | 9
1. Importing Data
▰ Use Excel's data import tools (e.g., Data tab > Get Data, or
opening CSV/Text files) to bring data into the workbook.
▰ Ensure the data is properly formatted and organized, making it
easy to work with.
10
Copyright © Mohaimie Mosmin
1: Introduction | 10
2. Data Cleaning
▰ Identify and handle duplicate records to avoid redundant
information.
▰ Deal with missing values by either filling them in or removing
rows with missing data.
▰ Correct errors or inconsistencies in the dataset to ensure
accuracy.
11
Copyright © Mohaimie Mosmin
1: Introduction | 11
3. Structuring Data
▰ Arrange data in a tabular format with rows representing
individual records and columns representing variables.
▰ Ensure each column contains a single type of data for
consistency and analysis ease.
12
Copyright © Mohaimie Mosmin
1: Introduction | 12
4. Organizing and Renaming Columns
▰ Rename columns with descriptive names for clarity and better
understanding.
▰ Organize columns logically to group related variables together.
13
Copyright © Mohaimie Mosmin
1: Introduction | 13
5. Understanding Data Types
▰ Identify data types for each column (e.g., numeric, text, date)
to perform appropriate calculations and analyses.
14
Copyright © Mohaimie Mosmin
1: Introduction | 14
6. Data Summary
▰ Generate summary statistics (e.g., count, mean, median,
standard deviation) for numeric data to gain a general
understanding of the dataset's distribution.
▰ Use Excel's functions like COUNT, AVERAGE, MIN, MAX, etc.,
for quick summaries.
15
Copyright © Mohaimie Mosmin
1: Introduction | 15
7. Data Visualization
▰ Create basic charts (e.g., bar charts, pie charts, line charts) to
visualize the distribution and relationships between variables.
▰ Use Excel's charting tools to explore data patterns and trends
visually.
16
Copyright © Mohaimie Mosmin
1: Introduction | 16
8. Identifying Outliers and Anomalies
▰ Plotting data on scatter plots or box plots helps identify
outliers or unusual data points.
▰ Investigate and verify outliers to determine if they are valid or
require further handling.
17
Copyright © Mohaimie Mosmin
1: Introduction | 17
9. Data Relationships and Correlations
▰ Analyze correlations between variables using Excel's
correlation functions (e.g., CORREL).
▰ Identify any significant relationships that may impact the
analysis.
18
Copyright © Mohaimie Mosmin
1: Introduction | 18
10.Data Validations
▰ Set up data validations to restrict entries within certain ranges
or criteria, ensuring data integrity.
▰ Use drop-down lists or input messages to guide users in
entering correct data.
19
Copyright © Mohaimie Mosmin
1: Introduction | 19
11.Handling Data Updates
▰ Consider how new data will be incorporated into the existing
dataset.
▰ Plan for updating and refreshing the dataset to keep it current
for ongoing analysis.
20
Copyright © Mohaimie Mosmin
1: Introduction | 20
Introduction to Excel Formula, Functions,
and Pivot Tables
▰ Microsoft Excel is a powerful spreadsheet software
widely used for data analysis, calculations, and
reporting in various industries and fields.
Understanding Excel's core features, including
formulas, functions, and Pivot Tables, is essential for
maximizing its potential in handling complex
datasets.
21
Copyright © Mohaimie Mosmin
1: Introduction | 21
Introduction to Excel Formula, Functions,
and Pivot Tables
▰ Excel formulas provide a way to perform calculations
and manipulate data dynamically. By using functions,
users can streamline calculations and simplify
repetitive tasks.
▰ Pivot Tables, on the other hand, allow for quick data
summarization and analysis, providing valuable
insights without the need for complex formulas or
manual data manipulation.
22
Copyright © Mohaimie Mosmin
1: Introduction | 22
Introduction to Excel Formula, Functions,
and Pivot Tables
▰ Formulas in Excel are built on a foundation of cell references
and arithmetic operators. By combining these elements, users
can perform a wide range of mathematical operations, such as
addition, subtraction, multiplication, and division.
▰ Excel also supports advanced functions, enabling users to
carry out complex calculations, logical evaluations, text
manipulations, and date and time operations. This flexibility
empowers users to handle large datasets efficiently and derive
meaningful results with minimal effort.
23
Copyright © Mohaimie Mosmin
1: Introduction | 23
Introduction to Excel Formula, Functions,
and Pivot Tables
▰ Pivot Tables serve as a game-changer in Excel,
offering a dynamic and interactive way to summarize
and analyze data. They allow users to reorganize data
and gain insights through simple drag-and-drop
operations. Pivot Tables aggregate and group data,
perform calculations, and create customizable
reports with ease.
24
Copyright © Mohaimie Mosmin
1: Introduction | 24
Introduction to Excel Formula, Functions,
and Pivot Tables
▰ In conclusion, Excel’s formulas, functions and Pivot
Tables enable users to spot trends, patterns, and
outliers in the data quickly. Together, these tools
provide a comprehensive set of tools that facilitate
data analysis, enhance decision-making, and simplify
complex data tasks for users of all skill levels.
Module 2:
Foundations
Excel Zero to Hero: Formulas. Functions and Pivot Tables
Sorting Data
26
27
Copyright © Mohaimie Mosmin
2: Foundations | 27
Introduction to Sorting
▰ What is data sorting?
▰ Importance of organizing data for analysis and presentation.
28
Copyright © Mohaimie Mosmin
2: Foundations | 28
Introduction to Sorting
▰ Sorting data is the process of arranging information in a
logical order, making it easier to analyze and present. In
spreadsheets like Microsoft Excel, sorting plays a crucial role
in data management and decision-making. By organizing data
systematically, you can identify patterns, trends, and outliers
more effectively. Sorting is particularly useful when dealing
with large datasets, as it allows you to locate specific
information quickly. Whether you're dealing with numerical
data, text values, or dates, mastering the art of sorting
empowers you to work with your data efficiently.
29
Copyright © Mohaimie Mosmin
2: Foundations | 29
Sorting Basics
▰ How to access the sorting options in Excel.
▰ Sorting data in ascending and descending order.
▰ Sorting by single or multiple columns.
30
Copyright © Mohaimie Mosmin
2: Foundations | 30
Sorting Basics
▰ Sorting in Excel is straightforward. To get started, select the
data range you want to sort, go to the "Data" tab, and click on
the "Sort" button. You can sort in ascending or descending
order based on a single column. For more complex sorting,
you can sort by multiple columns, which lets you prioritize
data based on different criteria. For instance, you can sort
sales data first by region and then by date, providing a
comprehensive view of sales performance in each region over
time.
31
Copyright © Mohaimie Mosmin
2: Foundations | 31
Sorting Numerical Data
▰ Sorting numerical data by value.
▰ Handling empty cells and special characters during sorting.
32
Copyright © Mohaimie Mosmin
2: Foundations | 32
Sorting Numerical Data
▰ When sorting numerical data, Excel considers the actual
values of the cells. It arranges numbers from the smallest to
the largest in ascending order and vice versa in descending
order. Excel also handles empty cells and special characters
during sorting, ensuring that your data remains accurate and
well-structured. This is crucial when dealing with datasets that
involve various data types and may contain empty cells or non-
numeric characters.
33
Copyright © Mohaimie Mosmin
2: Foundations | 33
Sorting Text Data
▰ Sorting text data alphabetically.
▰ Custom sorting options for specific text criteria.
34
Copyright © Mohaimie Mosmin
2: Foundations | 34
Sorting Text Data
▰ Sorting text data in alphabetical order is a common
requirement when dealing with lists of names, titles, or
categories. Excel allows you to sort text values efficiently,
treating uppercase and lowercase letters as distinct.
Additionally, you can create custom sorting orders to arrange
text data based on specific criteria. For instance, you might
want to sort product names based on priority or category
instead of the default alphabetical order.
35
Copyright © Mohaimie Mosmin
2: Foundations | 35
Sorting Dates and Times
▰ Sorting data by date or time values.
▰ Handling date and time formats during sorting.
36
Copyright © Mohaimie Mosmin
2: Foundations | 36
Sorting Dates and Times
▰ Excel provides seamless sorting of date and time data,
allowing you to arrange events chronologically. Whether you're
working with sales records, project timelines, or event
schedules, sorting by date or time helps you identify trends
and historical patterns. Excel recognizes various date and time
formats, ensuring accurate sorting regardless of the date
display format in your dataset. This flexibility is essential when
dealing with datasets from different sources or regions.
Filtering Data
37
38
Copyright © Mohaimie Mosmin
2: Foundations | 38
1. Introduction to Filtering
▰ What is data filtering?
▰ The purpose of using filters in data analysis.
39
Copyright © Mohaimie Mosmin
2: Foundations | 39
Introduction to Filtering
▰ Filtering data involves displaying only the specific information
that meets certain criteria, hiding irrelevant data temporarily.
Filtering is a powerful tool for data analysis, as it allows you to
focus on specific subsets of data and draw meaningful
insights. Whether you want to extract sales data for a
particular region or identify products with low inventory levels,
filtering enables you to drill down into your dataset effectively.
40
Copyright © Mohaimie Mosmin
2: Foundations | 40
2. Filter Basics
▰ How to apply filters to data in Excel.
▰ Filtering by single or multiple criteria.
41
Copyright © Mohaimie Mosmin
2: Foundations | 41
Filter Basics
▰ Applying filters in Excel is easy. Select the data range, go to
the "Data" tab, and click on the "Filter" button. Filter arrows
appear in the column headers, and you can choose the data
you want to display by selecting the desired criteria. You can
filter data based on single or multiple conditions
simultaneously, refining your data view to show only what's
relevant.
42
Copyright © Mohaimie Mosmin
2: Foundations | 42
3. Text and Number Filters
▰ Filtering data based on text values (e.g., contains, starts with).
▰ Filtering data using number-based conditions (e.g., greater
than, between).
43
Copyright © Mohaimie Mosmin
2: Foundations | 43
Text and Number Filters
▰ Filtering data based on text values involves using various
conditions like "contains," "starts with," or "ends with." For
instance, you can filter a customer list to show only those with
a specific area code in their phone numbers. Similarly, number
filters allow you to display data that falls within a specified
range, such as showing products with prices between a
minimum and maximum value.
44
Copyright © Mohaimie Mosmin
2: Foundations | 44
4. Date and Time Filters
▰ Filtering data by specific date ranges or periods.
▰ Using relative date filters for dynamic analysis.
45
Copyright © Mohaimie Mosmin
2: Foundations | 45
Date and Time Filters
▰ Filtering data by date or time is essential for analyzing trends
over specific periods. Excel offers various options to filter data
by date ranges, including custom date ranges and relative date
filters like "This Month" or "Last Quarter." You can also use
date filters to show data for a specific day, month, or year.
46
Copyright © Mohaimie Mosmin
2: Foundations | 46
5. Advanced Filtering Options
▰ Utilizing custom filters and advanced criteria.
▰ Combining filters for more complex data analysis.
47
Copyright © Mohaimie Mosmin
2: Foundations | 47
Advanced Filtering Options
▰ Excel provides advanced filtering options to perform more
complex data analysis. Custom filters allow you to create
complex criteria using operators like AND and OR, providing
highly specific data views. By combining multiple filters, you
can refine your data analysis to a granular level and draw
precise conclusions from your dataset.
Auto Filling Patterns and
Formulas
48
49
Copyright © Mohaimie Mosmin
2: Foundations | 49
1. Introduction to Auto Filling
▰ How Auto Fill simplifies data entry and repetitive tasks.
▰ Auto Filling series of numbers, dates, and text patterns.
50
Copyright © Mohaimie Mosmin
2: Foundations | 50
Introduction to Auto Filling
▰ Auto Fill is a powerful feature in Excel that simplifies data
entry and repetitive tasks. It automatically extends a series of
data, such as numbers, dates, or text patterns, based on your
initial input. Auto Fill saves time and reduces errors in data
entry, making it an essential tool for working efficiently with
large datasets.
51
Copyright © Mohaimie Mosmin
2: Foundations | 51
2. Auto Filling Formulas
▰ Copying formulas automatically using Auto Fill.
▰ Adjusting cell references during Auto Fill.
52
Copyright © Mohaimie Mosmin
2: Foundations | 52
Auto Filling Formulas
▰ One of the most significant advantages of Auto Fill is its ability
to copy and adjust formulas automatically. For example, if you
have a formula to calculate the total sales for a single product,
Auto Fill can extend the formula to calculate totals for all
products in your dataset. Excel automatically adjusts cell
references in the formula to match the new location, ensuring
accurate results.
53
Copyright © Mohaimie Mosmin
2: Foundations | 53
3. Auto Filling with Custom Lists
▰ Creating and using custom lists for Auto Fill.
▰ Applying custom lists in various scenarios.
54
Copyright © Mohaimie Mosmin
2: Foundations | 54
Auto Filling with Custom Lists
▰ Excel allows you to create custom lists that you can use for
Auto Fill purposes. For instance, if you have a specific set of
names or department codes that you use frequently, you can
create a custom list. When you begin typing an item from the
list, Excel predicts the rest of the entries, allowing you to fill in
the data quickly.
55
Copyright © Mohaimie Mosmin
2: Foundations | 55
4. Flash Fill
▰ Explaining the Flash Fill feature in Excel.
▰ Automatically extracting, combining, or formatting data with
Flash Fill.
56
Copyright © Mohaimie Mosmin
2: Foundations | 56
Flash Fill
▰ Excel's Flash Fill feature automatically detects patterns in your
data and suggests transformations to adjacent columns. For
example, if you have a column with full names, Flash Fill can
split them into separate first name and last name columns.
Flash Fill saves time by intelligently recognizing the patterns
you want to apply and quickly making the necessary changes.
Keyboard Shortcuts
57
58
Copyright © Mohaimie Mosmin
2: Foundations | 58
1. The Importance of Keyboard Shortcuts
▰ Advantages of using keyboard shortcuts in Excel.
▰ Time-saving benefits and improved workflow.
59
Copyright © Mohaimie Mosmin
2: Foundations | 59
The Importance of Keyboard Shortcuts
▰ Keyboard shortcuts are essential for improving productivity
and streamlining workflow in Excel. They enable users to
perform tasks quickly without relying on mouse navigation,
which can be time-consuming. By memorizing and
implementing essential keyboard shortcuts, you can expedite
your work and become a more proficient Excel user.
60
Copyright © Mohaimie Mosmin
2: Foundations | 60
2. Navigational Shortcuts
▰ Essential shortcuts for moving around spreadsheets quickly.
▰ Navigating between worksheets and workbooks.
61
Copyright © Mohaimie Mosmin
2: Foundations | 61
Navigational Shortcuts
▰ Navigational shortcuts allow you to move swiftly through your
spreadsheets, worksheets, and workbooks. For example, using
the arrow keys, Home, End, and Ctrl + Arrow combinations can
take you to specific cells, the start or end of a row/column, or
the beginning or end of the data region.
62
Copyright © Mohaimie Mosmin
2: Foundations | 62
3. Selection Shortcuts
▰ Selecting cells, rows, columns, and entire data ranges
efficiently.
▰ Extending selections with keyboard shortcuts.
63
Copyright © Mohaimie Mosmin
2: Foundations | 63
Selection Shortcuts
▰ Keyboard shortcuts for selection enable you to highlight and
choose cells, rows, columns, or data ranges efficiently.
Shortcuts like Shift + Arrow keys, Ctrl + Shift + Arrow keys, and
Ctrl + A help you save time while selecting data for various
operations.
64
Copyright © Mohaimie Mosmin
2: Foundations | 64
4. Formatting Shortcuts
▰ Quick formatting using keyboard shortcuts (bold, italic,
underline).
▰ Formatting numbers, dates, and text with shortcuts.
65
Copyright © Mohaimie Mosmin
2: Foundations | 65
Formatting Shortcuts
▰ Formatting shortcuts let you quickly format cells, text,
numbers, or dates without using the formatting toolbar or
menu. Common formatting shortcuts include Ctrl + B (bold),
Ctrl + I (italic), Ctrl + U (underline), and Ctrl + Shift + $ (apply
currency format).
66
Copyright © Mohaimie Mosmin
2: Foundations | 66
5. Formula and Function Shortcuts
▰ Accelerating formula creation and editing with keyboard
shortcuts.
▰ Common shortcuts for inserting functions and managing
formulas.
67
Copyright © Mohaimie Mosmin
2: Foundations | 67
Formula and Function Shortcuts
▰ Formula and function shortcuts speed up the process of
creating, editing, and managing formulas in Excel. For
instance, F2 allows you to edit a cell directly, and Ctrl + Shift +
Enter allows you to enter array formulas. Familiarizing yourself
with these shortcuts enhances your proficiency in working
with complex formulas.
Module 3:
Formulas 101
Excel Zero to Hero: Formulas. Functions and Pivot Tables
69
Copyright © Mohaimie Mosmin
3: Formulas 101 | 69
Formula Syntax
▰ Introduction to Excel Formulas
▰ Understanding Cell References (Relative, Absolute, Mixed)
▰ Basic Arithmetic Operators (+, -, *, /)
▰ Order of Operations (BODMAS/PEDMAS)
▰ Using Parentheses to Control Calculation Order
▰ Example: =A1 + (B1 * C1)
70
Copyright © Mohaimie Mosmin
3: Formulas 101 | 70
Formula Syntax
▰ Formula syntax is a fundamental aspect of using Microsoft
Excel effectively. It refers to the structure and rules that
govern how formulas are written in Excel. Understanding
formula syntax is crucial for creating accurate calculations
and performing data analysis. This topic covers concepts like
cell references, arithmetic operators, and order of operations.
Learning the correct formula syntax enables users to harness
the full power of Excel's calculations and automation
capabilities.
71
Copyright © Mohaimie Mosmin
3: Formulas 101 | 71
Conditional Statements and Logical
Operators
▰ What are Conditional Statements?
▰ The Role of Logical Operators (AND, OR, NOT)
▰ Combining Multiple Conditions
▰ Nesting Conditions
▰ Example: =IF(AND(A1 > 10, B1 < 20), "Pass", "Fail")
72
Copyright © Mohaimie Mosmin
3: Formulas 101 | 72
Conditional Statements and Logical
Operators
▰ Conditional statements and logical operators are essential
tools for making decisions based on specific conditions in
Excel. This topic explores how to use logical operators like
AND, OR, and NOT to create complex conditions for data
analysis. By applying conditional statements, users can
automate processes and customize responses based on
different scenarios, improving the efficiency and accuracy of
their Excel worksheets.
73
Copyright © Mohaimie Mosmin
3: Formulas 101 | 73
IF Statements
▰ Introduction to the IF Function
▰ Syntax of the IF Function
▰ Using IF with Text and Numbers
▰ Nesting IF Statements for Complex Conditions
▰ Example: =IF(A1 > 50, "Above Target", "Below Target")
74
Copyright © Mohaimie Mosmin
3: Formulas 101 | 74
IF Statements
▰ The IF statement is a versatile and widely used function in
Excel. It allows users to perform actions based on whether a
specific condition is met or not. This topic covers the syntax
and usage of IF statements, showcasing how they can be
employed with text and numerical data. By mastering IF
statements, users can create dynamic and customized
responses within their Excel sheets, tailoring outputs based on
changing input conditions.
75
Copyright © Mohaimie Mosmin
3: Formulas 101 | 75
AND/OR Operators
▰ Understanding the AND Function
▰ Syntax and Usage of the AND Function
▰ Combining Multiple Conditions with AND
▰ Understanding the OR Function
▰ Syntax and Usage of the OR Function
▰ Combining Multiple Conditions with OR
▰ Example: =IF(AND(A1 > 10, OR(B1 = "Yes", C1 = "Yes")),
"Approved", "Not Approved")
76
Copyright © Mohaimie Mosmin
3: Formulas 101 | 76
AND/OR Operators
▰ The AND and OR operators are logical functions that allow
users to combine multiple conditions in Excel. This topic
delves into how these operators work and how to use them
effectively within IF statements and other functions. By
employing AND and OR operators, users can create more
sophisticated decision-making processes, taking multiple
criteria into account for precise data analysis and reporting.
77
Copyright © Mohaimie Mosmin
3: Formulas 101 | 77
NOT & "<>" Conditionals
▰ The Role of NOT Function in Conditional Statements
▰ Syntax and Usage of the NOT Function
▰ Using NOT to Reverse Conditions
▰ Understanding "<>" Operator
▰ Using "<>" to Check for Non-Equality
▰ Example: =IF(NOT(A1 = "Open"), "Closed", "Open")
78
Copyright © Mohaimie Mosmin
3: Formulas 101 | 78
NOT & "<>" Conditionals
▰ The NOT function and the "<>" operator are essential for
handling negative conditions and non-equality comparisons in
Excel. This topic explains how to use the NOT function to
reverse conditions and the "<>" operator to check for non-
equality between values. By incorporating NOT and "<>"
conditionals, users can refine their formulas to handle
exceptions and unique situations in their data.
79
Copyright © Mohaimie Mosmin
3: Formulas 101 | 79
IS Statements
▰ Introduction to IS Functions (ISBLANK, ISTEXT, ISNUMBER,
etc.)
▰ Syntax and Usage of Various IS Functions
▰ Checking Cell Types and Values
▰ Combining IS Functions with IF Statements
▰ Example: =IF(ISBLANK(A1), "Blank", "Not Blank")
80
Copyright © Mohaimie Mosmin
3: Formulas 101 | 80
IS Statements
▰ IS statements, such as ISBLANK, ISTEXT, and ISNUMBER, are
valuable for verifying cell types and values in Excel. This topic
covers the different IS functions and demonstrates how they
can be used within IF statements to create robust data
validation processes. By applying IS statements, users can
ensure data consistency and reliability, identifying empty cells
or verifying the format of data before performing calculations.
81
Copyright © Mohaimie Mosmin
3: Formulas 101 | 81
Common Error Types
▰ Understanding Common Formula Errors (e.g., #DIV/0!,
#VALUE!, #NAME?, #REF!, #N/A, #NUM!)
▰ Identifying Causes of Errors
▰ How to Troubleshoot and Fix Errors
▰ Example: =A1/B1 (results in #DIV/0! error if B1 is zero)
82
Copyright © Mohaimie Mosmin
3: Formulas 101 | 82
Common Error Types
▰ Errors are a common occurrence when working with complex
Excel formulas. This topic explores the most frequent error
types, such as #DIV/0!, #VALUE!, and #N/A, and provides
insights into their causes. Understanding common errors
enables users to identify and resolve formula issues
effectively, ensuring the accuracy and reliability of their
calculations.
83
Copyright © Mohaimie Mosmin
3: Formulas 101 | 83
Evaluate Formula and Error Checking
▰ Using "Evaluate Formula" Tool for Step-by-Step Evaluation
▰ Identifying Errors with "Error Checking" Feature
▰ How to Use Tracing Arrows to Track Formula Precedents and
Dependents
▰ Example: Evaluate Formula for =SUM(A1:A5)/B1
84
Copyright © Mohaimie Mosmin
3: Formulas 101 | 84
Evaluate Formula and Error Checking
▰ The "Evaluate Formula" tool and "Error Checking" feature are
valuable resources in Excel for troubleshooting complex
formulas. This topic explains how to use these tools to step-
by-step evaluate formula components and identify errors in
worksheets. By mastering the evaluate formula and error
checking functionalities, users can become more proficient at
locating and correcting formula-related issues in Excel.
Module 4:
Functions
Excel Zero to Hero: Formulas. Functions and Pivot Tables
86
Copyright © Mohaimie Mosmin
4: Functions | 86
Date and Time Functions
▰ Introduction to Date and Time Functions in Excel
▰ Working with Dates and Times in Excel
▻ Displaying Dates and Times in Different Formats
▻ Extracting Date Components (Year, Month, Day)
▻ Calculating Age from Birthdates
▰ Date and Time Calculations
▻ Adding or Subtracting Days, Months, or Years
▻ Finding the Difference Between Two Dates
▰ Example: =TODAY() - B1 (calculates the days between today and the
date in cell B1)
87
Copyright © Mohaimie Mosmin
4: Functions | 87
Date and Time Functions
▰ Excel provides a range of powerful date and time functions to
manipulate and analyze date-related data. These functions
allow users to display dates and times in various formats,
extract specific components (such as year, month, or day),
and perform date calculations like finding the difference
between two dates. For instance, you can use the TODAY()
function to get the current date and subtract a birthdate from
it to calculate a person's age.
88
Copyright © Mohaimie Mosmin
4: Functions | 88
Text Functions
▰ Overview of Text Functions in Excel
▰ Concatenating Text Strings
▻ Combining Text from Different Cells
▻ Inserting Delimiters Between Text Items
▰ Extracting Text Substrings
▻ Using LEFT, RIGHT, and MID functions
▻ Finding Text Position with FIND and SEARCH functions
▰ Changing Text Case
▻ Converting to UPPERCASE, lowercase, or Proper Case
▰ Example: =CONCATENATE(A1, " - ", B1) (joins the text in cells A1 and B1 with a
hyphen)
89
Copyright © Mohaimie Mosmin
4: Functions | 89
Text Functions
▰ Text functions in Excel enable users to manipulate and format
text data efficiently. From combining text from different cells
using CONCATENATE to extracting substrings using LEFT,
RIGHT, and MID functions, Excel offers a wide array of tools to
work with text. Text functions are invaluable when dealing with
datasets containing names, addresses, product descriptions,
or any text-based information that requires reformatting or
reorganizing.
90
Copyright © Mohaimie Mosmin
4: Functions | 90
Math Functions
▰ Introduction to Math Functions in Excel
▰ Basic Arithmetic Functions
▻ Addition, Subtraction, Multiplication, Division
▰ Rounding and Truncating Numbers
▻ ROUND, ROUNDUP, ROUNDDOWN functions
▻ INT and TRUNC functions
▰ Exponential and Logarithmic Functions
▻ POWER, EXP, LN, LOG functions
▰ Example: =AVERAGE(A1:A10) (calculates the average of values in
cells A1 to A10)
91
Copyright © Mohaimie Mosmin
4: Functions | 91
Math Functions
▰ Excel's math functions allow users to perform basic arithmetic
operations, round numbers, and carry out exponential or
logarithmic calculations. Functions like AVERAGE, SUM, and
COUNT provide quick insights into numerical data, while
POWER and LOG are useful for more advanced calculations.
Whether it's calculating totals, averages, or complex
mathematical operations, Excel's math functions streamline
data analysis and enhance the accuracy of results.
92
Copyright © Mohaimie Mosmin
4: Functions | 92
Statistical Functions
▰ Overview of Statistical Functions in Excel
▰ Measures of Central Tendency
▻ AVERAGE, MEDIAN, MODE functions
▰ Measures of Dispersion
▻ MIN, MAX functions
▻ RANGE, STDEV, VAR functions
▰ Frequency Distribution and Histograms
▻ COUNTIF, FREQUENCY functions
▰ Example: =COUNTIF(A1:A10, ">50") (counts the number of values
greater than 50 in cells A1 to A10)
93
Copyright © Mohaimie Mosmin
4: Functions | 93
Statistical Functions
▰ Statistical functions in Excel are indispensable for analyzing
datasets and drawing meaningful conclusions. Functions like
AVERAGE, MEDIAN, and MODE provide measures of central
tendency, while MIN and MAX determine the range of data.
Standard deviation (STDEV) and variance (VAR) offer insights
into data dispersion. These statistical functions are essential
for summarizing data and identifying key trends or outliers.
94
Copyright © Mohaimie Mosmin
4: Functions | 94
Lookup Functions
▰ Introduction to Lookup Functions in Excel
▰ VLOOKUP Function
▻ Searching for Data in a Vertical Table
▻ Retrieving Data from Other Columns
▰ HLOOKUP Function
▻ Searching for Data in a Horizontal Table
▻ Retrieving Data from Other Rows
▰ INDEX and MATCH Functions
▻ More Flexible Lookup Options
▰ Example: =VLOOKUP(A1, B1:C10, 2, FALSE) (finds the value in the second
column of the range B1:C10 that matches the value in cell A1)
95
Copyright © Mohaimie Mosmin
4: Functions | 95
Lookup Functions
▰ Excel's lookup functions are essential for finding and retrieving
specific information from large datasets. The VLOOKUP
function searches for a value in the leftmost column of a table
and returns the corresponding value from another column. The
HLOOKUP function works similarly but searches for data in the
top row of a table. INDEX and MATCH functions offer more
flexible lookup options, allowing users to perform lookups
vertically, horizontally, and across multiple columns or rows.
96
Copyright © Mohaimie Mosmin
4: Functions | 96
Logical Functions
▰ Understanding Logical Functions in Excel
▰ IF Function
▻ Basic IF Statement Syntax
▻ Nested IF Statements for Complex Conditions
▰ AND and OR Functions
▻ Combining Multiple Conditions
▰ NOT Function
▻ Reversing Logical Values
▰ Example: =IF(A1 > 10, "Pass", "Fail") (checks if the value in cell A1 is
greater than 10 and returns "Pass" if true, "Fail" if false)
97
Copyright © Mohaimie Mosmin
4: Functions | 97
Logical Functions
▰ Logical functions in Excel facilitate decision-making and
automate data analysis based on specific conditions. The IF
function is a cornerstone of logical functions, enabling users
to perform actions based on whether a condition is true or
false. Users can nest multiple IF statements for more complex
scenarios. Additionally, the AND and OR functions allow for
combining multiple conditions, while the NOT function
reverses logical values. Logical functions provide the
foundation for data validation, custom reporting, and dynamic
data analysis in Excel.
Module 5:
Pivot Tables
(Foundation)
Excel Zero to Hero: Formulas. Functions and Pivot Tables
99
Copyright © Mohaimie Mosmin
6: Pivot Tables (Foundations) |
Introduction
99
▰ Microsoft Excel's Pivot Tables are powerful tools for data
analysis and reporting. They enable users to transform raw data
into meaningful summaries, making it easier to identify trends,
patterns, and insights. By summarizing large datasets, applying
different calculations, and visualizing data through Pivot Charts,
users can gain valuable business intelligence and streamline
decision-making processes.
100
Copyright © Mohaimie Mosmin
6: Pivot Tables (Foundations) |
Creating a Basic Pivot Table Report
100
▰ Introduction to Pivot Tables and their benefits
▰ Selecting the data range for the Pivot Table
▰ Creating a new Pivot Table from the data
▰ Choosing row and column fields for organization
▰ Adding data fields to summarize values
▰ Example: Creating a Pivot Table to summarize sales data by
product category and region.
101
Copyright © Mohaimie Mosmin
6: Pivot Tables (Foundations) |
Creating a Basic Pivot Table Report
101
▰ Creating a Basic Pivot Table Report is the foundational topic for
understanding and utilizing Pivot Tables in Microsoft Excel. It
covers the process of transforming raw data into a meaningful
summary by selecting the data range, setting row and column
fields for organization, and adding data fields to calculate
values. By creating a Pivot Table, users can quickly analyze data
and gain insights without the need for complex formulas or
manual calculations.
102
Copyright © Mohaimie Mosmin
6: Pivot Tables (Foundations) |
Aggregation and Grouping
102
▰ Understanding aggregation functions (SUM, COUNT, AVERAGE,
etc.)
▰ Grouping data by date, number ranges, or custom categories
▰ Calculating percentages and other summary statistics
▰ Example: Grouping sales data by quarter to view quarterly
performance.
103
Copyright © Mohaimie Mosmin
6: Pivot Tables (Foundations) |
Aggregation and Grouping
103
▰ Aggregation and Grouping expand on the capabilities of Pivot
Tables, allowing users to summarize data using various
aggregation functions like SUM, COUNT, and AVERAGE.
Grouping data helps organize information by date, numerical
ranges, or custom categories. This topic enables users to
generate more sophisticated reports and explore data patterns
by applying different grouping techniques.
104
Copyright © Mohaimie Mosmin
6: Pivot Tables (Foundations) |
Formatting Values
104
▰ Formatting numeric values in the Pivot Table
▰ Applying currency, number formatting, and decimals
▰ Displaying values as percentages or scientific notation
▰ Example: Formatting revenue values to display in currency
format.
105
Copyright © Mohaimie Mosmin
6: Pivot Tables (Foundations) |
Formatting Values
105
▰ Formatting Values is essential for presenting data effectively in
Pivot Tables. This topic covers formatting numeric values to
display currency, percentages, or scientific notation. Properly
formatted values make the Pivot Table more reader-friendly and
enhance the visual representation of data.
106
Copyright © Mohaimie Mosmin
6: Pivot Tables (Foundations) |
Layout Options
106
▰ Configuring the Pivot Table layout (compact, outline, tabular)
▰ Adjusting subtotals and grand totals display
▰ Enabling or disabling row and column headers
▰ Example: Switching between compact and tabular layout for
different views.
107
Copyright © Mohaimie Mosmin
6: Pivot Tables (Foundations) |
Layout Options
107
▰ The Layout Options topic focuses on the appearance and
arrangement of Pivot Tables. Users can choose between
compact, outline, or tabular layout styles, depending on the
preferred structure for data display. They can also control the
display of subtotals and grand totals. Understanding layout
options enables users to tailor the Pivot Table appearance to
their specific reporting needs.
108
Copyright © Mohaimie Mosmin
6: Pivot Tables (Foundations) |
Formatting Pivot Tables
108
▰ Customizing Pivot Table appearance (font, cell colors, borders)
▰ Using Pivot Table styles and themes
▰ Conditional formatting to highlight data trends
▰ Example: Applying a custom style and conditional formatting to
emphasize top-performing products.
109
Copyright © Mohaimie Mosmin
6: Pivot Tables (Foundations) |
Formatting Pivot Tables
109
▰ Formatting Pivot Tables enhances their visual appeal and
ensures a consistent look with the rest of the workbook. Users
can customize fonts, cell colors, borders, and apply styles or
themes to match their brand or corporate design. This topic
also covers using conditional formatting to highlight specific
data trends for better data analysis.
110
Copyright © Mohaimie Mosmin
6: Pivot Tables (Foundations) |
Sorting and Filtering
110
▰ Sorting data within the Pivot Table
▰ Filtering data using slicers and filters
▰ Applying multiple filters for precise data analysis
▰ Example: Sorting products by sales revenue in descending
order.
111
Copyright © Mohaimie Mosmin
6: Pivot Tables (Foundations) |
Sorting and Filtering
111
▰ Sorting and Filtering in Pivot Tables allows users to reorganize
data for better insights and focus on specific subsets of
information. This topic explains how to sort data within the
Pivot Table and apply filters using slicers and filters for easy
data exploration and analysis.
112
Copyright © Mohaimie Mosmin
6: Pivot Tables (Foundations) |
Creating Pivot Charts
112
▰ Converting Pivot Table data into Pivot Charts
▰ Choosing chart types (column, bar, line, pie, etc.)
▰ Formatting and customizing Pivot Charts
▰ Example: Creating a column chart to visualize regional sales
performance.
113
Copyright © Mohaimie Mosmin
6: Pivot Tables (Foundations) |
Creating Pivot Charts
113
▰ Creating Pivot Charts extends the capabilities of Pivot Tables by
transforming data summaries into visual representations like
column, bar, line, pie, or other chart types. Pivot Charts provide
a more intuitive way to understand data trends and patterns,
enhancing data-driven decision-making.
114
Copyright © Mohaimie Mosmin
6: Pivot Tables (Foundations) |
Applying Conditional Formatting
114
▰ Using conditional formatting within Pivot Tables
▰ Highlighting data based on specific rules and criteria
▰ Applying color scales, data bars, and icon sets
▰ Example: Applying conditional formatting to highlight above-
average sales regions.
115
Copyright © Mohaimie Mosmin
6: Pivot Tables (Foundations) |
Applying Conditional Formatting
115
▰ Applying Conditional Formatting in Pivot Tables enables users
to highlight data based on specific rules or criteria. This topic
covers using color scales, data bars, and icon sets to visualize
data variations easily. Conditional formatting allows users to
identify outliers or key performance indicators at a glance.
116
Copyright © Mohaimie Mosmin
6: Pivot Tables (Foundations) |
Updating Pivot Tables and Pivot Charts
116
▰ Refreshing Pivot Tables to update data
▰ Handling new data and additional fields
▰ Keeping Pivot Charts in sync with updated Pivot Tables
▰ Example: Adding new sales data and refreshing the Pivot Table
to include the latest information.
117
Copyright © Mohaimie Mosmin
6: Pivot Tables (Foundations) |
Updating Pivot Tables and Pivot Charts
117
▰ Updating Pivot Tables and Pivot Charts ensures that the latest
data is reflected accurately in the reports. This topic explains
how to refresh Pivot Tables after modifying the source data and
how to handle new data or additional fields. Users can keep
their reports up-to-date without starting from scratch each time
new information is added.
Module 6:
Pivot Tables
(Advanced)
Excel Zero to Hero: Formulas. Functions and Pivot Tables
119
Copyright © Mohaimie Mosmin
6: Pivot Tables (Advanced) | 119
Manipulating Pivot Tables
▰ Adding and Removing Fields
▰ Rearranging Row and Column Fields
▰ Changing Summary Functions (SUM, COUNT, AVERAGE, etc.)
▰ Customizing the Pivot Table Layout
▰ Example: Adding a new calculated field to the Pivot Table to
calculate profit margins.
120
Copyright © Mohaimie Mosmin
6: Pivot Tables (Advanced) | 120
Manipulating Pivot Tables
▰ Manipulating Pivot Tables refers to the various actions users
can perform to modify and fine-tune the structure and content
of their Pivot Tables in Microsoft Excel. This topic covers
essential techniques for adding, removing, and rearranging
fields, changing the summary functions, and customizing the
Pivot Table layout. By mastering these skills, users can
effortlessly tailor their Pivot Tables to present data in the most
meaningful and actionable way.
121
Copyright © Mohaimie Mosmin
6: Pivot Tables (Advanced) | 121
Formatting Pivot Tables
▰ Formatting Fonts, Colors, and Borders
▰ Applying Conditional Formatting to Visualize Data
▰ Creating Custom Pivot Table Styles
▰ Example: Using conditional formatting to highlight cells with
sales above a certain target.
122
Copyright © Mohaimie Mosmin
6: Pivot Tables (Advanced) | 122
Formatting Pivot Tables
▰ Formatting Pivot Tables focuses on enhancing the visual
appeal and clarity of Pivot Tables. This topic covers a range of
formatting options, including adjusting font styles, colors, cell
borders, and applying conditional formatting to highlight data
patterns. By using formatting techniques, users can create
polished and professional-looking Pivot Tables that effectively
communicate insights and analysis.
123
Copyright © Mohaimie Mosmin
6: Pivot Tables (Advanced) | 123
Value Field Settings
▰ Changing Summary Calculation Type (e.g., SUM to AVERAGE)
▰ Formatting Numeric Values
▰ Displaying Values as Percentages or Running Totals
▰ Example: Changing the value field settings to show revenue as
a percentage of the total sales.
124
Copyright © Mohaimie Mosmin
6: Pivot Tables (Advanced) | 124
Value Field Settings
▰ Value Field Settings delve into advanced options for
customizing how values are summarized and displayed in
Pivot Tables. This topic covers changing the summary
calculation type, formatting numeric values, and displaying
values as percentages or running totals. Understanding value
field settings empowers users to present data more accurately
and in a format that suits their reporting needs.
125
Copyright © Mohaimie Mosmin
6: Pivot Tables (Advanced) | 125
Sorting and Filtering
▰ Sorting Data within the Pivot Table
▰ Applying Filters to Display Specific Data
▰ Filtering by Conditions and Top/Bottom Values
▰ Example: Sorting products by sales revenue in descending
order to identify top-selling products.
126
Copyright © Mohaimie Mosmin
6: Pivot Tables (Advanced) | 126
Sorting and Filtering
▰ Sorting and Filtering in Pivot Tables provide powerful data
exploration capabilities. This topic explains how to sort data
by specific criteria and apply filters to focus on relevant
information. Users can sort in ascending or descending order
and filter data based on conditions or top/bottom values.
Mastering sorting and filtering allows for quick data analysis
and identification of key insights.
127
Copyright © Mohaimie Mosmin
6: Pivot Tables (Advanced) | 127
Calculations
▰ Creating Calculated Fields
▰ Using Calculated Items for Advanced Analysis
▰ Example: Adding a calculated field to calculate the profit
margin based on sales and expenses.
128
Copyright © Mohaimie Mosmin
6: Pivot Tables (Advanced) | 128
Calculations
▰ Calculations in Pivot Tables involve creating custom
calculations beyond the standard summary functions. This
topic covers using calculated fields and calculated items to
perform complex calculations based on existing Pivot Table
data. By adding calculations, users can derive deeper insights
and generate additional metrics for their analysis.
129
Copyright © Mohaimie Mosmin
6: Pivot Tables (Advanced) | 129
Dashboards
▰ Designing Interactive Dashboards
▰ Using Pivot Tables and Pivot Charts for Data Visualization
▰ Incorporating Slicers for User Interactivity
▰ Example: Creating a sales dashboard with interactive slicers to
filter data by region and product category.
130
Copyright © Mohaimie Mosmin
6: Pivot Tables (Advanced) | 130
Dashboards
▰ Dashboards are interactive and visually appealing reports that
display key performance indicators and data insights in a
concise and user-friendly format. This topic introduces the
concept of using Pivot Tables and Pivot Charts to create
dynamic dashboards for data visualization. By incorporating
slicers and interactivity, users can build informative
dashboards for data-driven decision-making.

Excel Zero to Hero-Formulas, Functions and Pivot Tables

  • 1.
    ZERO TO HEROIN FORMULAS, FUNCTIONS, AND PIVOT TABLES Excel Prepared by Mohaimie Mosmin © 2023
  • 2.
    TABLE OF CONTENTS– EXCEL FORMULAS, FUNCTIONS & PIVOT TABLES 3 1 3 5 6 4 2 INTRODUCTION FORMULAS 101 PIVOT TABLES (FOUNDATIONS) FOUNDATIONS FUNCTIONS PIVOT TABLES (ADVANCED) HERO
  • 3.
  • 4.
    Module 1: Introduction ZEROTO HERO IN FORMULA, FUNCTIONS, AND PIVOT TABLES 1 6
  • 5.
    7 Copyright © MohaimieMosmin 1: Introduction | 7 Preparing and Understanding Dataset ▰ Preparing and understanding the dataset is a critical step in the data analysis process, and Microsoft Excel provides a powerful platform for handling and exploring data effectively. Before diving into data analysis or visualization, it is essential to ensure that the dataset is clean, structured, and organized. This involves importing the data into Excel, performing data cleaning tasks like removing duplicates, handling missing values, and correcting errors.
  • 6.
    8 Copyright © MohaimieMosmin 1: Introduction | 8 Preparing and Understanding Dataset ▰ Understanding the dataset entails gaining insights into its structure, variables, and relationships, which allows users to make informed decisions on how to proceed with the analysis. By investing time in preparing and comprehending the dataset, Excel users can unlock its full potential and extract valuable information, leading to more accurate and actionable data-driven outcomes.
  • 7.
    9 Copyright © MohaimieMosmin 1: Introduction | 9 1. Importing Data ▰ Use Excel's data import tools (e.g., Data tab > Get Data, or opening CSV/Text files) to bring data into the workbook. ▰ Ensure the data is properly formatted and organized, making it easy to work with.
  • 8.
    10 Copyright © MohaimieMosmin 1: Introduction | 10 2. Data Cleaning ▰ Identify and handle duplicate records to avoid redundant information. ▰ Deal with missing values by either filling them in or removing rows with missing data. ▰ Correct errors or inconsistencies in the dataset to ensure accuracy.
  • 9.
    11 Copyright © MohaimieMosmin 1: Introduction | 11 3. Structuring Data ▰ Arrange data in a tabular format with rows representing individual records and columns representing variables. ▰ Ensure each column contains a single type of data for consistency and analysis ease.
  • 10.
    12 Copyright © MohaimieMosmin 1: Introduction | 12 4. Organizing and Renaming Columns ▰ Rename columns with descriptive names for clarity and better understanding. ▰ Organize columns logically to group related variables together.
  • 11.
    13 Copyright © MohaimieMosmin 1: Introduction | 13 5. Understanding Data Types ▰ Identify data types for each column (e.g., numeric, text, date) to perform appropriate calculations and analyses.
  • 12.
    14 Copyright © MohaimieMosmin 1: Introduction | 14 6. Data Summary ▰ Generate summary statistics (e.g., count, mean, median, standard deviation) for numeric data to gain a general understanding of the dataset's distribution. ▰ Use Excel's functions like COUNT, AVERAGE, MIN, MAX, etc., for quick summaries.
  • 13.
    15 Copyright © MohaimieMosmin 1: Introduction | 15 7. Data Visualization ▰ Create basic charts (e.g., bar charts, pie charts, line charts) to visualize the distribution and relationships between variables. ▰ Use Excel's charting tools to explore data patterns and trends visually.
  • 14.
    16 Copyright © MohaimieMosmin 1: Introduction | 16 8. Identifying Outliers and Anomalies ▰ Plotting data on scatter plots or box plots helps identify outliers or unusual data points. ▰ Investigate and verify outliers to determine if they are valid or require further handling.
  • 15.
    17 Copyright © MohaimieMosmin 1: Introduction | 17 9. Data Relationships and Correlations ▰ Analyze correlations between variables using Excel's correlation functions (e.g., CORREL). ▰ Identify any significant relationships that may impact the analysis.
  • 16.
    18 Copyright © MohaimieMosmin 1: Introduction | 18 10.Data Validations ▰ Set up data validations to restrict entries within certain ranges or criteria, ensuring data integrity. ▰ Use drop-down lists or input messages to guide users in entering correct data.
  • 17.
    19 Copyright © MohaimieMosmin 1: Introduction | 19 11.Handling Data Updates ▰ Consider how new data will be incorporated into the existing dataset. ▰ Plan for updating and refreshing the dataset to keep it current for ongoing analysis.
  • 18.
    20 Copyright © MohaimieMosmin 1: Introduction | 20 Introduction to Excel Formula, Functions, and Pivot Tables ▰ Microsoft Excel is a powerful spreadsheet software widely used for data analysis, calculations, and reporting in various industries and fields. Understanding Excel's core features, including formulas, functions, and Pivot Tables, is essential for maximizing its potential in handling complex datasets.
  • 19.
    21 Copyright © MohaimieMosmin 1: Introduction | 21 Introduction to Excel Formula, Functions, and Pivot Tables ▰ Excel formulas provide a way to perform calculations and manipulate data dynamically. By using functions, users can streamline calculations and simplify repetitive tasks. ▰ Pivot Tables, on the other hand, allow for quick data summarization and analysis, providing valuable insights without the need for complex formulas or manual data manipulation.
  • 20.
    22 Copyright © MohaimieMosmin 1: Introduction | 22 Introduction to Excel Formula, Functions, and Pivot Tables ▰ Formulas in Excel are built on a foundation of cell references and arithmetic operators. By combining these elements, users can perform a wide range of mathematical operations, such as addition, subtraction, multiplication, and division. ▰ Excel also supports advanced functions, enabling users to carry out complex calculations, logical evaluations, text manipulations, and date and time operations. This flexibility empowers users to handle large datasets efficiently and derive meaningful results with minimal effort.
  • 21.
    23 Copyright © MohaimieMosmin 1: Introduction | 23 Introduction to Excel Formula, Functions, and Pivot Tables ▰ Pivot Tables serve as a game-changer in Excel, offering a dynamic and interactive way to summarize and analyze data. They allow users to reorganize data and gain insights through simple drag-and-drop operations. Pivot Tables aggregate and group data, perform calculations, and create customizable reports with ease.
  • 22.
    24 Copyright © MohaimieMosmin 1: Introduction | 24 Introduction to Excel Formula, Functions, and Pivot Tables ▰ In conclusion, Excel’s formulas, functions and Pivot Tables enable users to spot trends, patterns, and outliers in the data quickly. Together, these tools provide a comprehensive set of tools that facilitate data analysis, enhance decision-making, and simplify complex data tasks for users of all skill levels.
  • 23.
    Module 2: Foundations Excel Zeroto Hero: Formulas. Functions and Pivot Tables
  • 24.
  • 25.
    27 Copyright © MohaimieMosmin 2: Foundations | 27 Introduction to Sorting ▰ What is data sorting? ▰ Importance of organizing data for analysis and presentation.
  • 26.
    28 Copyright © MohaimieMosmin 2: Foundations | 28 Introduction to Sorting ▰ Sorting data is the process of arranging information in a logical order, making it easier to analyze and present. In spreadsheets like Microsoft Excel, sorting plays a crucial role in data management and decision-making. By organizing data systematically, you can identify patterns, trends, and outliers more effectively. Sorting is particularly useful when dealing with large datasets, as it allows you to locate specific information quickly. Whether you're dealing with numerical data, text values, or dates, mastering the art of sorting empowers you to work with your data efficiently.
  • 27.
    29 Copyright © MohaimieMosmin 2: Foundations | 29 Sorting Basics ▰ How to access the sorting options in Excel. ▰ Sorting data in ascending and descending order. ▰ Sorting by single or multiple columns.
  • 28.
    30 Copyright © MohaimieMosmin 2: Foundations | 30 Sorting Basics ▰ Sorting in Excel is straightforward. To get started, select the data range you want to sort, go to the "Data" tab, and click on the "Sort" button. You can sort in ascending or descending order based on a single column. For more complex sorting, you can sort by multiple columns, which lets you prioritize data based on different criteria. For instance, you can sort sales data first by region and then by date, providing a comprehensive view of sales performance in each region over time.
  • 29.
    31 Copyright © MohaimieMosmin 2: Foundations | 31 Sorting Numerical Data ▰ Sorting numerical data by value. ▰ Handling empty cells and special characters during sorting.
  • 30.
    32 Copyright © MohaimieMosmin 2: Foundations | 32 Sorting Numerical Data ▰ When sorting numerical data, Excel considers the actual values of the cells. It arranges numbers from the smallest to the largest in ascending order and vice versa in descending order. Excel also handles empty cells and special characters during sorting, ensuring that your data remains accurate and well-structured. This is crucial when dealing with datasets that involve various data types and may contain empty cells or non- numeric characters.
  • 31.
    33 Copyright © MohaimieMosmin 2: Foundations | 33 Sorting Text Data ▰ Sorting text data alphabetically. ▰ Custom sorting options for specific text criteria.
  • 32.
    34 Copyright © MohaimieMosmin 2: Foundations | 34 Sorting Text Data ▰ Sorting text data in alphabetical order is a common requirement when dealing with lists of names, titles, or categories. Excel allows you to sort text values efficiently, treating uppercase and lowercase letters as distinct. Additionally, you can create custom sorting orders to arrange text data based on specific criteria. For instance, you might want to sort product names based on priority or category instead of the default alphabetical order.
  • 33.
    35 Copyright © MohaimieMosmin 2: Foundations | 35 Sorting Dates and Times ▰ Sorting data by date or time values. ▰ Handling date and time formats during sorting.
  • 34.
    36 Copyright © MohaimieMosmin 2: Foundations | 36 Sorting Dates and Times ▰ Excel provides seamless sorting of date and time data, allowing you to arrange events chronologically. Whether you're working with sales records, project timelines, or event schedules, sorting by date or time helps you identify trends and historical patterns. Excel recognizes various date and time formats, ensuring accurate sorting regardless of the date display format in your dataset. This flexibility is essential when dealing with datasets from different sources or regions.
  • 35.
  • 36.
    38 Copyright © MohaimieMosmin 2: Foundations | 38 1. Introduction to Filtering ▰ What is data filtering? ▰ The purpose of using filters in data analysis.
  • 37.
    39 Copyright © MohaimieMosmin 2: Foundations | 39 Introduction to Filtering ▰ Filtering data involves displaying only the specific information that meets certain criteria, hiding irrelevant data temporarily. Filtering is a powerful tool for data analysis, as it allows you to focus on specific subsets of data and draw meaningful insights. Whether you want to extract sales data for a particular region or identify products with low inventory levels, filtering enables you to drill down into your dataset effectively.
  • 38.
    40 Copyright © MohaimieMosmin 2: Foundations | 40 2. Filter Basics ▰ How to apply filters to data in Excel. ▰ Filtering by single or multiple criteria.
  • 39.
    41 Copyright © MohaimieMosmin 2: Foundations | 41 Filter Basics ▰ Applying filters in Excel is easy. Select the data range, go to the "Data" tab, and click on the "Filter" button. Filter arrows appear in the column headers, and you can choose the data you want to display by selecting the desired criteria. You can filter data based on single or multiple conditions simultaneously, refining your data view to show only what's relevant.
  • 40.
    42 Copyright © MohaimieMosmin 2: Foundations | 42 3. Text and Number Filters ▰ Filtering data based on text values (e.g., contains, starts with). ▰ Filtering data using number-based conditions (e.g., greater than, between).
  • 41.
    43 Copyright © MohaimieMosmin 2: Foundations | 43 Text and Number Filters ▰ Filtering data based on text values involves using various conditions like "contains," "starts with," or "ends with." For instance, you can filter a customer list to show only those with a specific area code in their phone numbers. Similarly, number filters allow you to display data that falls within a specified range, such as showing products with prices between a minimum and maximum value.
  • 42.
    44 Copyright © MohaimieMosmin 2: Foundations | 44 4. Date and Time Filters ▰ Filtering data by specific date ranges or periods. ▰ Using relative date filters for dynamic analysis.
  • 43.
    45 Copyright © MohaimieMosmin 2: Foundations | 45 Date and Time Filters ▰ Filtering data by date or time is essential for analyzing trends over specific periods. Excel offers various options to filter data by date ranges, including custom date ranges and relative date filters like "This Month" or "Last Quarter." You can also use date filters to show data for a specific day, month, or year.
  • 44.
    46 Copyright © MohaimieMosmin 2: Foundations | 46 5. Advanced Filtering Options ▰ Utilizing custom filters and advanced criteria. ▰ Combining filters for more complex data analysis.
  • 45.
    47 Copyright © MohaimieMosmin 2: Foundations | 47 Advanced Filtering Options ▰ Excel provides advanced filtering options to perform more complex data analysis. Custom filters allow you to create complex criteria using operators like AND and OR, providing highly specific data views. By combining multiple filters, you can refine your data analysis to a granular level and draw precise conclusions from your dataset.
  • 46.
    Auto Filling Patternsand Formulas 48
  • 47.
    49 Copyright © MohaimieMosmin 2: Foundations | 49 1. Introduction to Auto Filling ▰ How Auto Fill simplifies data entry and repetitive tasks. ▰ Auto Filling series of numbers, dates, and text patterns.
  • 48.
    50 Copyright © MohaimieMosmin 2: Foundations | 50 Introduction to Auto Filling ▰ Auto Fill is a powerful feature in Excel that simplifies data entry and repetitive tasks. It automatically extends a series of data, such as numbers, dates, or text patterns, based on your initial input. Auto Fill saves time and reduces errors in data entry, making it an essential tool for working efficiently with large datasets.
  • 49.
    51 Copyright © MohaimieMosmin 2: Foundations | 51 2. Auto Filling Formulas ▰ Copying formulas automatically using Auto Fill. ▰ Adjusting cell references during Auto Fill.
  • 50.
    52 Copyright © MohaimieMosmin 2: Foundations | 52 Auto Filling Formulas ▰ One of the most significant advantages of Auto Fill is its ability to copy and adjust formulas automatically. For example, if you have a formula to calculate the total sales for a single product, Auto Fill can extend the formula to calculate totals for all products in your dataset. Excel automatically adjusts cell references in the formula to match the new location, ensuring accurate results.
  • 51.
    53 Copyright © MohaimieMosmin 2: Foundations | 53 3. Auto Filling with Custom Lists ▰ Creating and using custom lists for Auto Fill. ▰ Applying custom lists in various scenarios.
  • 52.
    54 Copyright © MohaimieMosmin 2: Foundations | 54 Auto Filling with Custom Lists ▰ Excel allows you to create custom lists that you can use for Auto Fill purposes. For instance, if you have a specific set of names or department codes that you use frequently, you can create a custom list. When you begin typing an item from the list, Excel predicts the rest of the entries, allowing you to fill in the data quickly.
  • 53.
    55 Copyright © MohaimieMosmin 2: Foundations | 55 4. Flash Fill ▰ Explaining the Flash Fill feature in Excel. ▰ Automatically extracting, combining, or formatting data with Flash Fill.
  • 54.
    56 Copyright © MohaimieMosmin 2: Foundations | 56 Flash Fill ▰ Excel's Flash Fill feature automatically detects patterns in your data and suggests transformations to adjacent columns. For example, if you have a column with full names, Flash Fill can split them into separate first name and last name columns. Flash Fill saves time by intelligently recognizing the patterns you want to apply and quickly making the necessary changes.
  • 55.
  • 56.
    58 Copyright © MohaimieMosmin 2: Foundations | 58 1. The Importance of Keyboard Shortcuts ▰ Advantages of using keyboard shortcuts in Excel. ▰ Time-saving benefits and improved workflow.
  • 57.
    59 Copyright © MohaimieMosmin 2: Foundations | 59 The Importance of Keyboard Shortcuts ▰ Keyboard shortcuts are essential for improving productivity and streamlining workflow in Excel. They enable users to perform tasks quickly without relying on mouse navigation, which can be time-consuming. By memorizing and implementing essential keyboard shortcuts, you can expedite your work and become a more proficient Excel user.
  • 58.
    60 Copyright © MohaimieMosmin 2: Foundations | 60 2. Navigational Shortcuts ▰ Essential shortcuts for moving around spreadsheets quickly. ▰ Navigating between worksheets and workbooks.
  • 59.
    61 Copyright © MohaimieMosmin 2: Foundations | 61 Navigational Shortcuts ▰ Navigational shortcuts allow you to move swiftly through your spreadsheets, worksheets, and workbooks. For example, using the arrow keys, Home, End, and Ctrl + Arrow combinations can take you to specific cells, the start or end of a row/column, or the beginning or end of the data region.
  • 60.
    62 Copyright © MohaimieMosmin 2: Foundations | 62 3. Selection Shortcuts ▰ Selecting cells, rows, columns, and entire data ranges efficiently. ▰ Extending selections with keyboard shortcuts.
  • 61.
    63 Copyright © MohaimieMosmin 2: Foundations | 63 Selection Shortcuts ▰ Keyboard shortcuts for selection enable you to highlight and choose cells, rows, columns, or data ranges efficiently. Shortcuts like Shift + Arrow keys, Ctrl + Shift + Arrow keys, and Ctrl + A help you save time while selecting data for various operations.
  • 62.
    64 Copyright © MohaimieMosmin 2: Foundations | 64 4. Formatting Shortcuts ▰ Quick formatting using keyboard shortcuts (bold, italic, underline). ▰ Formatting numbers, dates, and text with shortcuts.
  • 63.
    65 Copyright © MohaimieMosmin 2: Foundations | 65 Formatting Shortcuts ▰ Formatting shortcuts let you quickly format cells, text, numbers, or dates without using the formatting toolbar or menu. Common formatting shortcuts include Ctrl + B (bold), Ctrl + I (italic), Ctrl + U (underline), and Ctrl + Shift + $ (apply currency format).
  • 64.
    66 Copyright © MohaimieMosmin 2: Foundations | 66 5. Formula and Function Shortcuts ▰ Accelerating formula creation and editing with keyboard shortcuts. ▰ Common shortcuts for inserting functions and managing formulas.
  • 65.
    67 Copyright © MohaimieMosmin 2: Foundations | 67 Formula and Function Shortcuts ▰ Formula and function shortcuts speed up the process of creating, editing, and managing formulas in Excel. For instance, F2 allows you to edit a cell directly, and Ctrl + Shift + Enter allows you to enter array formulas. Familiarizing yourself with these shortcuts enhances your proficiency in working with complex formulas.
  • 66.
    Module 3: Formulas 101 ExcelZero to Hero: Formulas. Functions and Pivot Tables
  • 67.
    69 Copyright © MohaimieMosmin 3: Formulas 101 | 69 Formula Syntax ▰ Introduction to Excel Formulas ▰ Understanding Cell References (Relative, Absolute, Mixed) ▰ Basic Arithmetic Operators (+, -, *, /) ▰ Order of Operations (BODMAS/PEDMAS) ▰ Using Parentheses to Control Calculation Order ▰ Example: =A1 + (B1 * C1)
  • 68.
    70 Copyright © MohaimieMosmin 3: Formulas 101 | 70 Formula Syntax ▰ Formula syntax is a fundamental aspect of using Microsoft Excel effectively. It refers to the structure and rules that govern how formulas are written in Excel. Understanding formula syntax is crucial for creating accurate calculations and performing data analysis. This topic covers concepts like cell references, arithmetic operators, and order of operations. Learning the correct formula syntax enables users to harness the full power of Excel's calculations and automation capabilities.
  • 69.
    71 Copyright © MohaimieMosmin 3: Formulas 101 | 71 Conditional Statements and Logical Operators ▰ What are Conditional Statements? ▰ The Role of Logical Operators (AND, OR, NOT) ▰ Combining Multiple Conditions ▰ Nesting Conditions ▰ Example: =IF(AND(A1 > 10, B1 < 20), "Pass", "Fail")
  • 70.
    72 Copyright © MohaimieMosmin 3: Formulas 101 | 72 Conditional Statements and Logical Operators ▰ Conditional statements and logical operators are essential tools for making decisions based on specific conditions in Excel. This topic explores how to use logical operators like AND, OR, and NOT to create complex conditions for data analysis. By applying conditional statements, users can automate processes and customize responses based on different scenarios, improving the efficiency and accuracy of their Excel worksheets.
  • 71.
    73 Copyright © MohaimieMosmin 3: Formulas 101 | 73 IF Statements ▰ Introduction to the IF Function ▰ Syntax of the IF Function ▰ Using IF with Text and Numbers ▰ Nesting IF Statements for Complex Conditions ▰ Example: =IF(A1 > 50, "Above Target", "Below Target")
  • 72.
    74 Copyright © MohaimieMosmin 3: Formulas 101 | 74 IF Statements ▰ The IF statement is a versatile and widely used function in Excel. It allows users to perform actions based on whether a specific condition is met or not. This topic covers the syntax and usage of IF statements, showcasing how they can be employed with text and numerical data. By mastering IF statements, users can create dynamic and customized responses within their Excel sheets, tailoring outputs based on changing input conditions.
  • 73.
    75 Copyright © MohaimieMosmin 3: Formulas 101 | 75 AND/OR Operators ▰ Understanding the AND Function ▰ Syntax and Usage of the AND Function ▰ Combining Multiple Conditions with AND ▰ Understanding the OR Function ▰ Syntax and Usage of the OR Function ▰ Combining Multiple Conditions with OR ▰ Example: =IF(AND(A1 > 10, OR(B1 = "Yes", C1 = "Yes")), "Approved", "Not Approved")
  • 74.
    76 Copyright © MohaimieMosmin 3: Formulas 101 | 76 AND/OR Operators ▰ The AND and OR operators are logical functions that allow users to combine multiple conditions in Excel. This topic delves into how these operators work and how to use them effectively within IF statements and other functions. By employing AND and OR operators, users can create more sophisticated decision-making processes, taking multiple criteria into account for precise data analysis and reporting.
  • 75.
    77 Copyright © MohaimieMosmin 3: Formulas 101 | 77 NOT & "<>" Conditionals ▰ The Role of NOT Function in Conditional Statements ▰ Syntax and Usage of the NOT Function ▰ Using NOT to Reverse Conditions ▰ Understanding "<>" Operator ▰ Using "<>" to Check for Non-Equality ▰ Example: =IF(NOT(A1 = "Open"), "Closed", "Open")
  • 76.
    78 Copyright © MohaimieMosmin 3: Formulas 101 | 78 NOT & "<>" Conditionals ▰ The NOT function and the "<>" operator are essential for handling negative conditions and non-equality comparisons in Excel. This topic explains how to use the NOT function to reverse conditions and the "<>" operator to check for non- equality between values. By incorporating NOT and "<>" conditionals, users can refine their formulas to handle exceptions and unique situations in their data.
  • 77.
    79 Copyright © MohaimieMosmin 3: Formulas 101 | 79 IS Statements ▰ Introduction to IS Functions (ISBLANK, ISTEXT, ISNUMBER, etc.) ▰ Syntax and Usage of Various IS Functions ▰ Checking Cell Types and Values ▰ Combining IS Functions with IF Statements ▰ Example: =IF(ISBLANK(A1), "Blank", "Not Blank")
  • 78.
    80 Copyright © MohaimieMosmin 3: Formulas 101 | 80 IS Statements ▰ IS statements, such as ISBLANK, ISTEXT, and ISNUMBER, are valuable for verifying cell types and values in Excel. This topic covers the different IS functions and demonstrates how they can be used within IF statements to create robust data validation processes. By applying IS statements, users can ensure data consistency and reliability, identifying empty cells or verifying the format of data before performing calculations.
  • 79.
    81 Copyright © MohaimieMosmin 3: Formulas 101 | 81 Common Error Types ▰ Understanding Common Formula Errors (e.g., #DIV/0!, #VALUE!, #NAME?, #REF!, #N/A, #NUM!) ▰ Identifying Causes of Errors ▰ How to Troubleshoot and Fix Errors ▰ Example: =A1/B1 (results in #DIV/0! error if B1 is zero)
  • 80.
    82 Copyright © MohaimieMosmin 3: Formulas 101 | 82 Common Error Types ▰ Errors are a common occurrence when working with complex Excel formulas. This topic explores the most frequent error types, such as #DIV/0!, #VALUE!, and #N/A, and provides insights into their causes. Understanding common errors enables users to identify and resolve formula issues effectively, ensuring the accuracy and reliability of their calculations.
  • 81.
    83 Copyright © MohaimieMosmin 3: Formulas 101 | 83 Evaluate Formula and Error Checking ▰ Using "Evaluate Formula" Tool for Step-by-Step Evaluation ▰ Identifying Errors with "Error Checking" Feature ▰ How to Use Tracing Arrows to Track Formula Precedents and Dependents ▰ Example: Evaluate Formula for =SUM(A1:A5)/B1
  • 82.
    84 Copyright © MohaimieMosmin 3: Formulas 101 | 84 Evaluate Formula and Error Checking ▰ The "Evaluate Formula" tool and "Error Checking" feature are valuable resources in Excel for troubleshooting complex formulas. This topic explains how to use these tools to step- by-step evaluate formula components and identify errors in worksheets. By mastering the evaluate formula and error checking functionalities, users can become more proficient at locating and correcting formula-related issues in Excel.
  • 83.
    Module 4: Functions Excel Zeroto Hero: Formulas. Functions and Pivot Tables
  • 84.
    86 Copyright © MohaimieMosmin 4: Functions | 86 Date and Time Functions ▰ Introduction to Date and Time Functions in Excel ▰ Working with Dates and Times in Excel ▻ Displaying Dates and Times in Different Formats ▻ Extracting Date Components (Year, Month, Day) ▻ Calculating Age from Birthdates ▰ Date and Time Calculations ▻ Adding or Subtracting Days, Months, or Years ▻ Finding the Difference Between Two Dates ▰ Example: =TODAY() - B1 (calculates the days between today and the date in cell B1)
  • 85.
    87 Copyright © MohaimieMosmin 4: Functions | 87 Date and Time Functions ▰ Excel provides a range of powerful date and time functions to manipulate and analyze date-related data. These functions allow users to display dates and times in various formats, extract specific components (such as year, month, or day), and perform date calculations like finding the difference between two dates. For instance, you can use the TODAY() function to get the current date and subtract a birthdate from it to calculate a person's age.
  • 86.
    88 Copyright © MohaimieMosmin 4: Functions | 88 Text Functions ▰ Overview of Text Functions in Excel ▰ Concatenating Text Strings ▻ Combining Text from Different Cells ▻ Inserting Delimiters Between Text Items ▰ Extracting Text Substrings ▻ Using LEFT, RIGHT, and MID functions ▻ Finding Text Position with FIND and SEARCH functions ▰ Changing Text Case ▻ Converting to UPPERCASE, lowercase, or Proper Case ▰ Example: =CONCATENATE(A1, " - ", B1) (joins the text in cells A1 and B1 with a hyphen)
  • 87.
    89 Copyright © MohaimieMosmin 4: Functions | 89 Text Functions ▰ Text functions in Excel enable users to manipulate and format text data efficiently. From combining text from different cells using CONCATENATE to extracting substrings using LEFT, RIGHT, and MID functions, Excel offers a wide array of tools to work with text. Text functions are invaluable when dealing with datasets containing names, addresses, product descriptions, or any text-based information that requires reformatting or reorganizing.
  • 88.
    90 Copyright © MohaimieMosmin 4: Functions | 90 Math Functions ▰ Introduction to Math Functions in Excel ▰ Basic Arithmetic Functions ▻ Addition, Subtraction, Multiplication, Division ▰ Rounding and Truncating Numbers ▻ ROUND, ROUNDUP, ROUNDDOWN functions ▻ INT and TRUNC functions ▰ Exponential and Logarithmic Functions ▻ POWER, EXP, LN, LOG functions ▰ Example: =AVERAGE(A1:A10) (calculates the average of values in cells A1 to A10)
  • 89.
    91 Copyright © MohaimieMosmin 4: Functions | 91 Math Functions ▰ Excel's math functions allow users to perform basic arithmetic operations, round numbers, and carry out exponential or logarithmic calculations. Functions like AVERAGE, SUM, and COUNT provide quick insights into numerical data, while POWER and LOG are useful for more advanced calculations. Whether it's calculating totals, averages, or complex mathematical operations, Excel's math functions streamline data analysis and enhance the accuracy of results.
  • 90.
    92 Copyright © MohaimieMosmin 4: Functions | 92 Statistical Functions ▰ Overview of Statistical Functions in Excel ▰ Measures of Central Tendency ▻ AVERAGE, MEDIAN, MODE functions ▰ Measures of Dispersion ▻ MIN, MAX functions ▻ RANGE, STDEV, VAR functions ▰ Frequency Distribution and Histograms ▻ COUNTIF, FREQUENCY functions ▰ Example: =COUNTIF(A1:A10, ">50") (counts the number of values greater than 50 in cells A1 to A10)
  • 91.
    93 Copyright © MohaimieMosmin 4: Functions | 93 Statistical Functions ▰ Statistical functions in Excel are indispensable for analyzing datasets and drawing meaningful conclusions. Functions like AVERAGE, MEDIAN, and MODE provide measures of central tendency, while MIN and MAX determine the range of data. Standard deviation (STDEV) and variance (VAR) offer insights into data dispersion. These statistical functions are essential for summarizing data and identifying key trends or outliers.
  • 92.
    94 Copyright © MohaimieMosmin 4: Functions | 94 Lookup Functions ▰ Introduction to Lookup Functions in Excel ▰ VLOOKUP Function ▻ Searching for Data in a Vertical Table ▻ Retrieving Data from Other Columns ▰ HLOOKUP Function ▻ Searching for Data in a Horizontal Table ▻ Retrieving Data from Other Rows ▰ INDEX and MATCH Functions ▻ More Flexible Lookup Options ▰ Example: =VLOOKUP(A1, B1:C10, 2, FALSE) (finds the value in the second column of the range B1:C10 that matches the value in cell A1)
  • 93.
    95 Copyright © MohaimieMosmin 4: Functions | 95 Lookup Functions ▰ Excel's lookup functions are essential for finding and retrieving specific information from large datasets. The VLOOKUP function searches for a value in the leftmost column of a table and returns the corresponding value from another column. The HLOOKUP function works similarly but searches for data in the top row of a table. INDEX and MATCH functions offer more flexible lookup options, allowing users to perform lookups vertically, horizontally, and across multiple columns or rows.
  • 94.
    96 Copyright © MohaimieMosmin 4: Functions | 96 Logical Functions ▰ Understanding Logical Functions in Excel ▰ IF Function ▻ Basic IF Statement Syntax ▻ Nested IF Statements for Complex Conditions ▰ AND and OR Functions ▻ Combining Multiple Conditions ▰ NOT Function ▻ Reversing Logical Values ▰ Example: =IF(A1 > 10, "Pass", "Fail") (checks if the value in cell A1 is greater than 10 and returns "Pass" if true, "Fail" if false)
  • 95.
    97 Copyright © MohaimieMosmin 4: Functions | 97 Logical Functions ▰ Logical functions in Excel facilitate decision-making and automate data analysis based on specific conditions. The IF function is a cornerstone of logical functions, enabling users to perform actions based on whether a condition is true or false. Users can nest multiple IF statements for more complex scenarios. Additionally, the AND and OR functions allow for combining multiple conditions, while the NOT function reverses logical values. Logical functions provide the foundation for data validation, custom reporting, and dynamic data analysis in Excel.
  • 96.
    Module 5: Pivot Tables (Foundation) ExcelZero to Hero: Formulas. Functions and Pivot Tables
  • 97.
    99 Copyright © MohaimieMosmin 6: Pivot Tables (Foundations) | Introduction 99 ▰ Microsoft Excel's Pivot Tables are powerful tools for data analysis and reporting. They enable users to transform raw data into meaningful summaries, making it easier to identify trends, patterns, and insights. By summarizing large datasets, applying different calculations, and visualizing data through Pivot Charts, users can gain valuable business intelligence and streamline decision-making processes.
  • 98.
    100 Copyright © MohaimieMosmin 6: Pivot Tables (Foundations) | Creating a Basic Pivot Table Report 100 ▰ Introduction to Pivot Tables and their benefits ▰ Selecting the data range for the Pivot Table ▰ Creating a new Pivot Table from the data ▰ Choosing row and column fields for organization ▰ Adding data fields to summarize values ▰ Example: Creating a Pivot Table to summarize sales data by product category and region.
  • 99.
    101 Copyright © MohaimieMosmin 6: Pivot Tables (Foundations) | Creating a Basic Pivot Table Report 101 ▰ Creating a Basic Pivot Table Report is the foundational topic for understanding and utilizing Pivot Tables in Microsoft Excel. It covers the process of transforming raw data into a meaningful summary by selecting the data range, setting row and column fields for organization, and adding data fields to calculate values. By creating a Pivot Table, users can quickly analyze data and gain insights without the need for complex formulas or manual calculations.
  • 100.
    102 Copyright © MohaimieMosmin 6: Pivot Tables (Foundations) | Aggregation and Grouping 102 ▰ Understanding aggregation functions (SUM, COUNT, AVERAGE, etc.) ▰ Grouping data by date, number ranges, or custom categories ▰ Calculating percentages and other summary statistics ▰ Example: Grouping sales data by quarter to view quarterly performance.
  • 101.
    103 Copyright © MohaimieMosmin 6: Pivot Tables (Foundations) | Aggregation and Grouping 103 ▰ Aggregation and Grouping expand on the capabilities of Pivot Tables, allowing users to summarize data using various aggregation functions like SUM, COUNT, and AVERAGE. Grouping data helps organize information by date, numerical ranges, or custom categories. This topic enables users to generate more sophisticated reports and explore data patterns by applying different grouping techniques.
  • 102.
    104 Copyright © MohaimieMosmin 6: Pivot Tables (Foundations) | Formatting Values 104 ▰ Formatting numeric values in the Pivot Table ▰ Applying currency, number formatting, and decimals ▰ Displaying values as percentages or scientific notation ▰ Example: Formatting revenue values to display in currency format.
  • 103.
    105 Copyright © MohaimieMosmin 6: Pivot Tables (Foundations) | Formatting Values 105 ▰ Formatting Values is essential for presenting data effectively in Pivot Tables. This topic covers formatting numeric values to display currency, percentages, or scientific notation. Properly formatted values make the Pivot Table more reader-friendly and enhance the visual representation of data.
  • 104.
    106 Copyright © MohaimieMosmin 6: Pivot Tables (Foundations) | Layout Options 106 ▰ Configuring the Pivot Table layout (compact, outline, tabular) ▰ Adjusting subtotals and grand totals display ▰ Enabling or disabling row and column headers ▰ Example: Switching between compact and tabular layout for different views.
  • 105.
    107 Copyright © MohaimieMosmin 6: Pivot Tables (Foundations) | Layout Options 107 ▰ The Layout Options topic focuses on the appearance and arrangement of Pivot Tables. Users can choose between compact, outline, or tabular layout styles, depending on the preferred structure for data display. They can also control the display of subtotals and grand totals. Understanding layout options enables users to tailor the Pivot Table appearance to their specific reporting needs.
  • 106.
    108 Copyright © MohaimieMosmin 6: Pivot Tables (Foundations) | Formatting Pivot Tables 108 ▰ Customizing Pivot Table appearance (font, cell colors, borders) ▰ Using Pivot Table styles and themes ▰ Conditional formatting to highlight data trends ▰ Example: Applying a custom style and conditional formatting to emphasize top-performing products.
  • 107.
    109 Copyright © MohaimieMosmin 6: Pivot Tables (Foundations) | Formatting Pivot Tables 109 ▰ Formatting Pivot Tables enhances their visual appeal and ensures a consistent look with the rest of the workbook. Users can customize fonts, cell colors, borders, and apply styles or themes to match their brand or corporate design. This topic also covers using conditional formatting to highlight specific data trends for better data analysis.
  • 108.
    110 Copyright © MohaimieMosmin 6: Pivot Tables (Foundations) | Sorting and Filtering 110 ▰ Sorting data within the Pivot Table ▰ Filtering data using slicers and filters ▰ Applying multiple filters for precise data analysis ▰ Example: Sorting products by sales revenue in descending order.
  • 109.
    111 Copyright © MohaimieMosmin 6: Pivot Tables (Foundations) | Sorting and Filtering 111 ▰ Sorting and Filtering in Pivot Tables allows users to reorganize data for better insights and focus on specific subsets of information. This topic explains how to sort data within the Pivot Table and apply filters using slicers and filters for easy data exploration and analysis.
  • 110.
    112 Copyright © MohaimieMosmin 6: Pivot Tables (Foundations) | Creating Pivot Charts 112 ▰ Converting Pivot Table data into Pivot Charts ▰ Choosing chart types (column, bar, line, pie, etc.) ▰ Formatting and customizing Pivot Charts ▰ Example: Creating a column chart to visualize regional sales performance.
  • 111.
    113 Copyright © MohaimieMosmin 6: Pivot Tables (Foundations) | Creating Pivot Charts 113 ▰ Creating Pivot Charts extends the capabilities of Pivot Tables by transforming data summaries into visual representations like column, bar, line, pie, or other chart types. Pivot Charts provide a more intuitive way to understand data trends and patterns, enhancing data-driven decision-making.
  • 112.
    114 Copyright © MohaimieMosmin 6: Pivot Tables (Foundations) | Applying Conditional Formatting 114 ▰ Using conditional formatting within Pivot Tables ▰ Highlighting data based on specific rules and criteria ▰ Applying color scales, data bars, and icon sets ▰ Example: Applying conditional formatting to highlight above- average sales regions.
  • 113.
    115 Copyright © MohaimieMosmin 6: Pivot Tables (Foundations) | Applying Conditional Formatting 115 ▰ Applying Conditional Formatting in Pivot Tables enables users to highlight data based on specific rules or criteria. This topic covers using color scales, data bars, and icon sets to visualize data variations easily. Conditional formatting allows users to identify outliers or key performance indicators at a glance.
  • 114.
    116 Copyright © MohaimieMosmin 6: Pivot Tables (Foundations) | Updating Pivot Tables and Pivot Charts 116 ▰ Refreshing Pivot Tables to update data ▰ Handling new data and additional fields ▰ Keeping Pivot Charts in sync with updated Pivot Tables ▰ Example: Adding new sales data and refreshing the Pivot Table to include the latest information.
  • 115.
    117 Copyright © MohaimieMosmin 6: Pivot Tables (Foundations) | Updating Pivot Tables and Pivot Charts 117 ▰ Updating Pivot Tables and Pivot Charts ensures that the latest data is reflected accurately in the reports. This topic explains how to refresh Pivot Tables after modifying the source data and how to handle new data or additional fields. Users can keep their reports up-to-date without starting from scratch each time new information is added.
  • 116.
    Module 6: Pivot Tables (Advanced) ExcelZero to Hero: Formulas. Functions and Pivot Tables
  • 117.
    119 Copyright © MohaimieMosmin 6: Pivot Tables (Advanced) | 119 Manipulating Pivot Tables ▰ Adding and Removing Fields ▰ Rearranging Row and Column Fields ▰ Changing Summary Functions (SUM, COUNT, AVERAGE, etc.) ▰ Customizing the Pivot Table Layout ▰ Example: Adding a new calculated field to the Pivot Table to calculate profit margins.
  • 118.
    120 Copyright © MohaimieMosmin 6: Pivot Tables (Advanced) | 120 Manipulating Pivot Tables ▰ Manipulating Pivot Tables refers to the various actions users can perform to modify and fine-tune the structure and content of their Pivot Tables in Microsoft Excel. This topic covers essential techniques for adding, removing, and rearranging fields, changing the summary functions, and customizing the Pivot Table layout. By mastering these skills, users can effortlessly tailor their Pivot Tables to present data in the most meaningful and actionable way.
  • 119.
    121 Copyright © MohaimieMosmin 6: Pivot Tables (Advanced) | 121 Formatting Pivot Tables ▰ Formatting Fonts, Colors, and Borders ▰ Applying Conditional Formatting to Visualize Data ▰ Creating Custom Pivot Table Styles ▰ Example: Using conditional formatting to highlight cells with sales above a certain target.
  • 120.
    122 Copyright © MohaimieMosmin 6: Pivot Tables (Advanced) | 122 Formatting Pivot Tables ▰ Formatting Pivot Tables focuses on enhancing the visual appeal and clarity of Pivot Tables. This topic covers a range of formatting options, including adjusting font styles, colors, cell borders, and applying conditional formatting to highlight data patterns. By using formatting techniques, users can create polished and professional-looking Pivot Tables that effectively communicate insights and analysis.
  • 121.
    123 Copyright © MohaimieMosmin 6: Pivot Tables (Advanced) | 123 Value Field Settings ▰ Changing Summary Calculation Type (e.g., SUM to AVERAGE) ▰ Formatting Numeric Values ▰ Displaying Values as Percentages or Running Totals ▰ Example: Changing the value field settings to show revenue as a percentage of the total sales.
  • 122.
    124 Copyright © MohaimieMosmin 6: Pivot Tables (Advanced) | 124 Value Field Settings ▰ Value Field Settings delve into advanced options for customizing how values are summarized and displayed in Pivot Tables. This topic covers changing the summary calculation type, formatting numeric values, and displaying values as percentages or running totals. Understanding value field settings empowers users to present data more accurately and in a format that suits their reporting needs.
  • 123.
    125 Copyright © MohaimieMosmin 6: Pivot Tables (Advanced) | 125 Sorting and Filtering ▰ Sorting Data within the Pivot Table ▰ Applying Filters to Display Specific Data ▰ Filtering by Conditions and Top/Bottom Values ▰ Example: Sorting products by sales revenue in descending order to identify top-selling products.
  • 124.
    126 Copyright © MohaimieMosmin 6: Pivot Tables (Advanced) | 126 Sorting and Filtering ▰ Sorting and Filtering in Pivot Tables provide powerful data exploration capabilities. This topic explains how to sort data by specific criteria and apply filters to focus on relevant information. Users can sort in ascending or descending order and filter data based on conditions or top/bottom values. Mastering sorting and filtering allows for quick data analysis and identification of key insights.
  • 125.
    127 Copyright © MohaimieMosmin 6: Pivot Tables (Advanced) | 127 Calculations ▰ Creating Calculated Fields ▰ Using Calculated Items for Advanced Analysis ▰ Example: Adding a calculated field to calculate the profit margin based on sales and expenses.
  • 126.
    128 Copyright © MohaimieMosmin 6: Pivot Tables (Advanced) | 128 Calculations ▰ Calculations in Pivot Tables involve creating custom calculations beyond the standard summary functions. This topic covers using calculated fields and calculated items to perform complex calculations based on existing Pivot Table data. By adding calculations, users can derive deeper insights and generate additional metrics for their analysis.
  • 127.
    129 Copyright © MohaimieMosmin 6: Pivot Tables (Advanced) | 129 Dashboards ▰ Designing Interactive Dashboards ▰ Using Pivot Tables and Pivot Charts for Data Visualization ▰ Incorporating Slicers for User Interactivity ▰ Example: Creating a sales dashboard with interactive slicers to filter data by region and product category.
  • 128.
    130 Copyright © MohaimieMosmin 6: Pivot Tables (Advanced) | 130 Dashboards ▰ Dashboards are interactive and visually appealing reports that display key performance indicators and data insights in a concise and user-friendly format. This topic introduces the concept of using Pivot Tables and Pivot Charts to create dynamic dashboards for data visualization. By incorporating slicers and interactivity, users can build informative dashboards for data-driven decision-making.