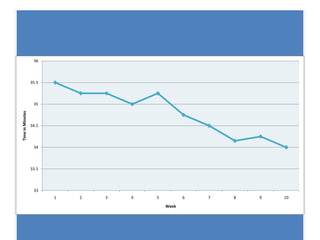
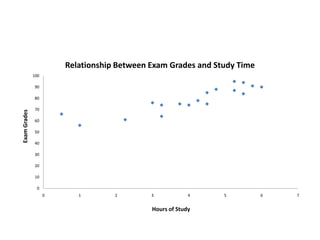
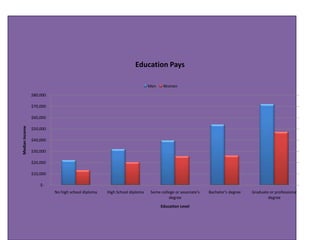
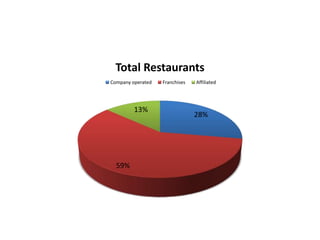
The document contains several charts and graphs about different topics:
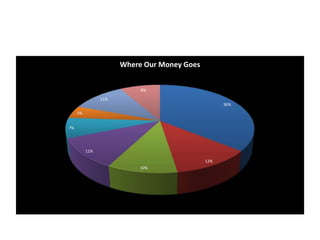
- Where charitable donations go for the American Red Cross
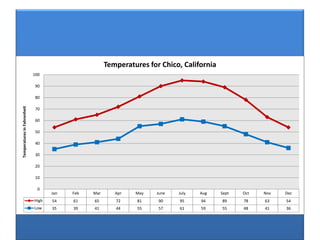
- Temperatures in Chico, California over the course of a year
- The relationship between exam grades and hours of study
- How median income varies by level of education
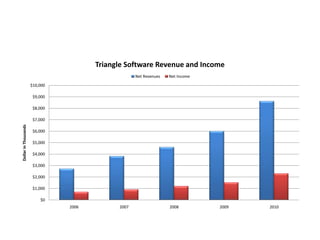
- Revenue and profits for a software company from 2006-2010
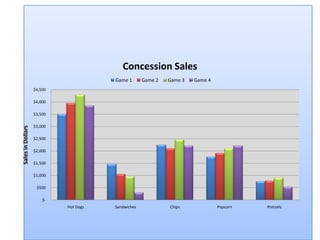
- Concession sales at sports games