
Recommended
More Related Content
What's hot
What's hot (19)
Viewers also liked
Viewers also liked (17)
Similar to Evolutionary Ecology Analysis of Automotive Industry
Similar to Evolutionary Ecology Analysis of Automotive Industry (18)
Recently uploaded
Recently uploaded (20)
Evolutionary Ecology Analysis of Automotive Industry
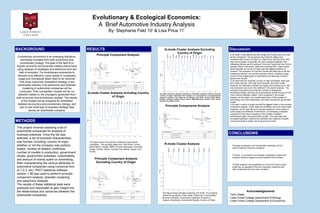
- 1. Evolutionary & Ecological Economics: A Brief Automotive Industry Analysis By: Stephanie Feld 10’ & Lisa Price 11’ BACKGROUND RESULTS Discussion Q-mode Cluster Analysis Excluding Country of Origin Principle Component Analysis In Q-mode, it was determined that Dodge and Pontiac were the most similar companies. The groupings show that the clades were consistent with country of origin (i.e. Asian firms, German firms, GM, high end European companies, etc were clustered together).One interesting finding was the pairing of Ford and Toyota and how Ford is grouped closer to the Asian clade than American/GM. These results were expected, as country of origin was the biggest predictor of variance. The exception of Ford and Toyota was likely due to the two companies having a very similar business routine, including a large percent of the budget spent on advertising and factoring in recent government recalls. In Q-mode with the character country of origin eliminated, there was still a clear German, GM, High end European, and Asian clade. However, the distinction between the higher end producers and mid-end producers was much more defined in the cluster analysis. The principle components show that the number of dealerships , advertising budget, and amount of government recalls account for the most variance between clades. This is projected in this cluster analysis, as the higher end models spend less of their budget on advertising, have less dealerships, and rarely experience government recalls. In R-mode, country of origin was still the biggest outlier in the principle component analysis. Public trade and profit/loss were the most similar character, as the cash flow of a company depends on the results of public trade and profit/loss. Furthermore, an interesting correlation resulted from the clade consisting of the number of dealers, advertising budget, and government recalls . This may imply that increased expansion reduces the emphasis and vigilance of quality control and leads to higher risk of government recall. Evolutionary economics is an emerging discipline, borrowing concepts from both economics and evolutionary biology. The goal of the field is to explain economic and business related phenomena using analysis of strategies and behaviors from the field of evolution. For evolutionary economics to become truly effective, many issues in vocabulary usage and conceptual ideas need to be resolved. This study examines competitive strategy in the automobile industry. First parsimony and phenetic clustering of automobile companies will be conducted. Then competition models will be run between clades on the phylogeny generated from both economic and evolutionary studies. The results of the models will be analyzed for similarities between economics and evolutionary biology, and also to see what type of business strategy best serves an automobile company. Q-mode Cluster Analysis Including Country of Origin This figure shows the phenetic clustering of automobile companies with the character “country of origin” eliminated from analysis, as it accounted for a disproportionate amount of variance. The clades are as follows; Land Rover, Ferrari, Aston Martin, Cadillac; Chevrolet, Dodge, Pontiac, Saturn; BMW, Mercedes, Porsche; Ford, Toyota; Hyundai, Kia, Mazda, Honda Principle Components Analysis METHODS This project involved selecting a list of automobile companies for analysis of business practices. Once the list was selected, a list of business characteristics was formed, including; country of origin, whether or not the company was publicly traded, number of dealers, profit/loss, number of models in production, government recalls, government subsidies, customability, and amount of money spent on advertising. After characterizing the various attributes of automotive companies using numerical bins (0,1,2,3, etc), PAST statistical software version 1.99 was used to perform principle component analysis, phenetic clustering, and parsimony analysis. The results of these statistical tests were analyzed and interpreted to gain insight into the relationships and variances between the automobile companies. CONCLUSIONS This figure shows the phenetic clustering of automobile companies. The resulting clades are; Land Rover, Ferrari, Aston Martin, Cadillac; BMW, Porsche, Mercedes; Chevrolet, Dodge, Pontiac, Saturn; Hyundai, Kia, Mazda; Toyota, Ford, Honda. R-mode Cluster Analysis *Ecologic techniques, such as phenetic clustering, can be used to examine economic problems *In future, run economic and ecologic competition models and compare results to gauge accuracy between the two fields. *Further research into possibilities for Ford and Toyota’s close clustering, as opposed to the two companies clustering with other companies from the same continent. Principle Component Analysis Excluding Country of Origin Acknowledgements *Terry Gates *Lake Forest College Department of Biology *Lake Forest College Department of Economics This figure shows phenetic clustering in R-mode. The resulting clades are as follows; Public trade, Profit/Loss, Customability; Number of Models, Government Subsidies; Number of Dealers, Advertising, Government Recalls; Country of Origin.