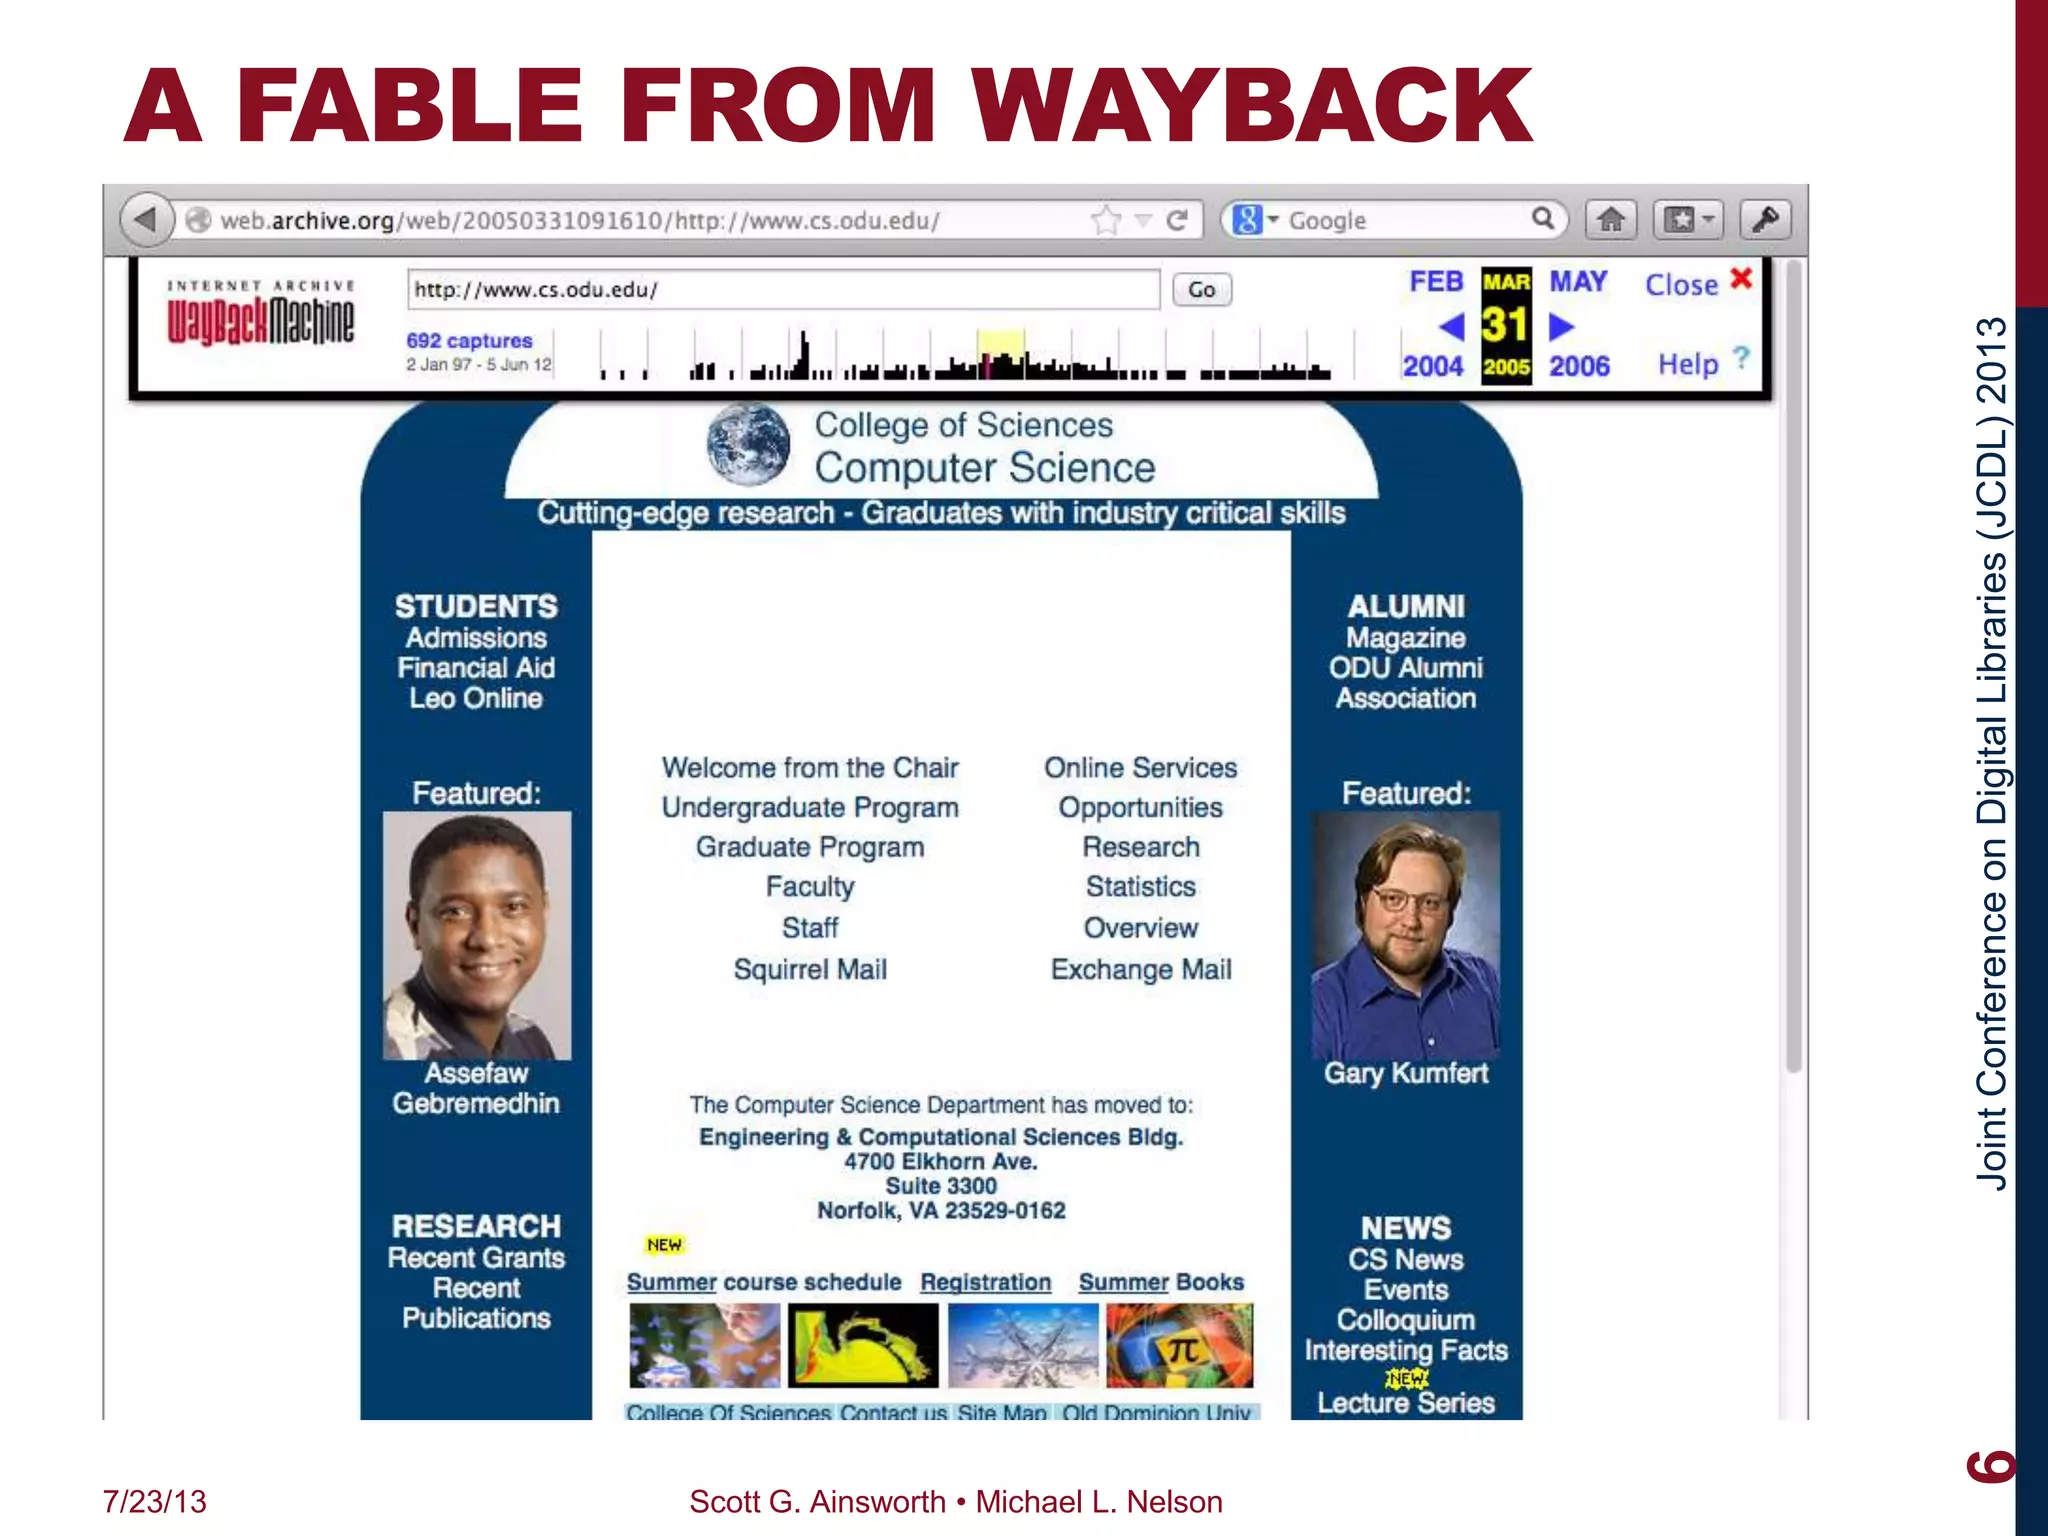
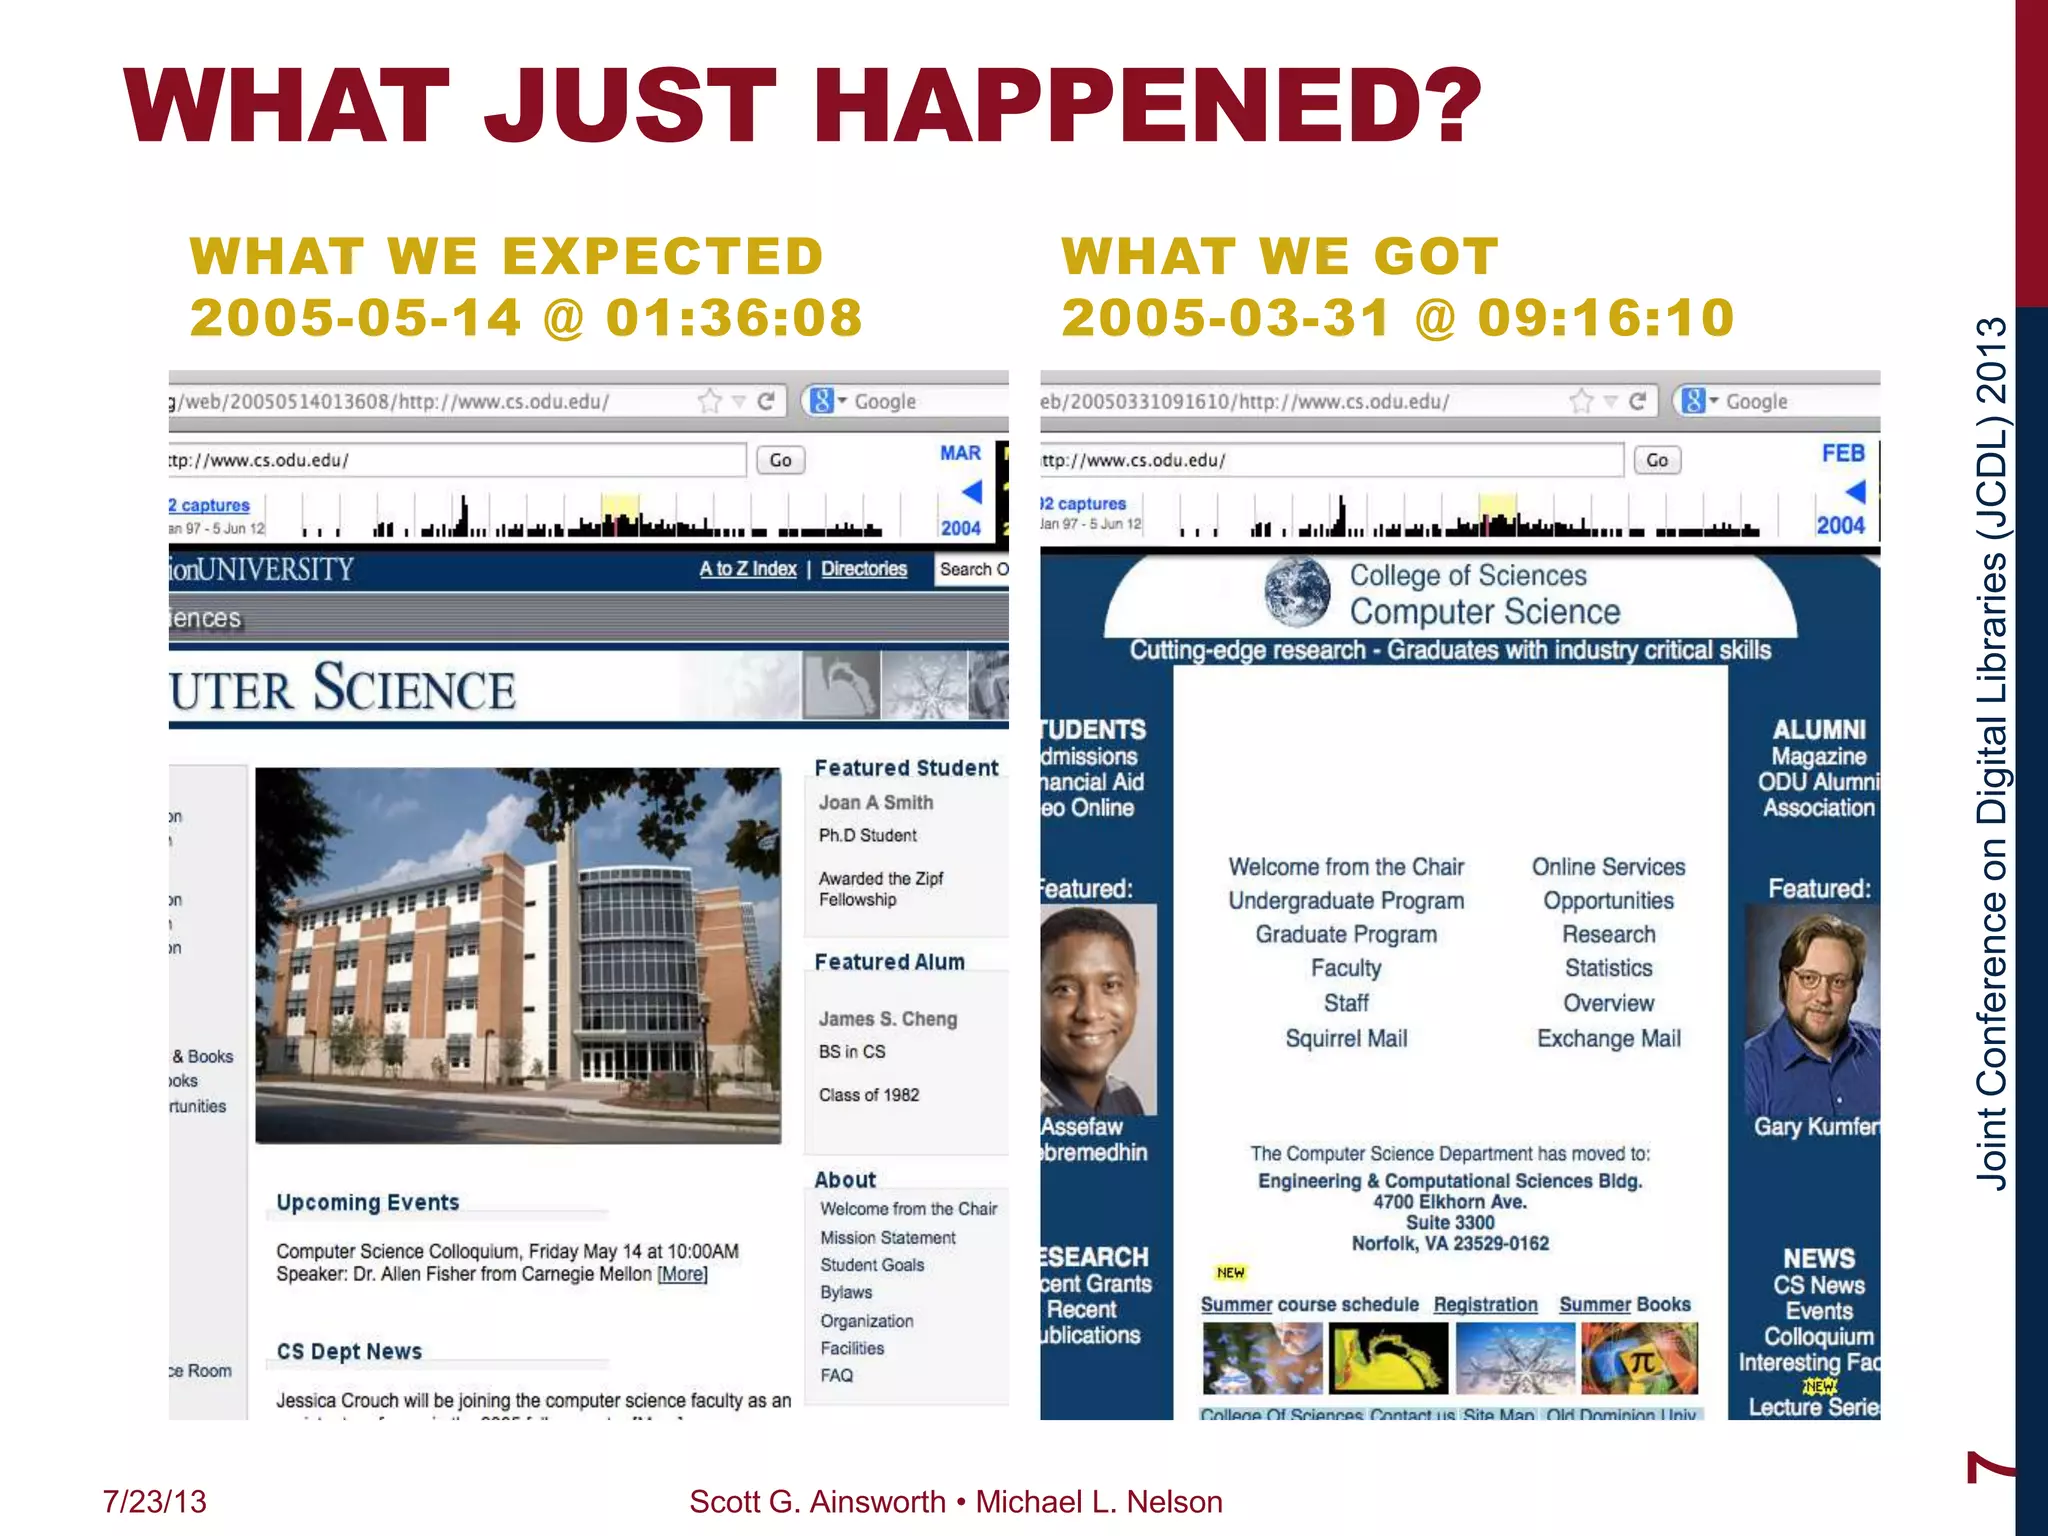
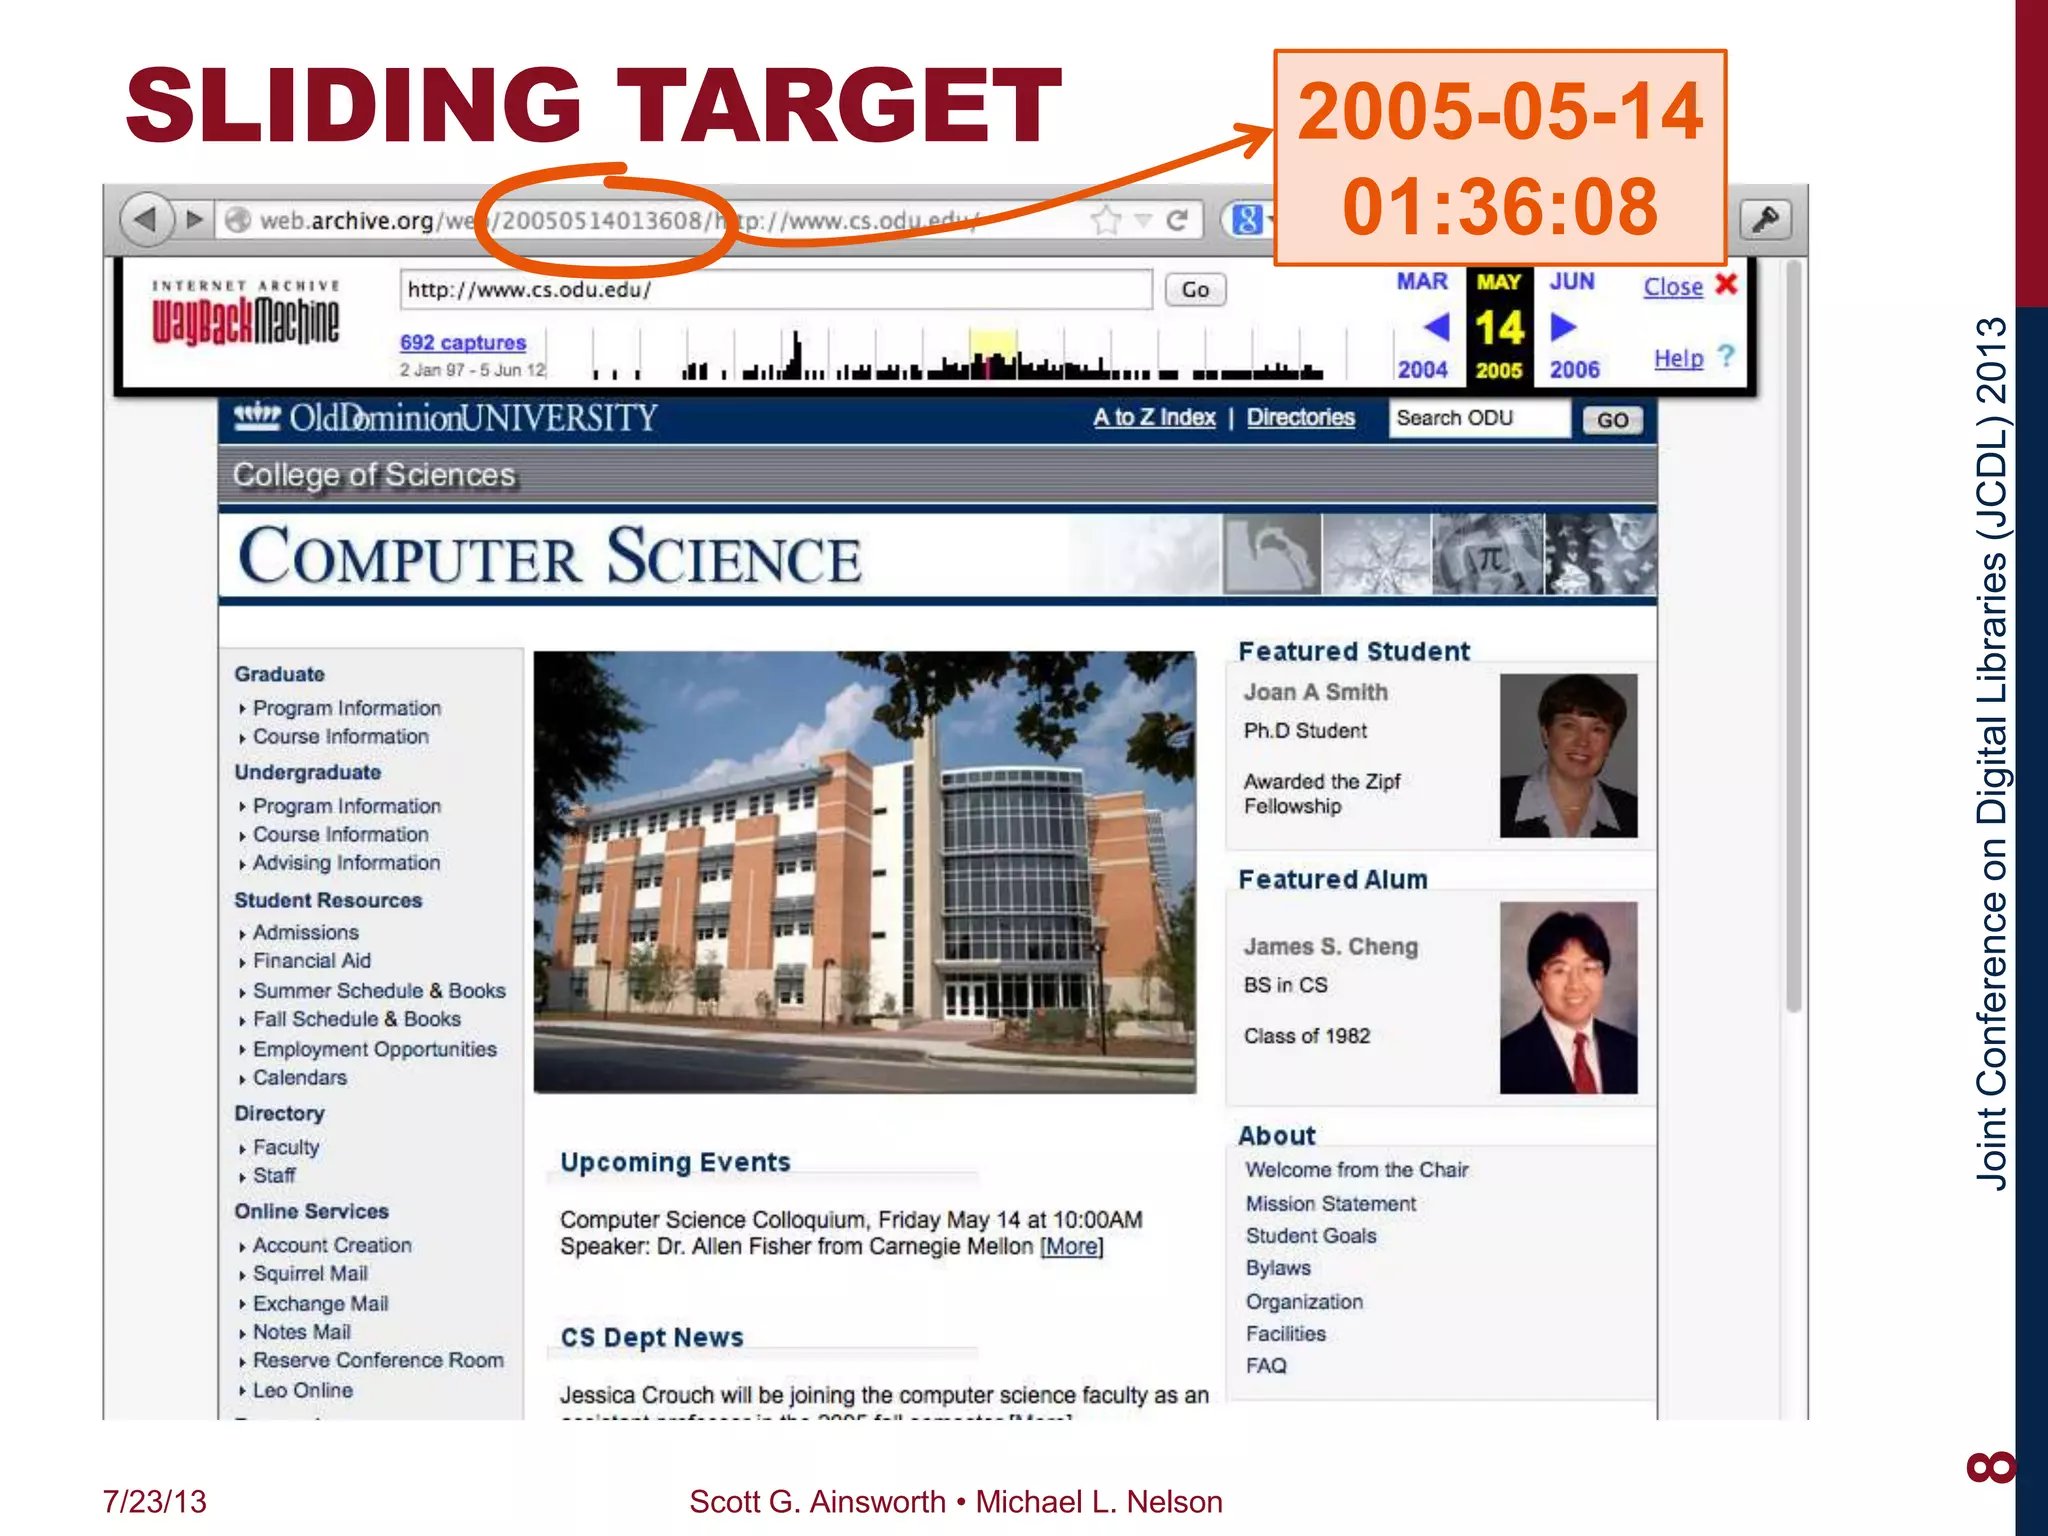
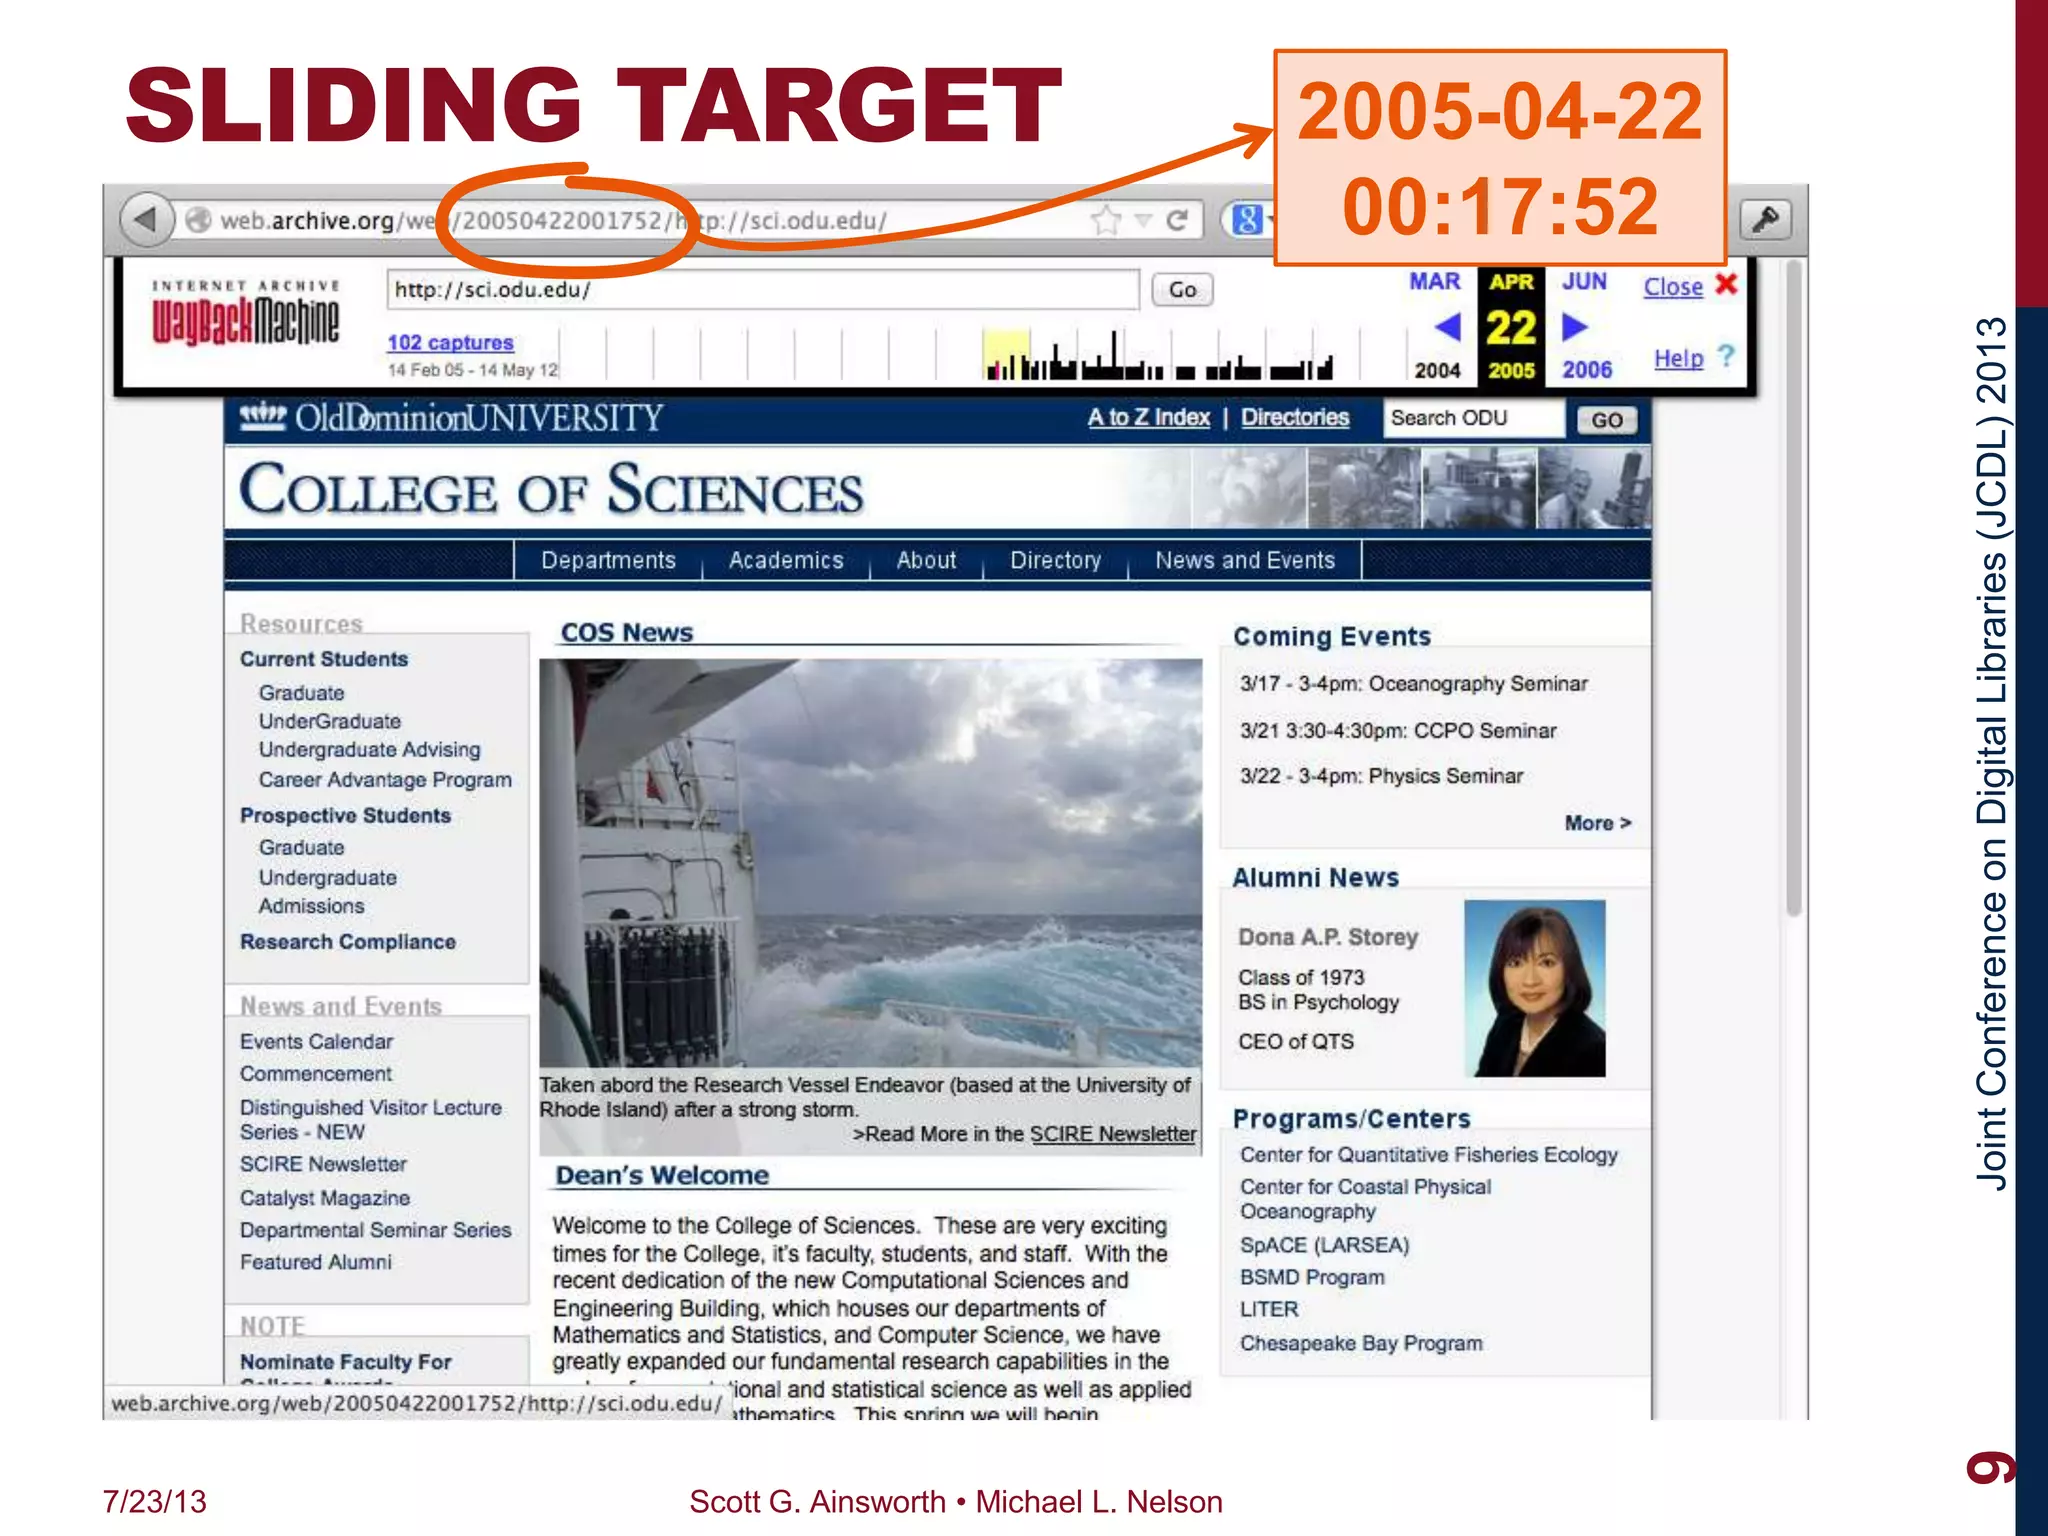
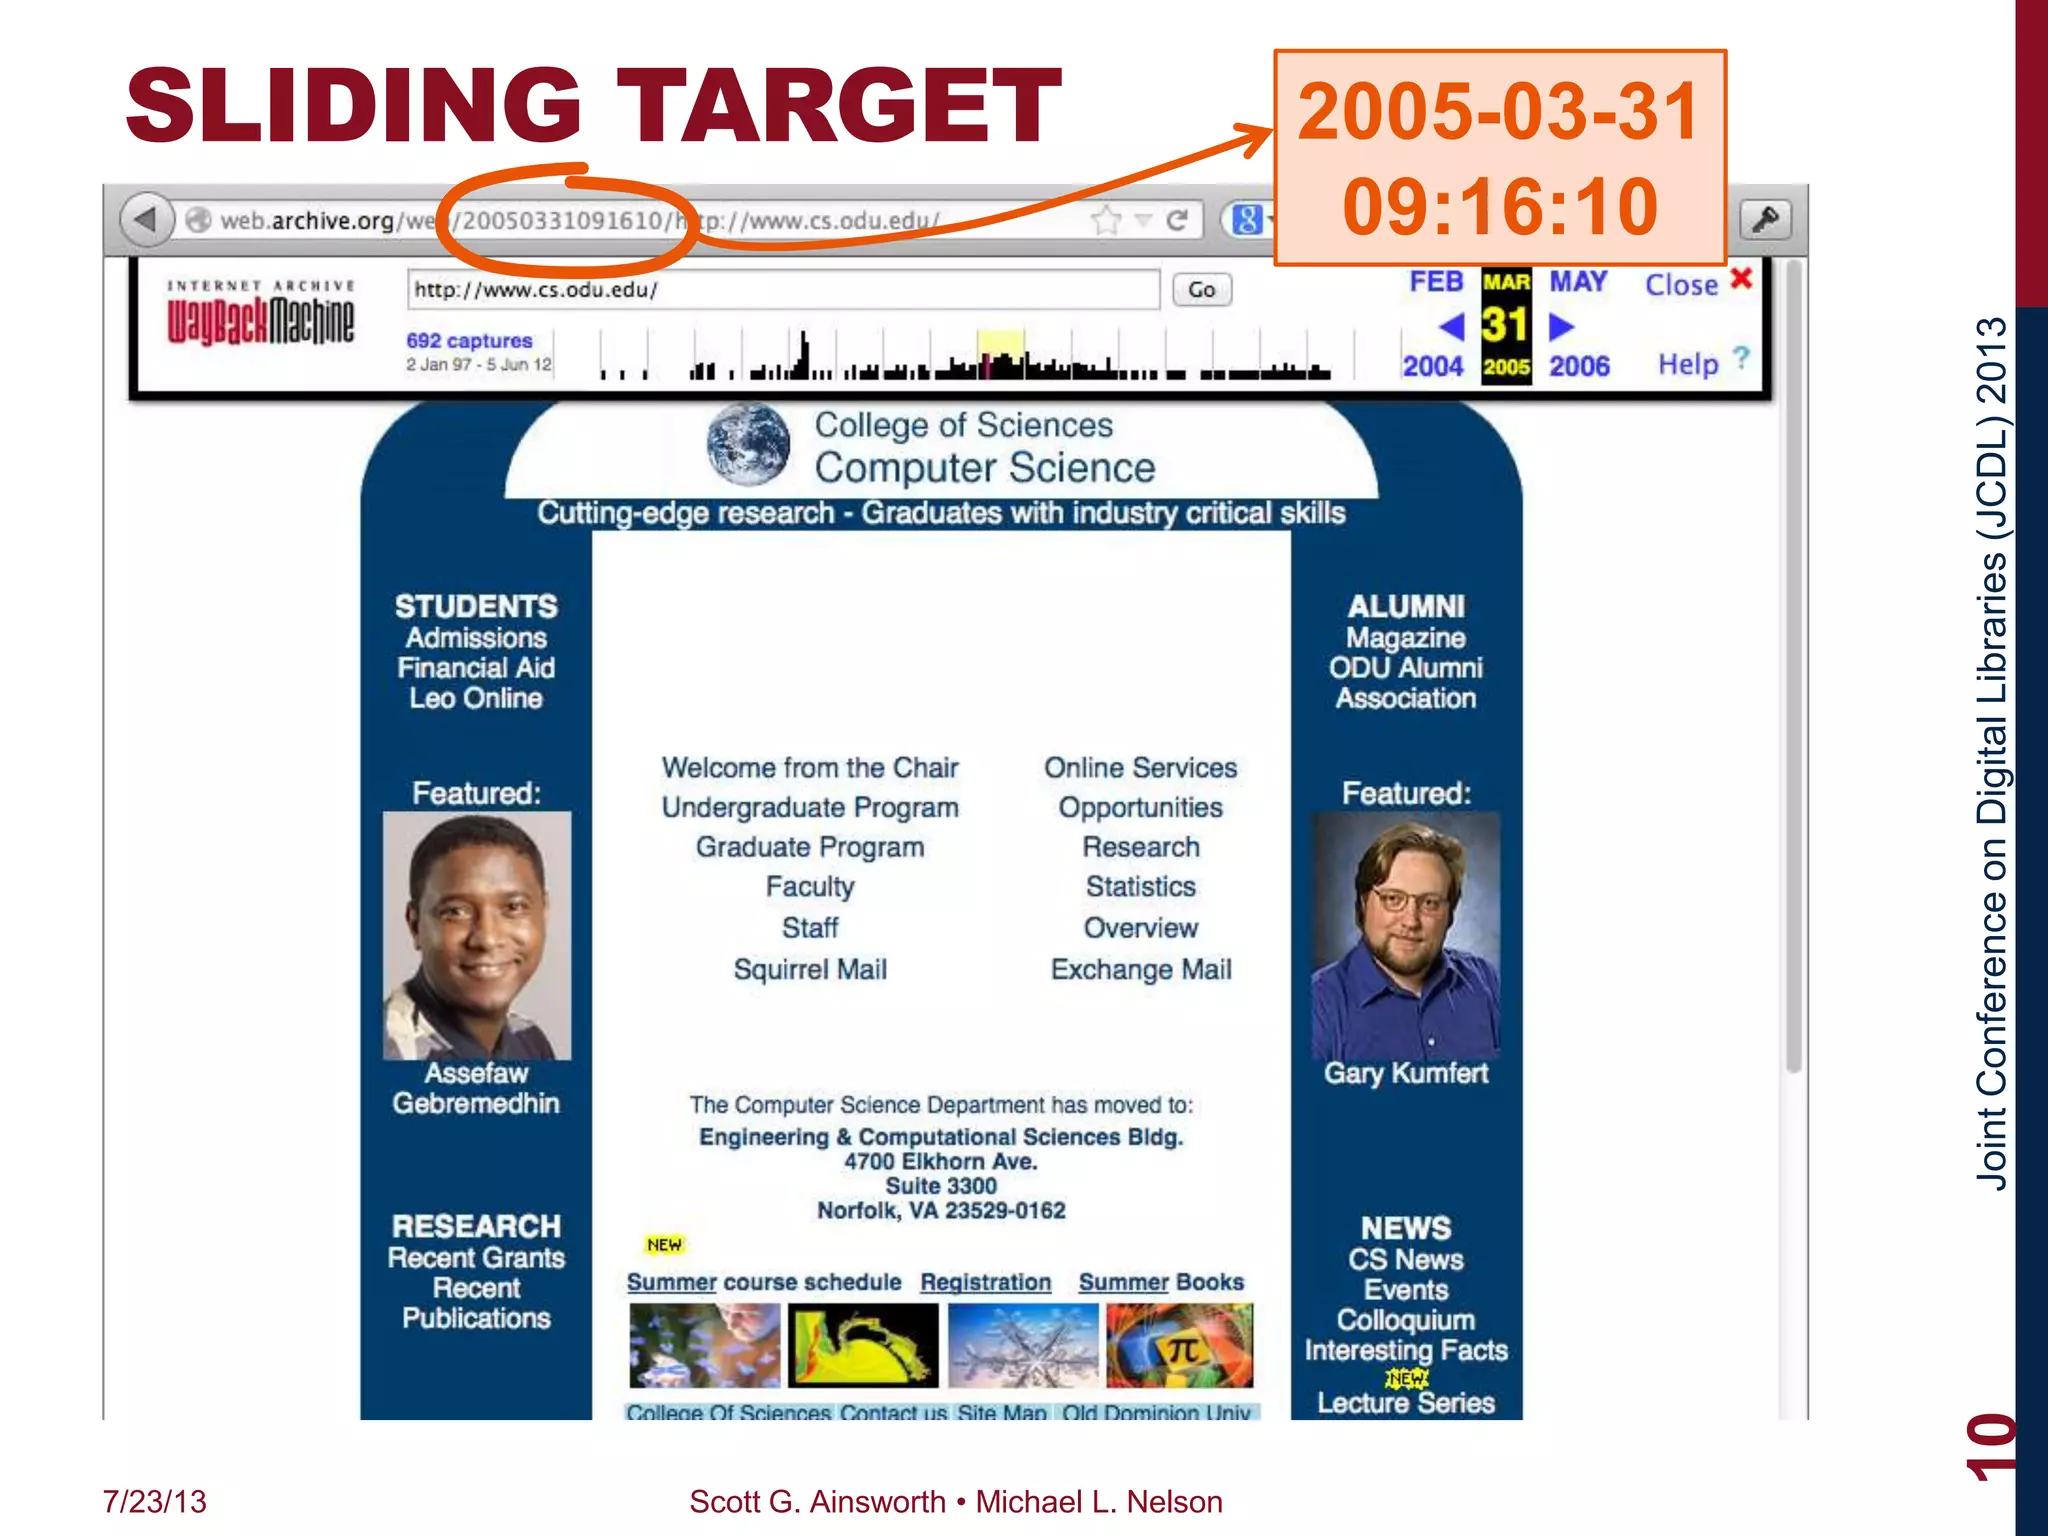
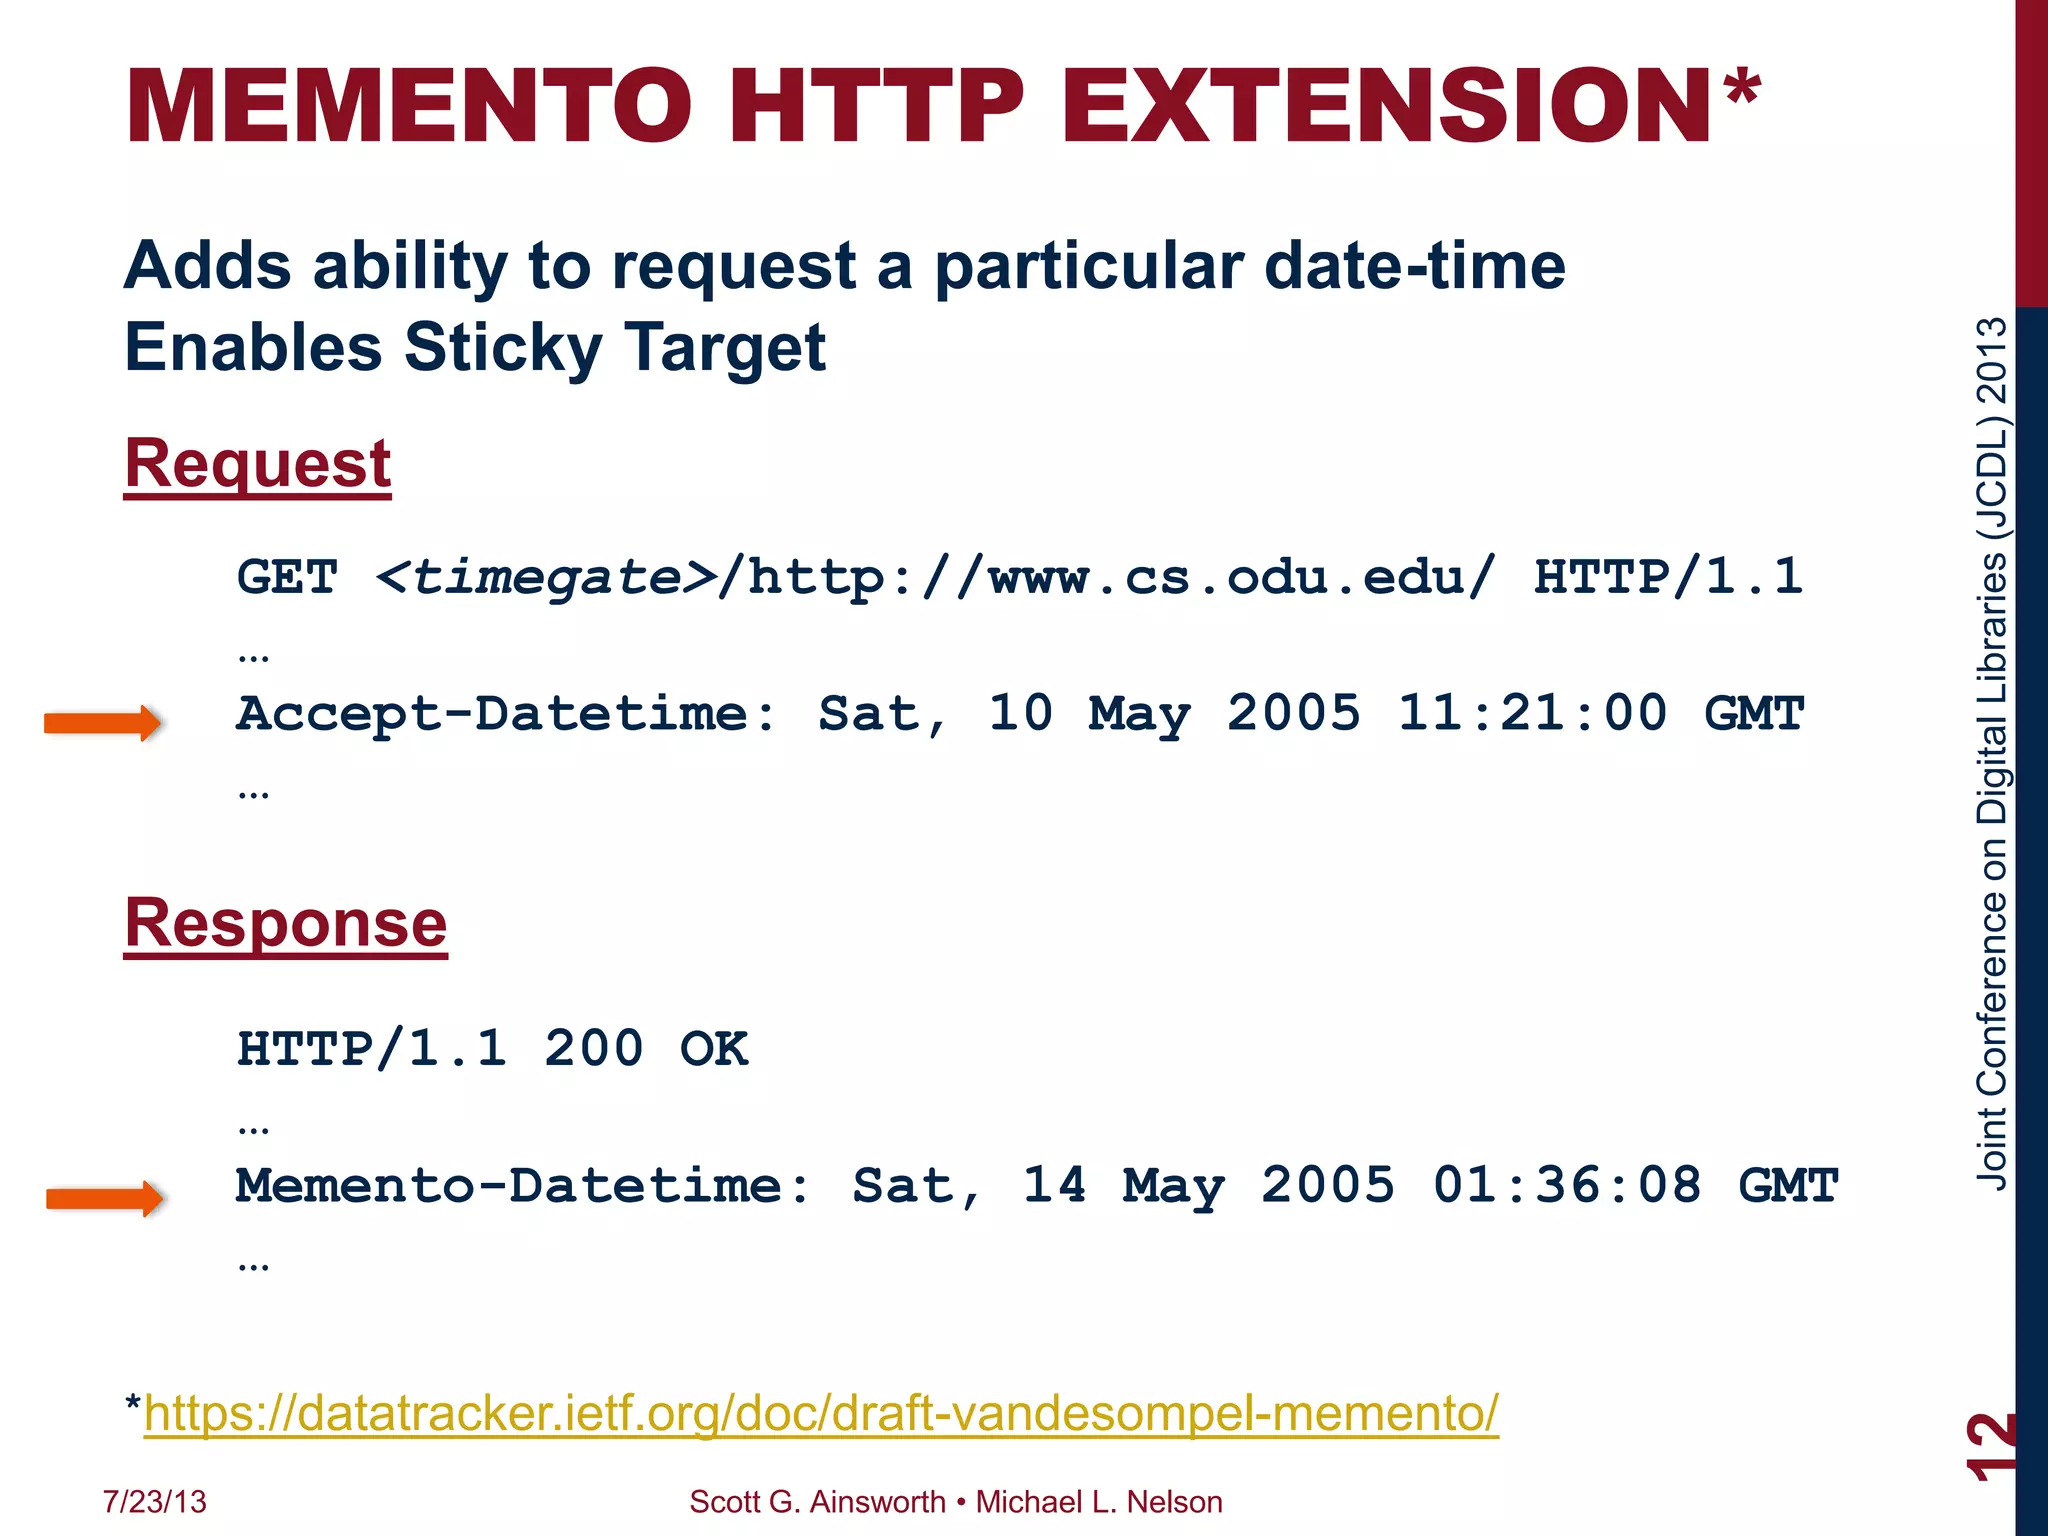
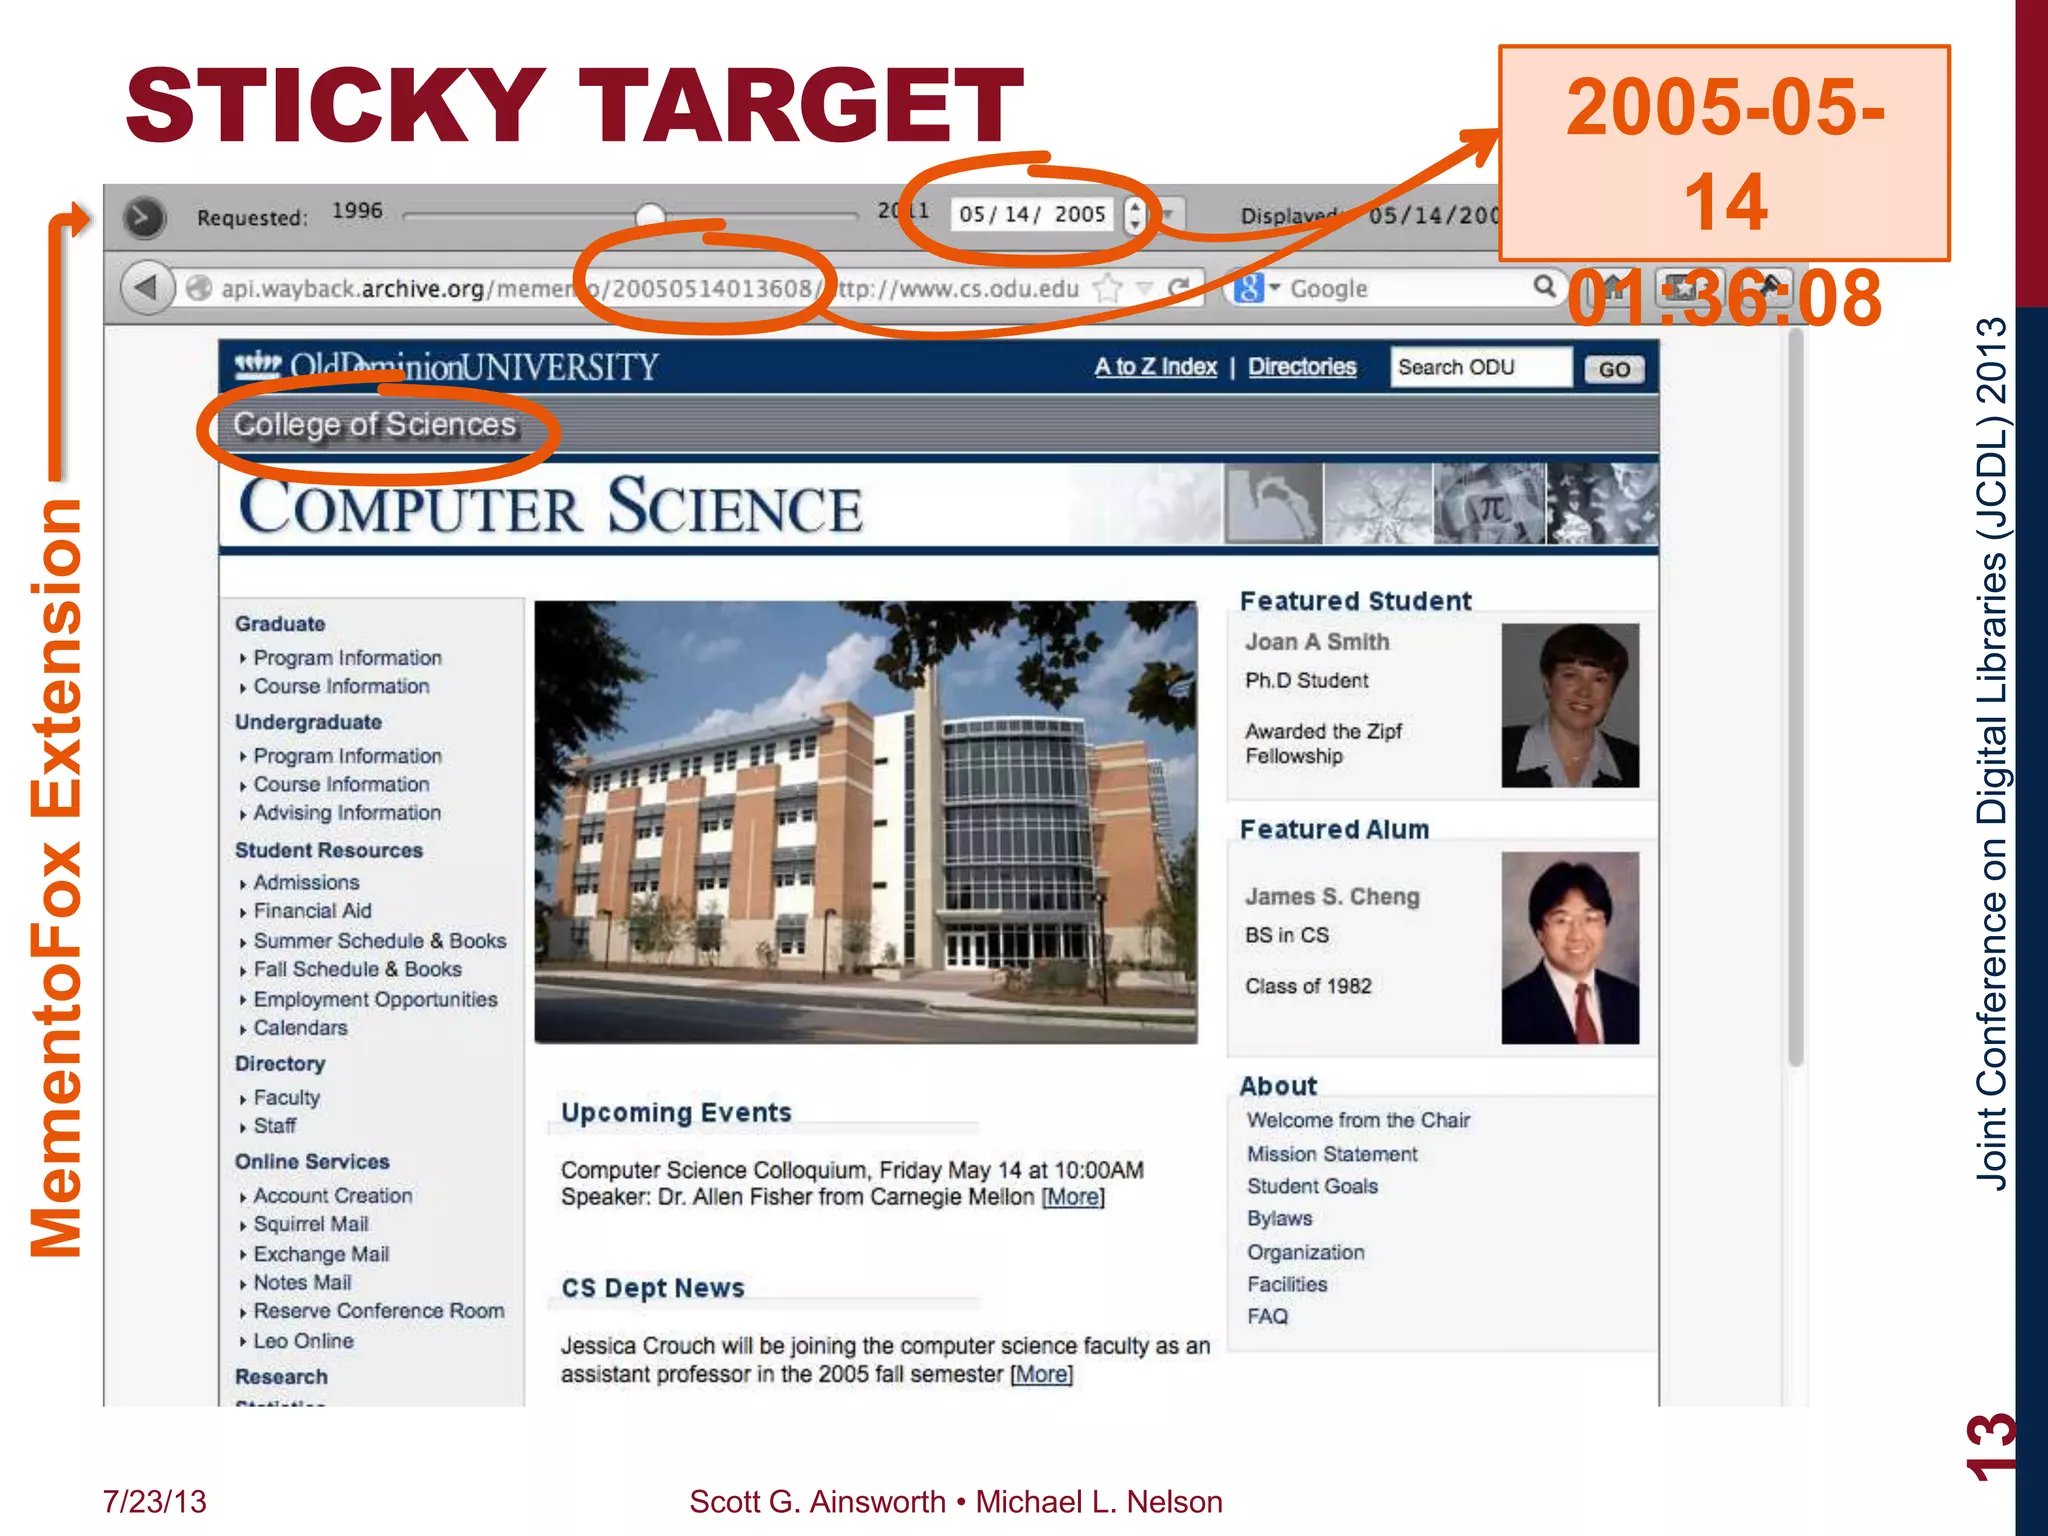
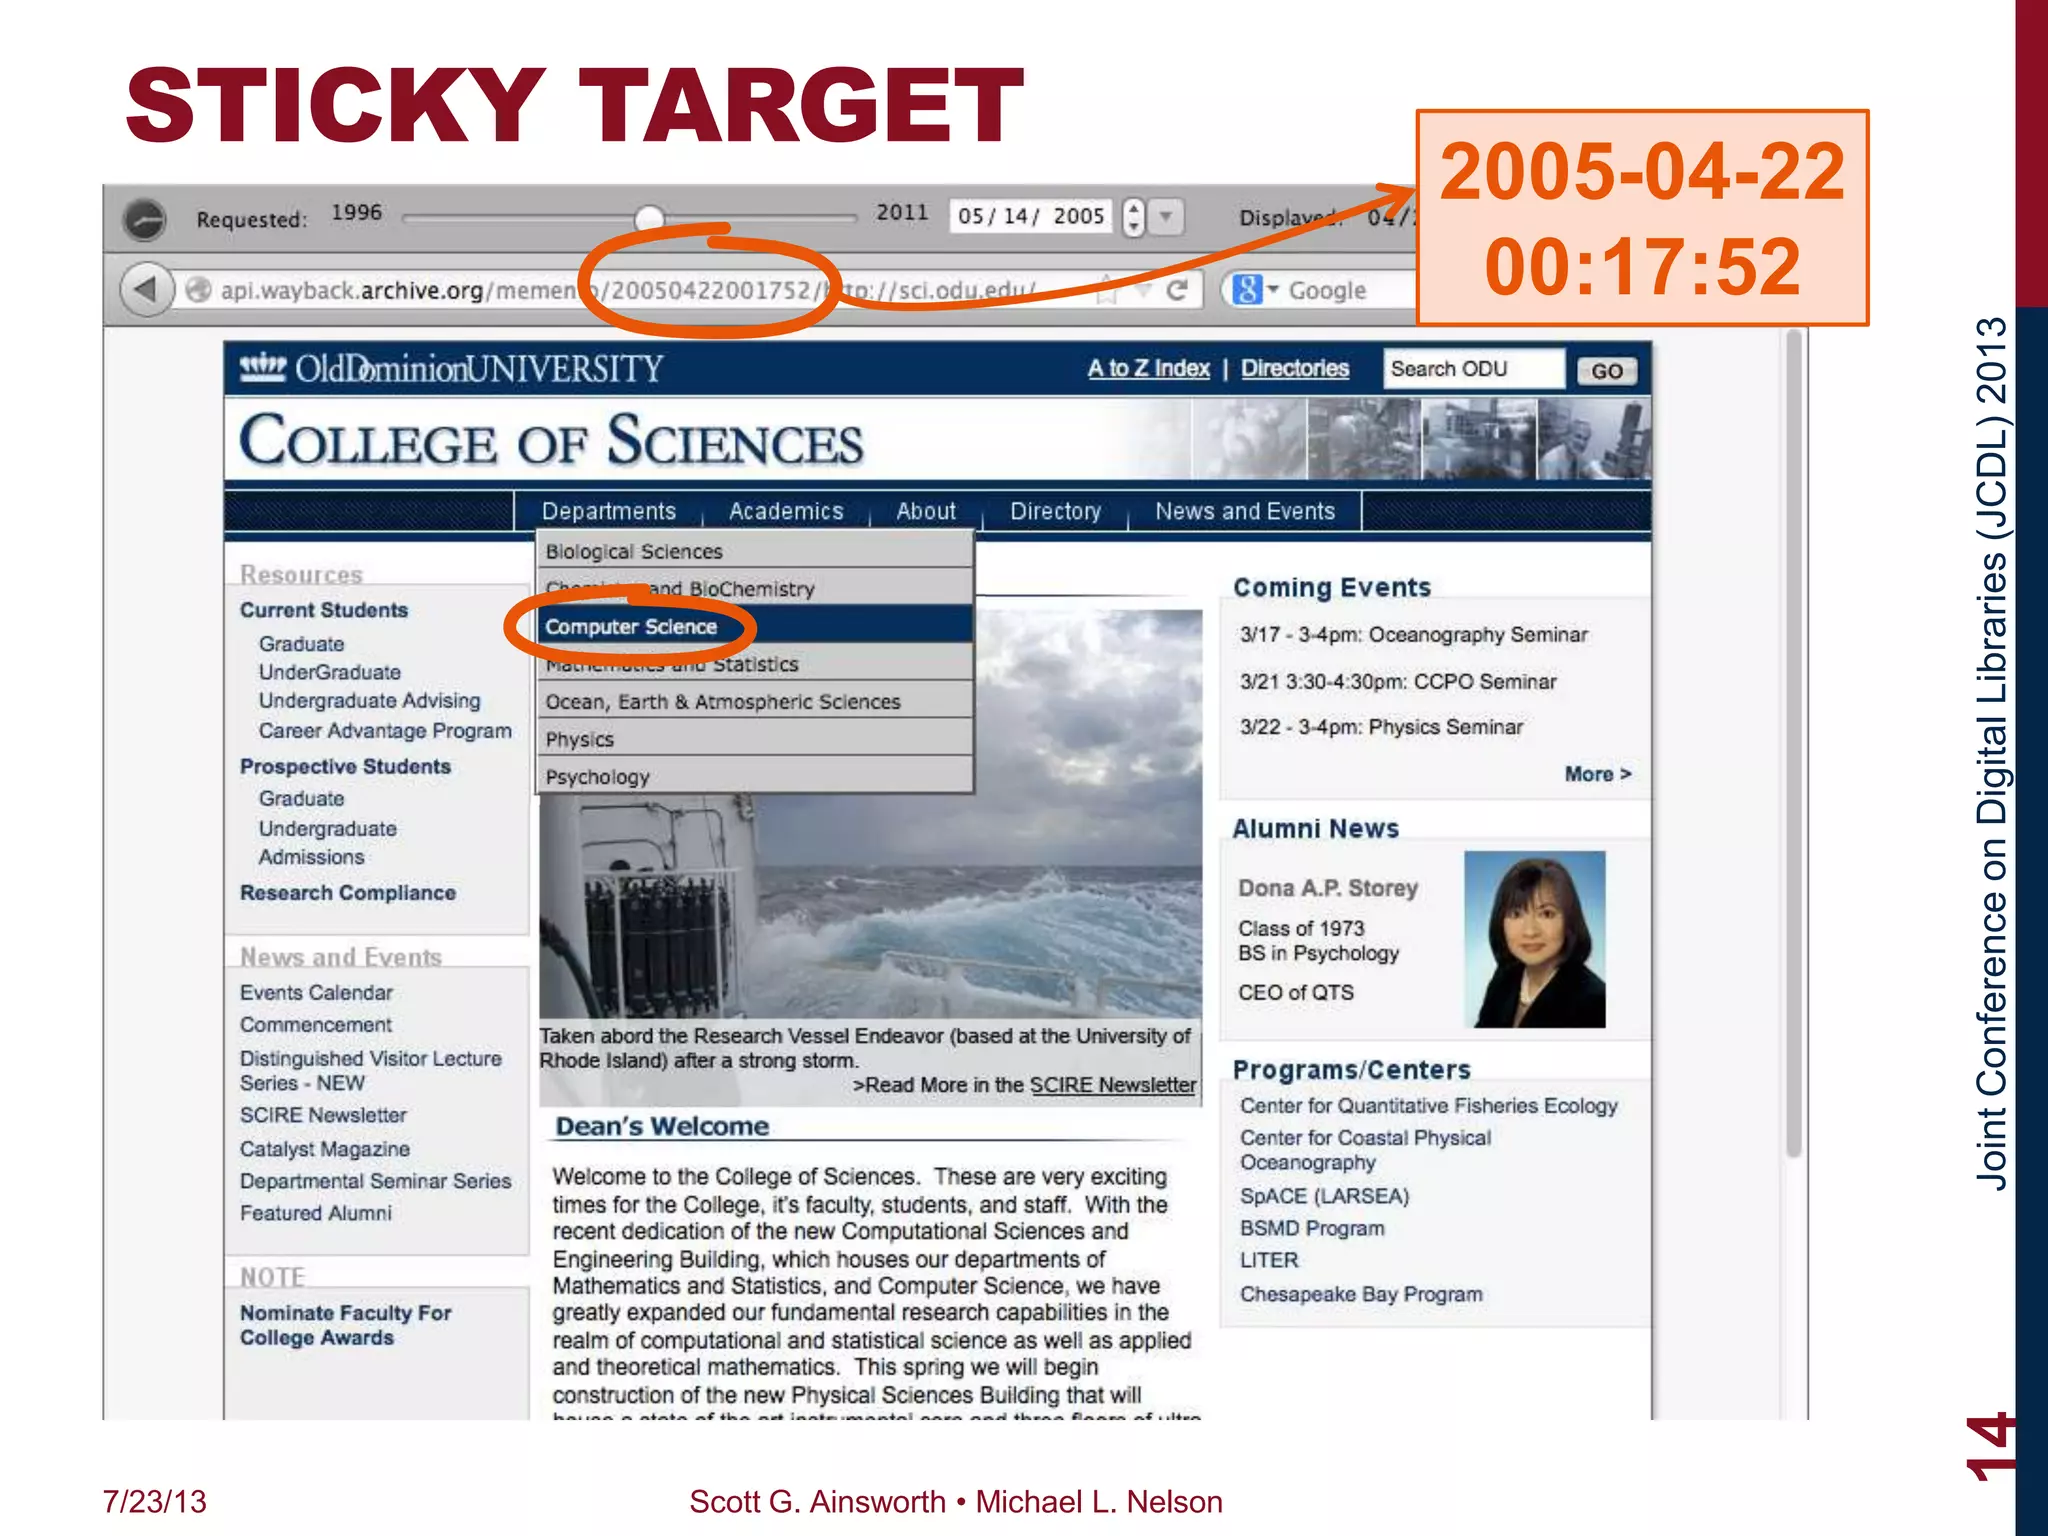
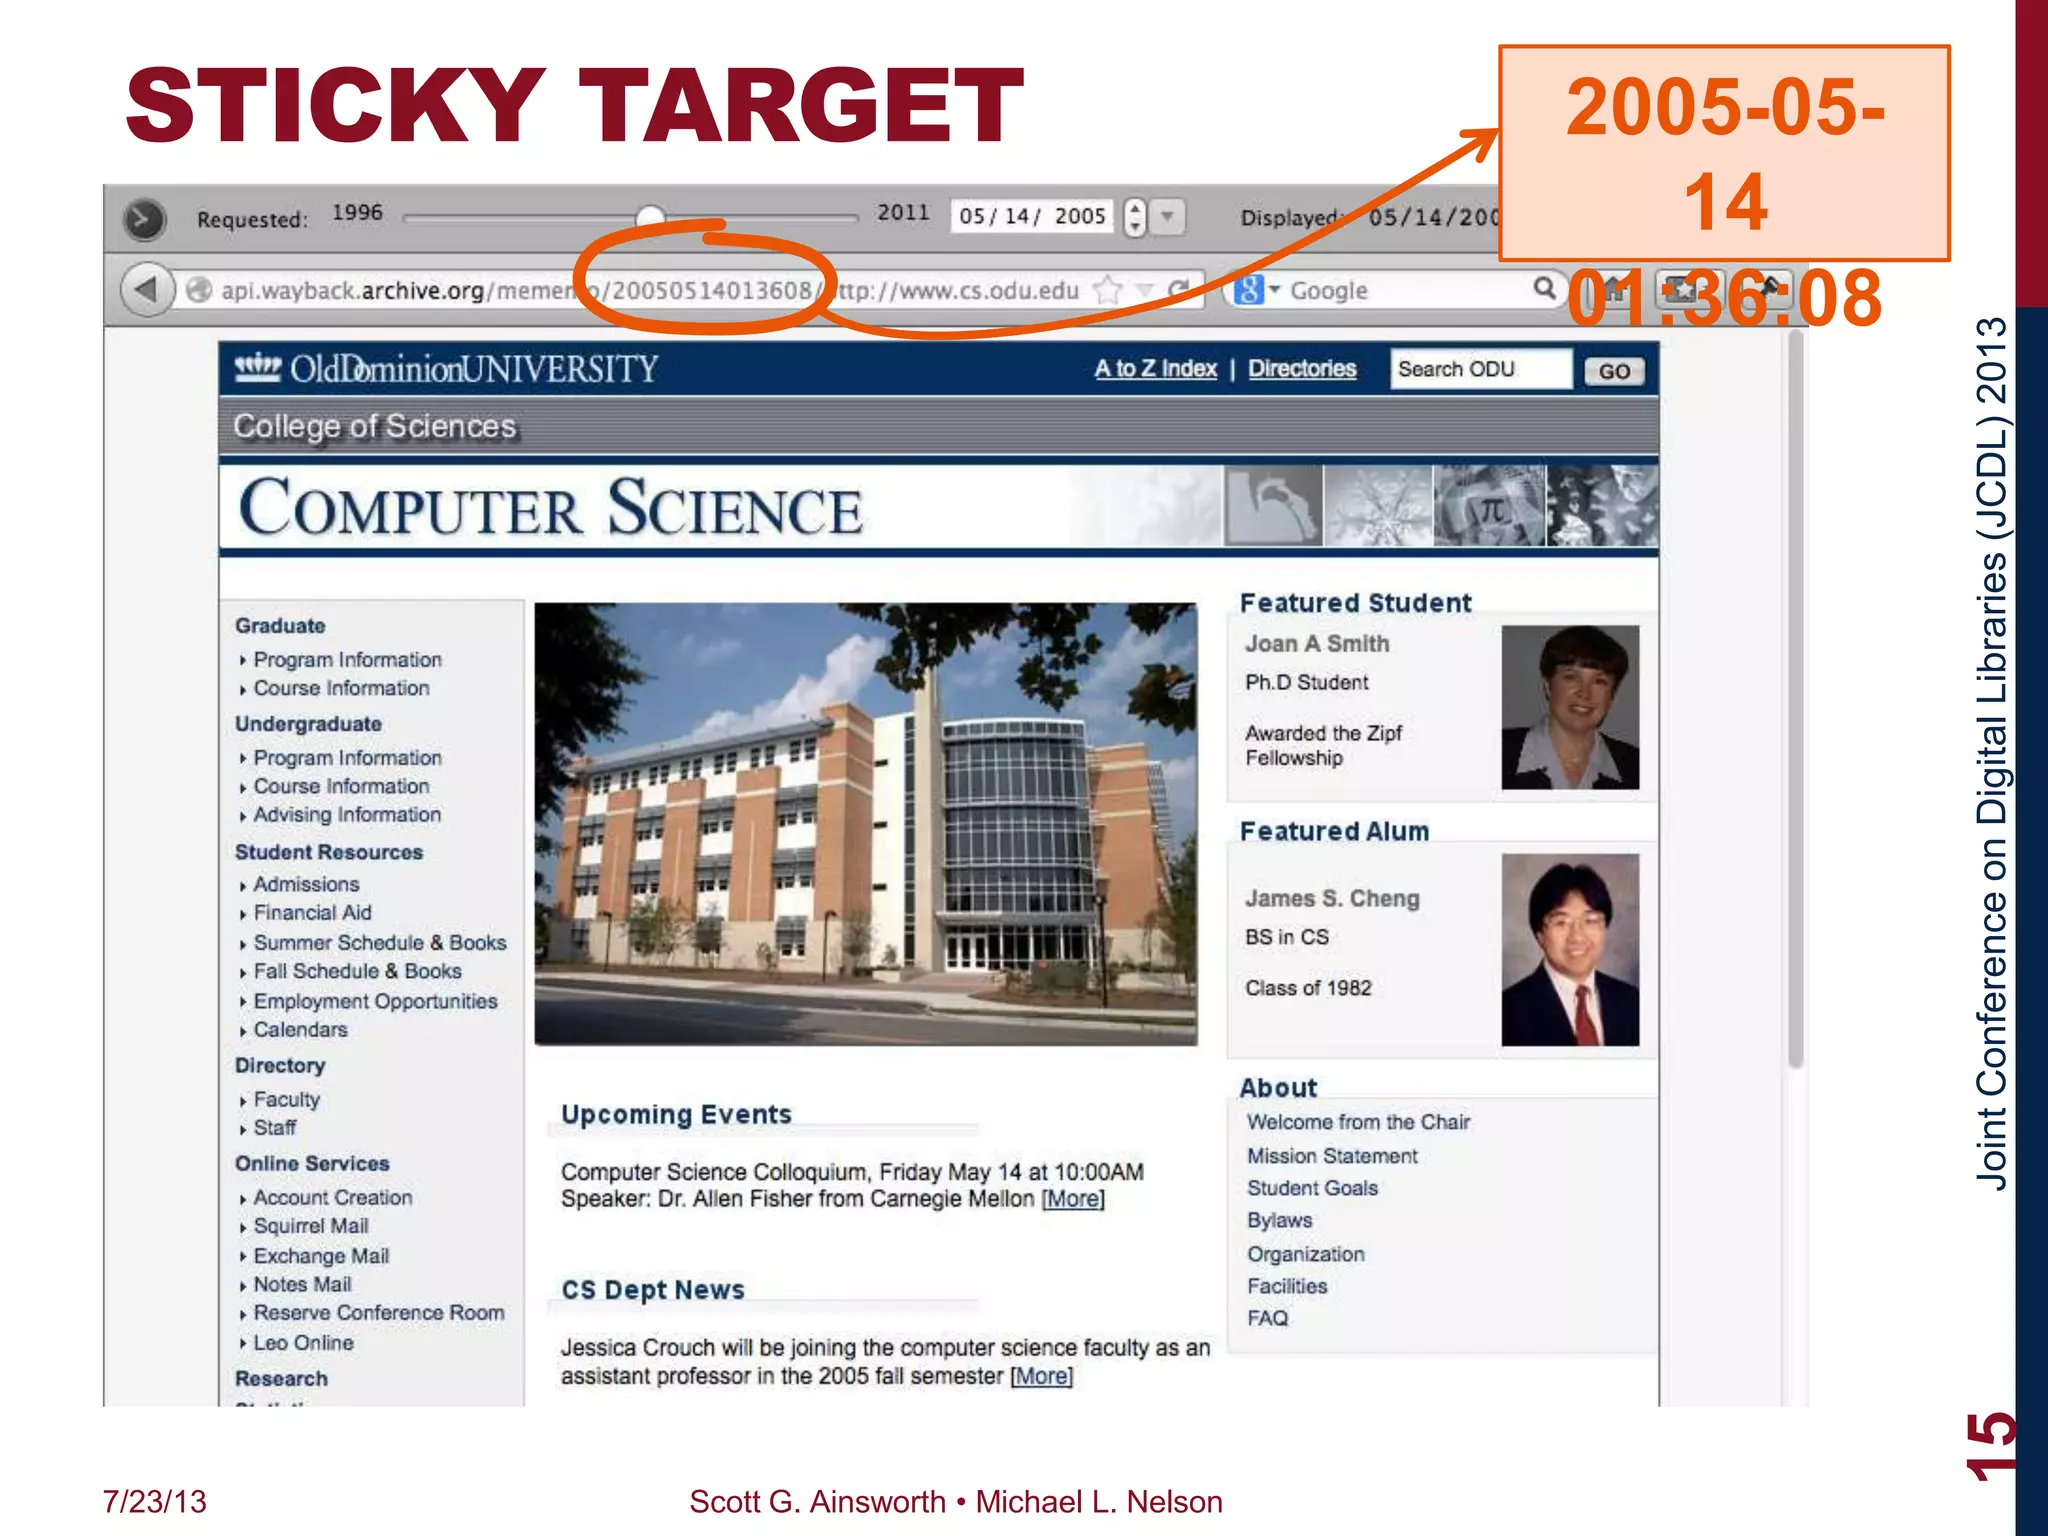
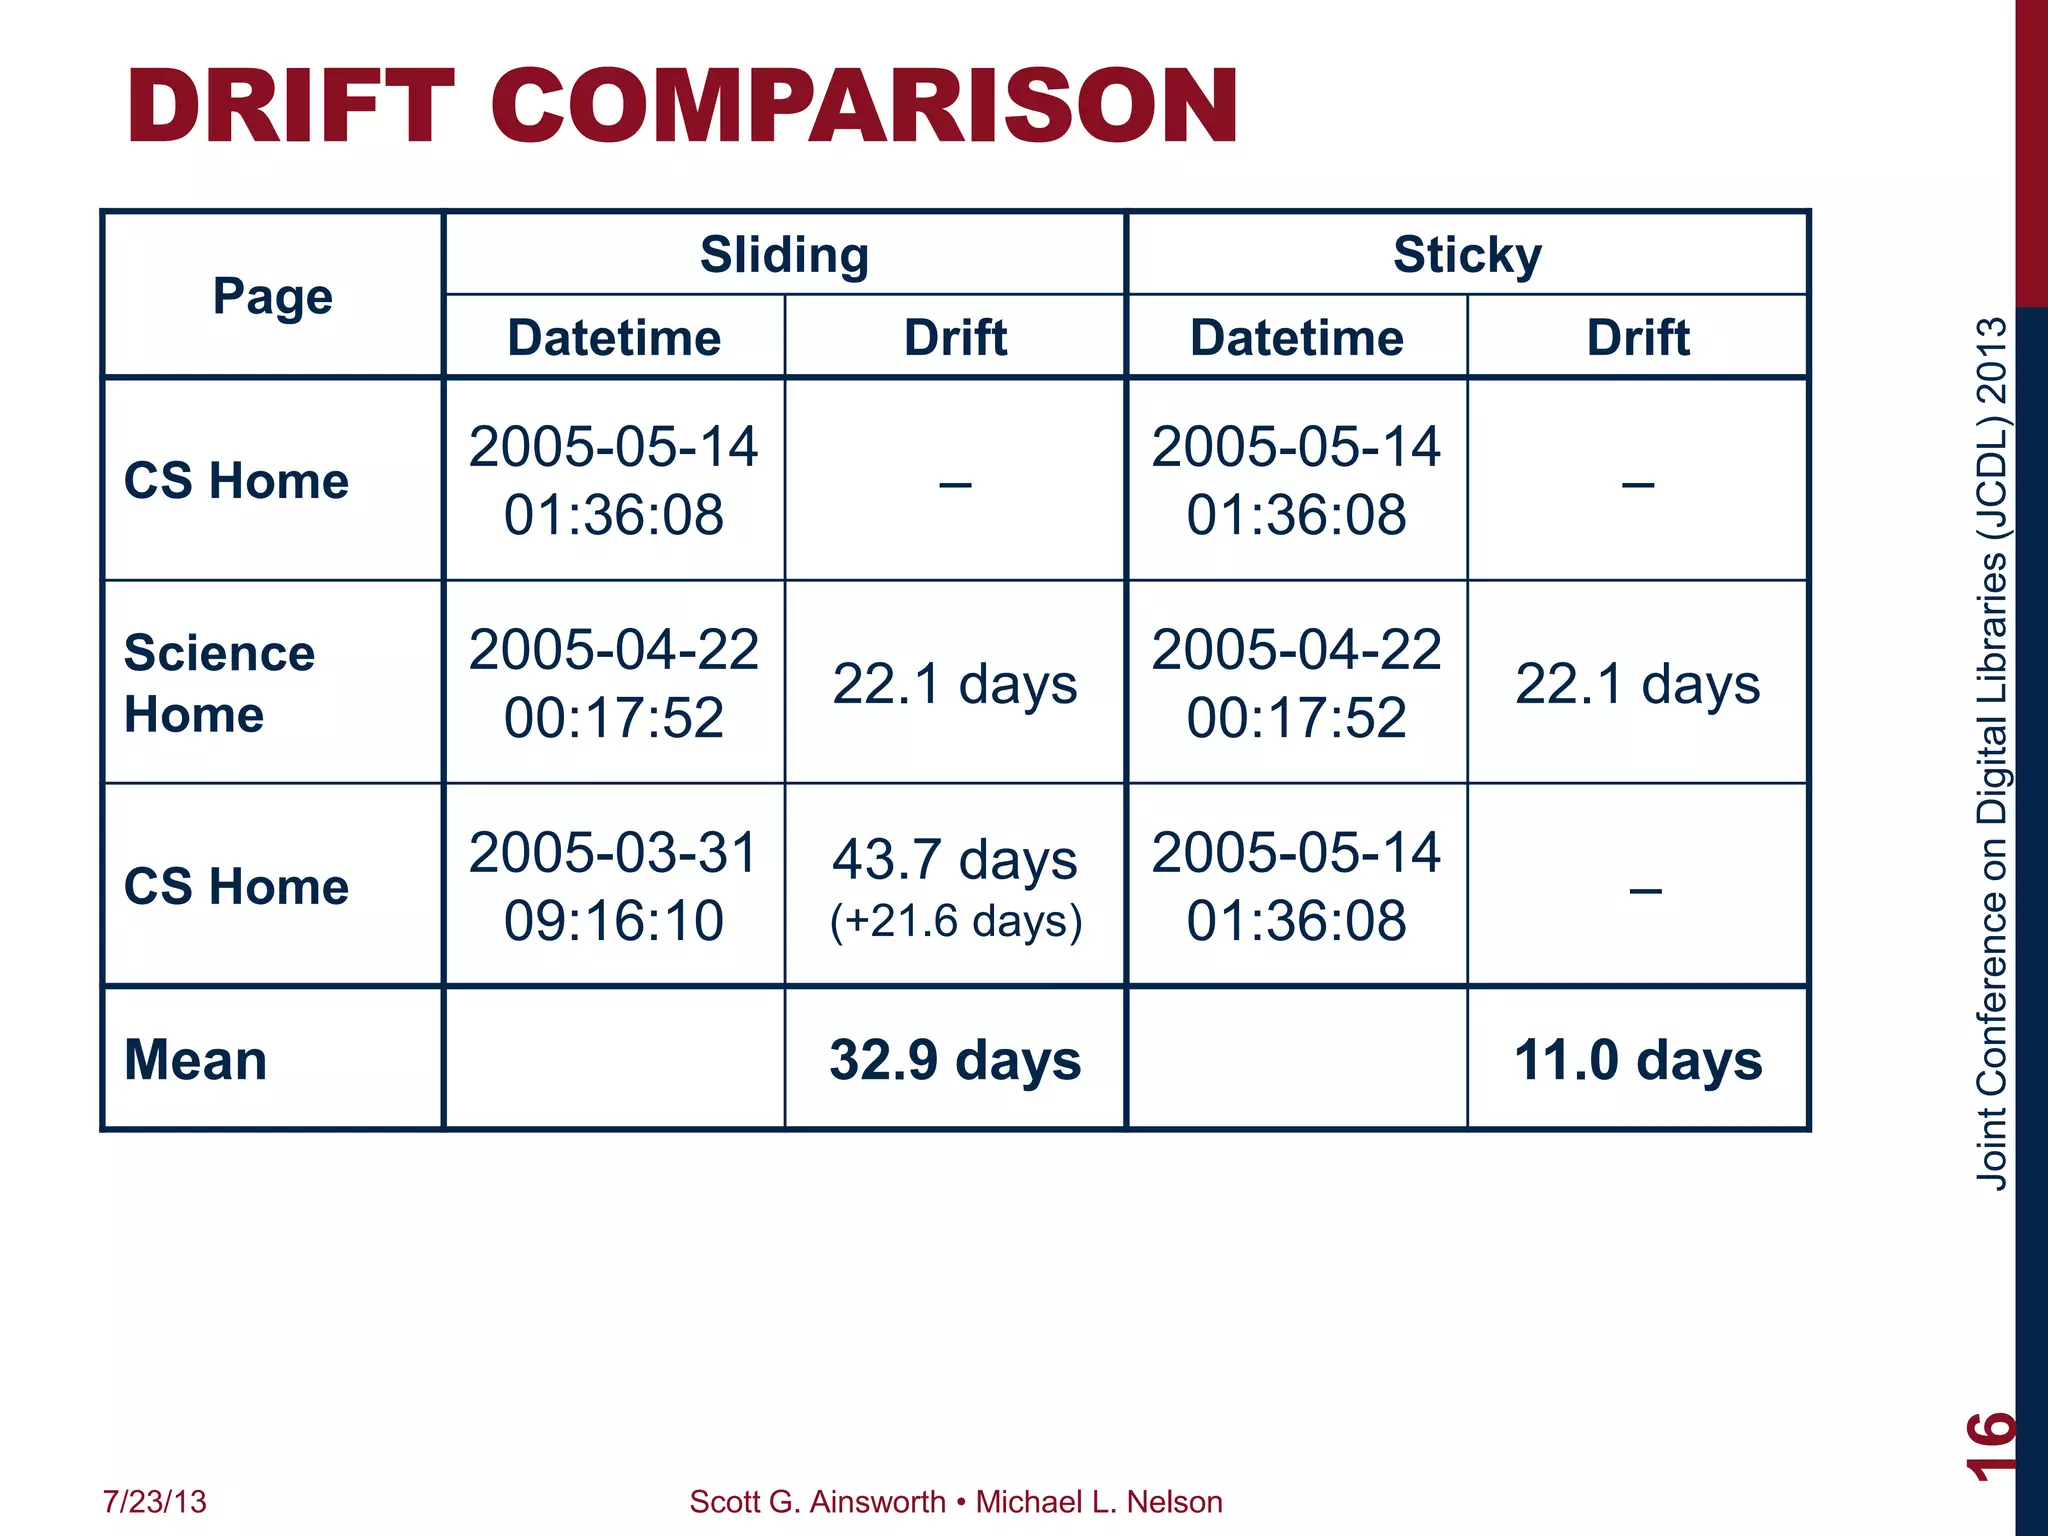
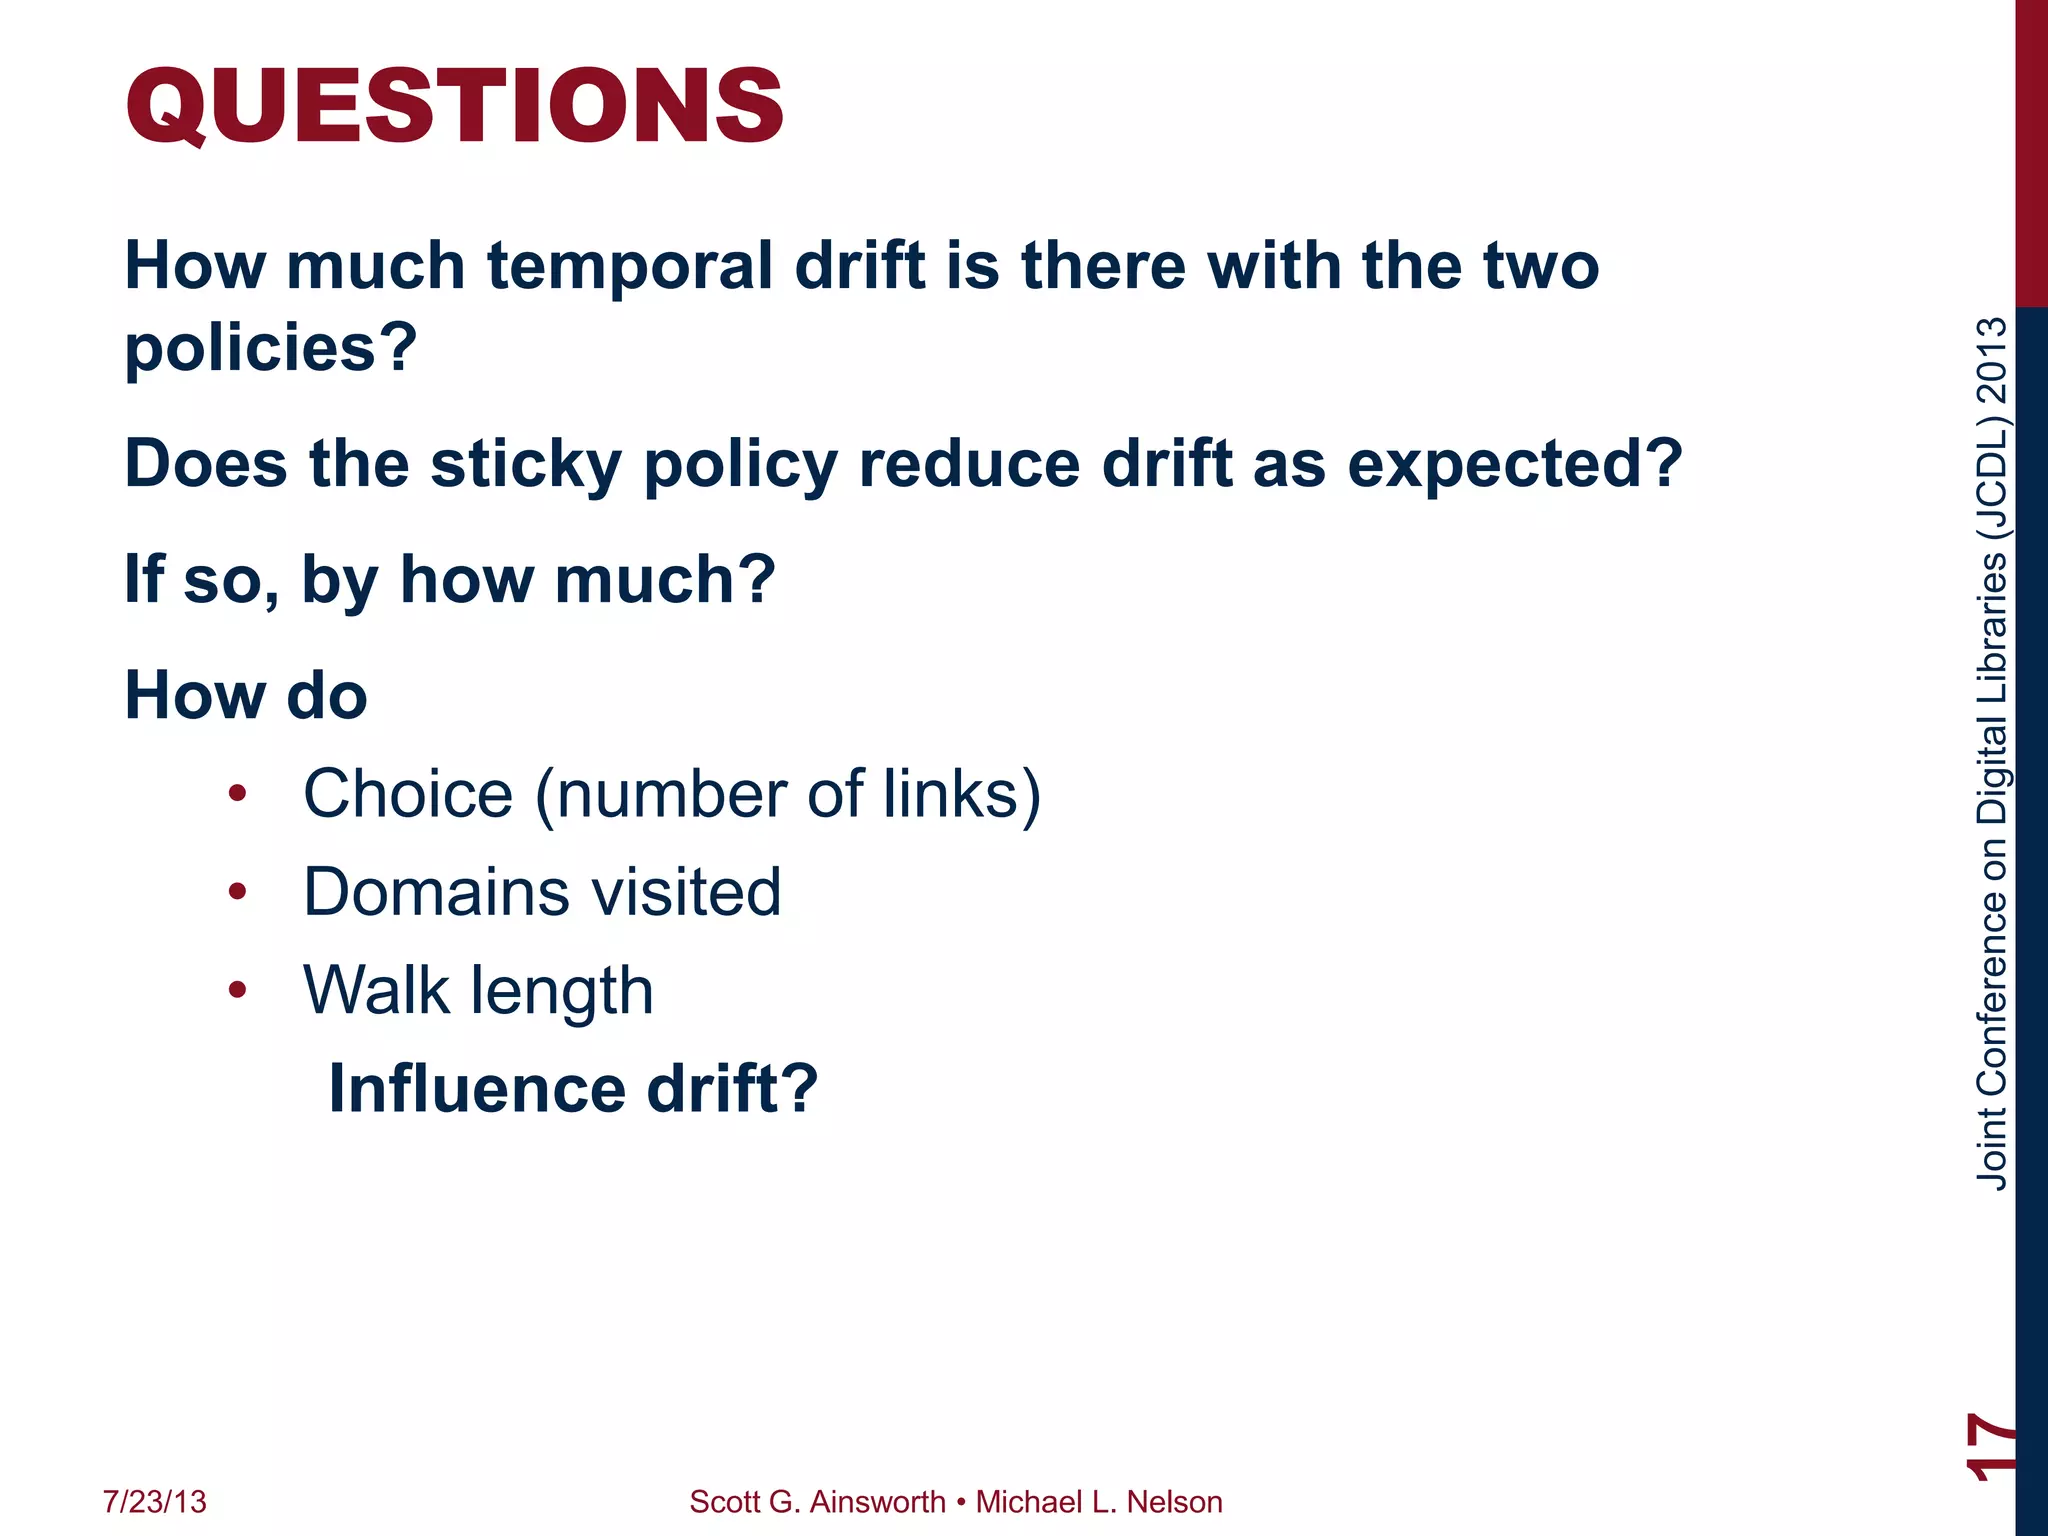
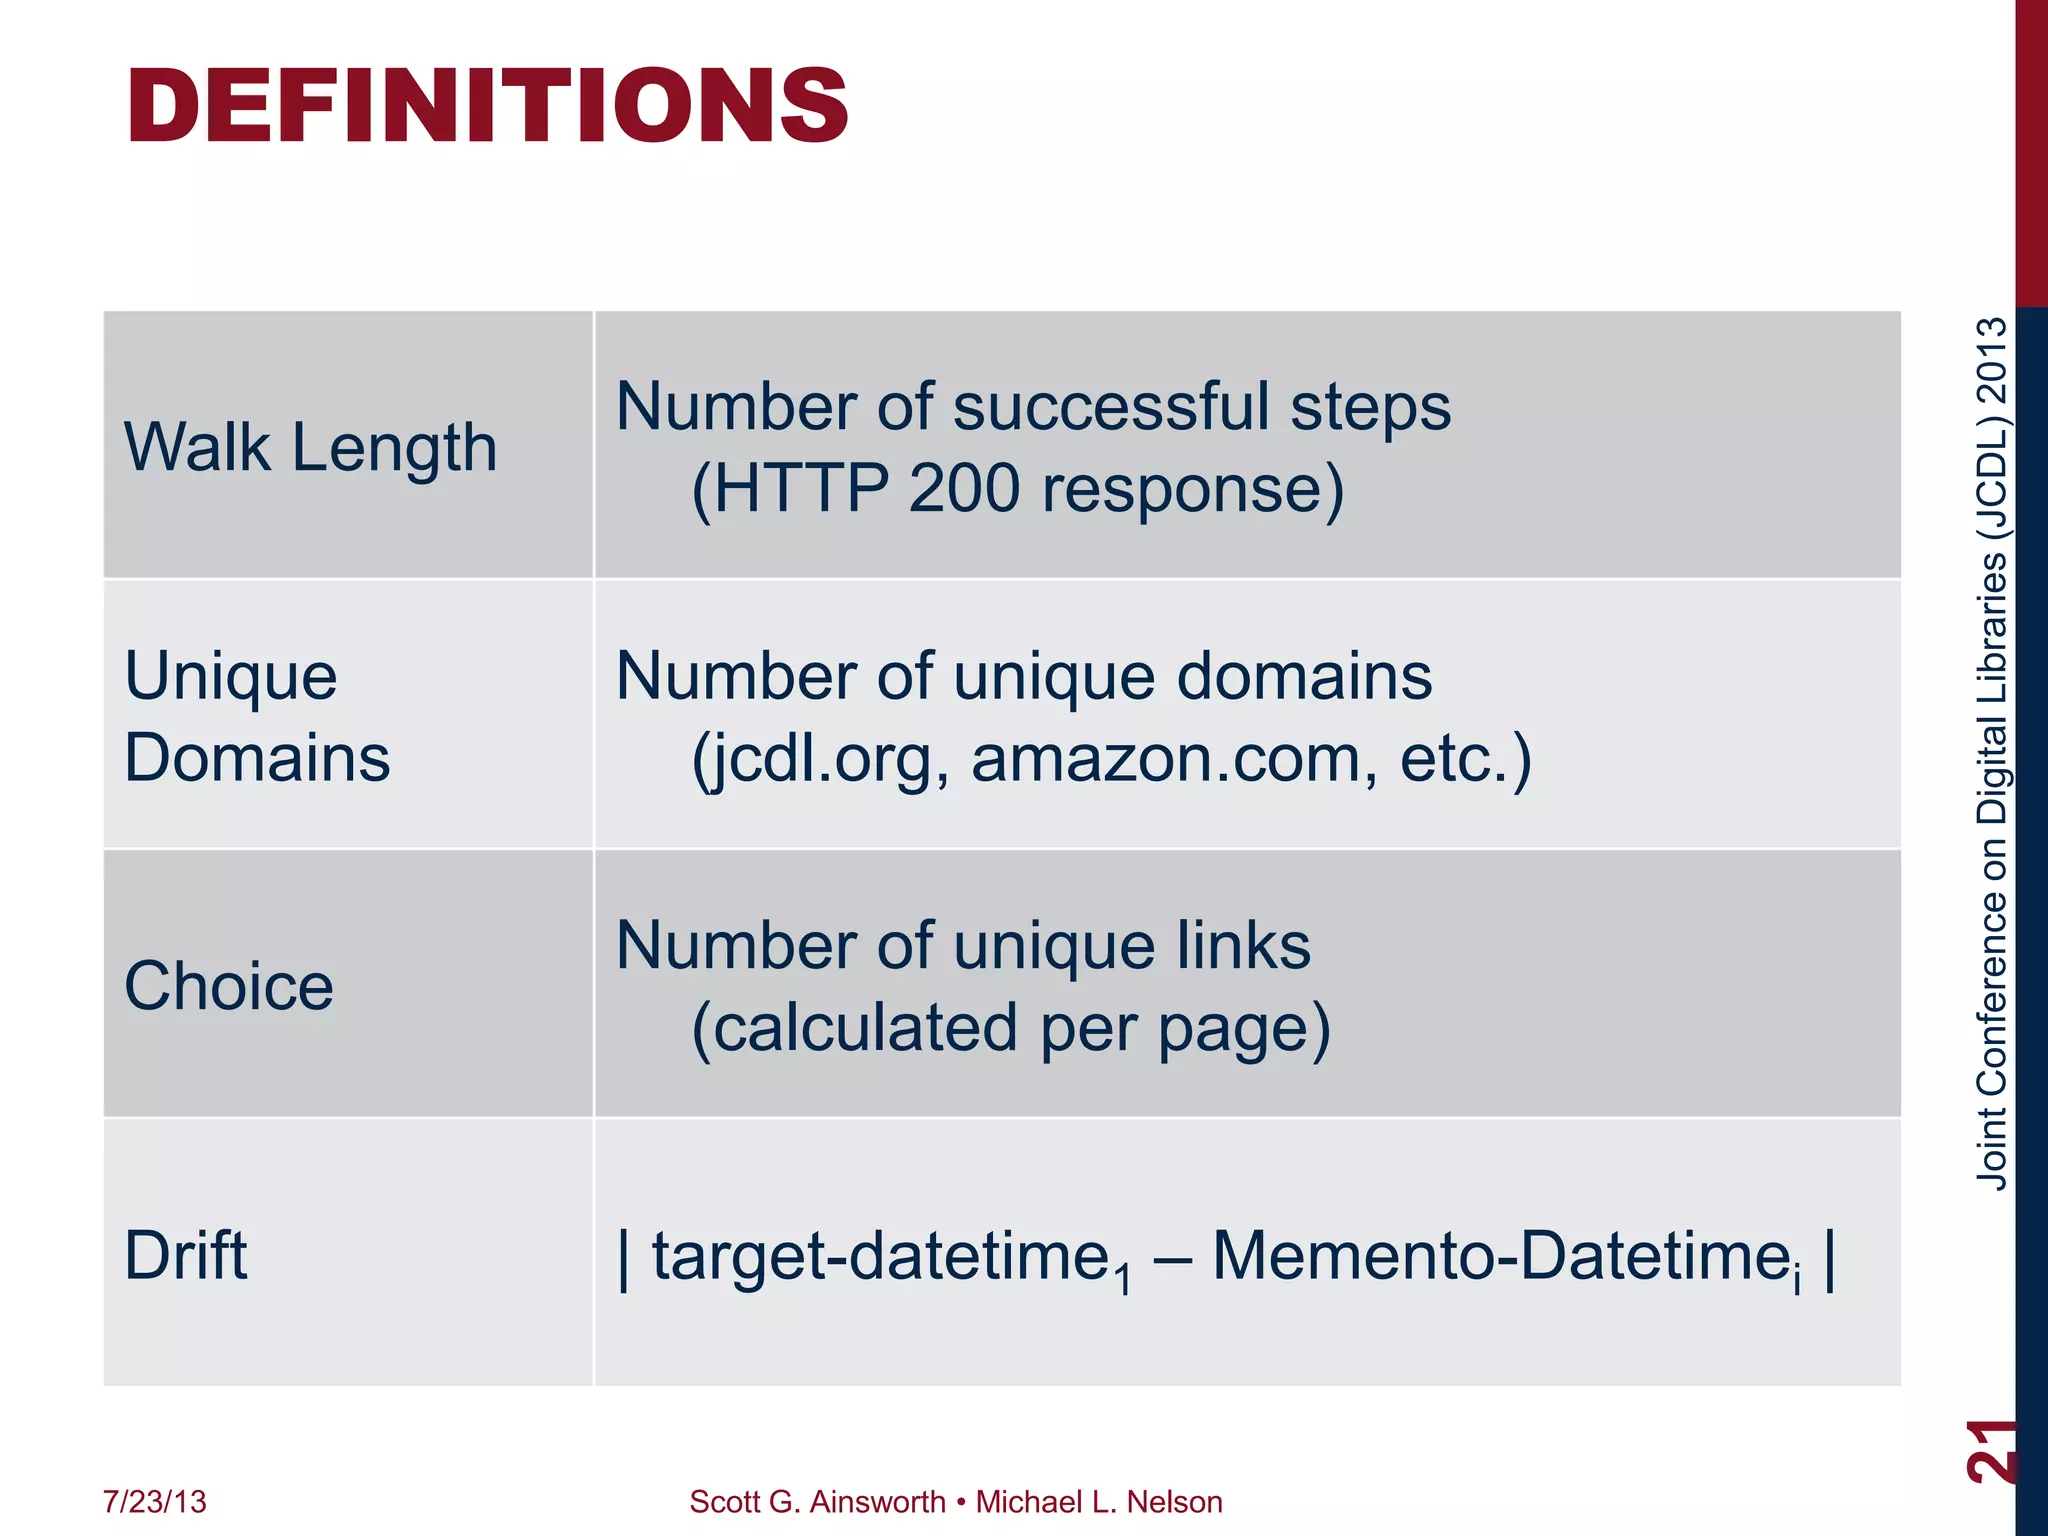
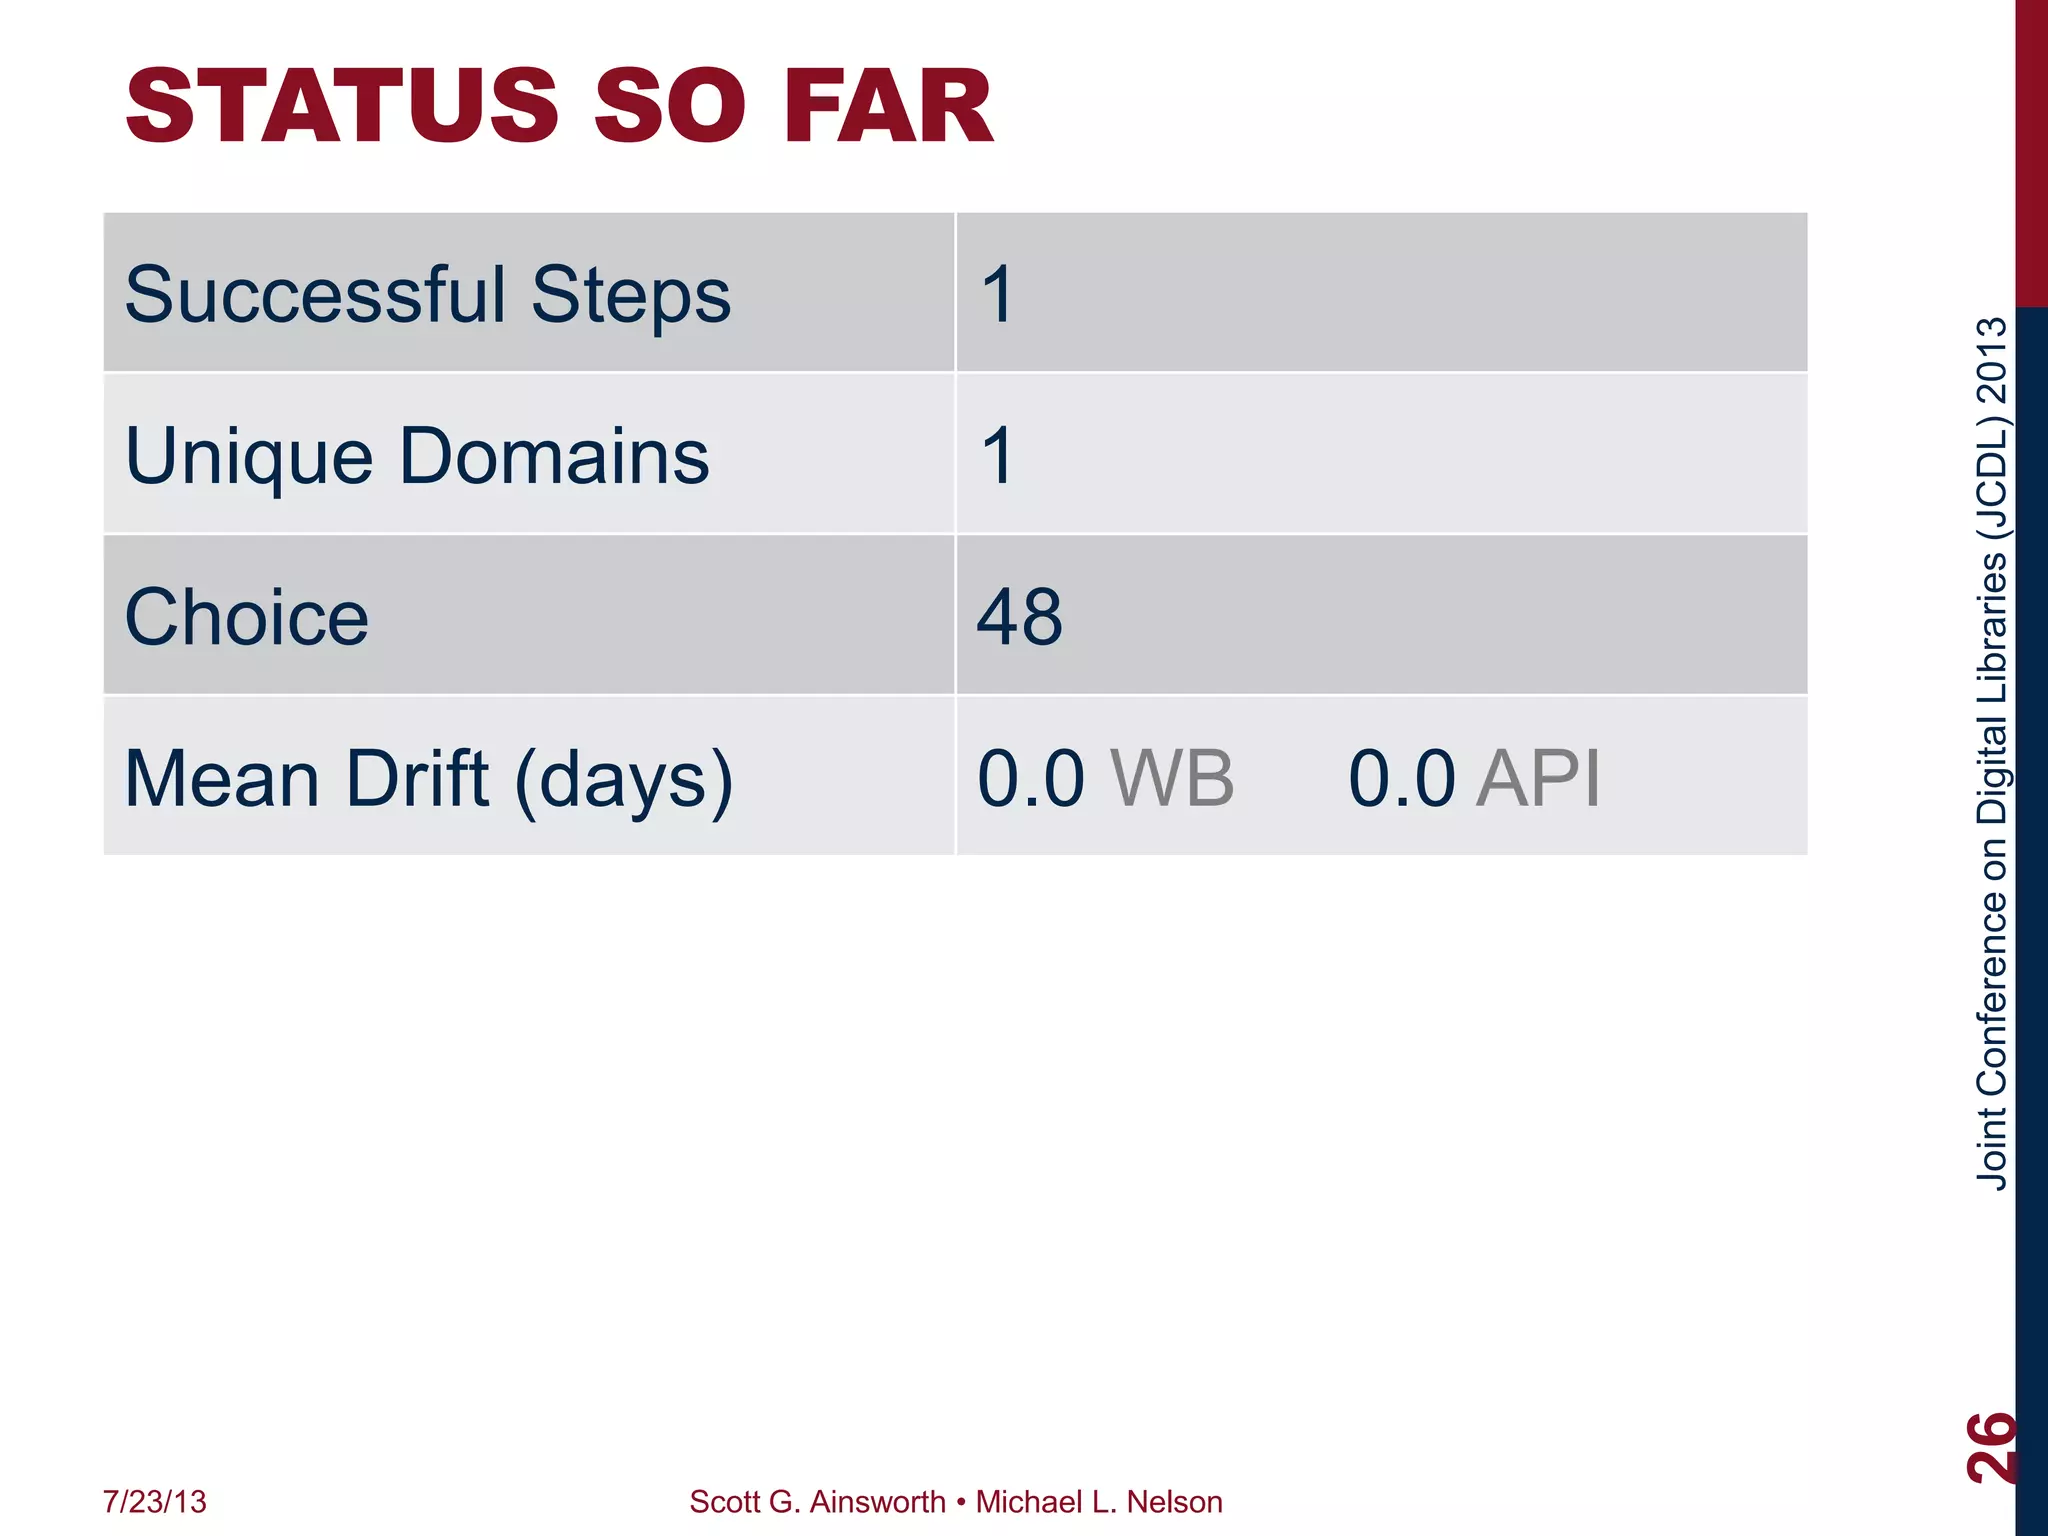
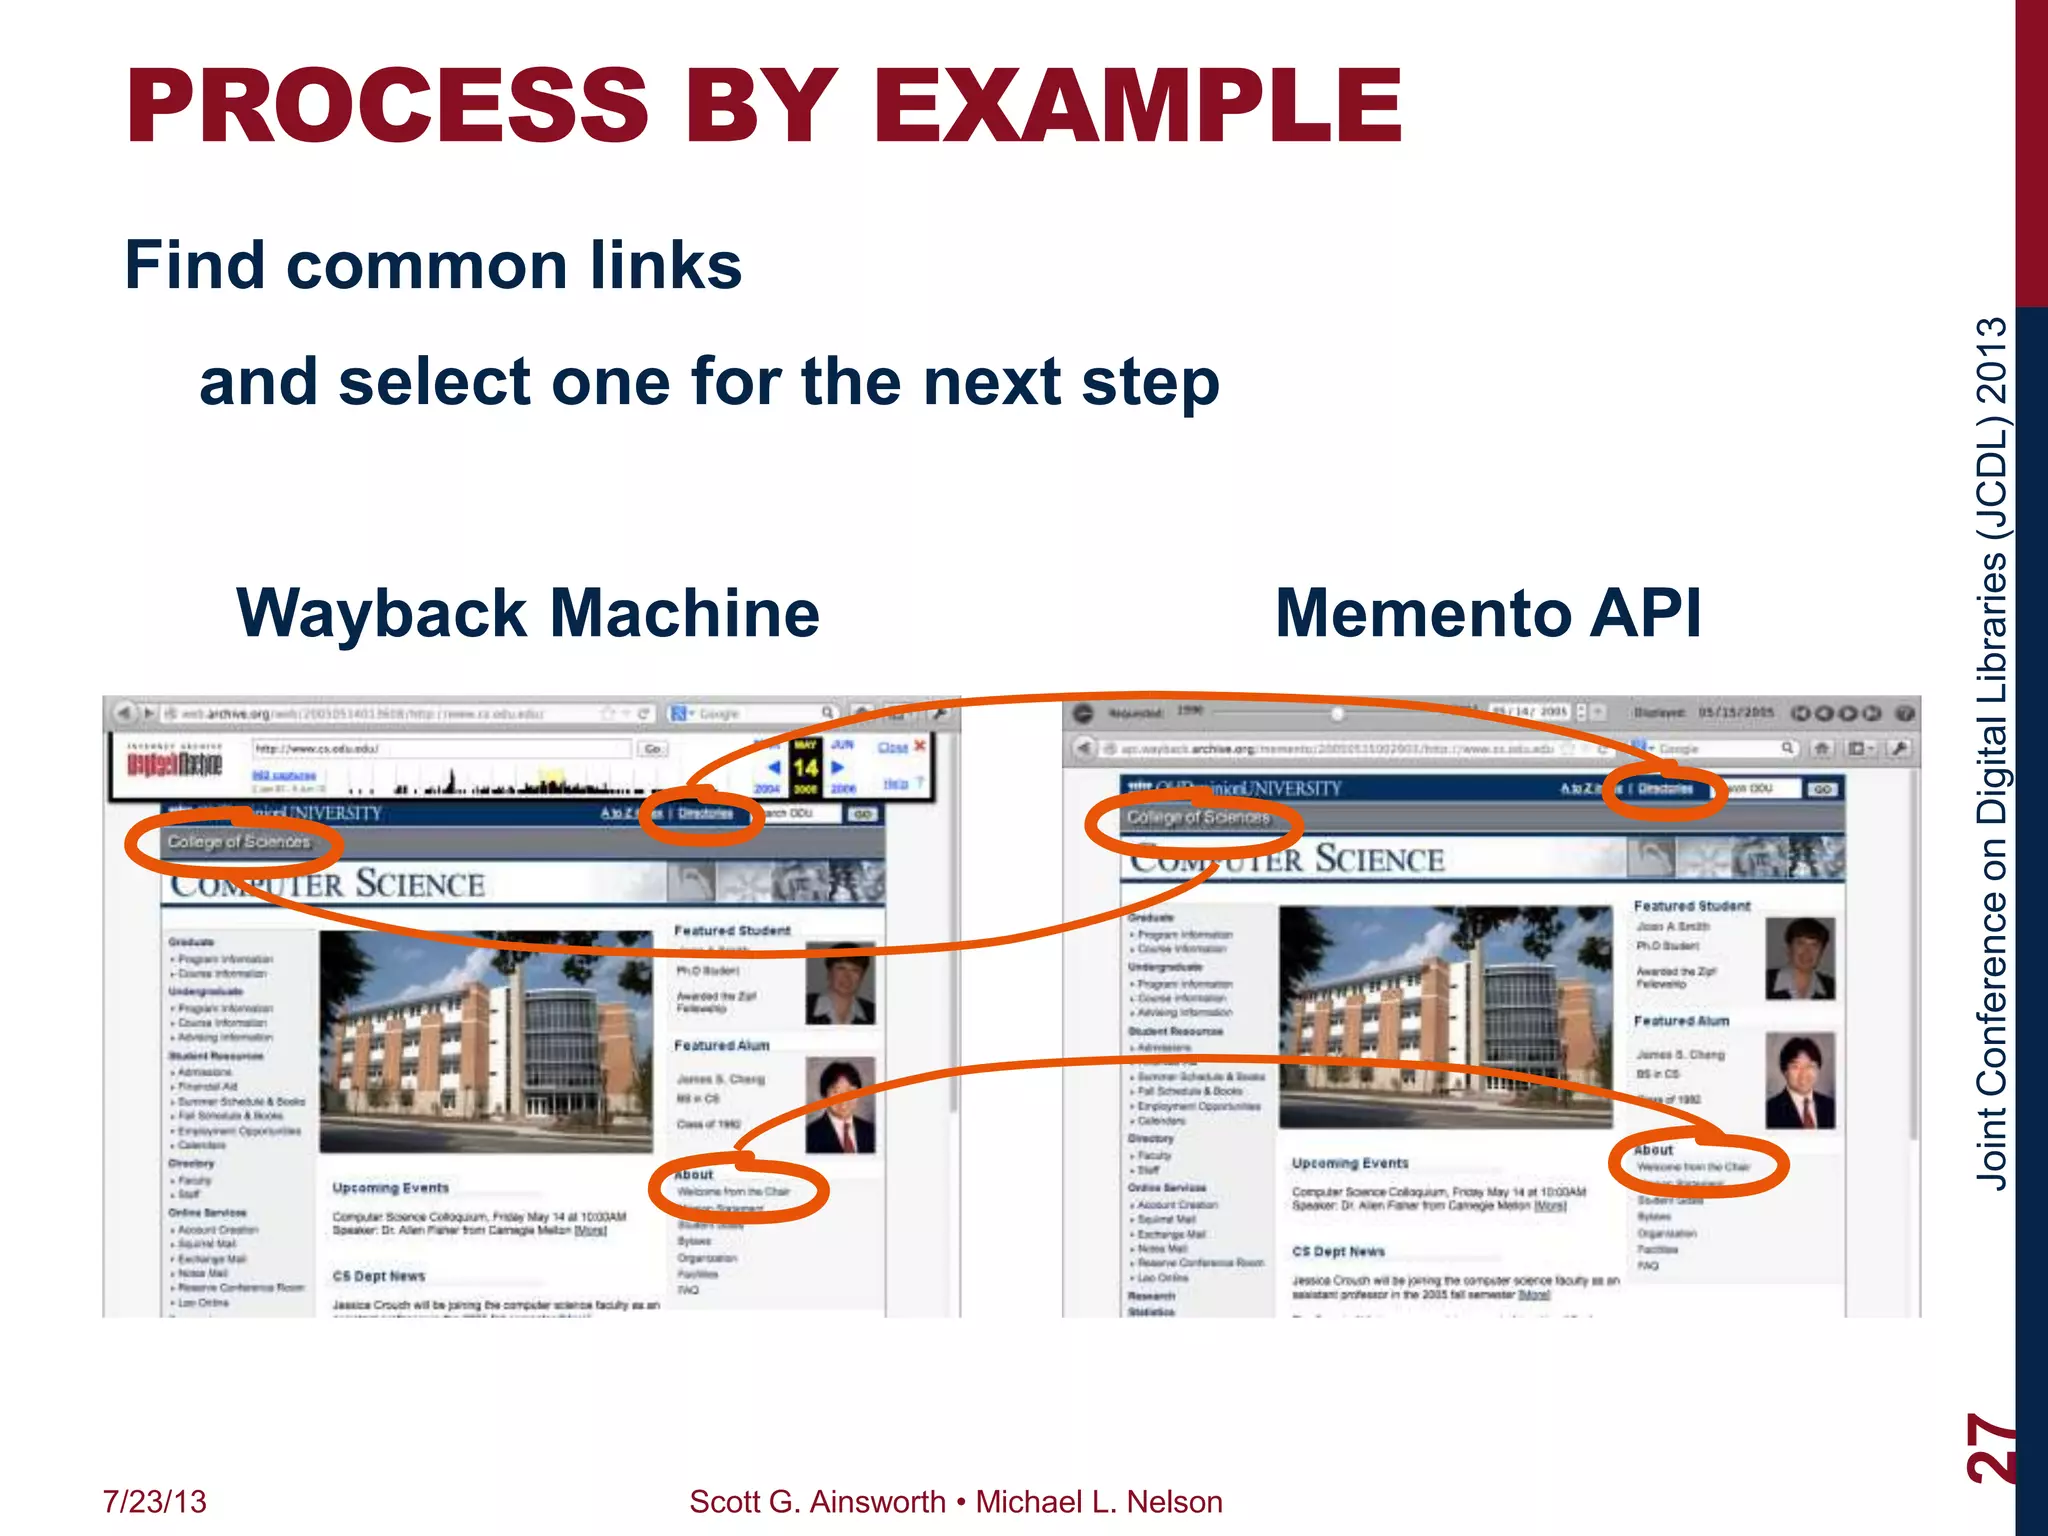
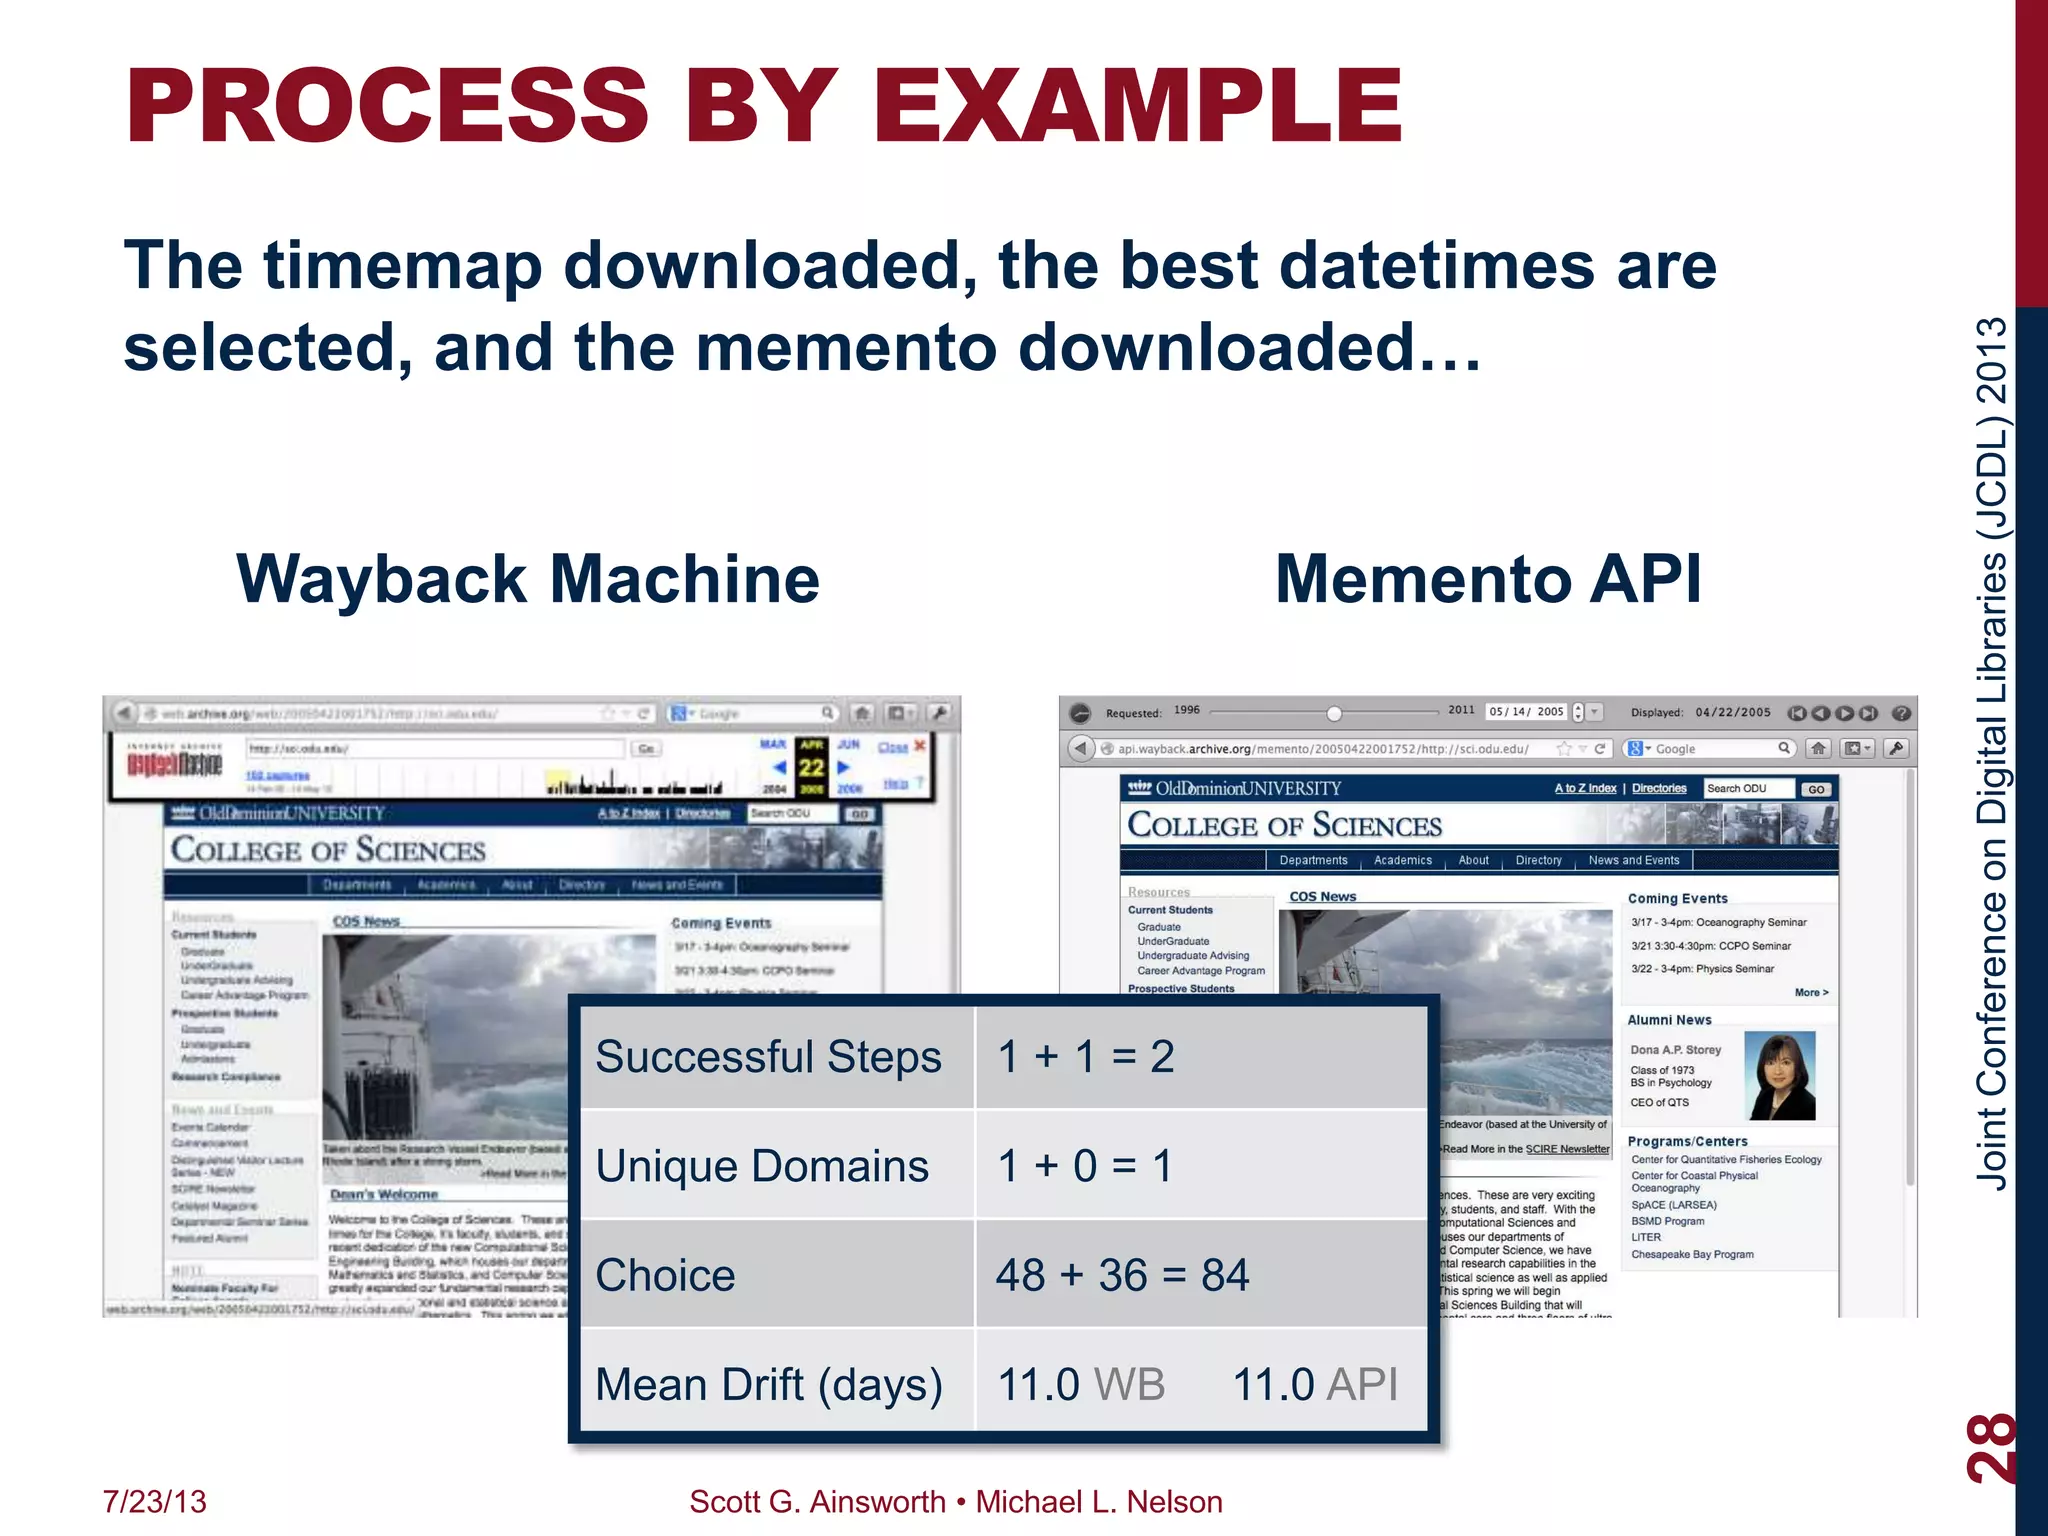
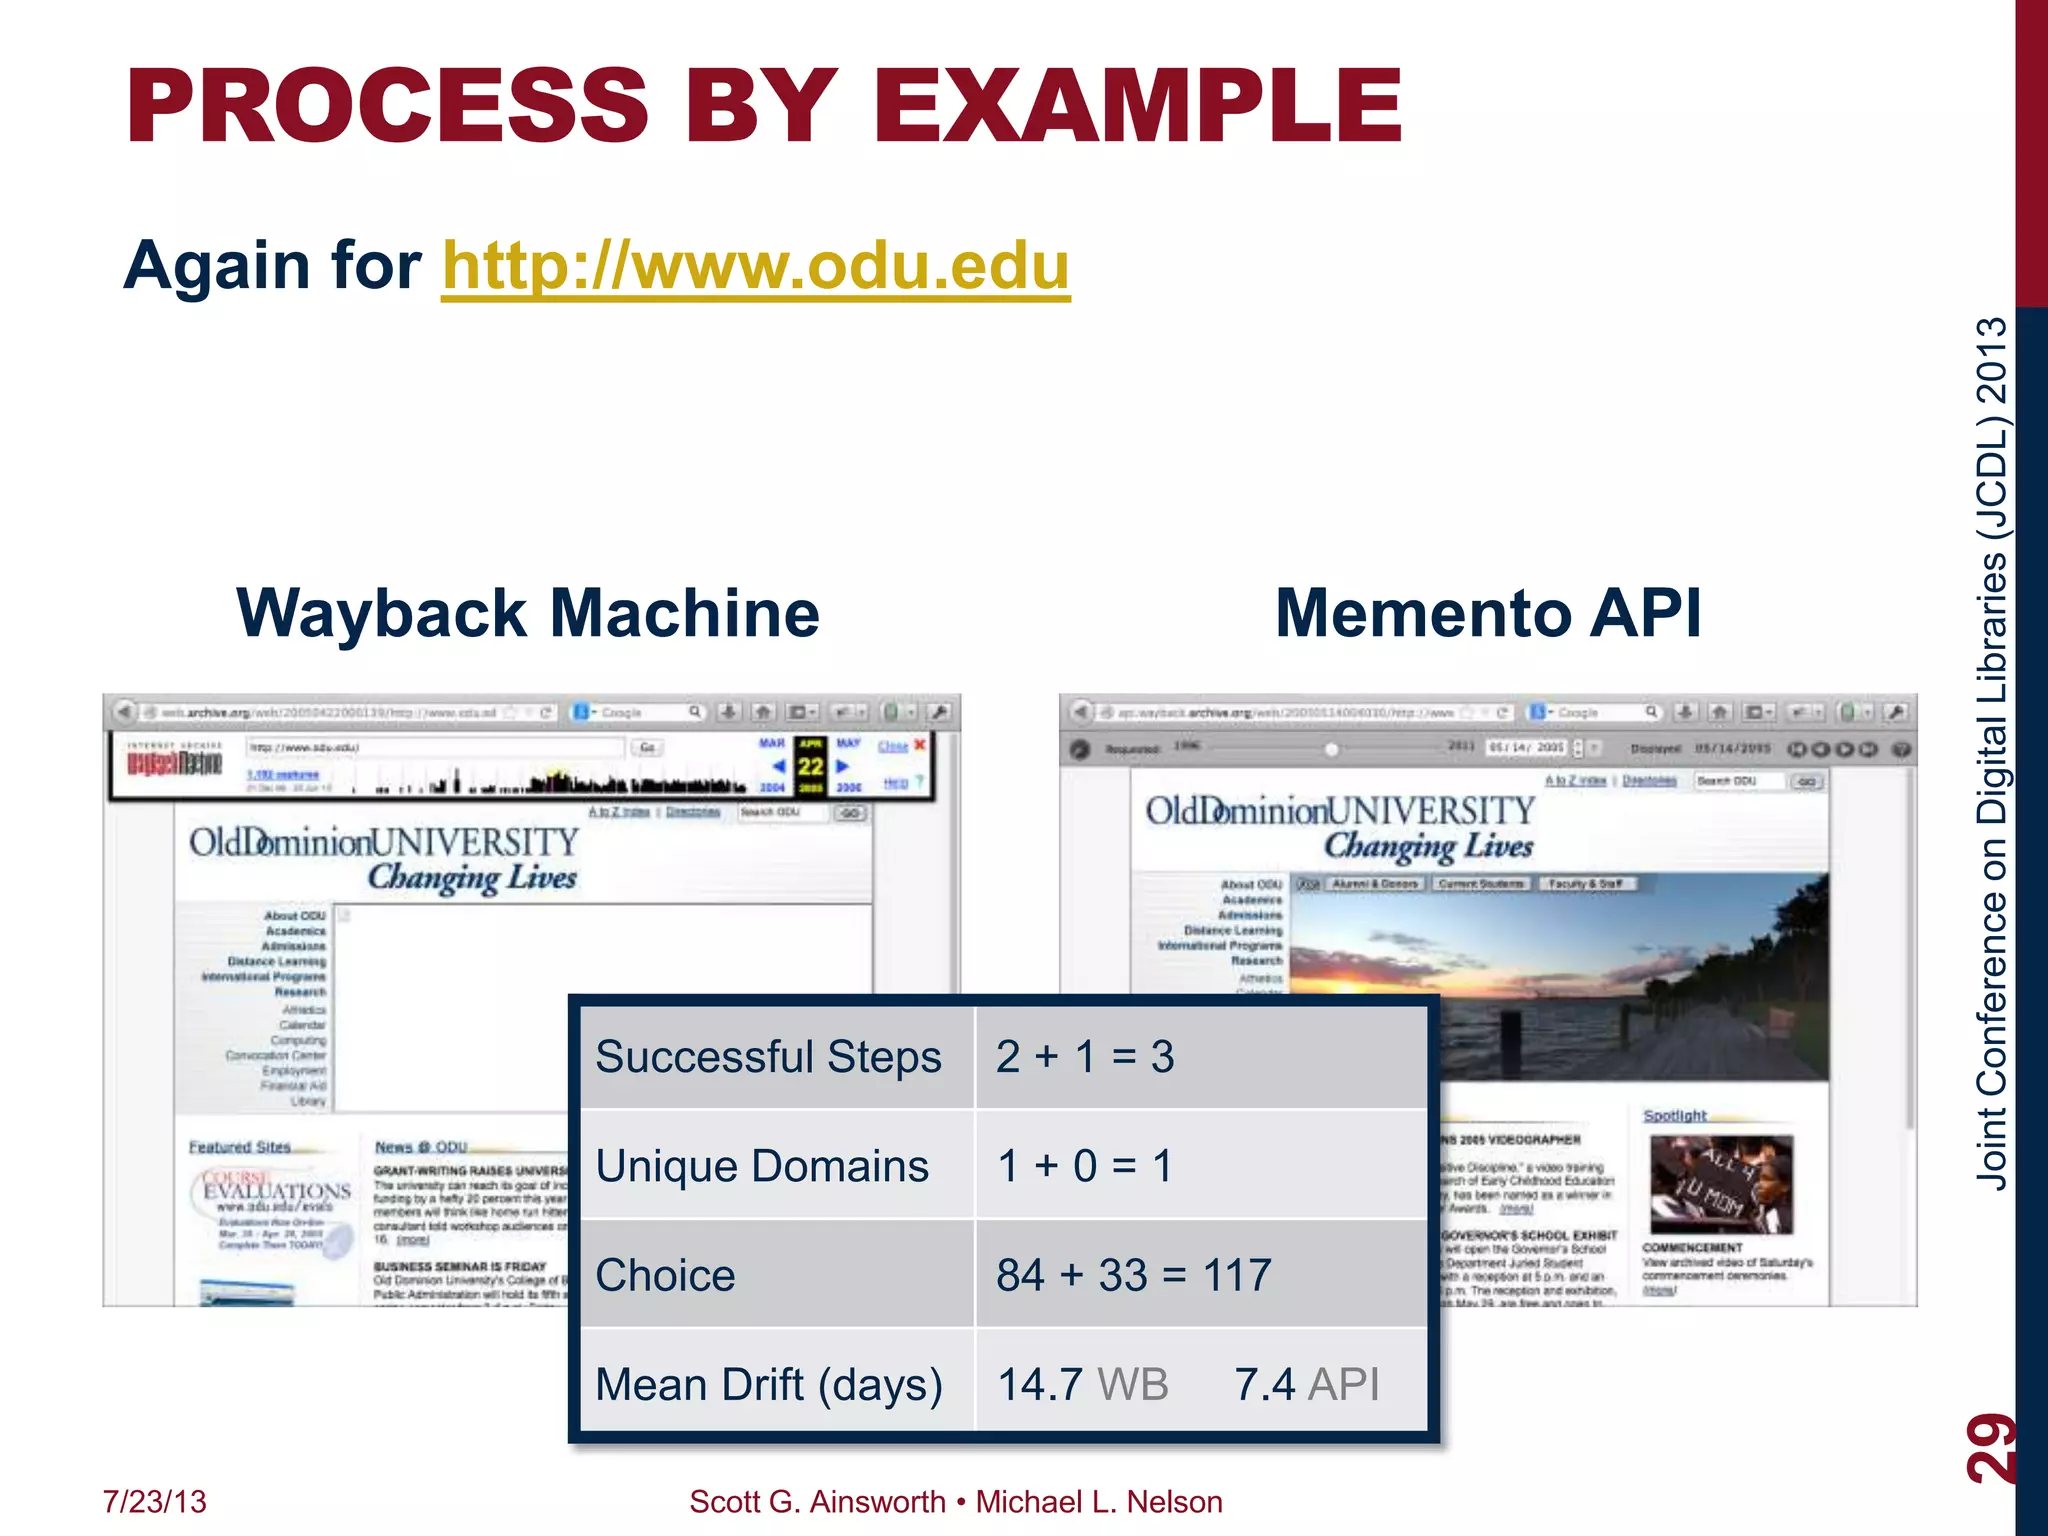
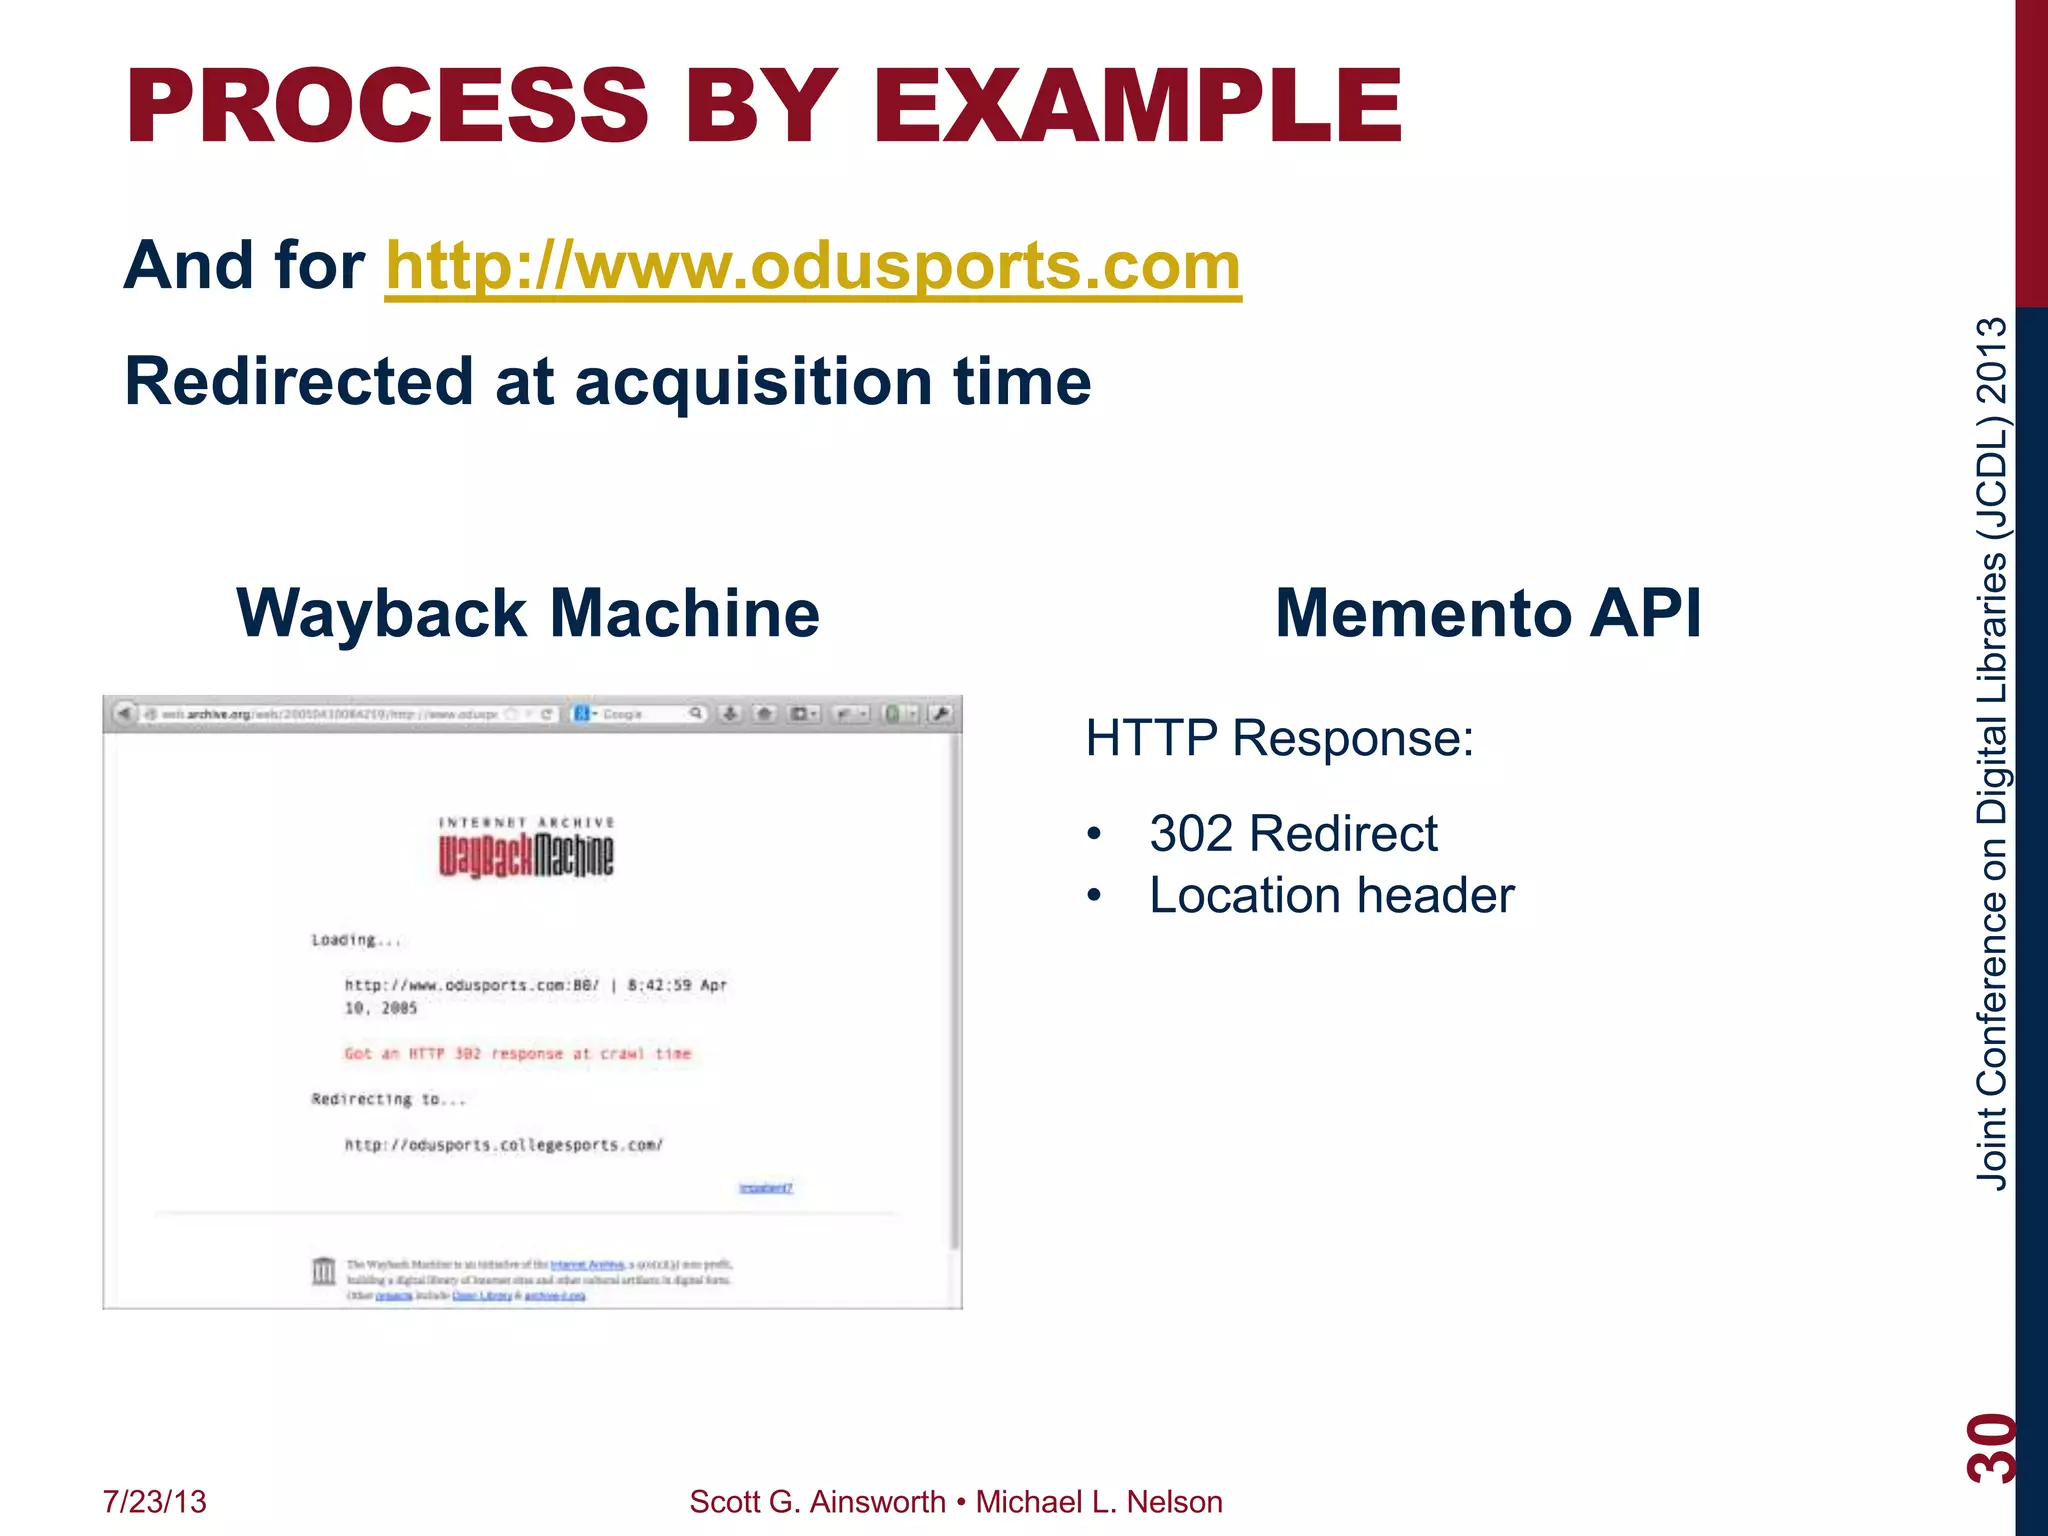
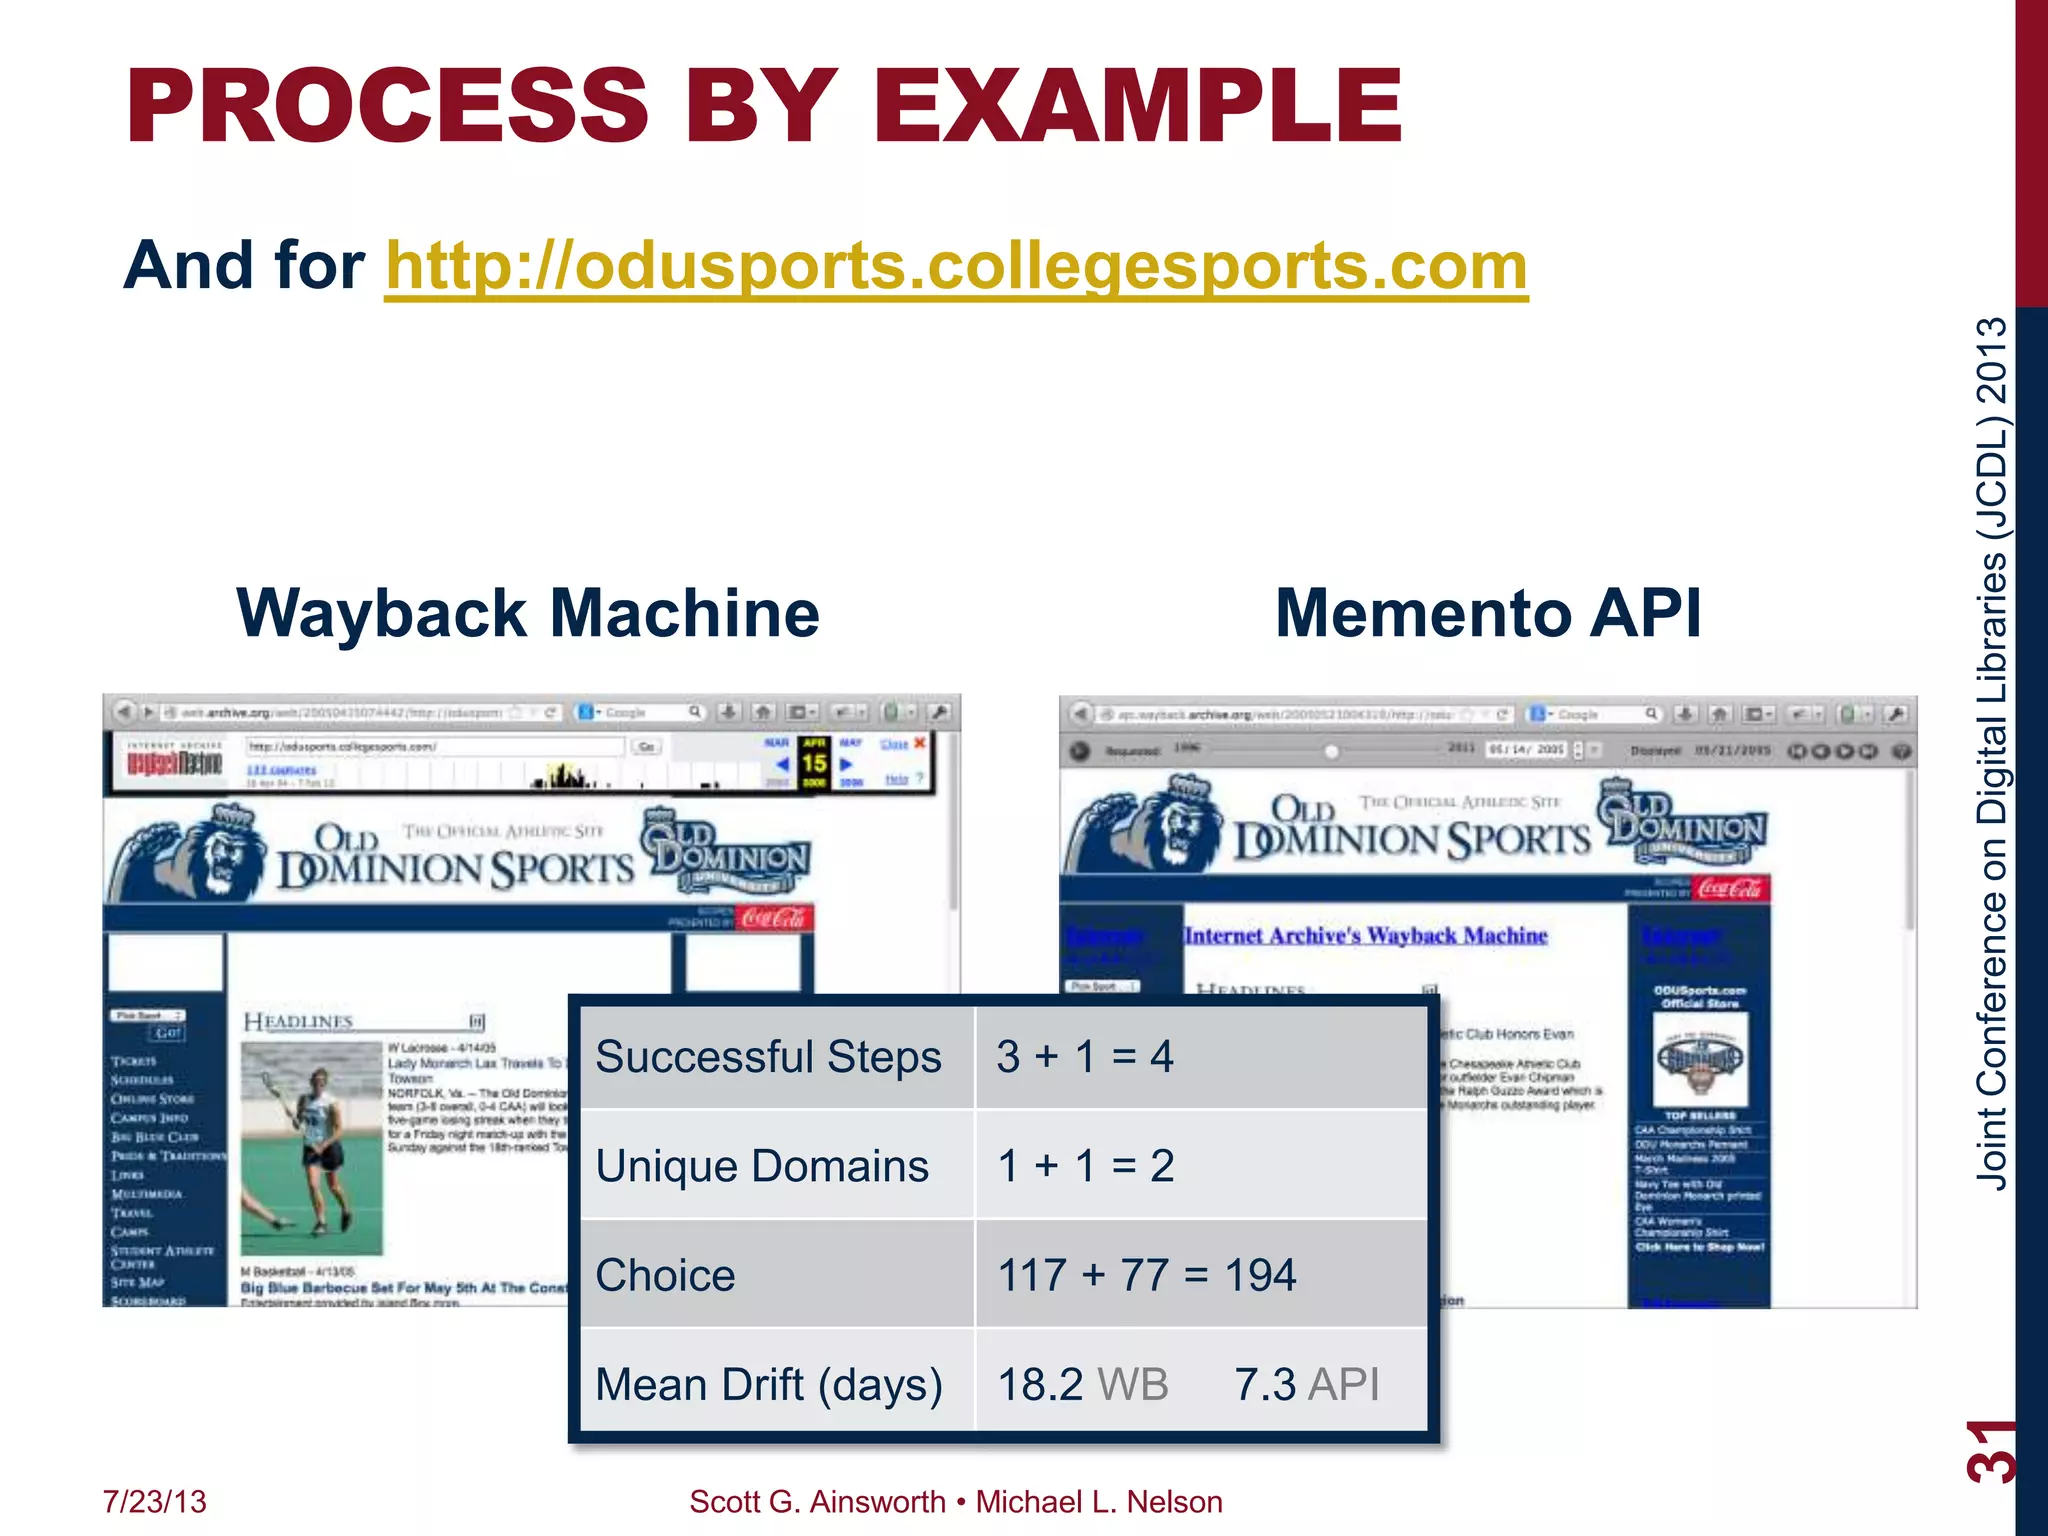
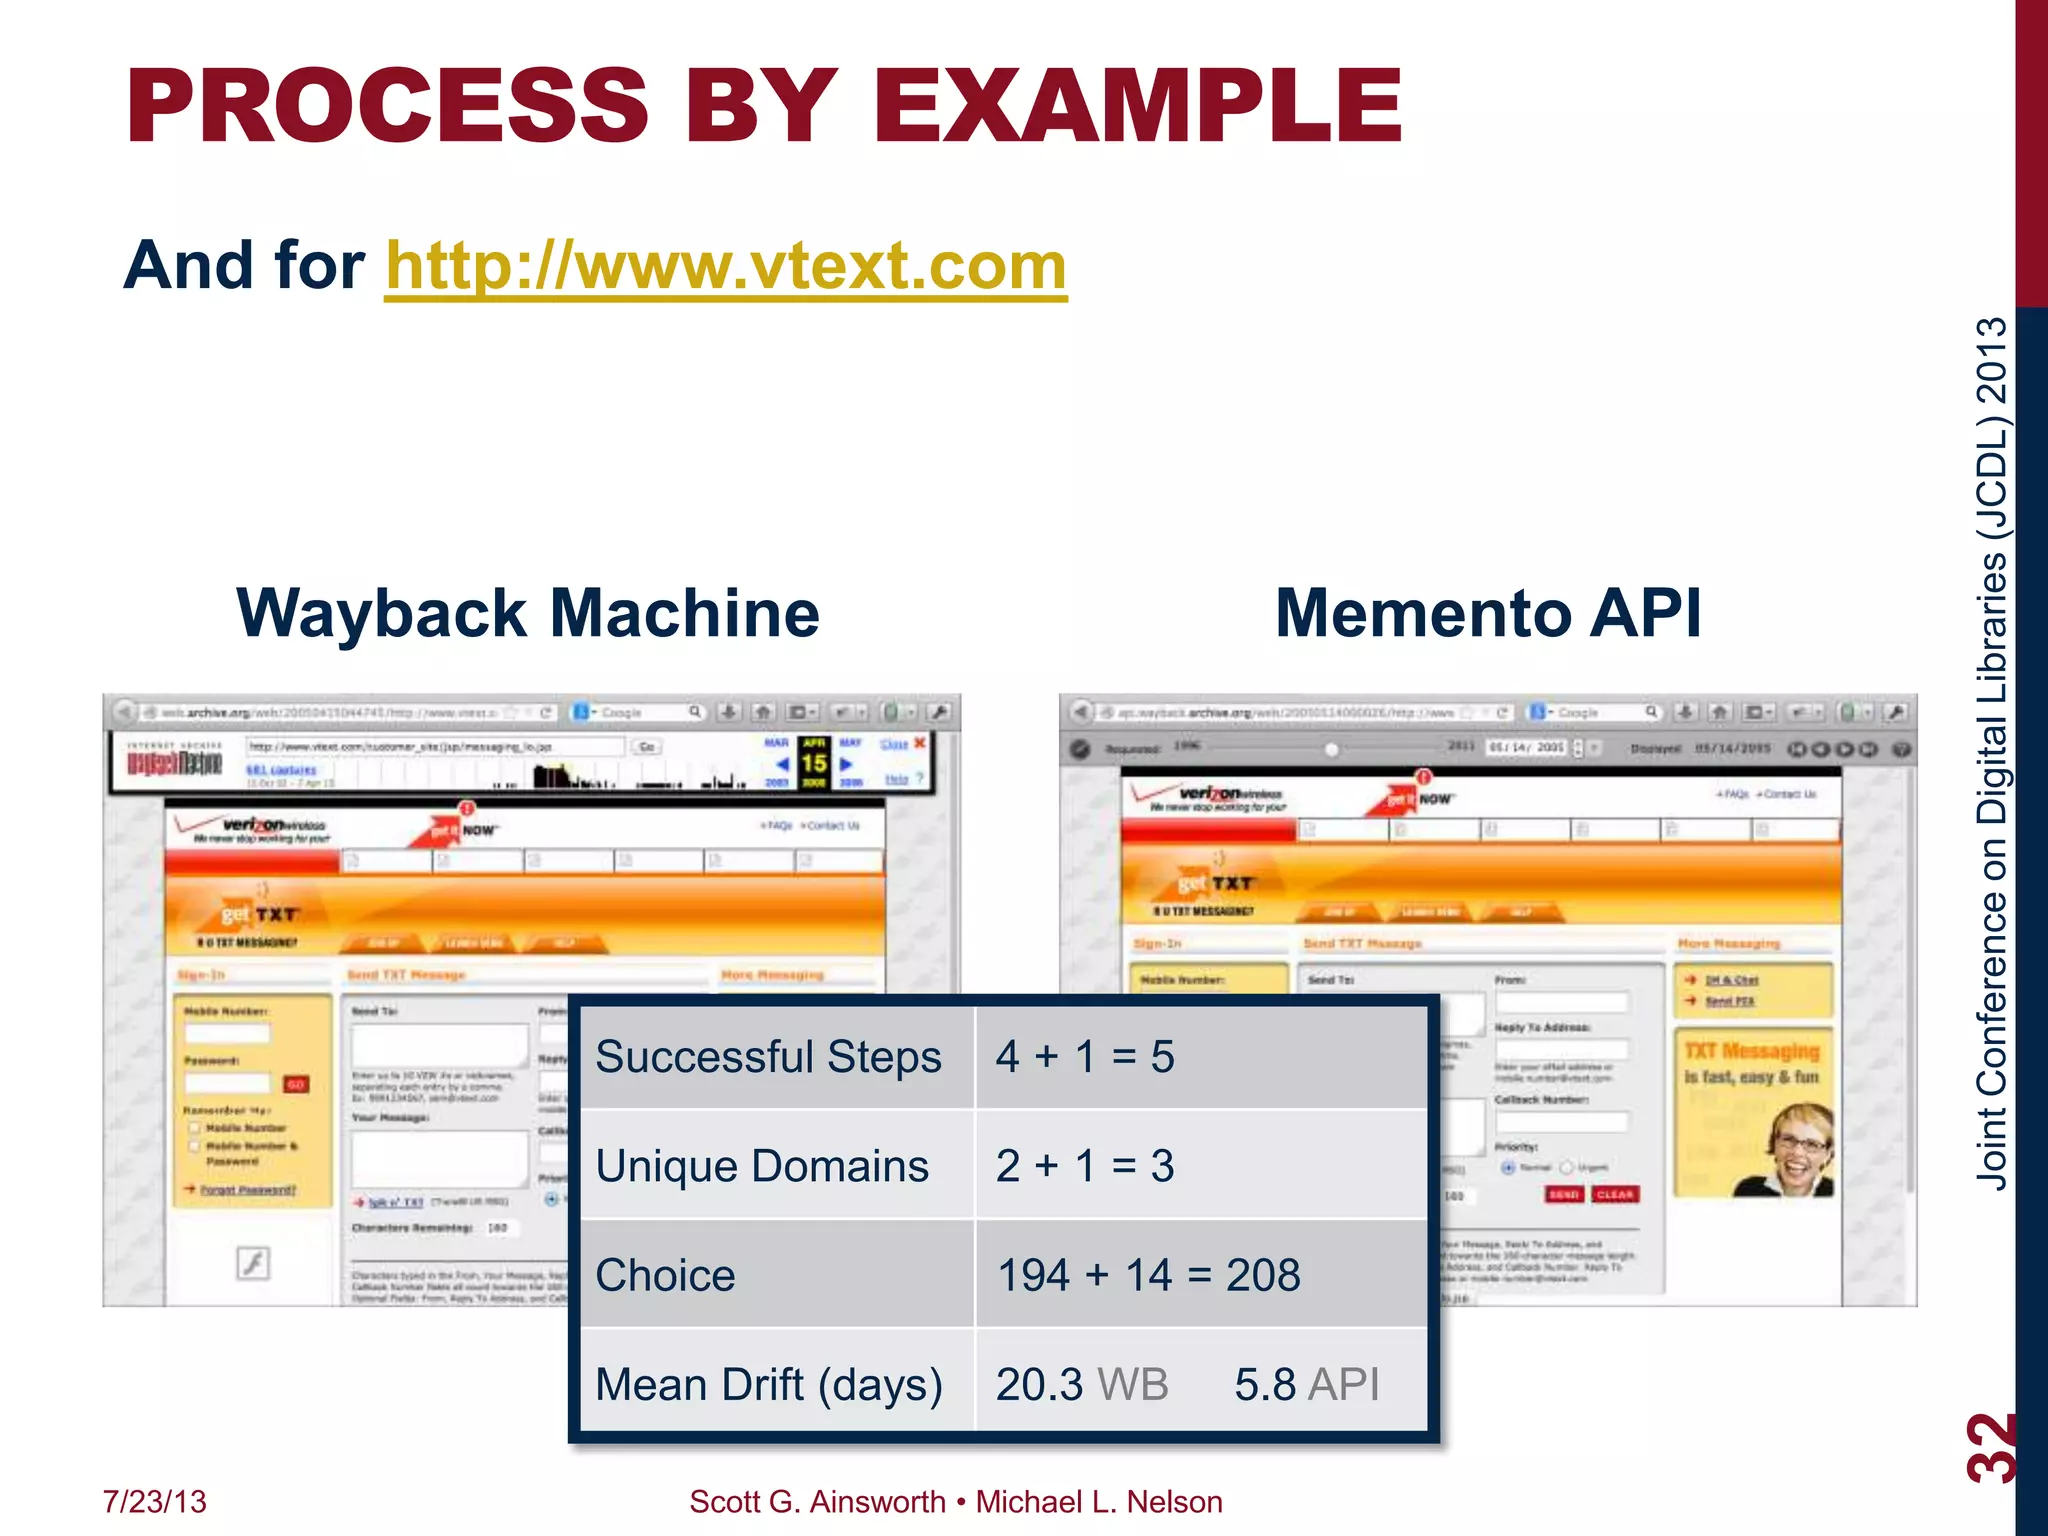
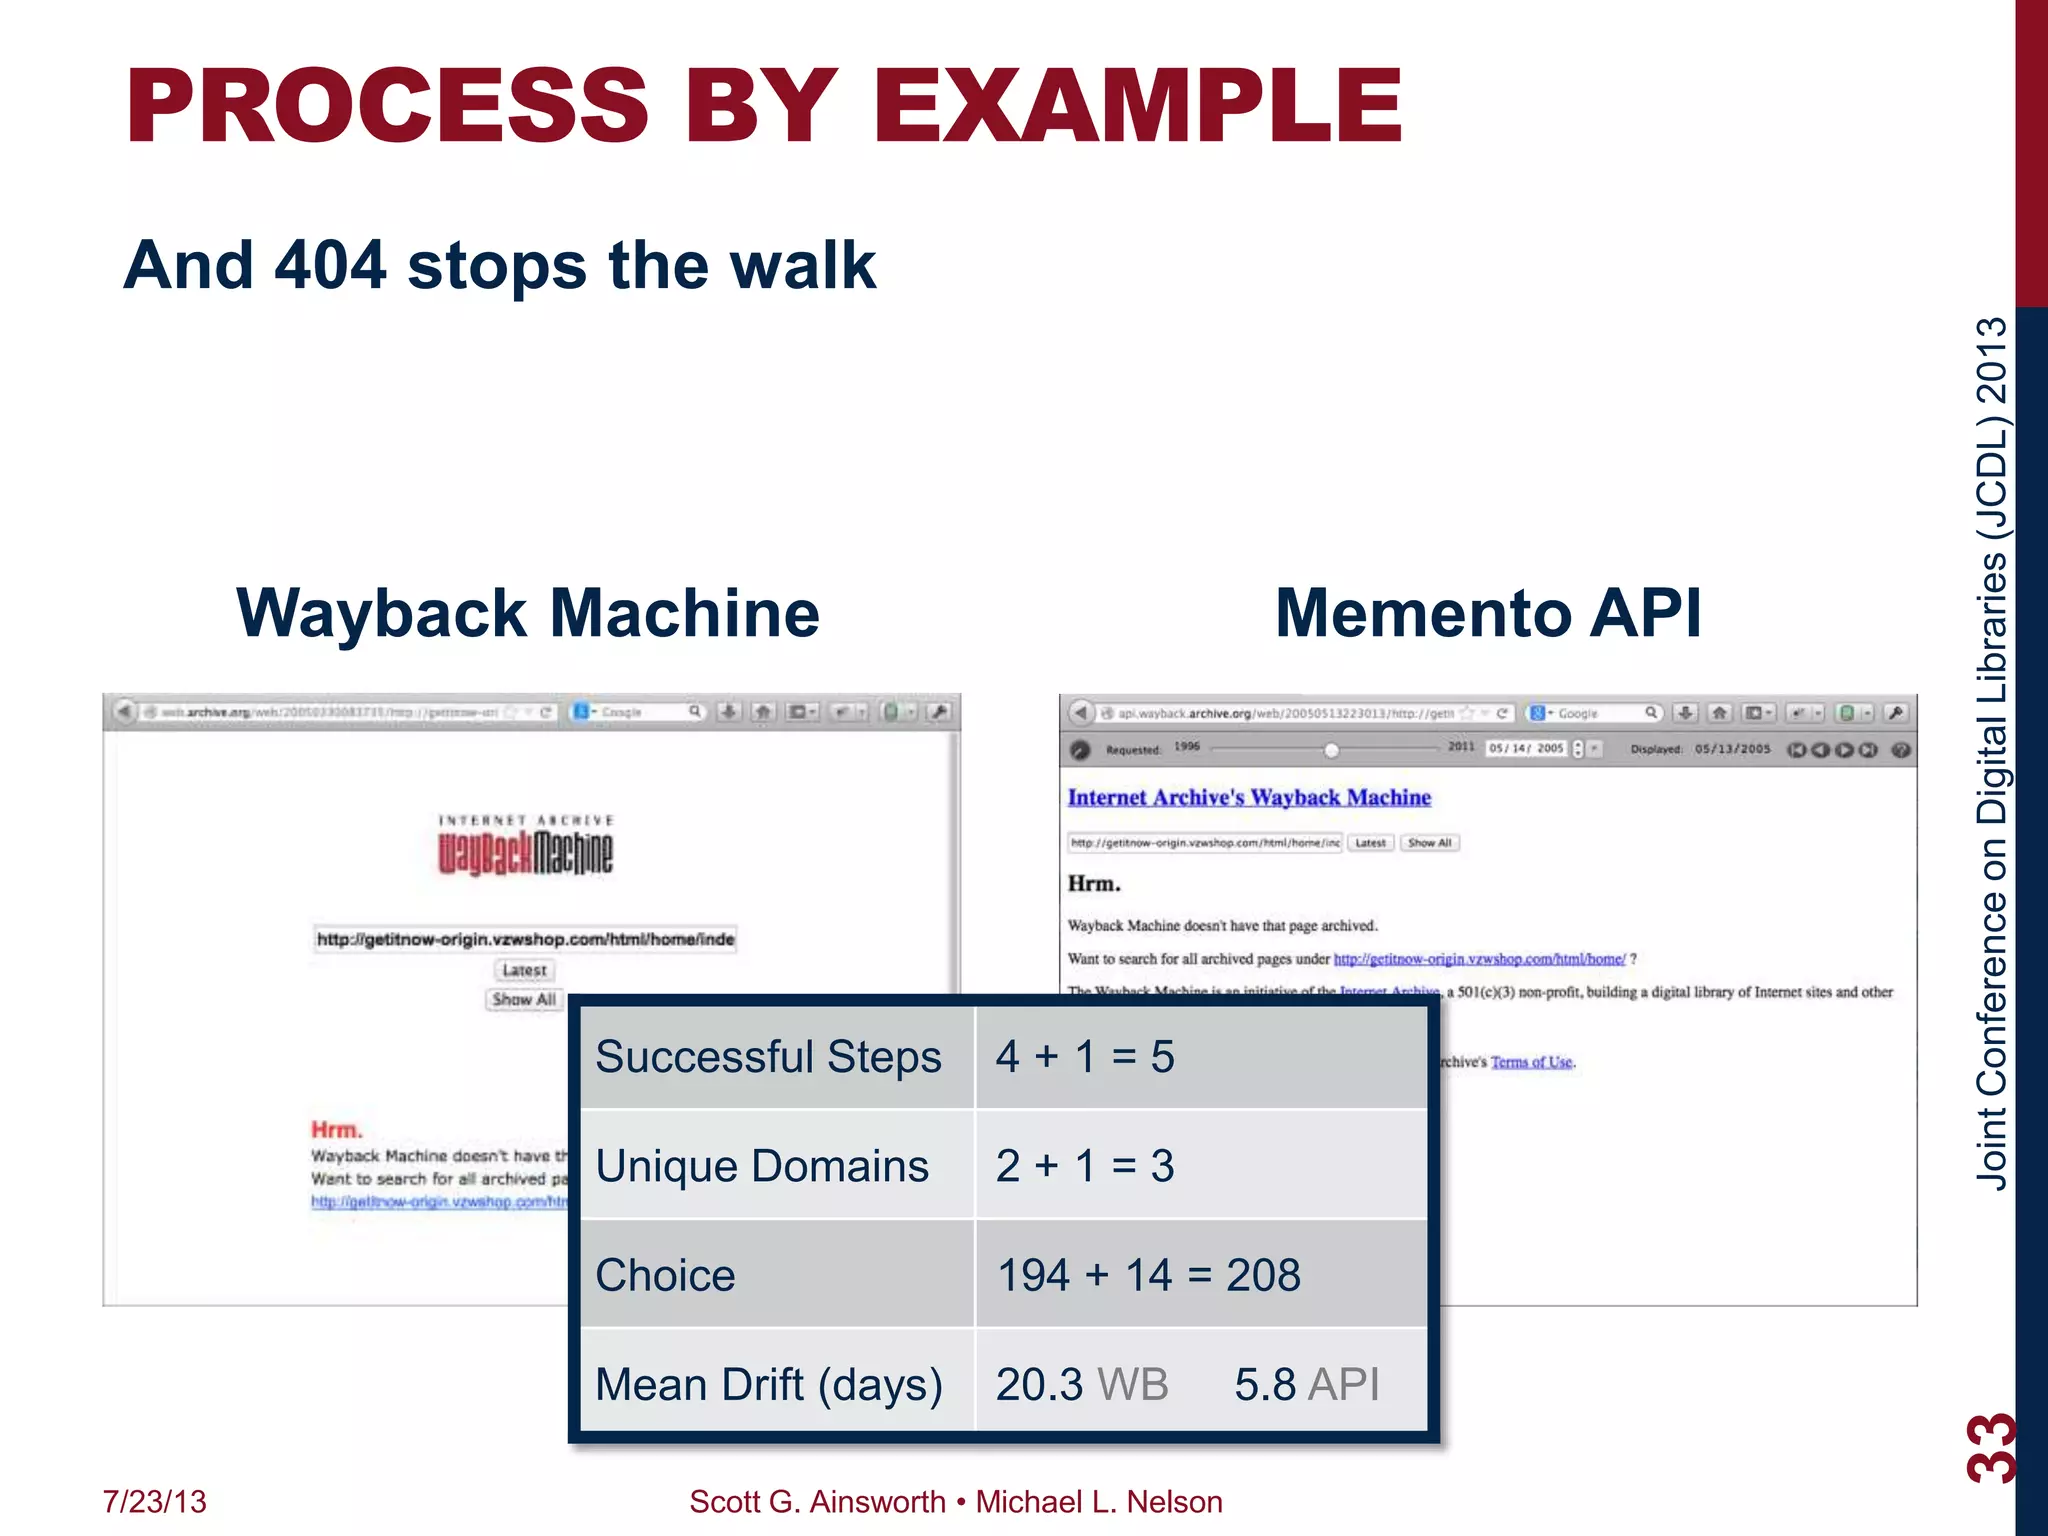
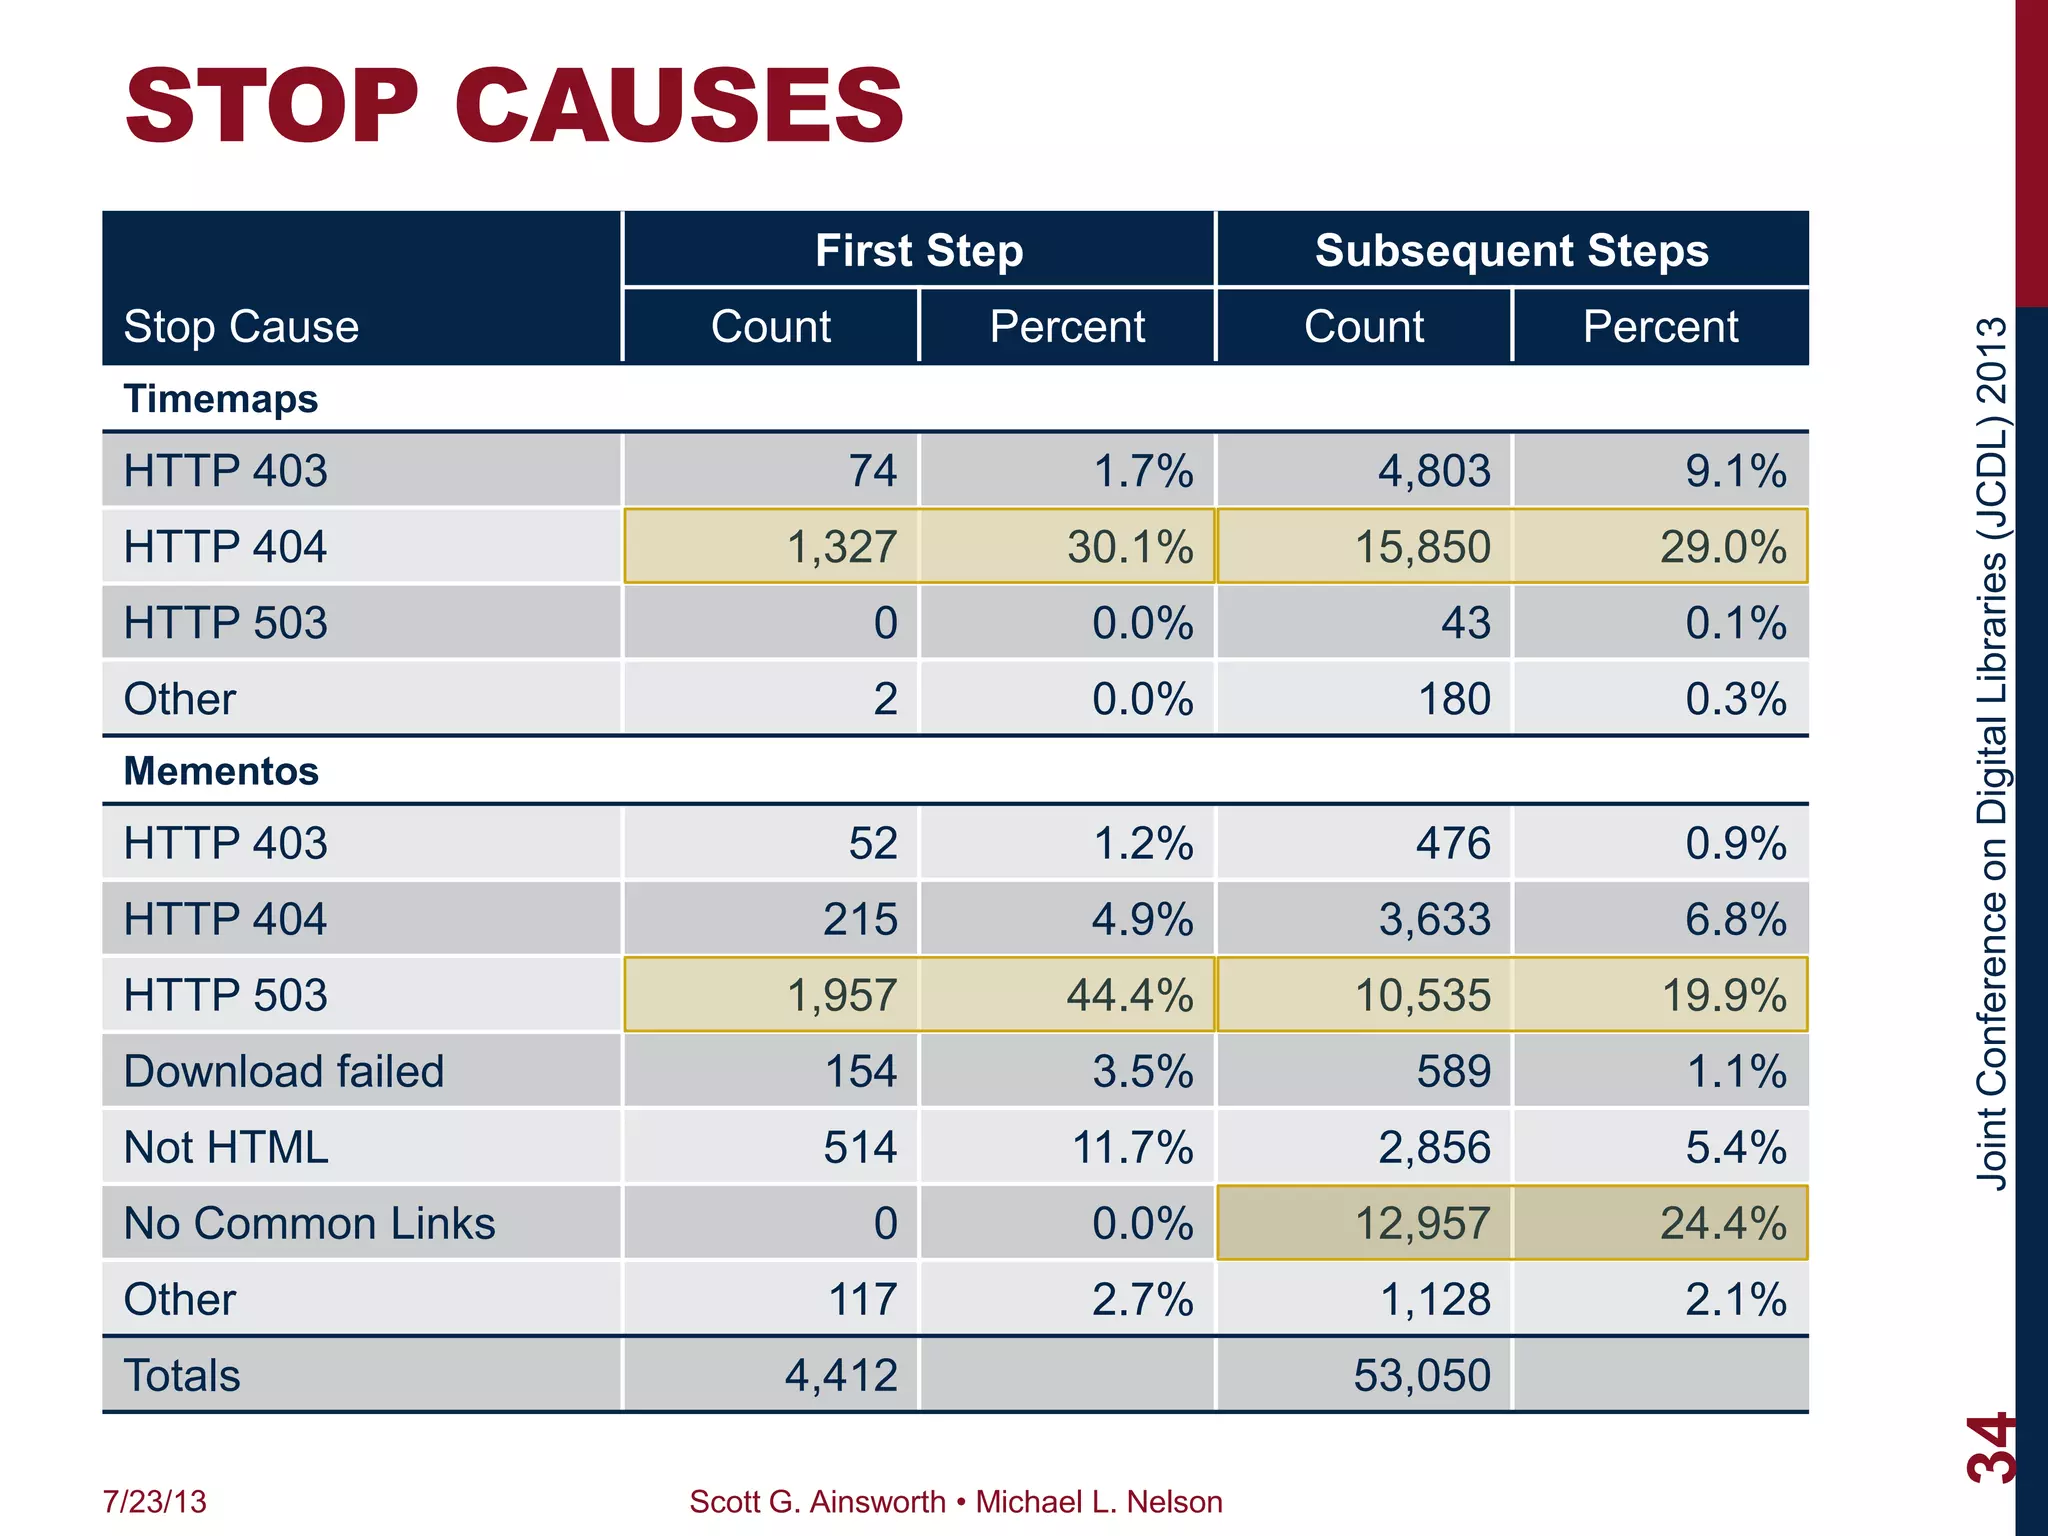
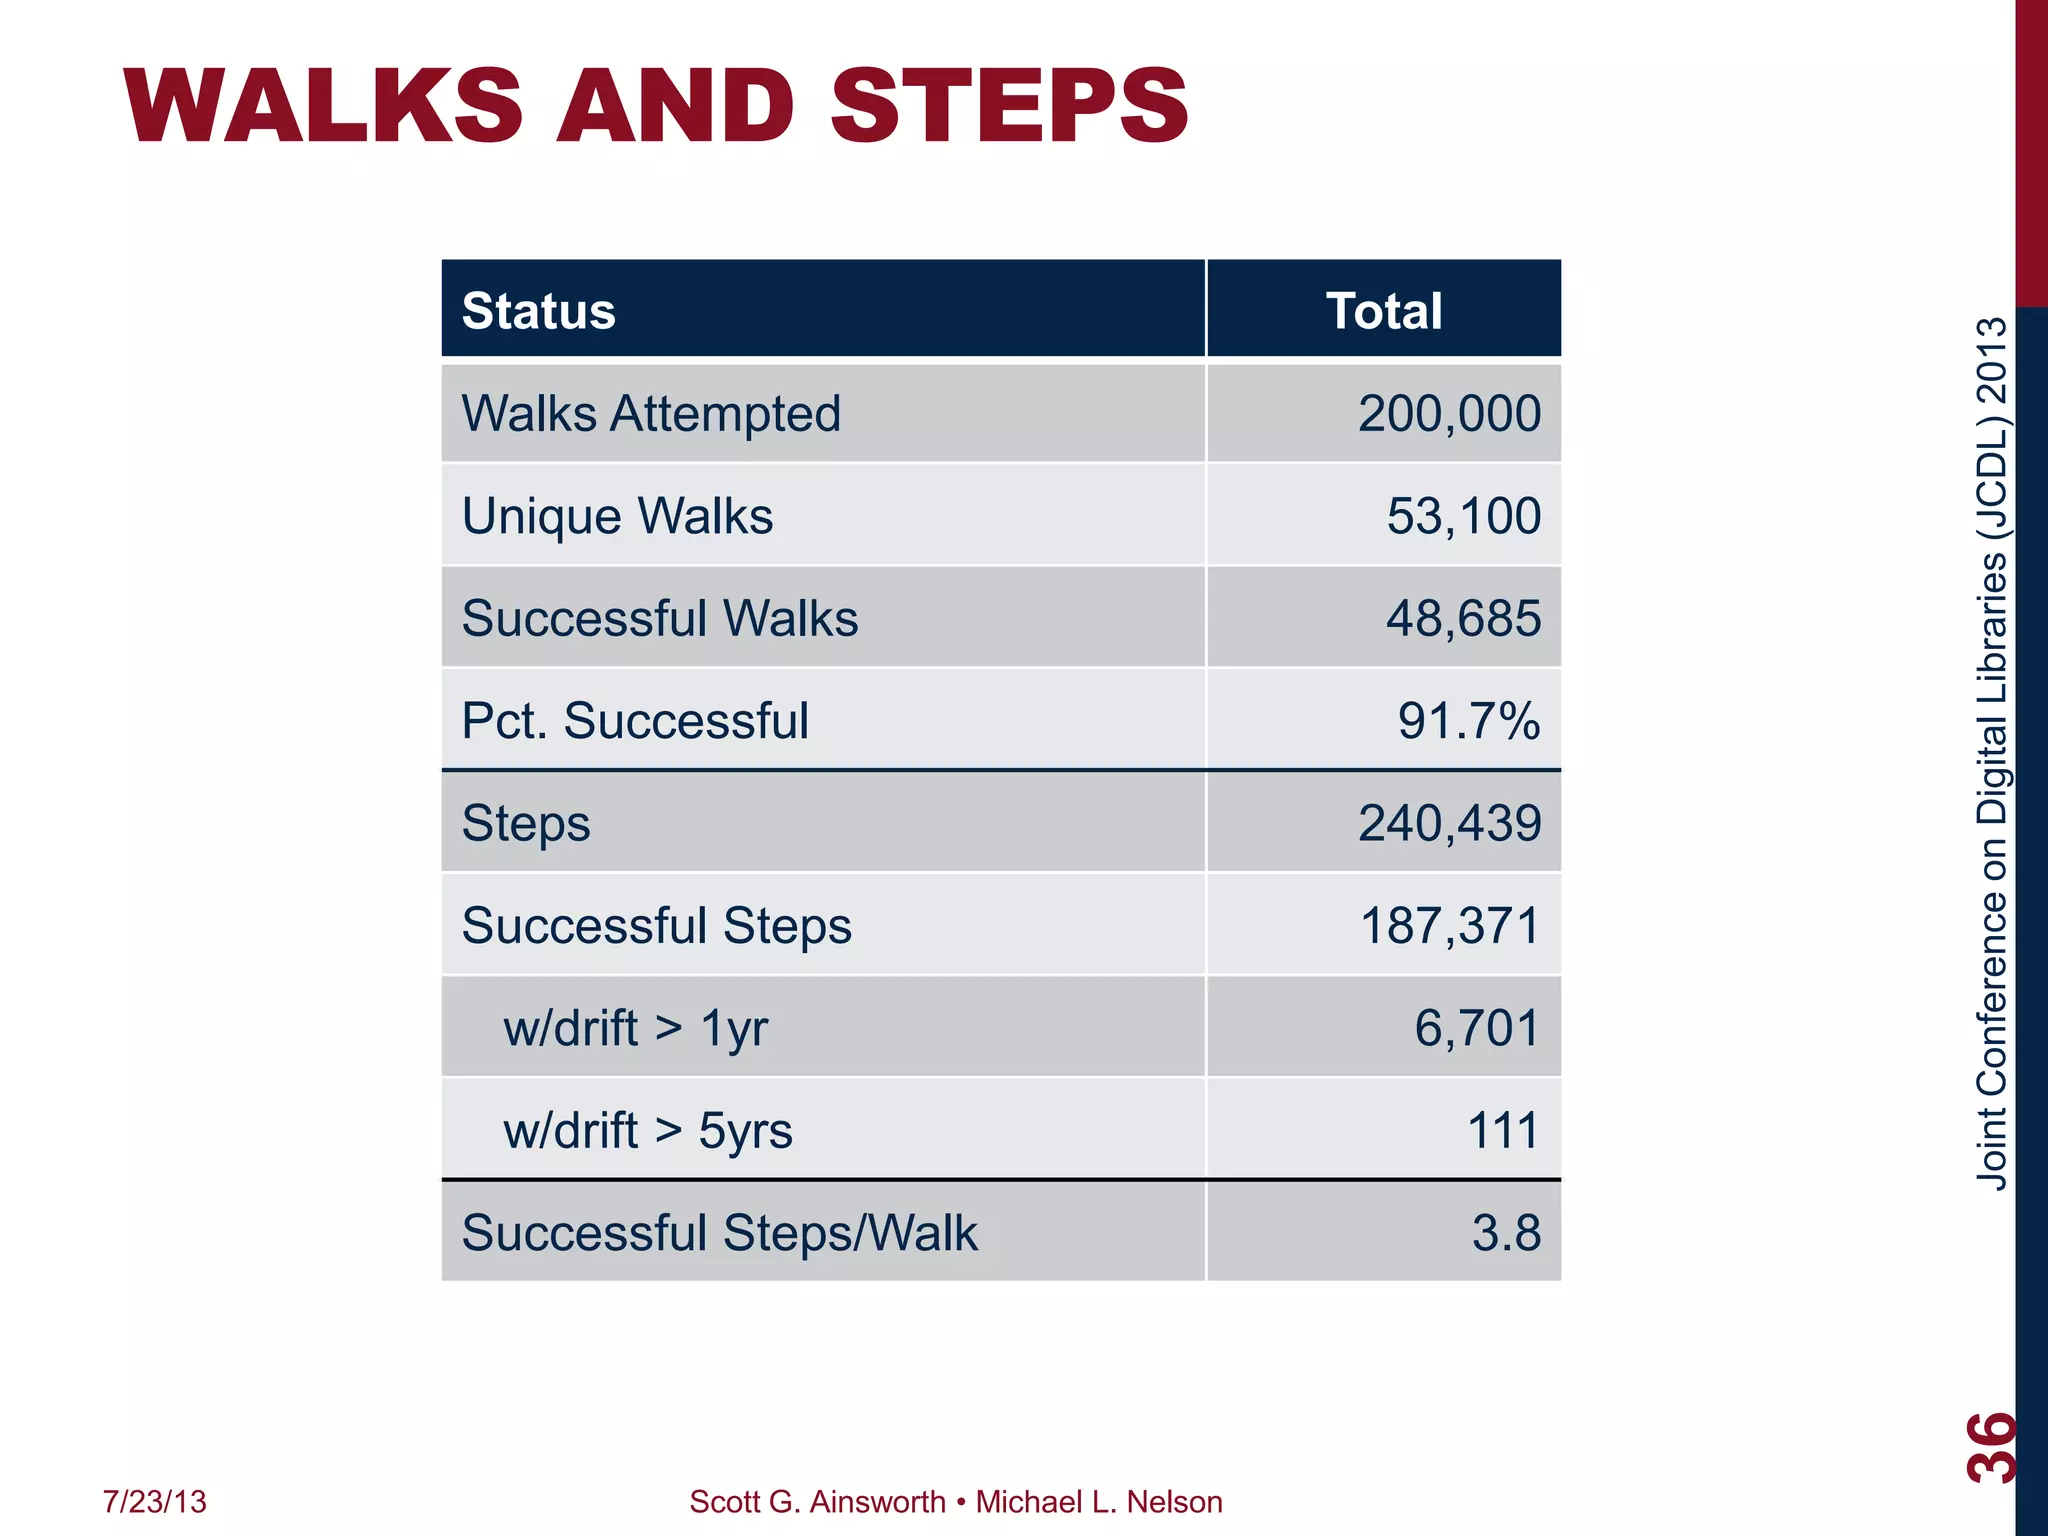
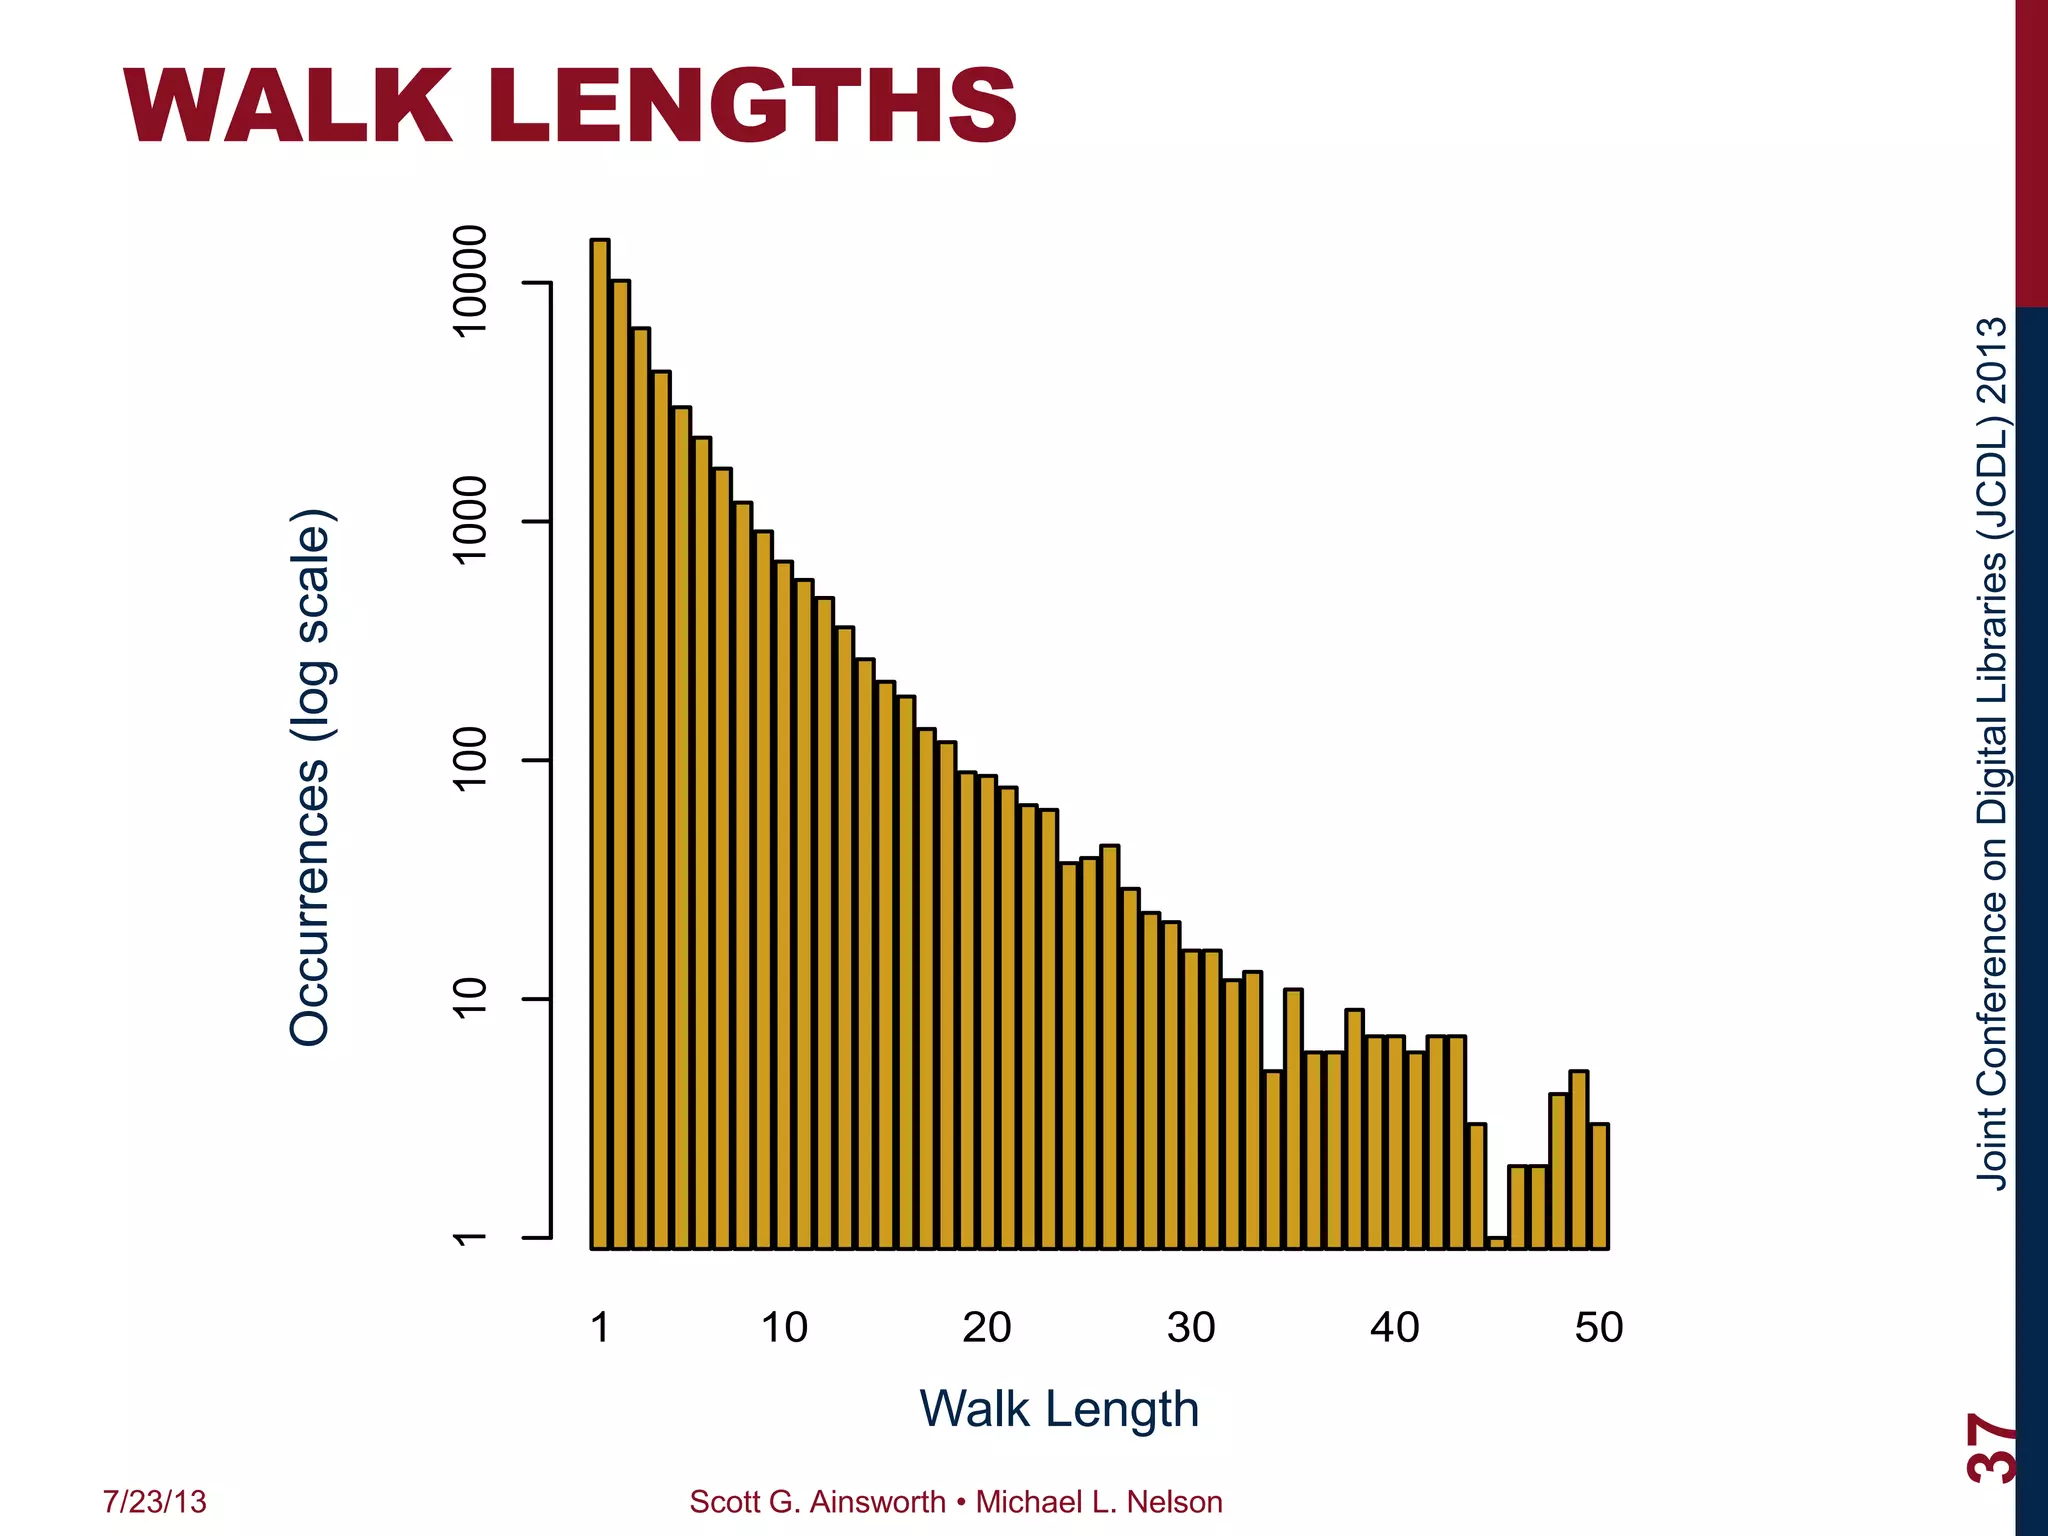
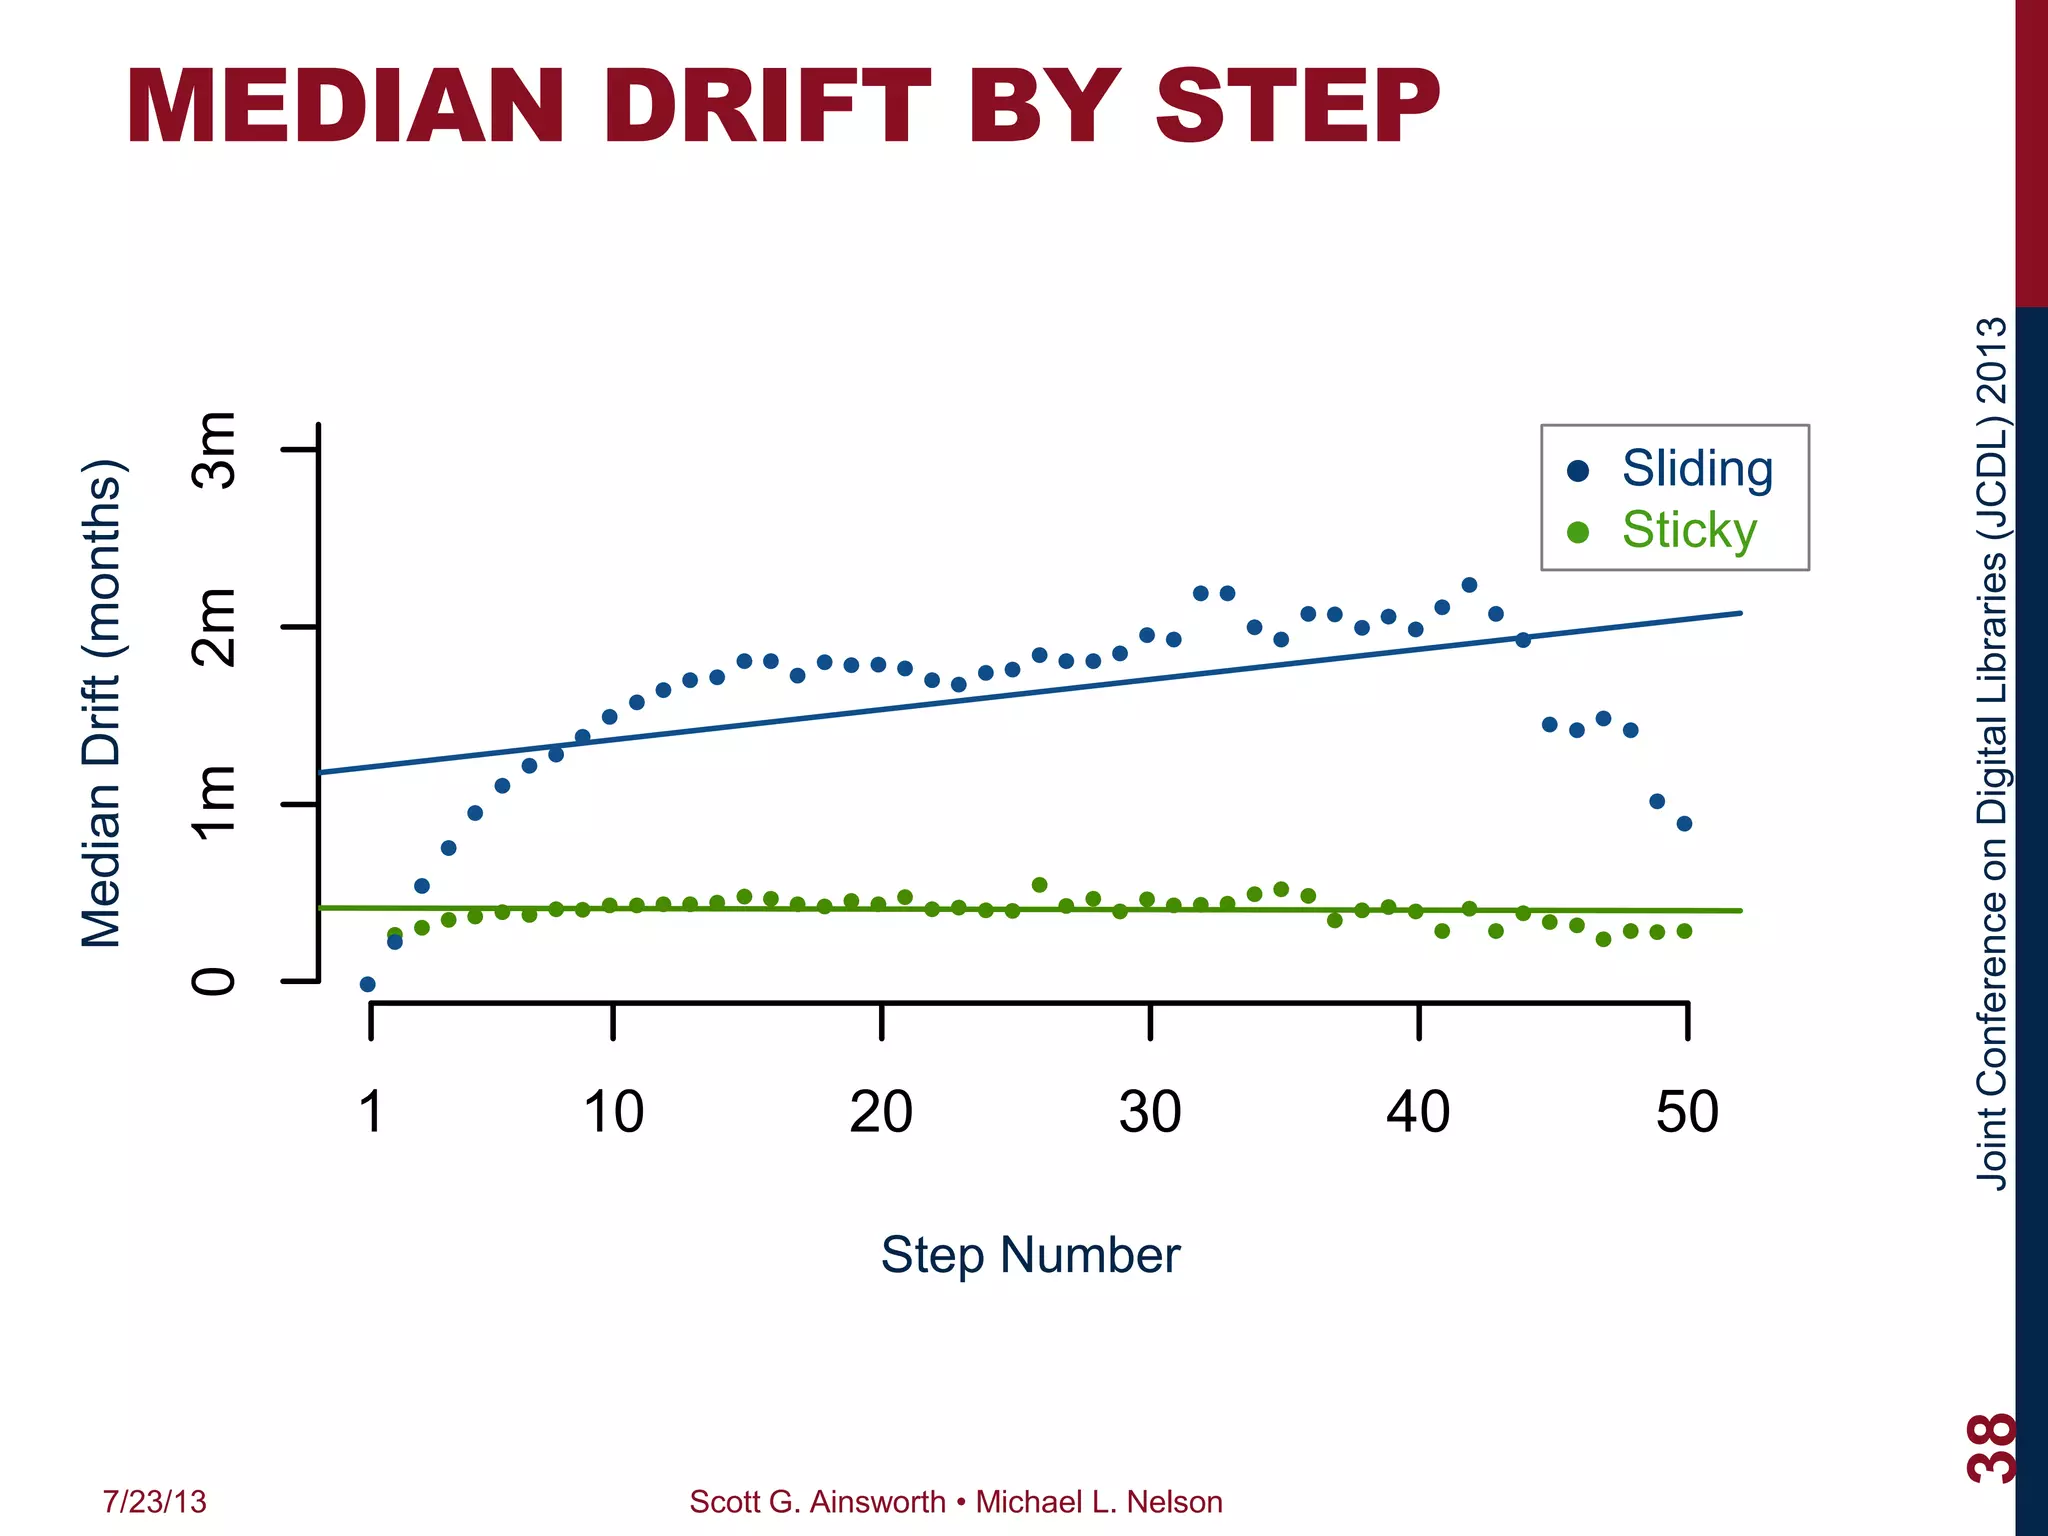
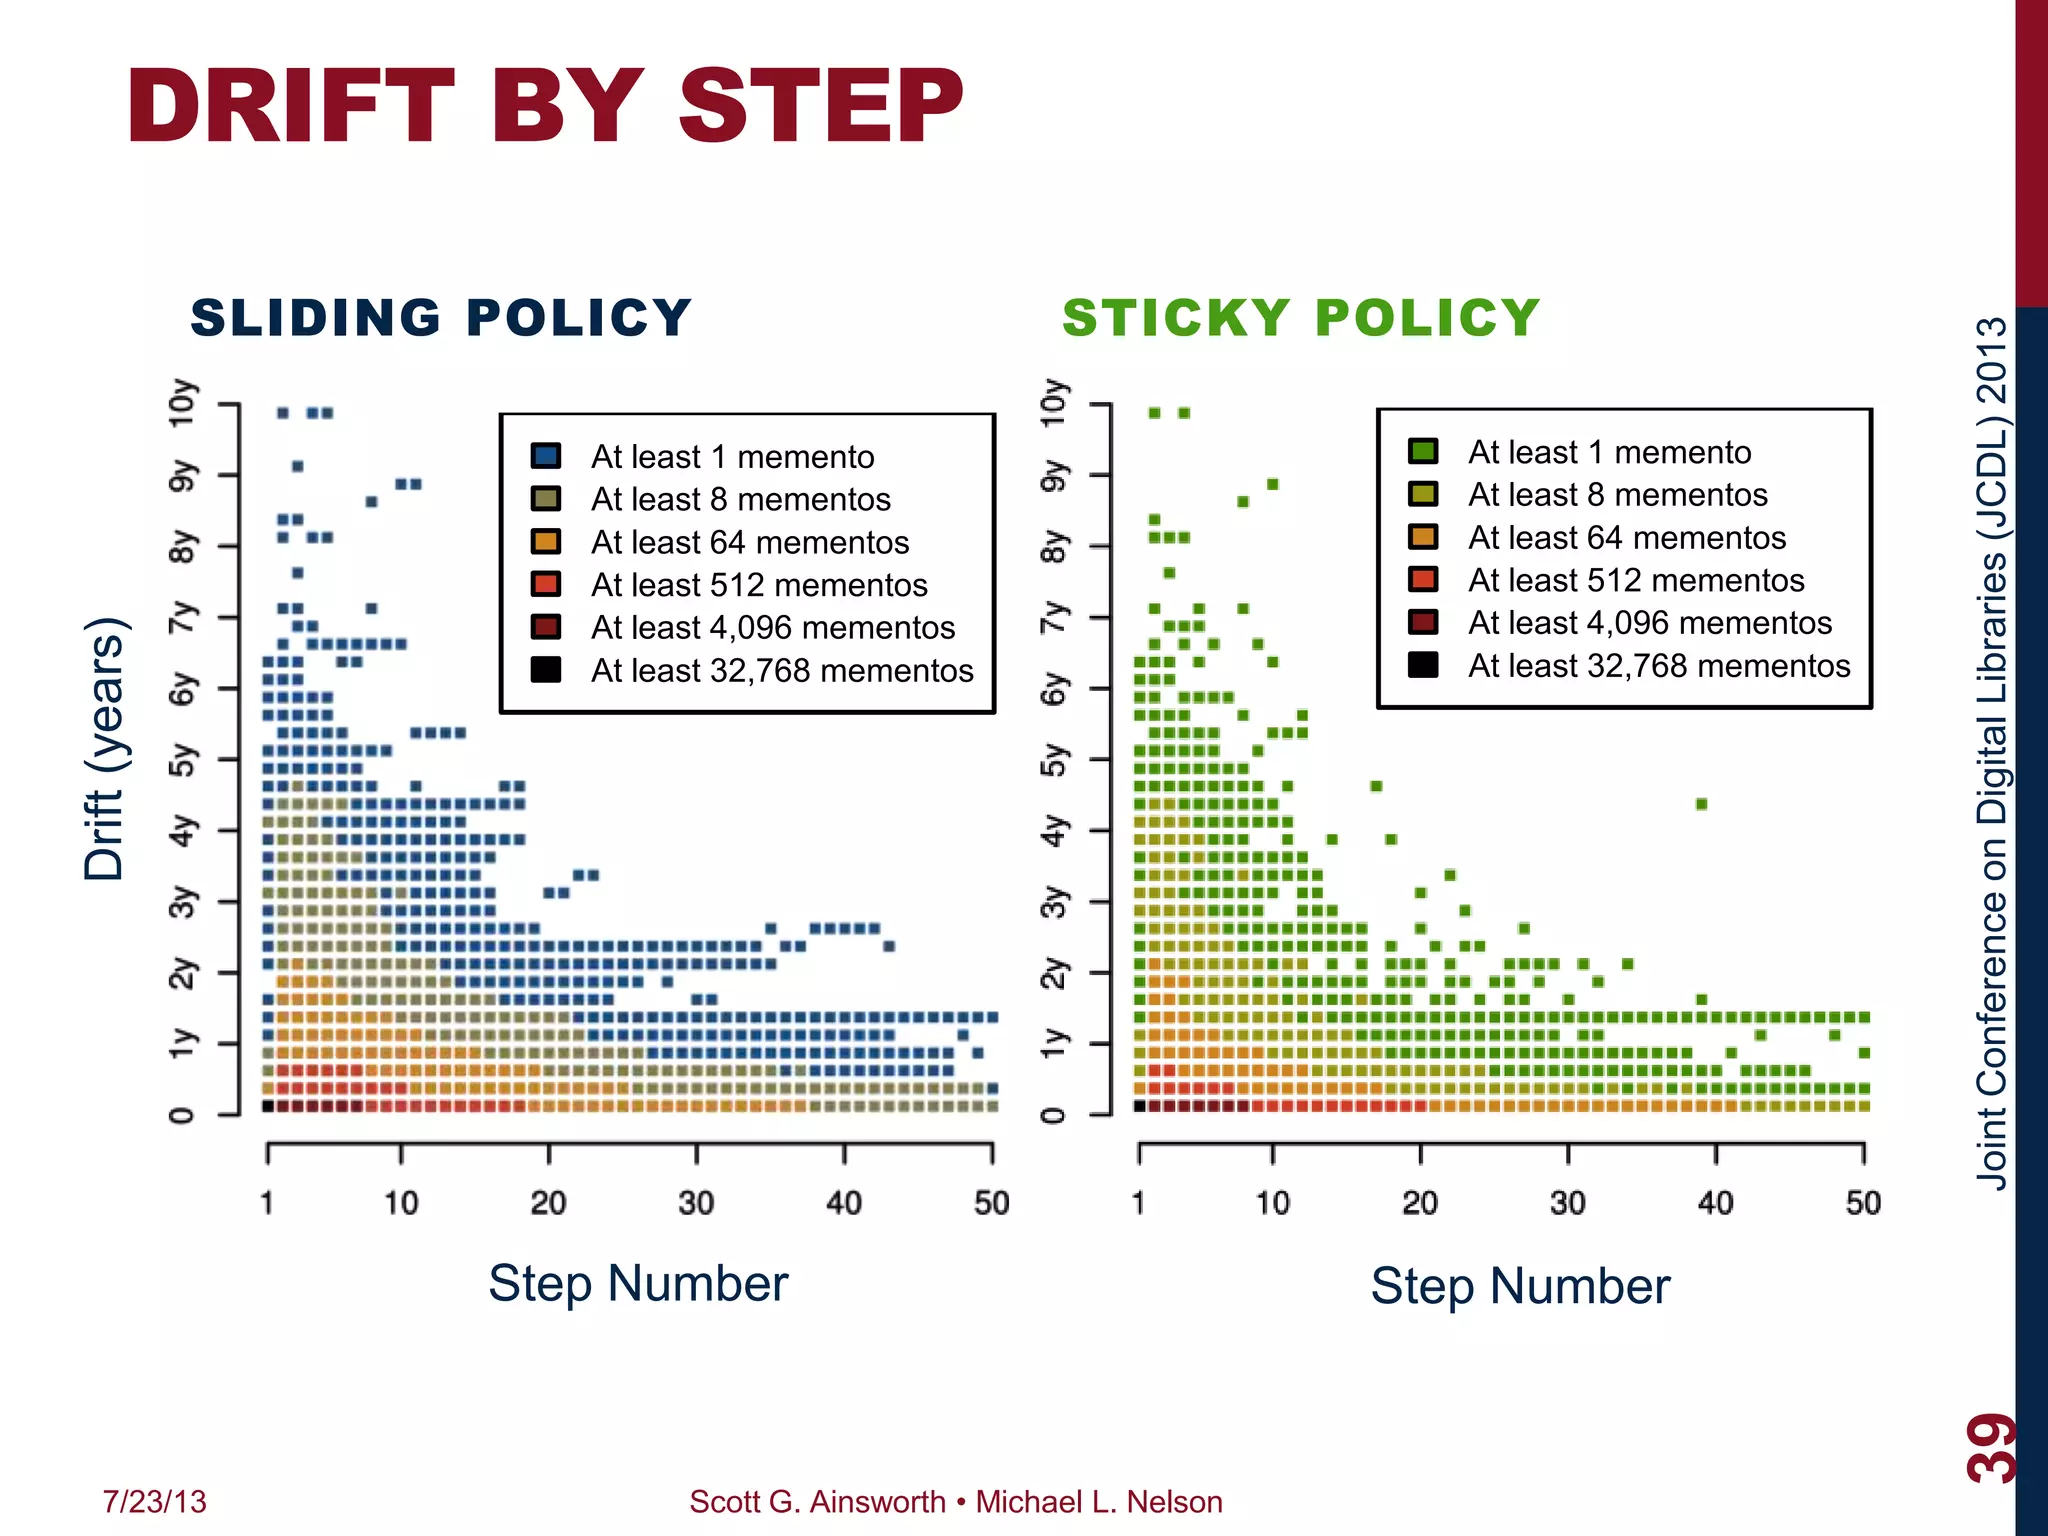
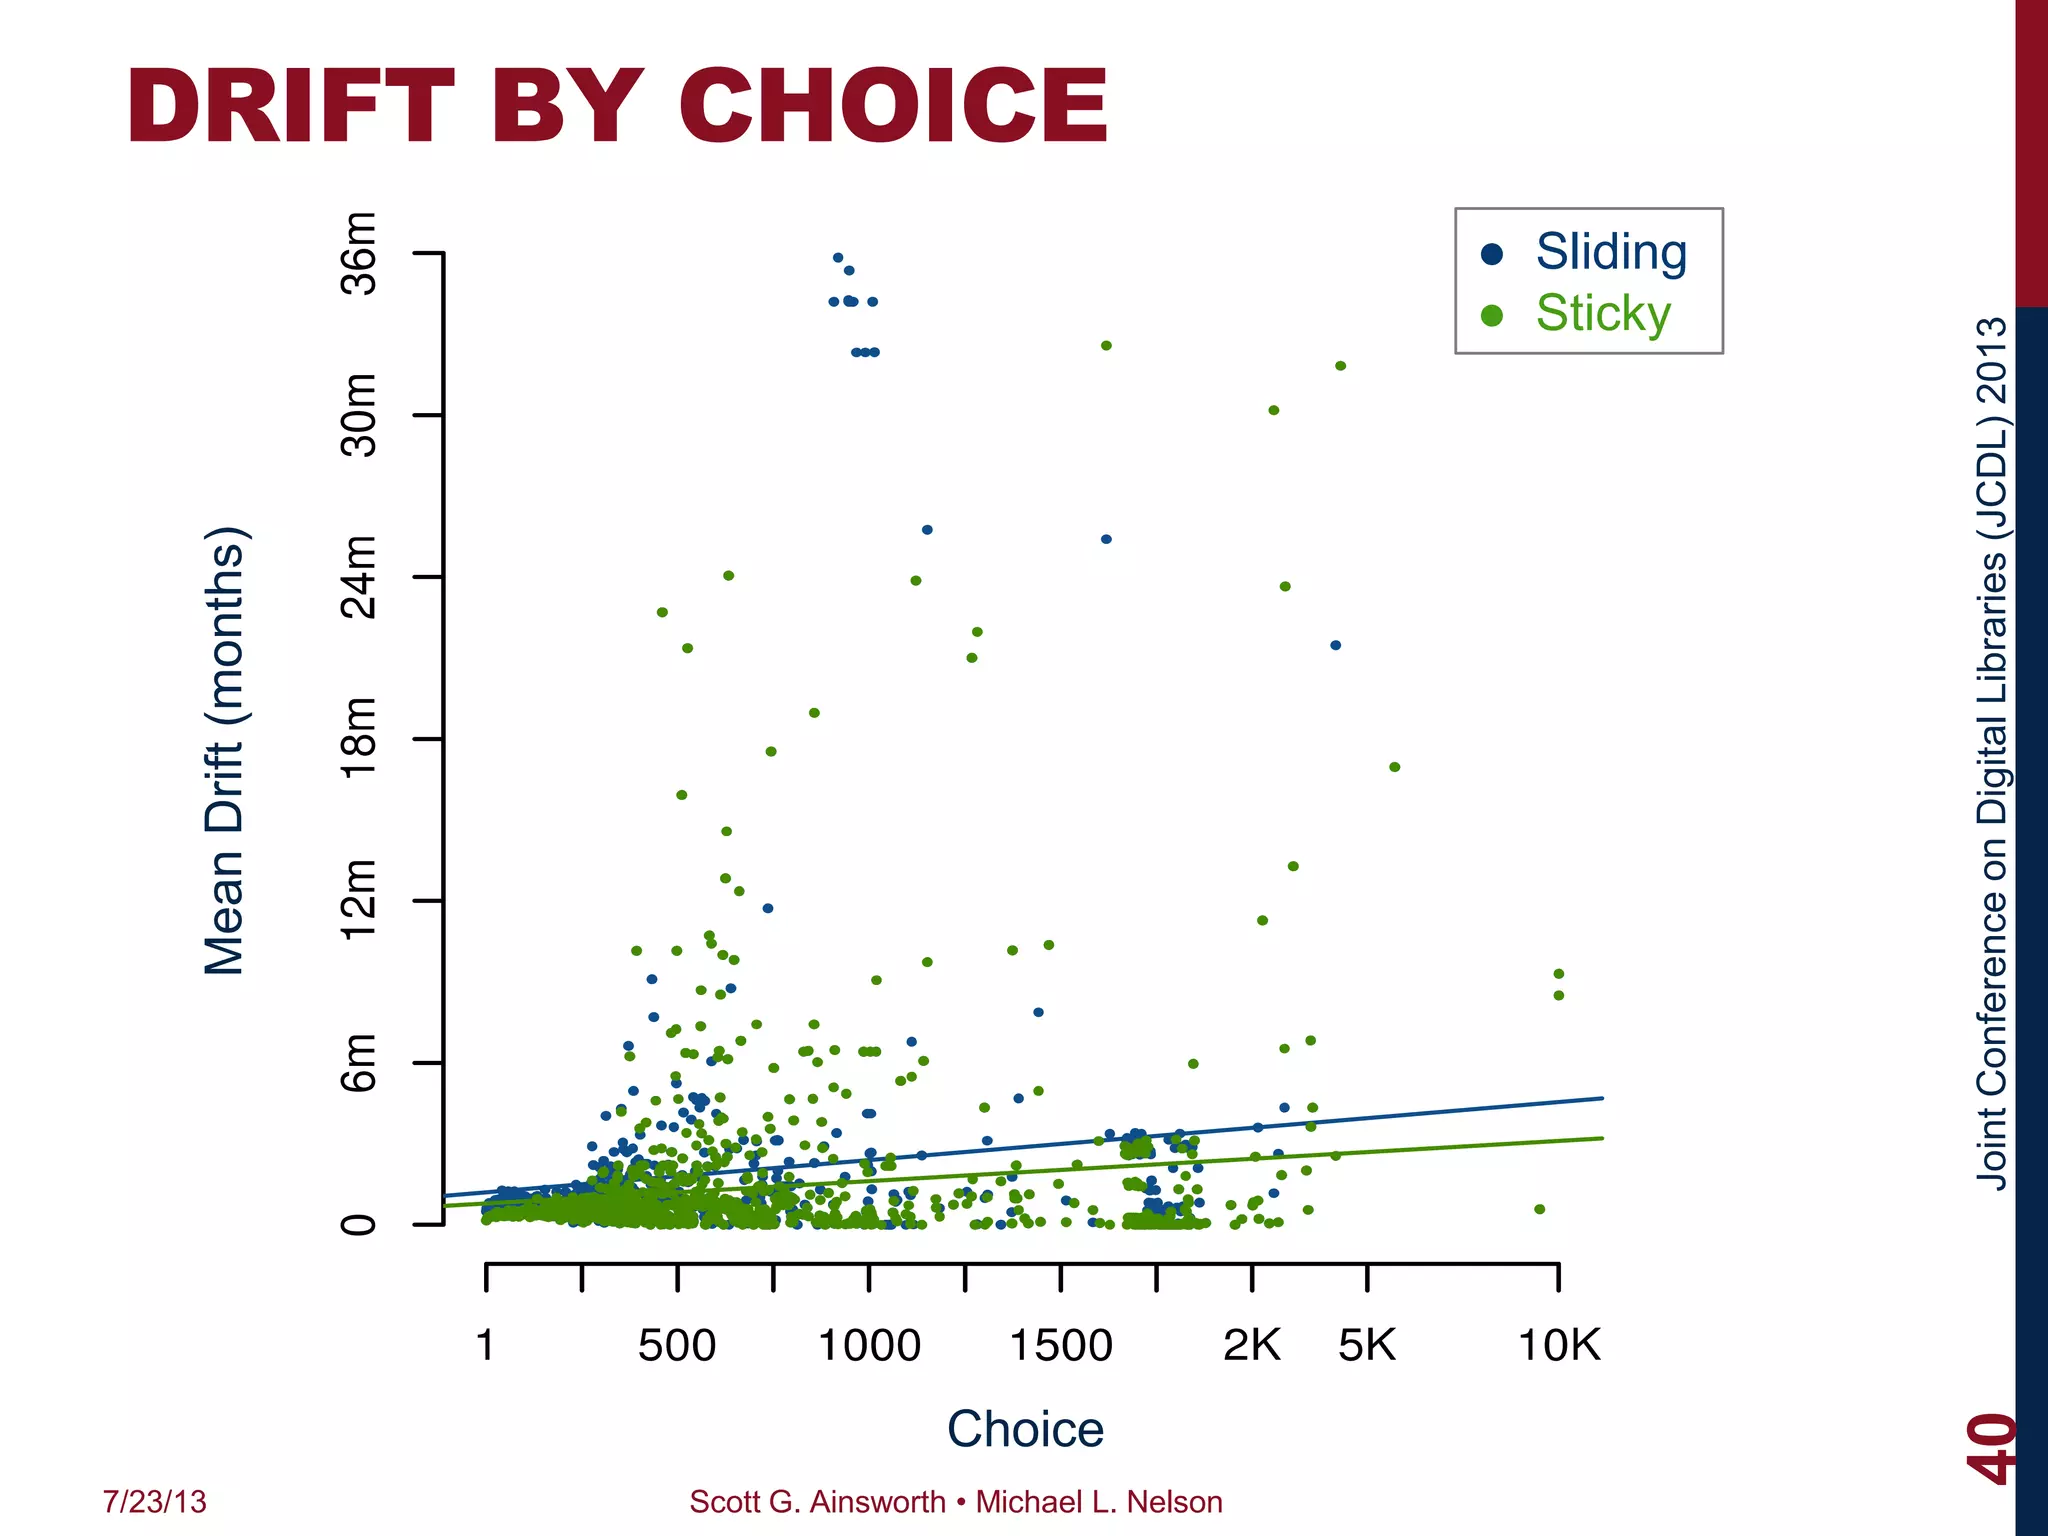
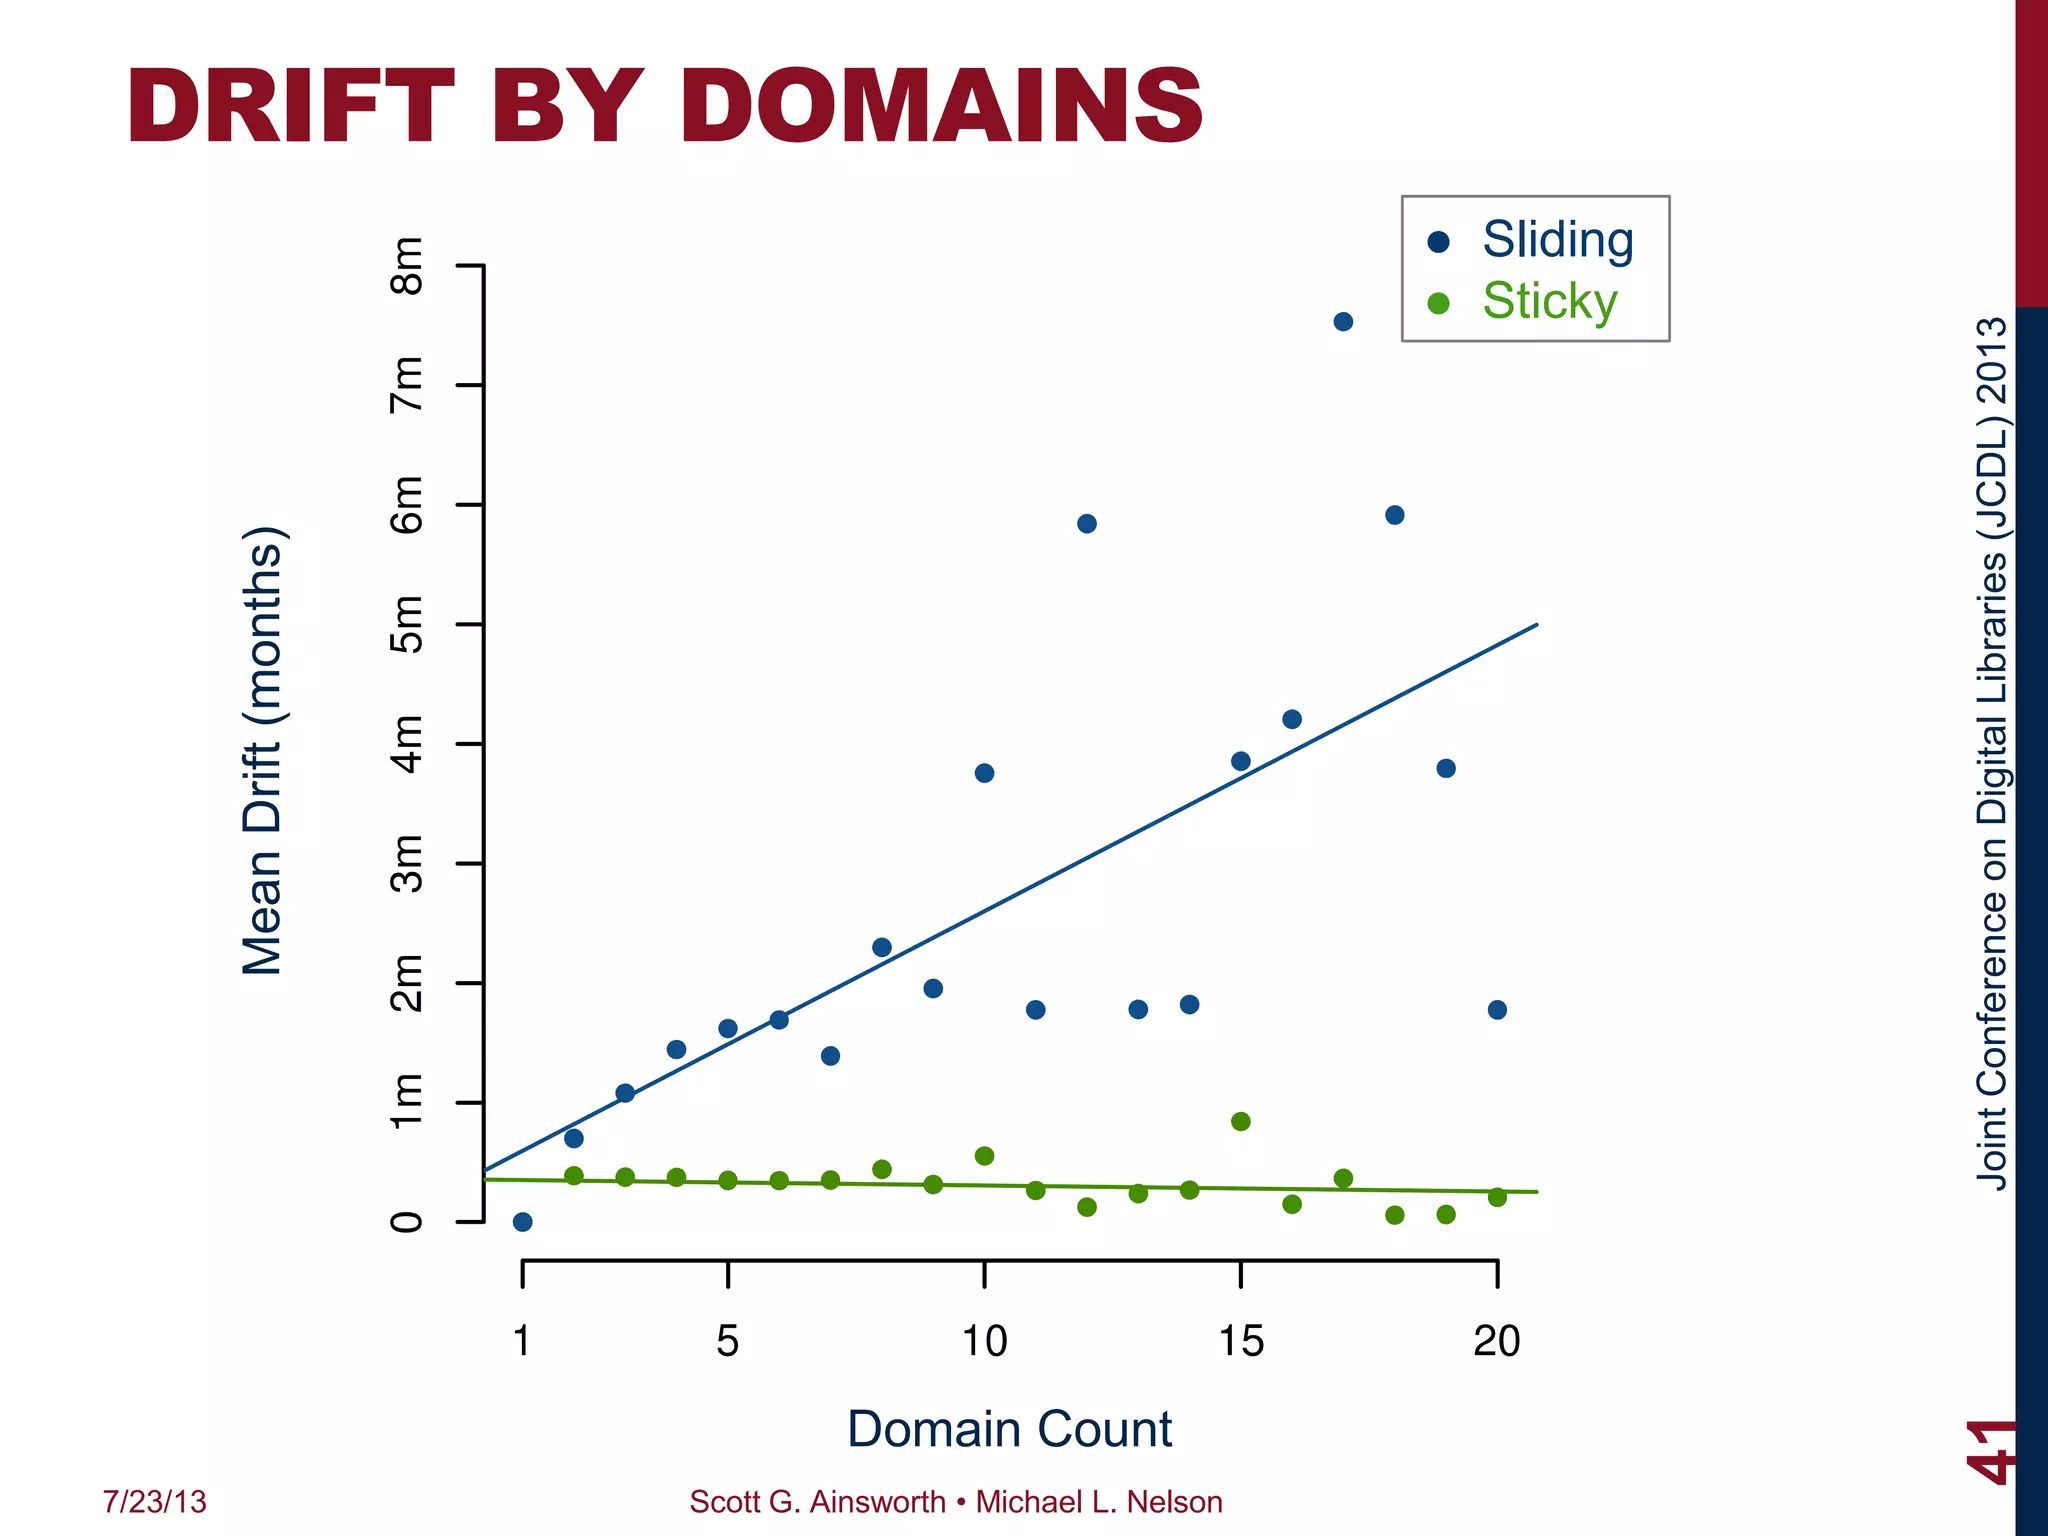
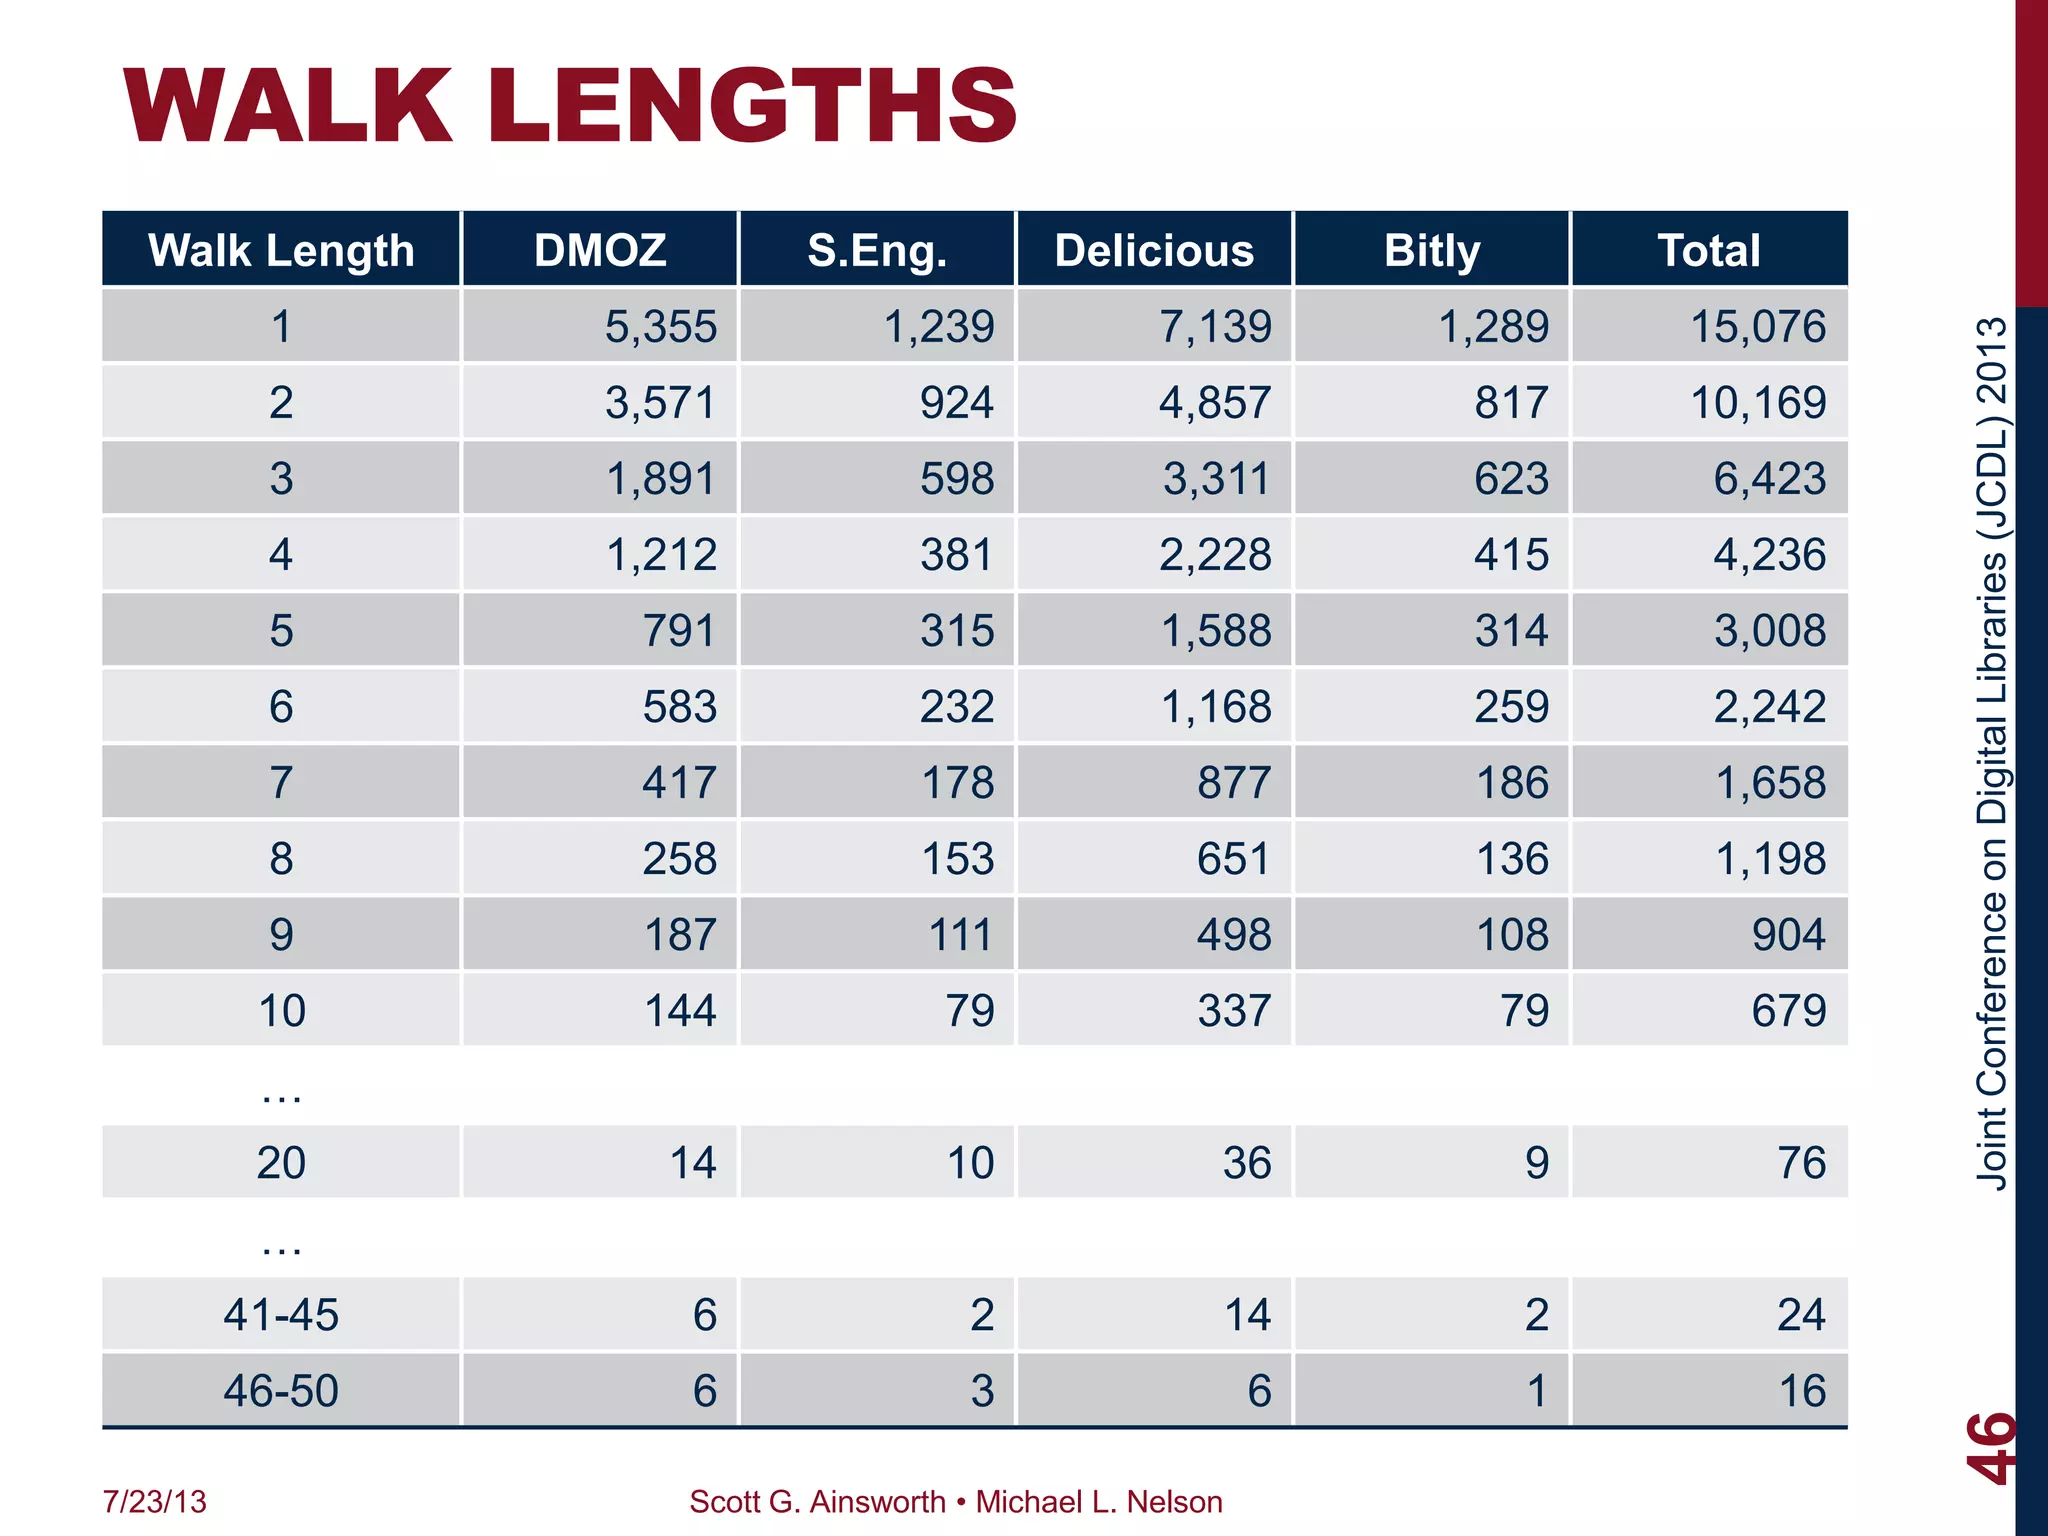
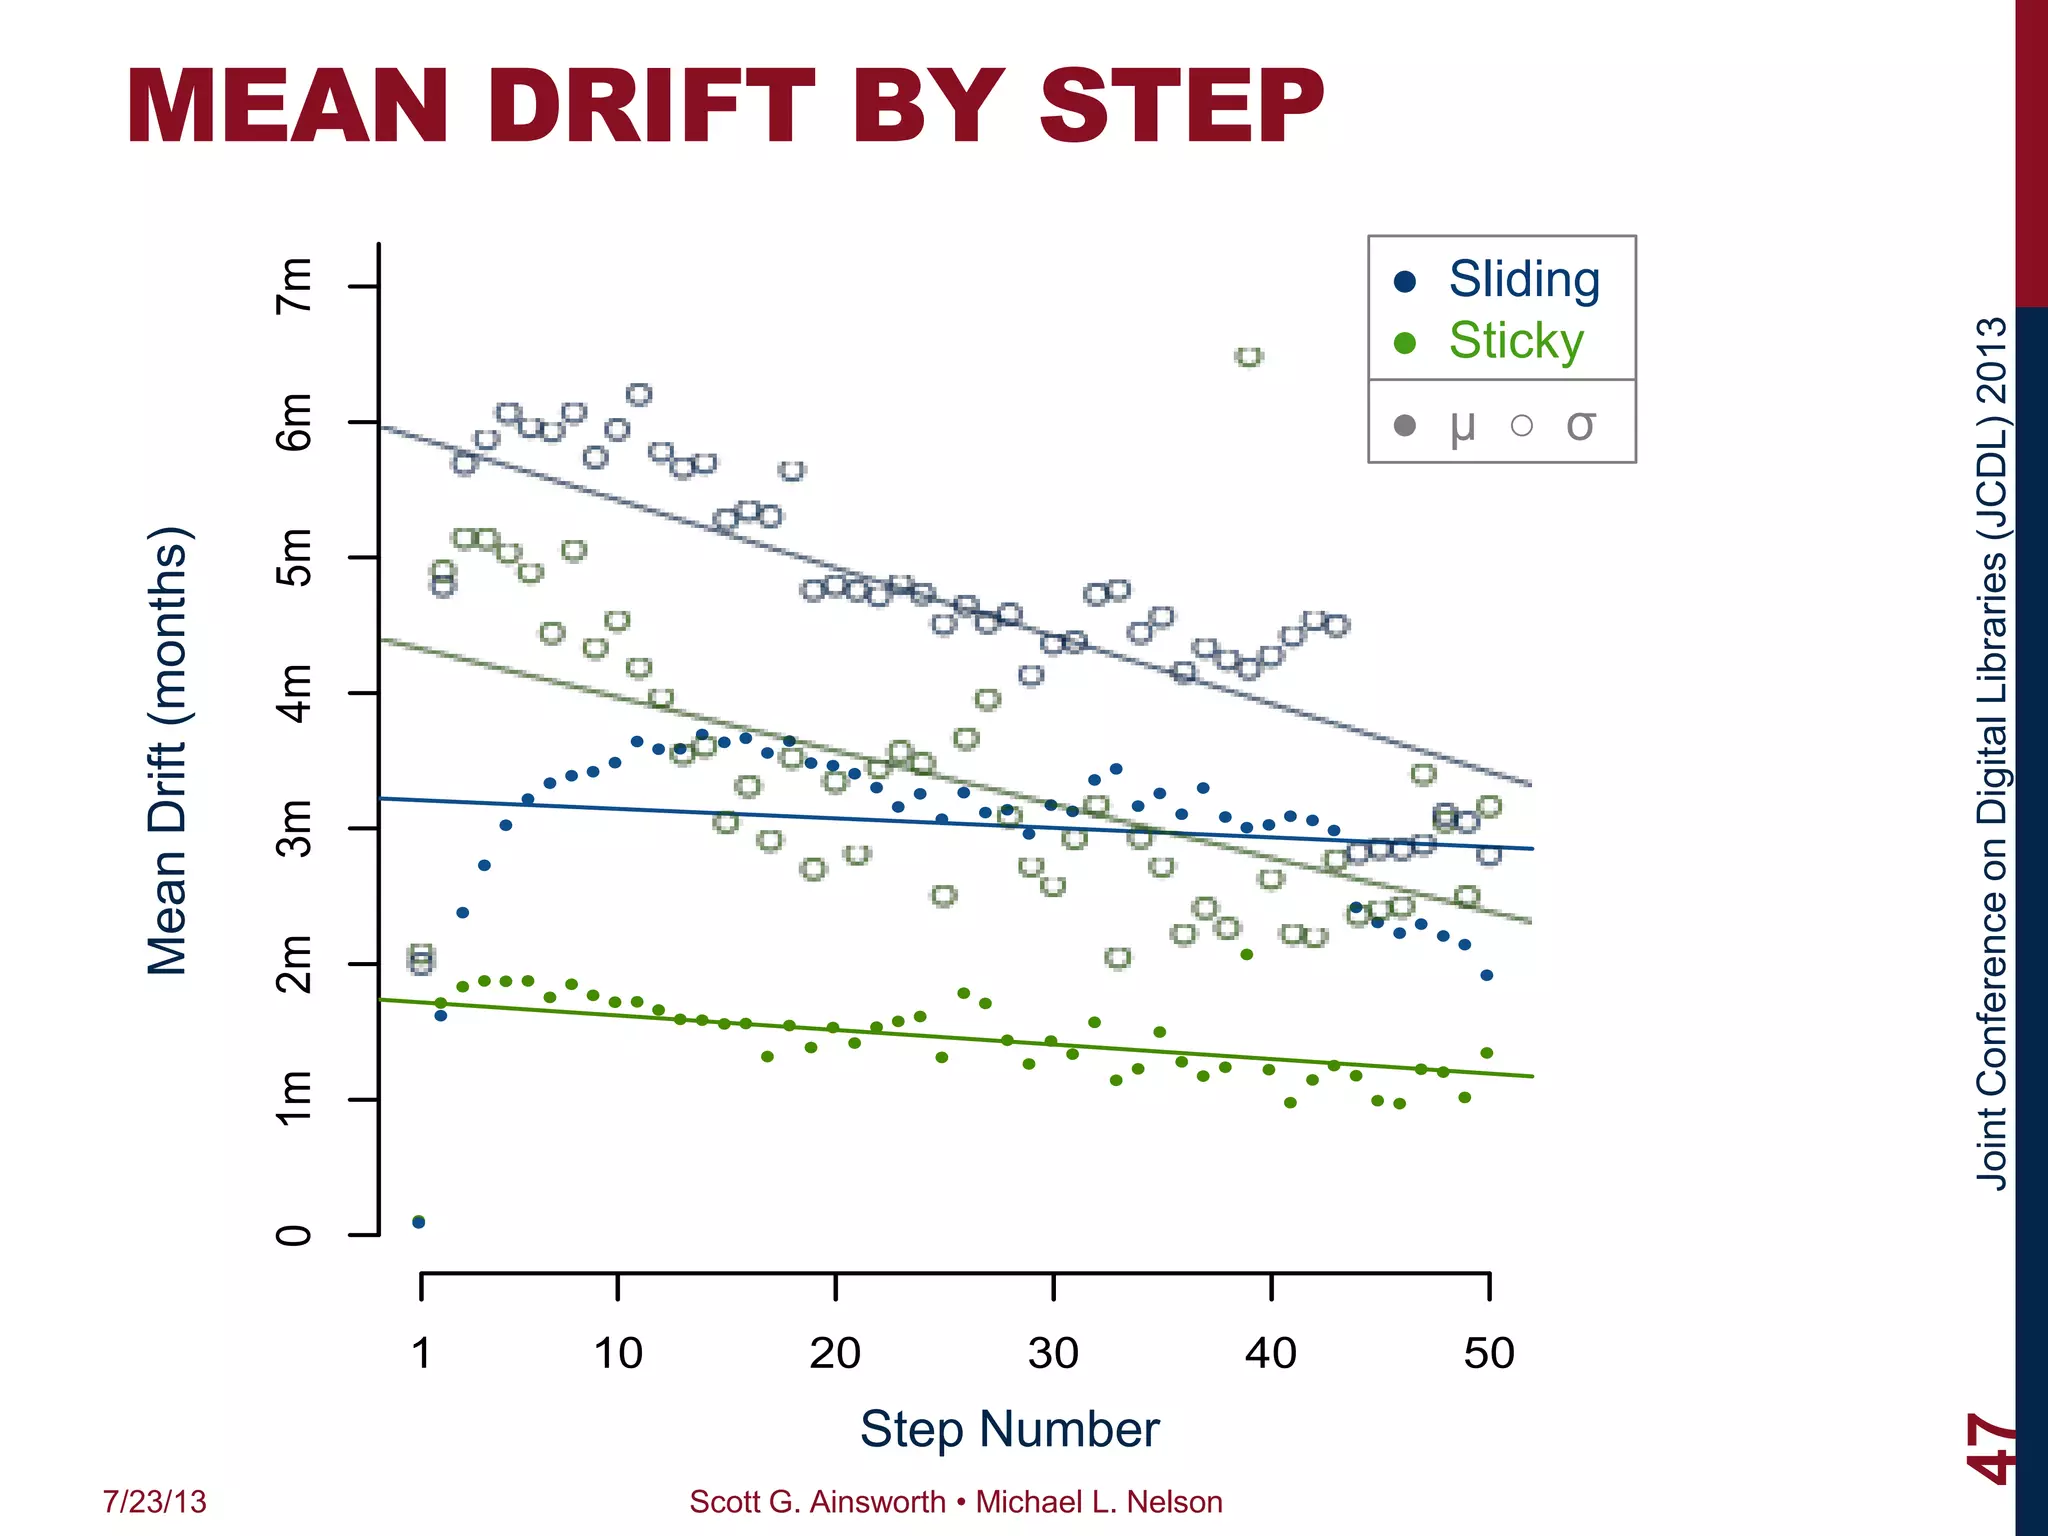
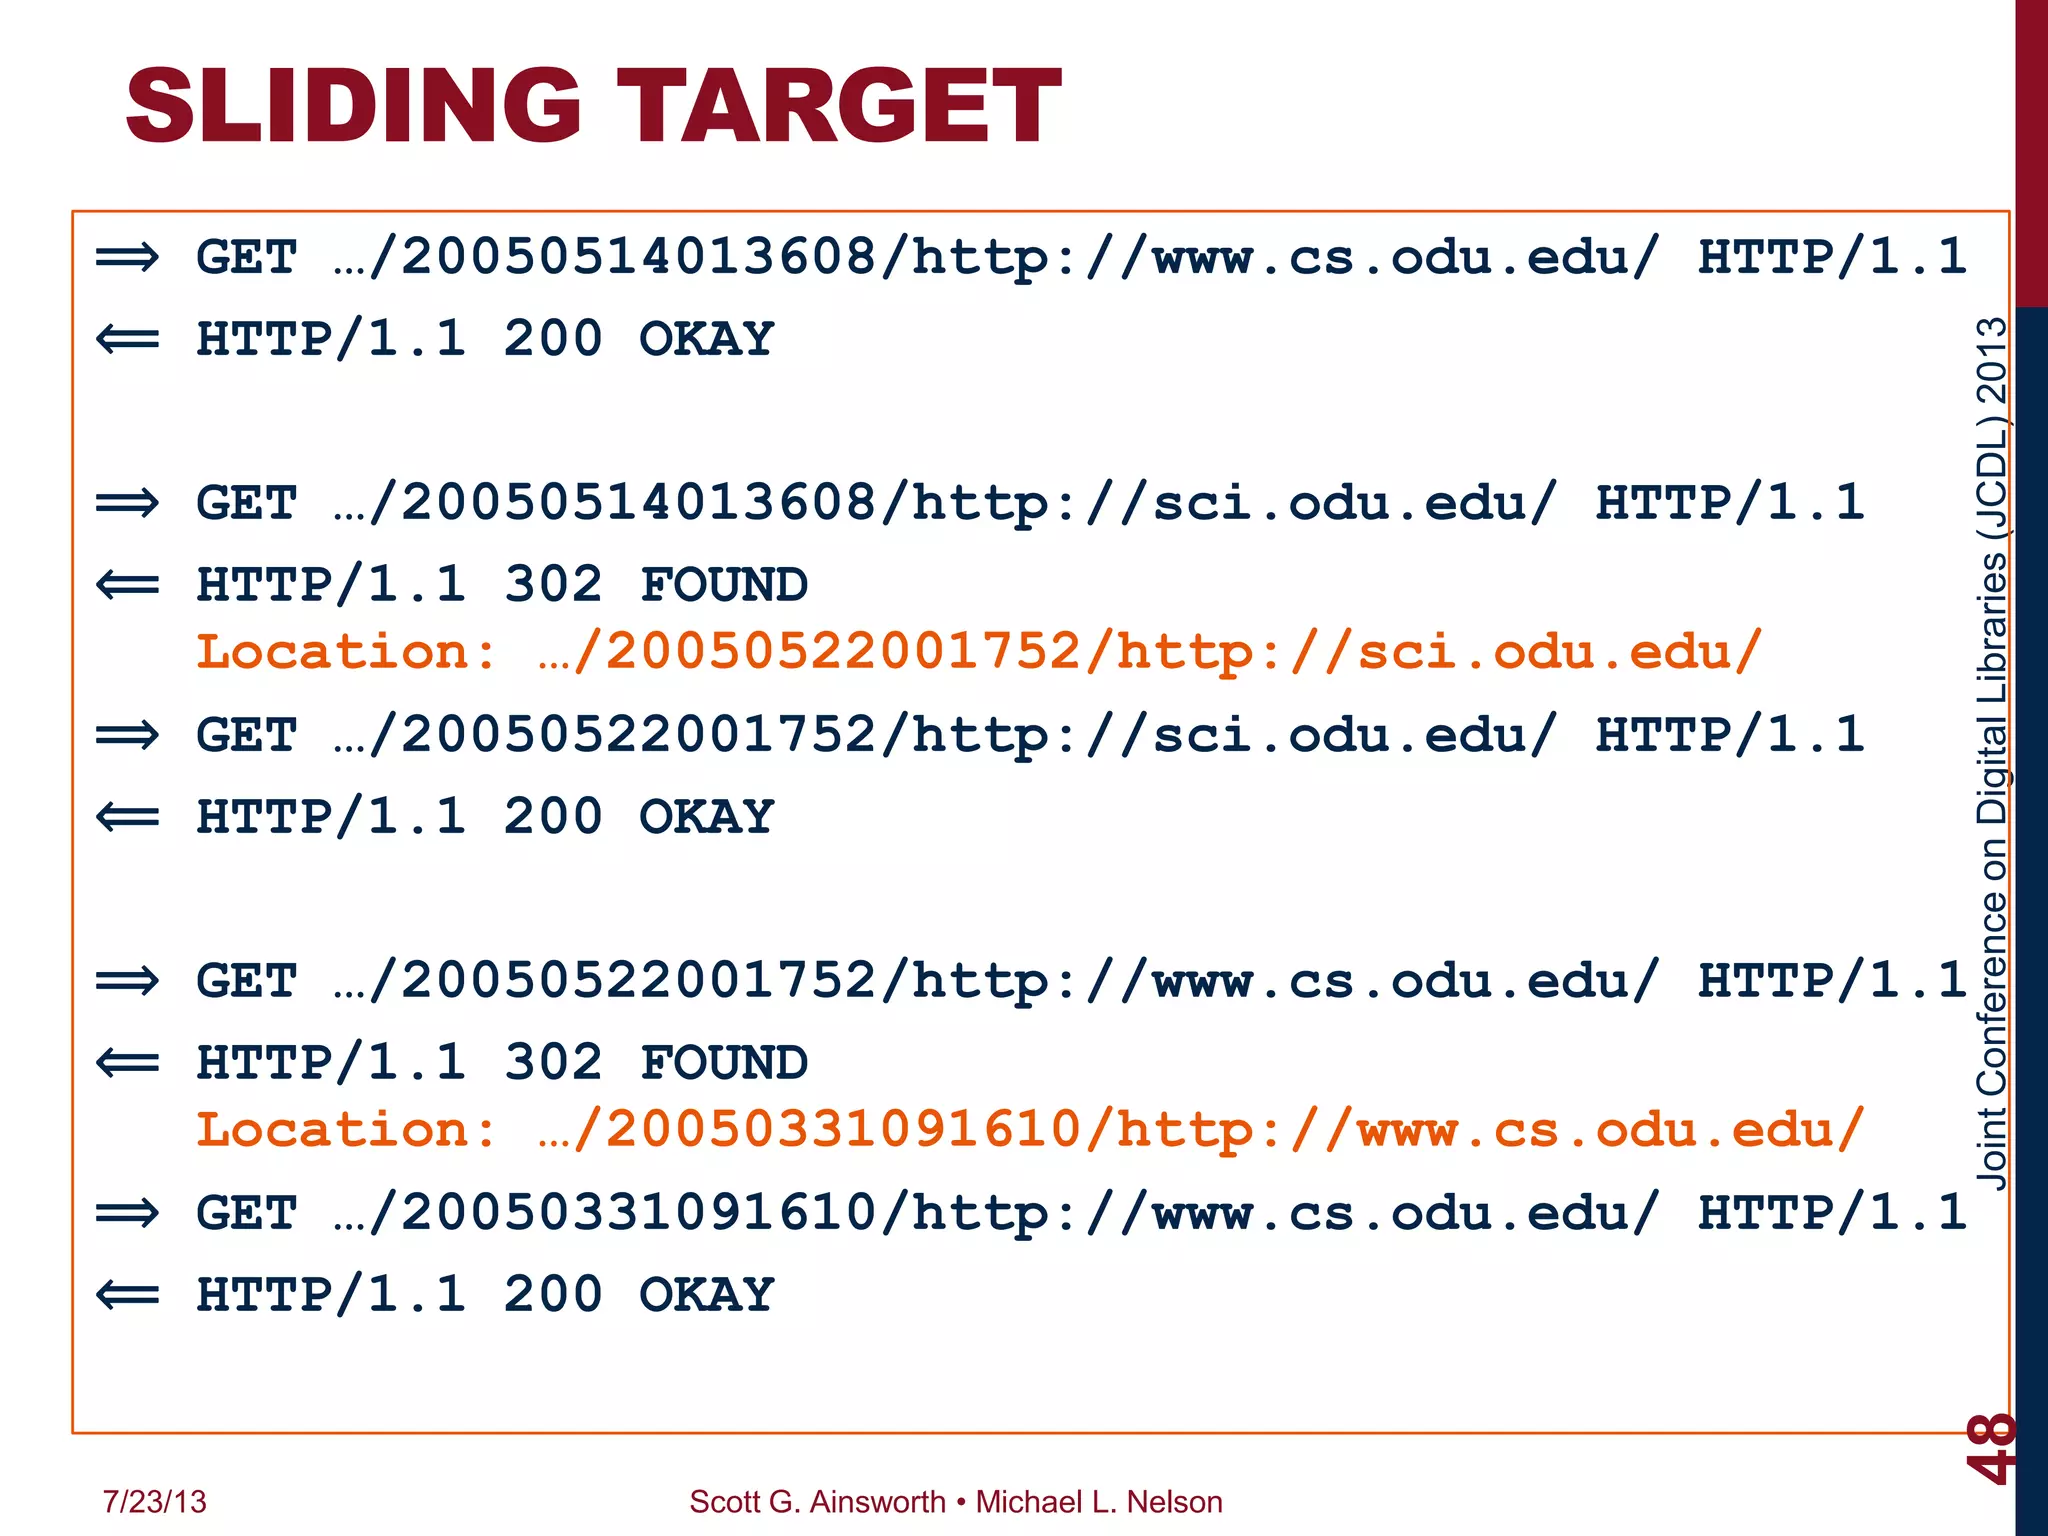
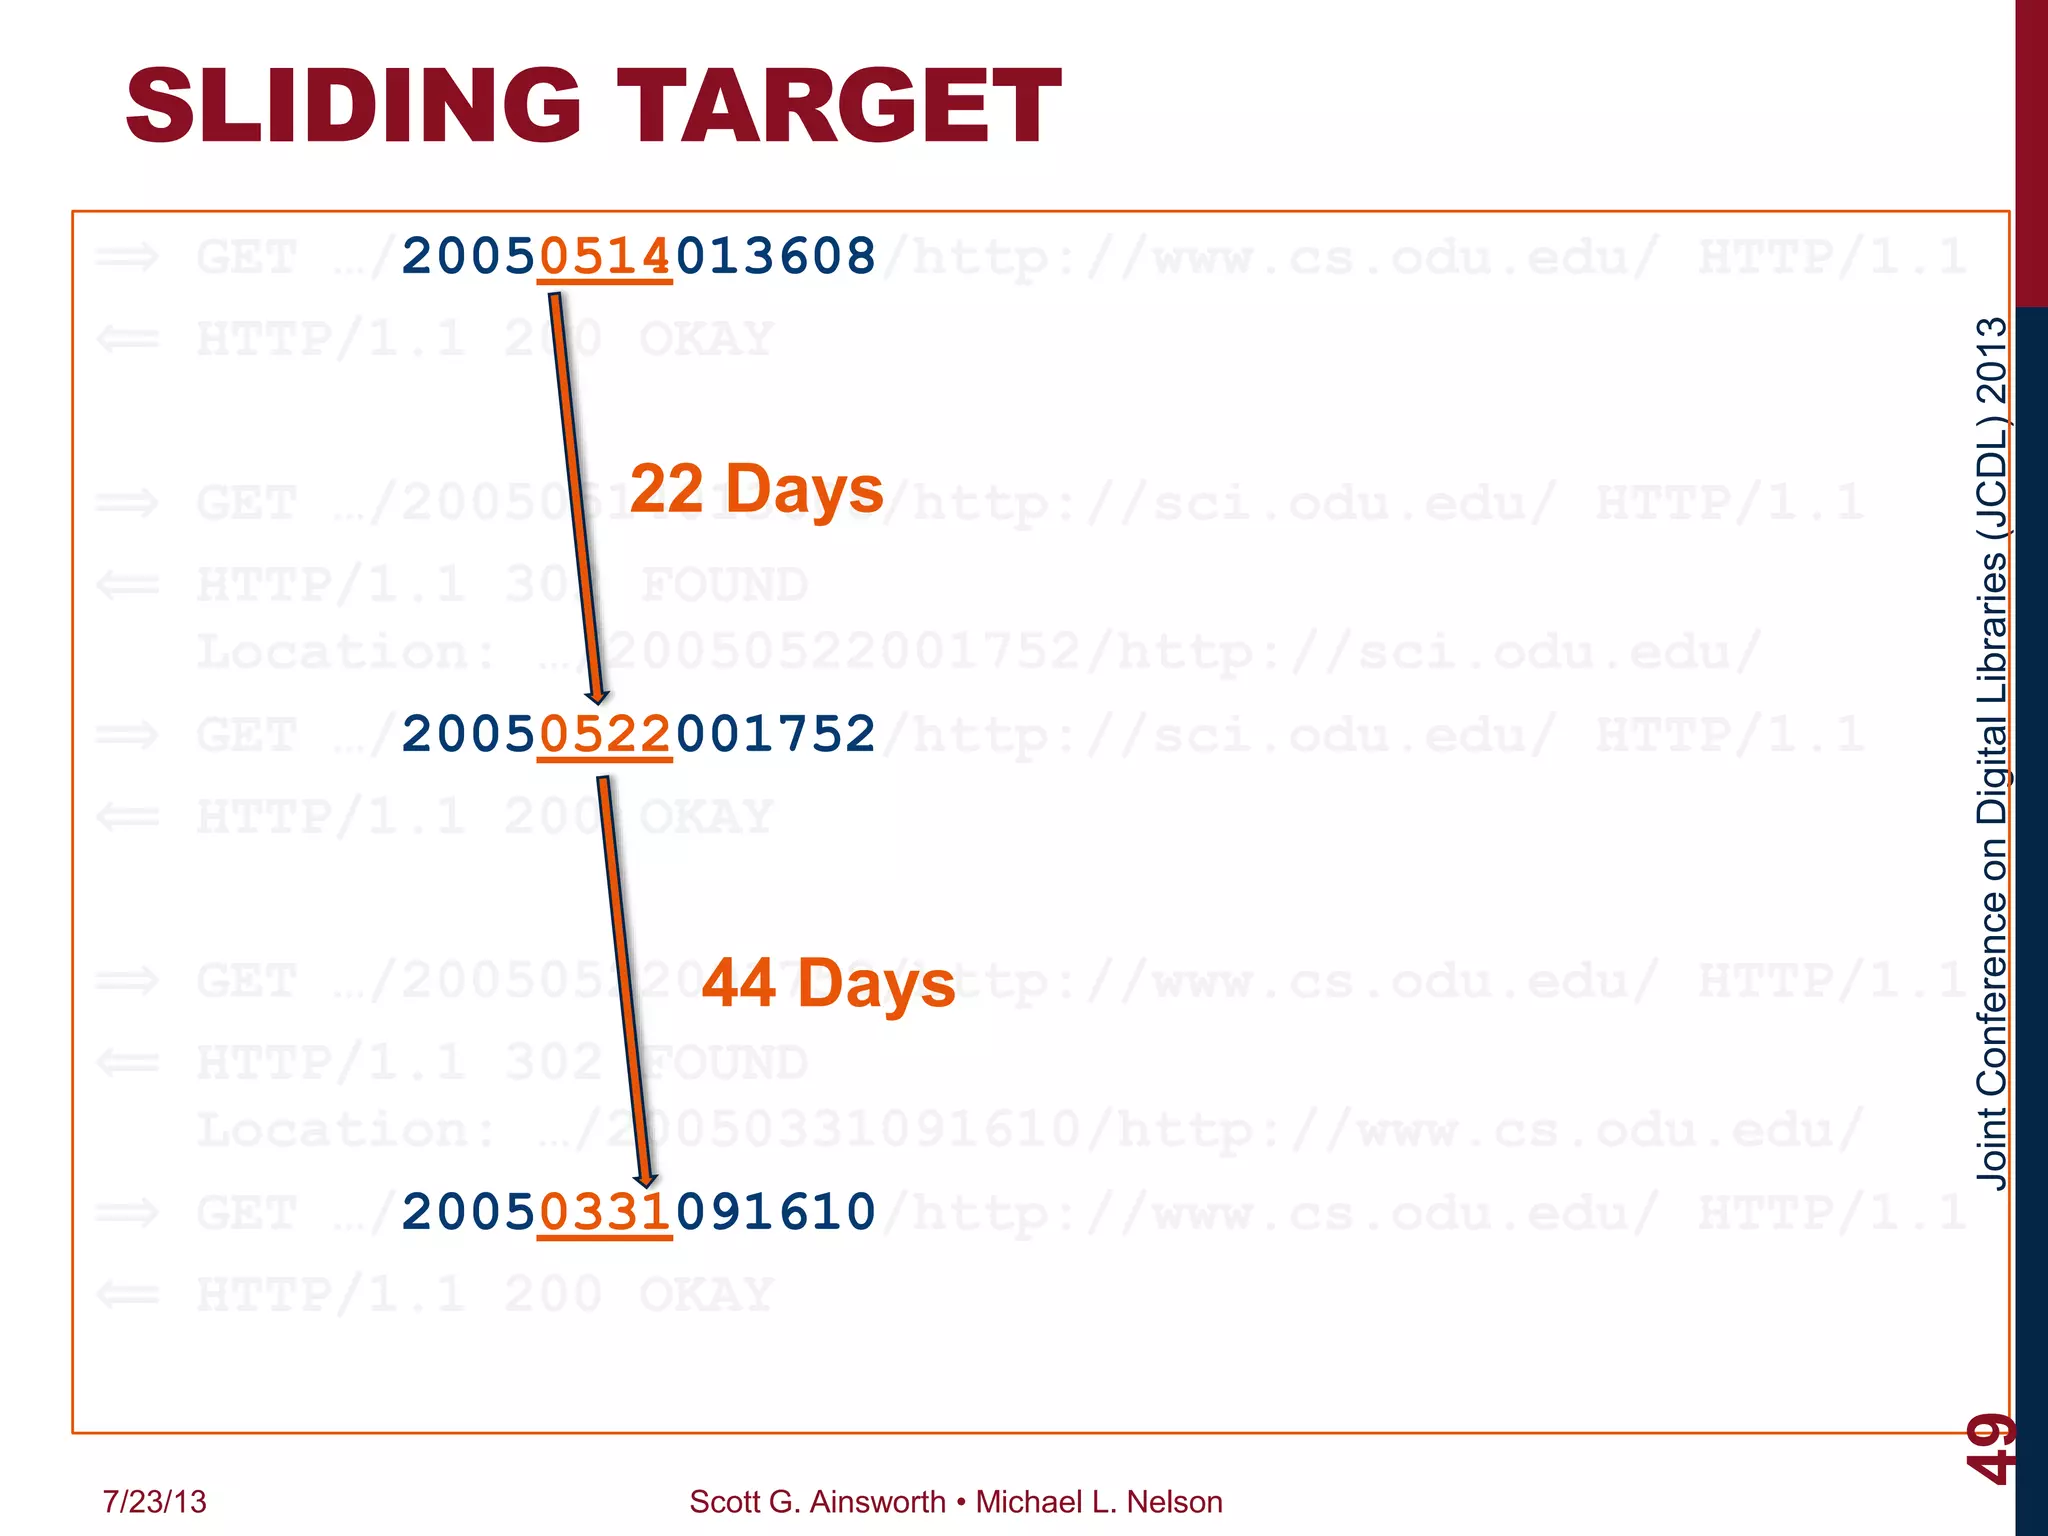
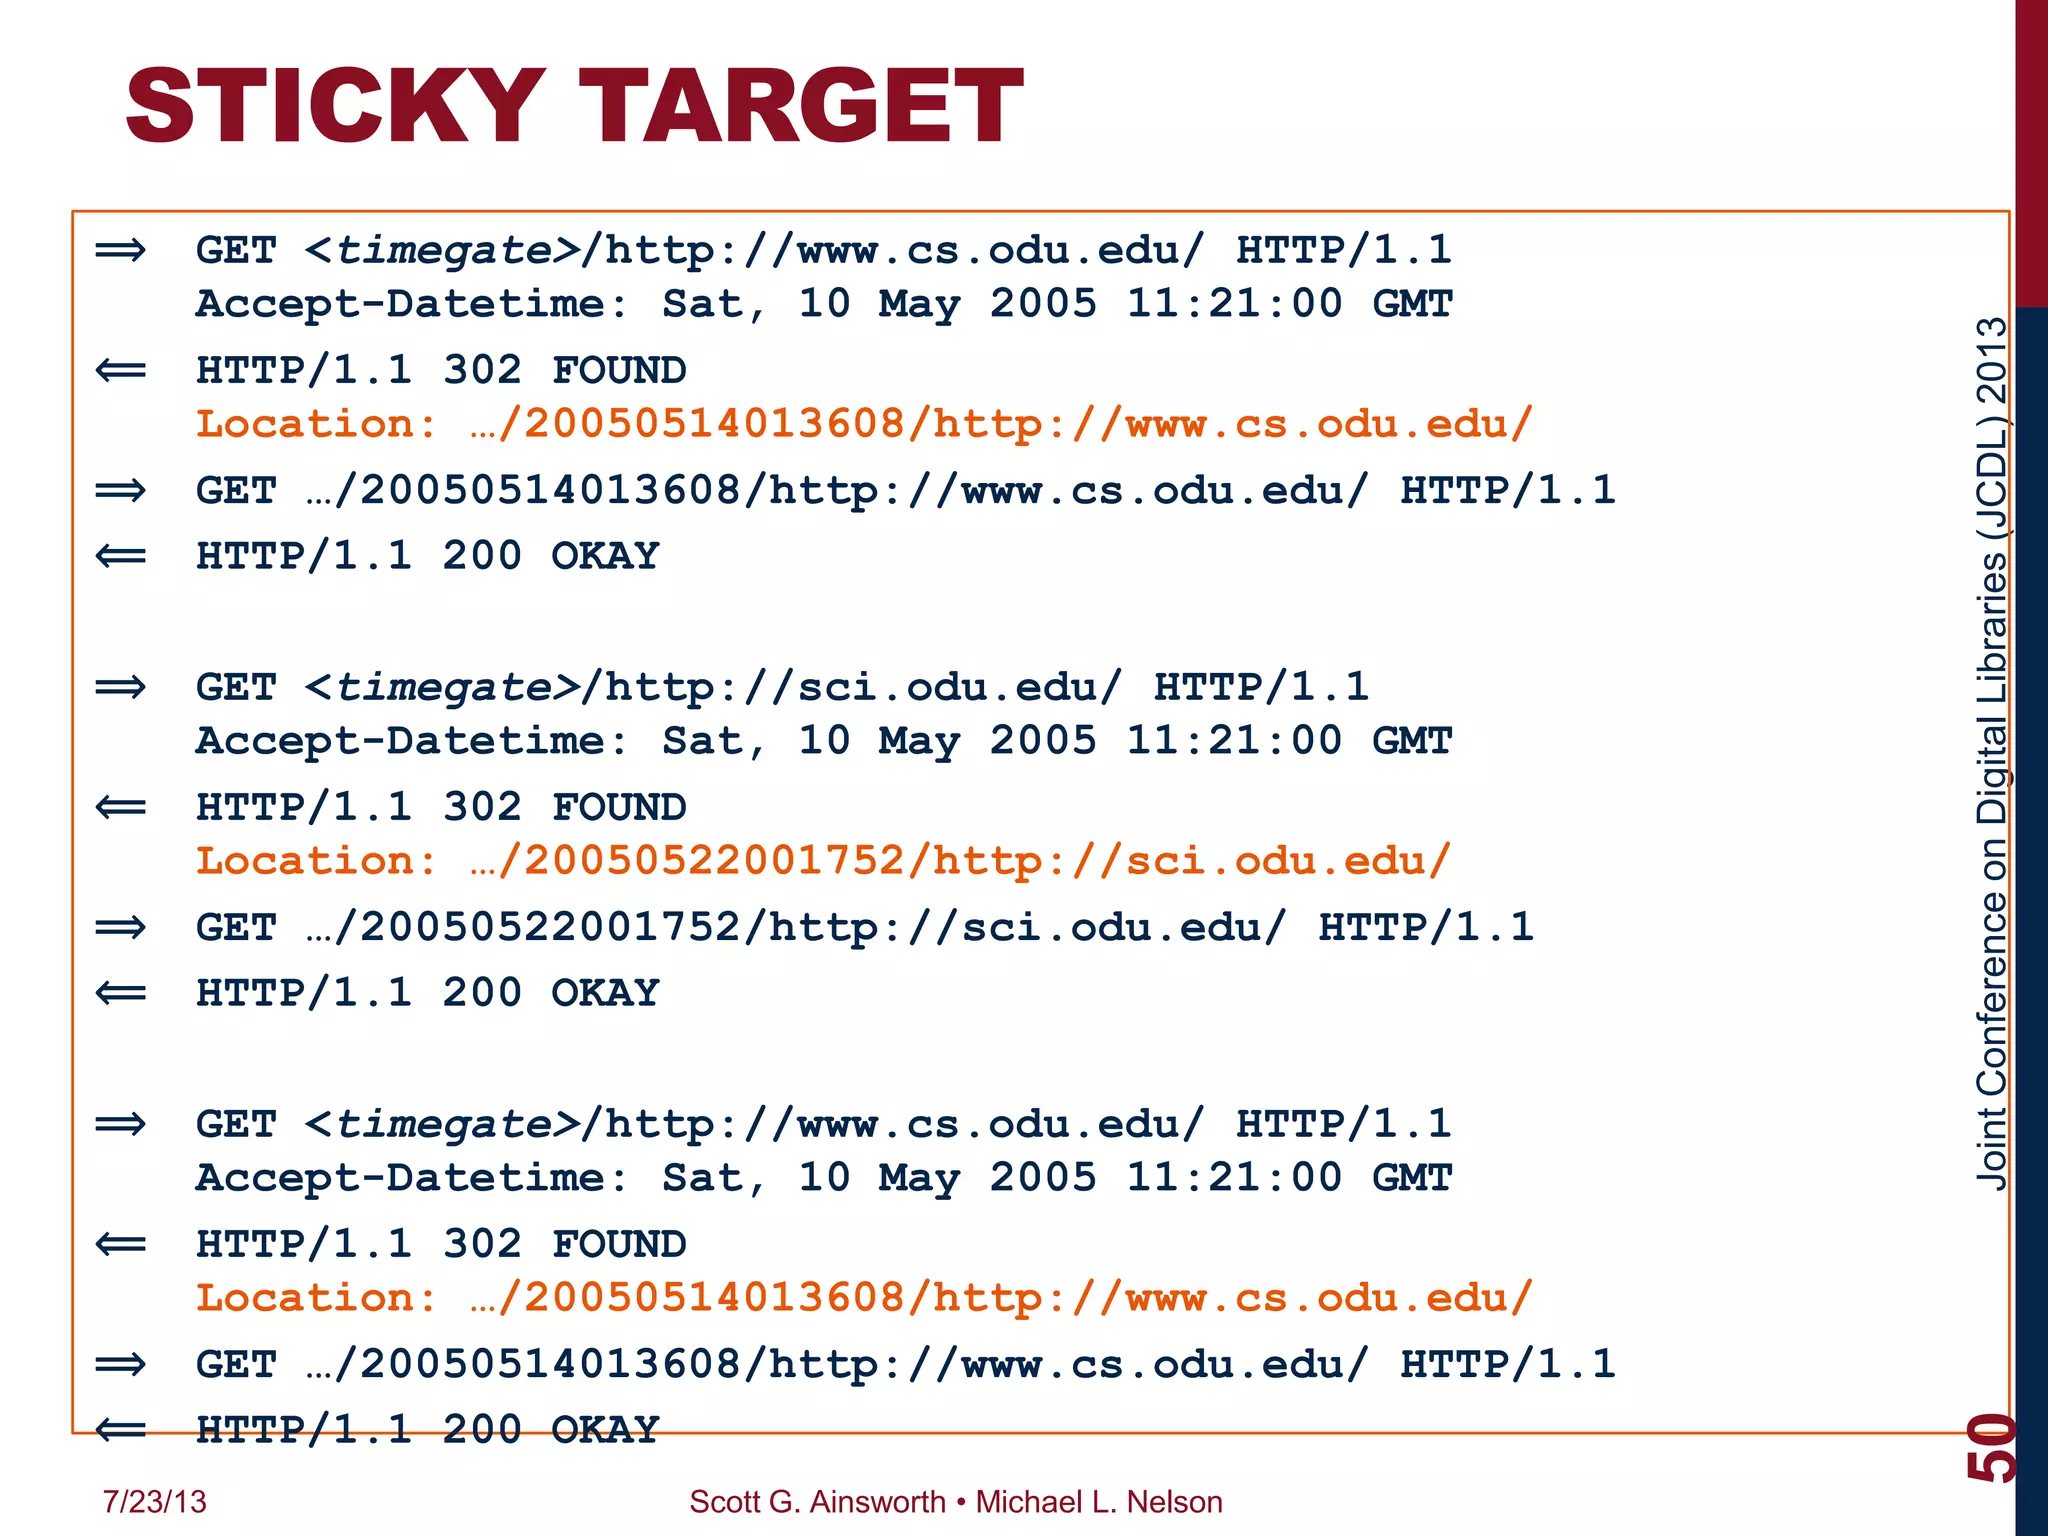
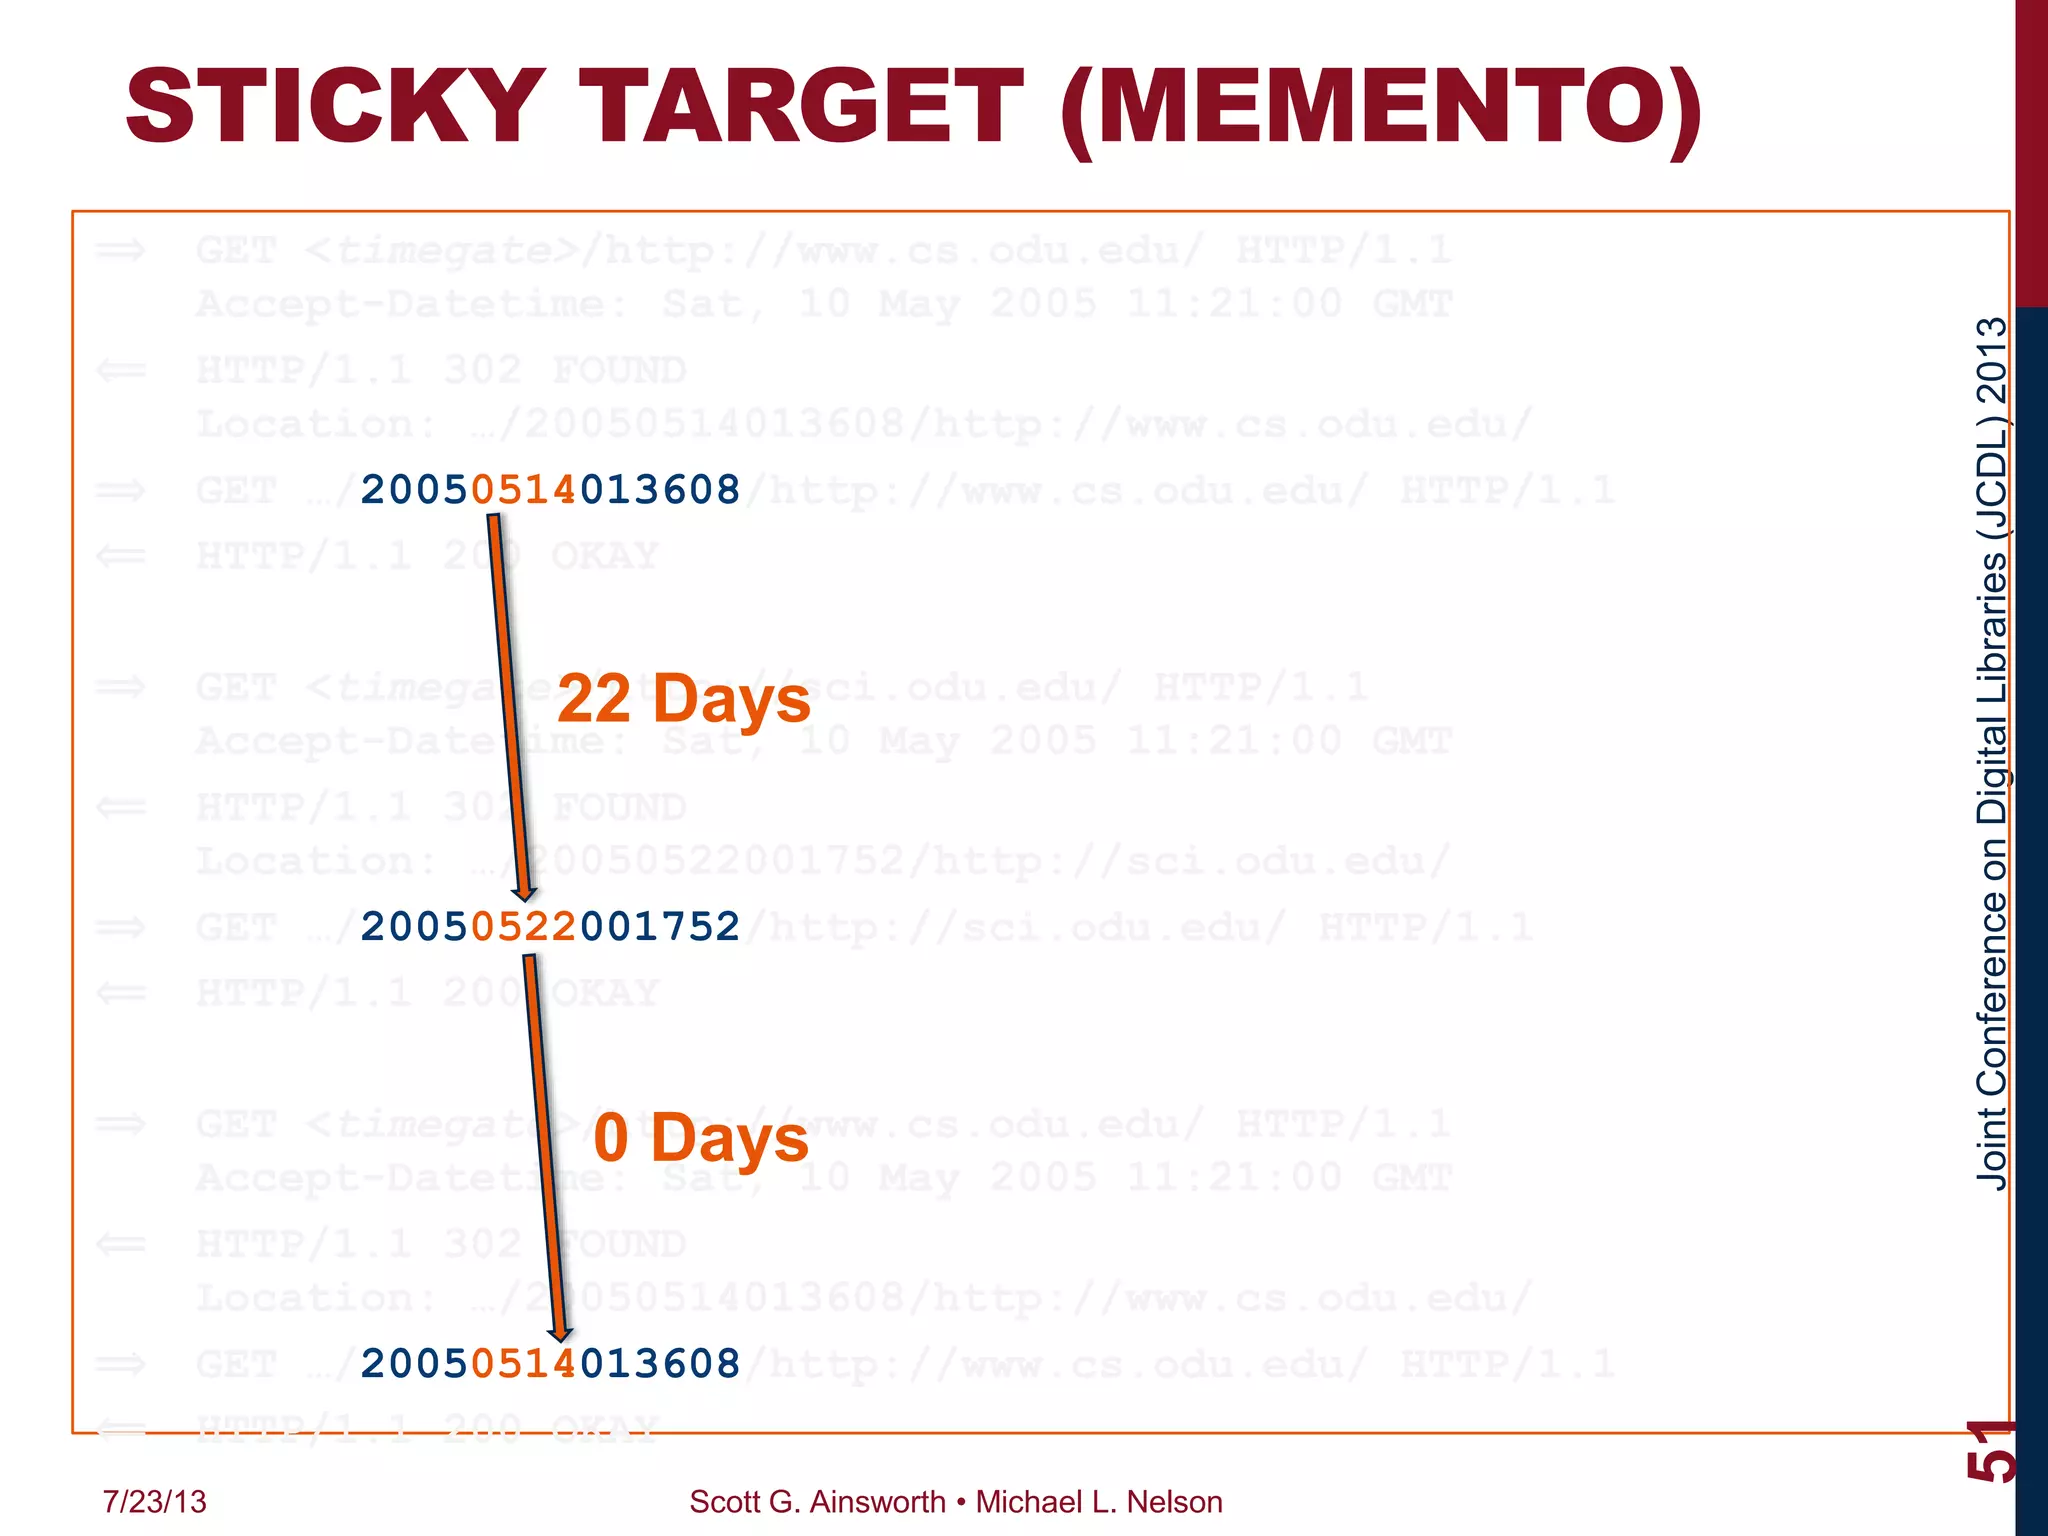
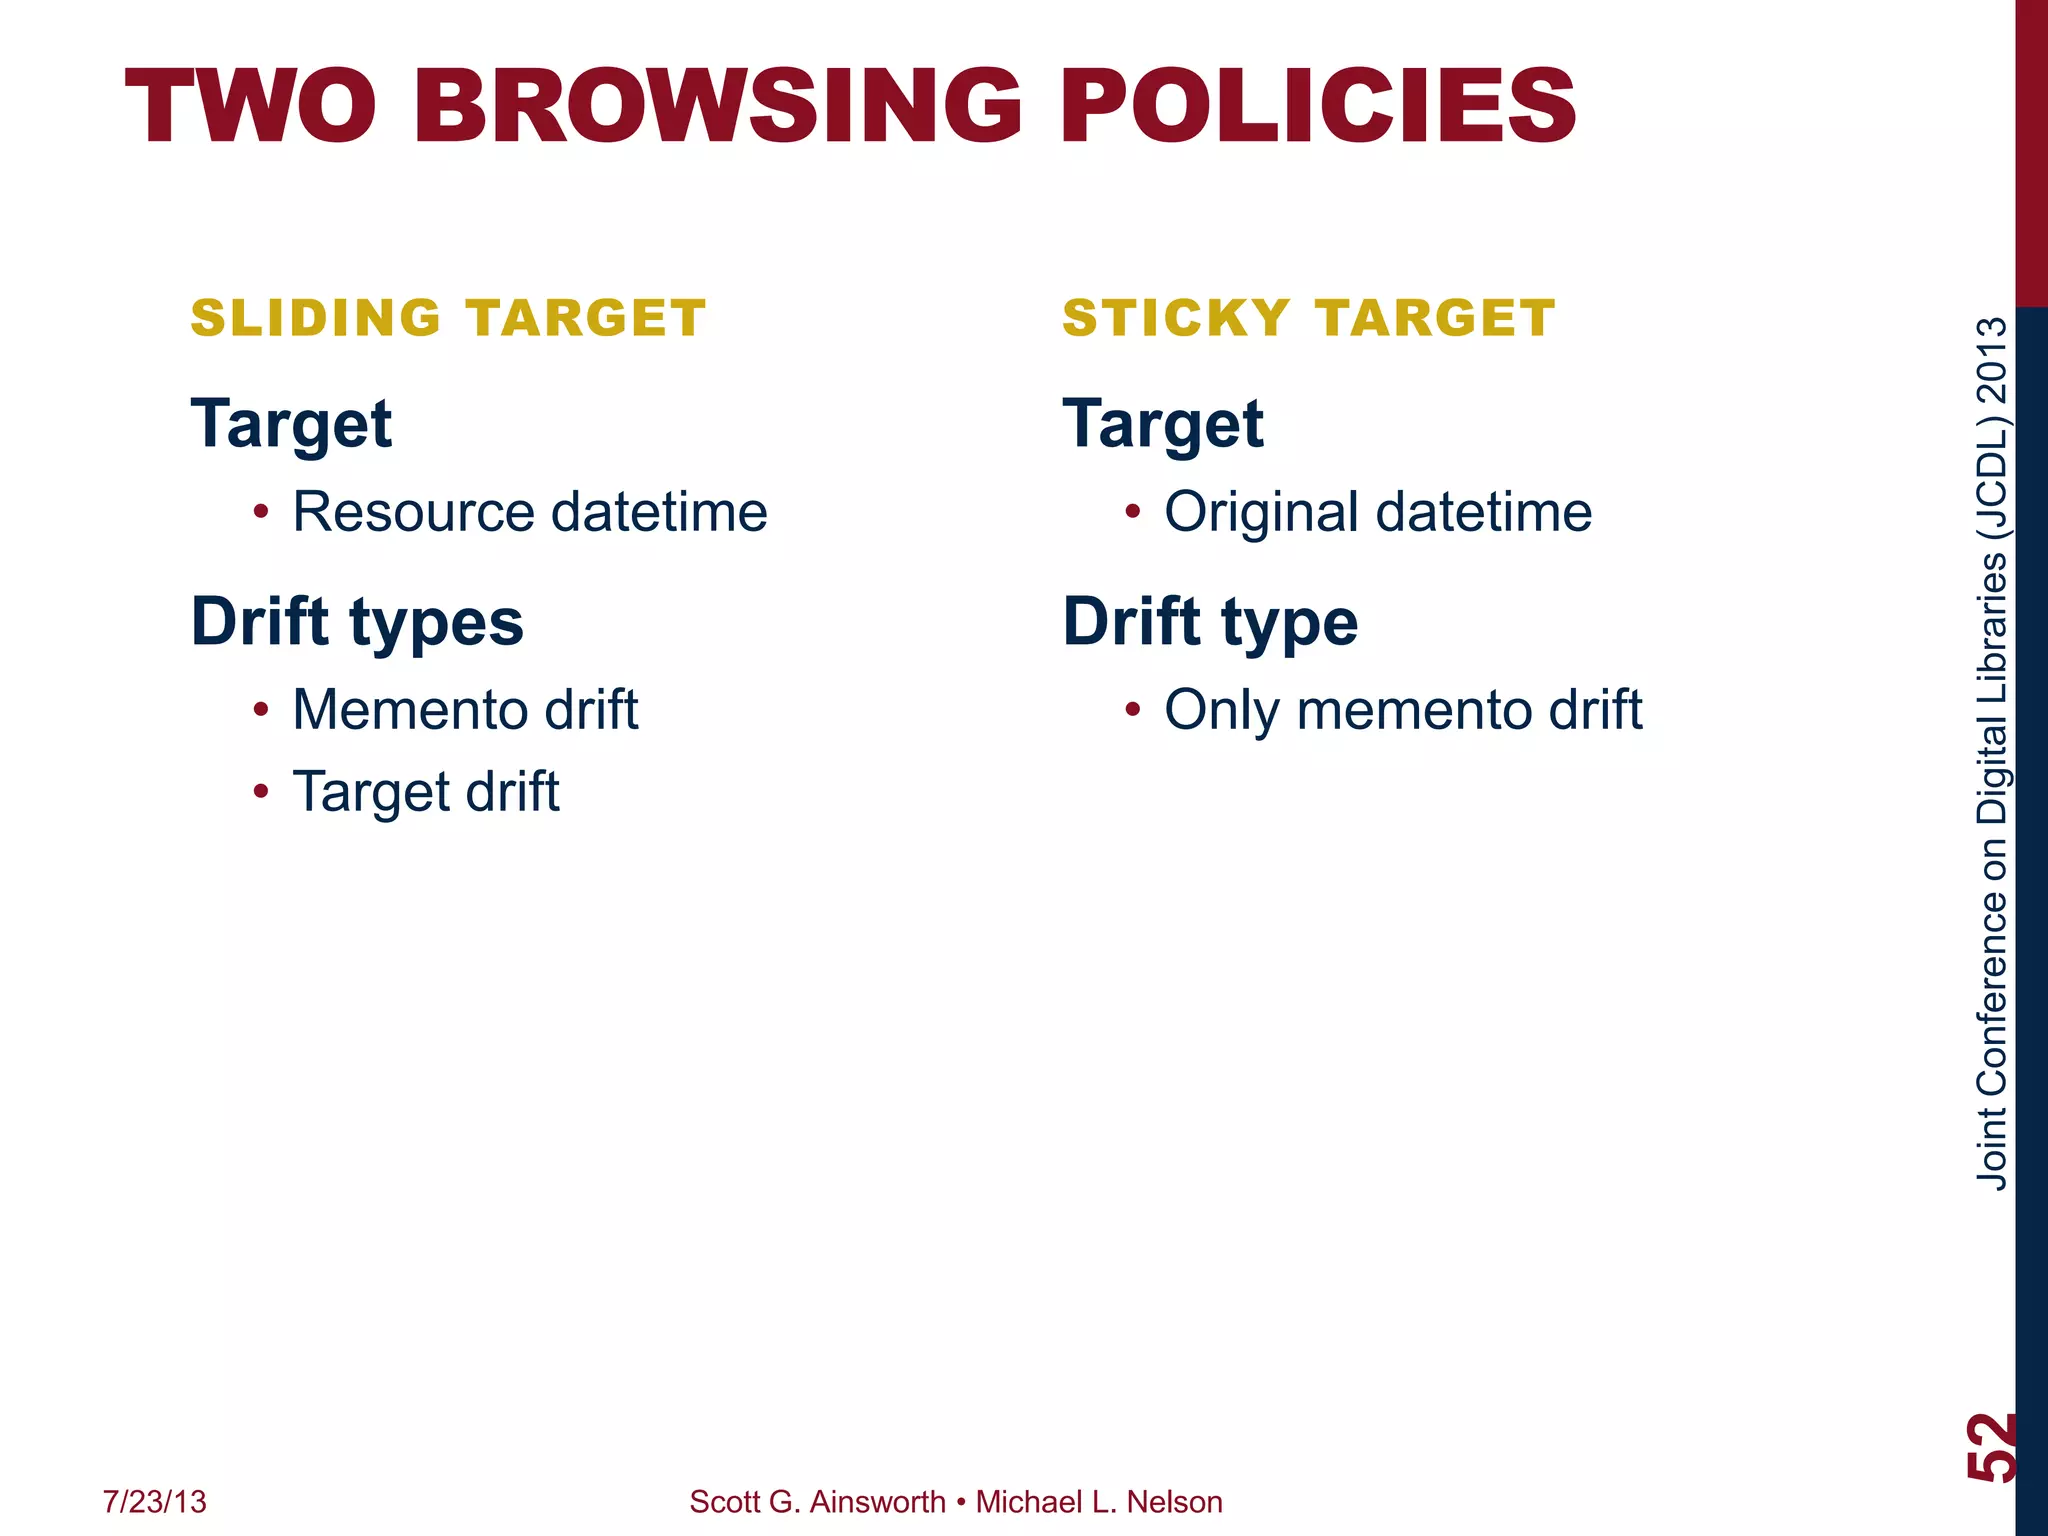
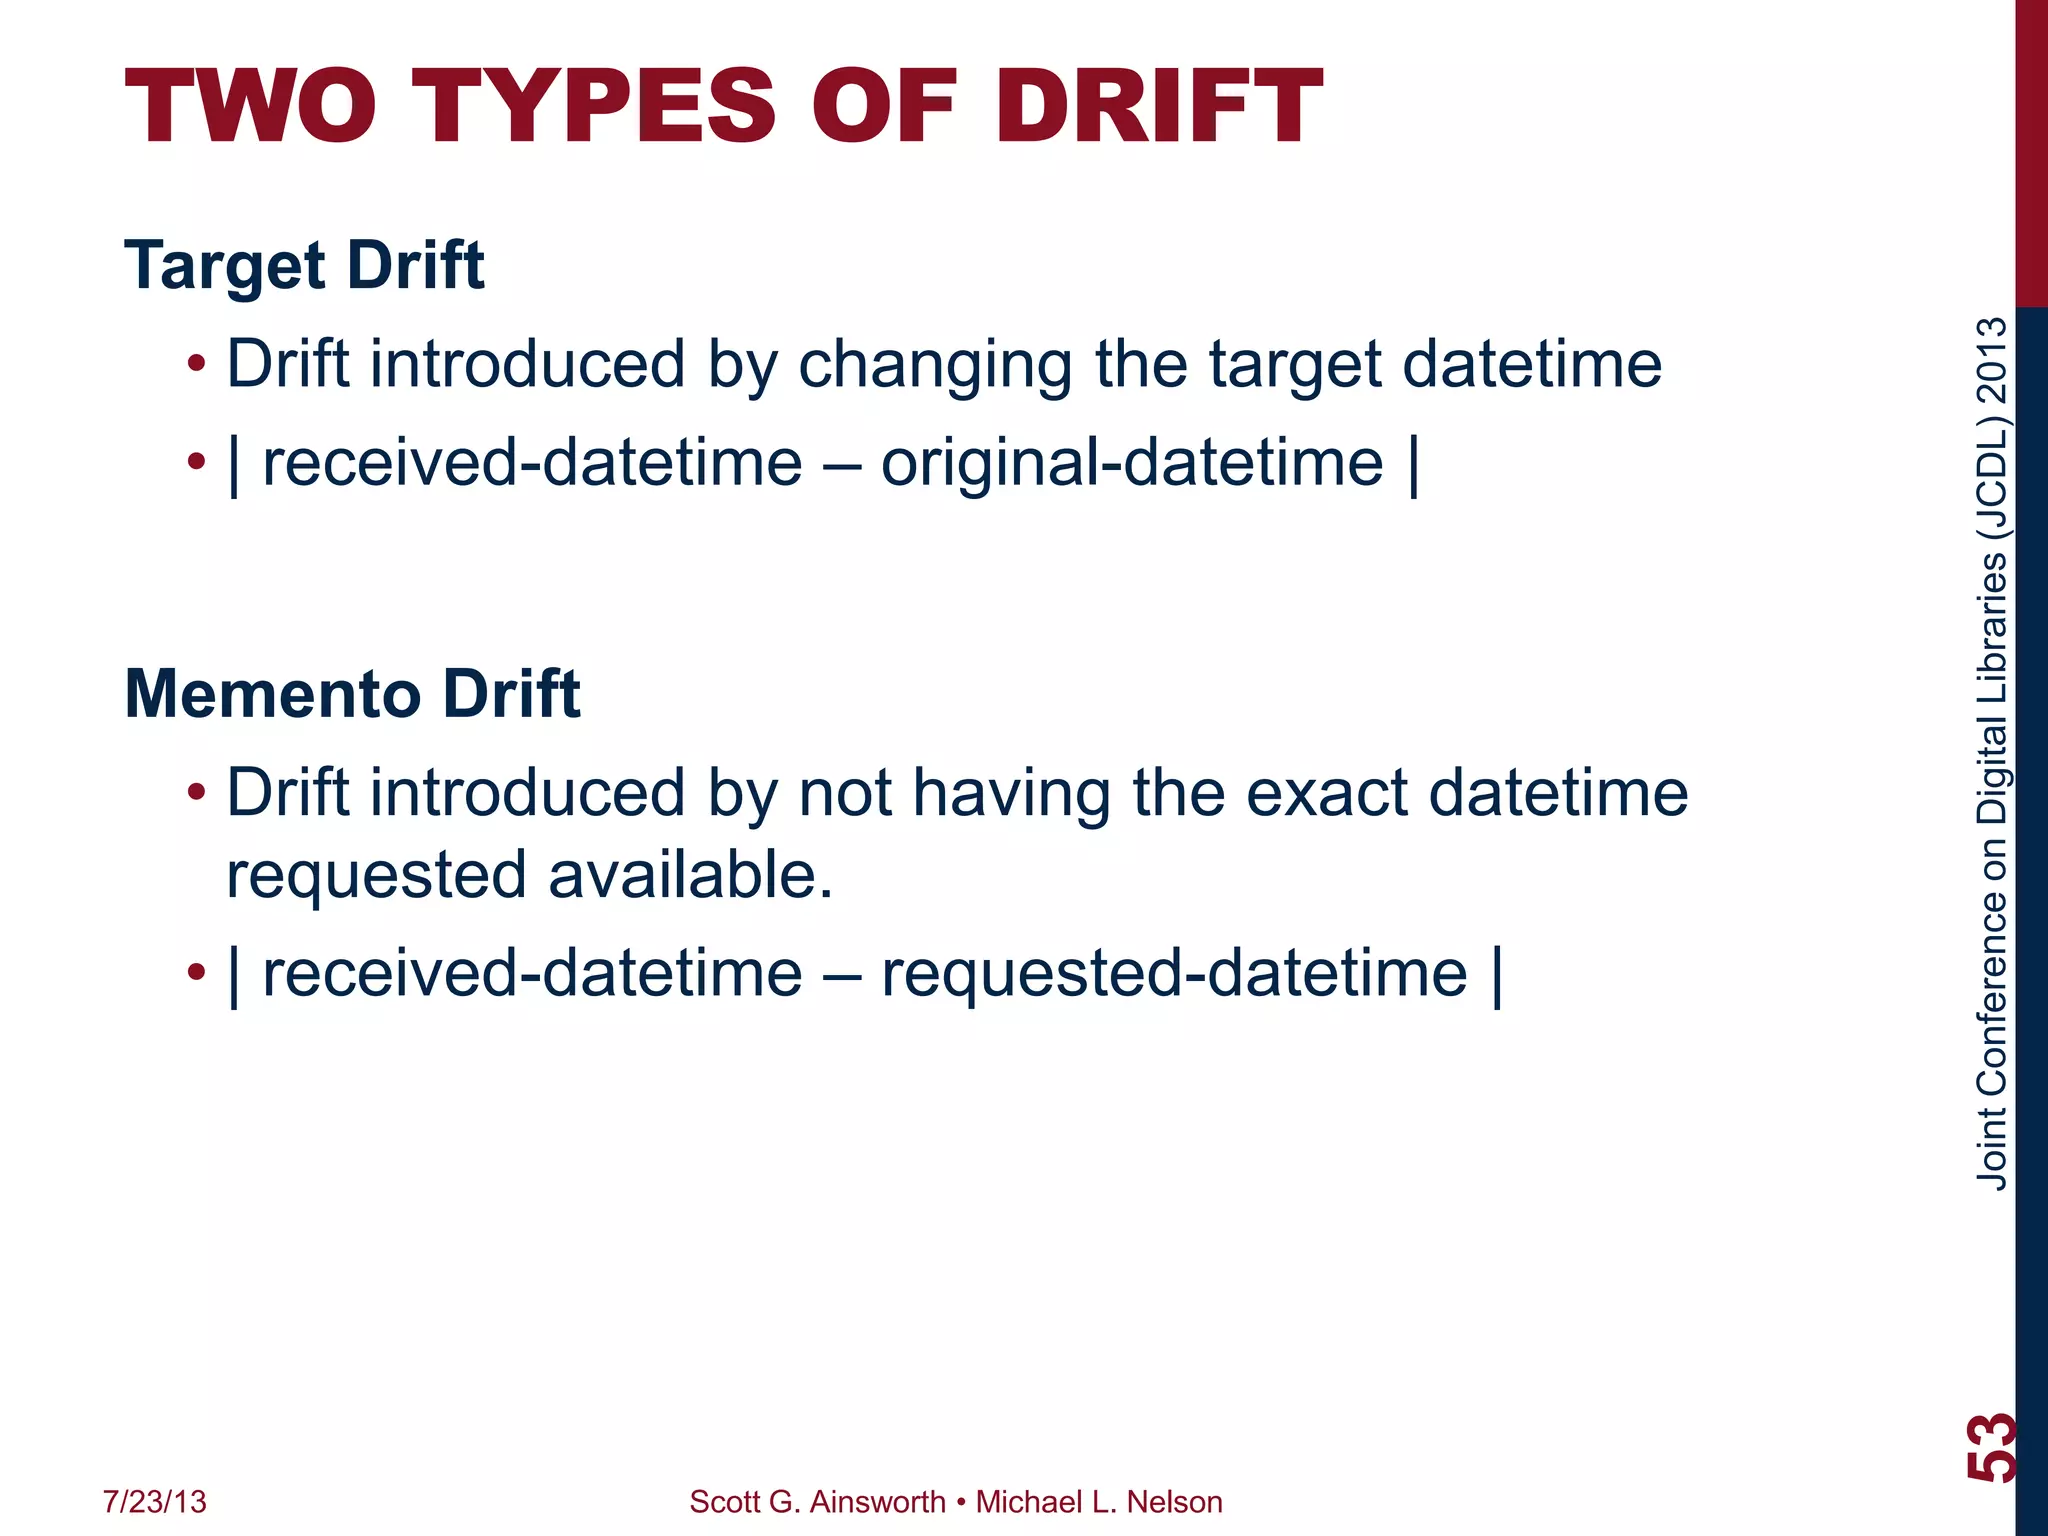
The document describes an experiment that evaluated the temporal drift in web archive walks under sliding and sticky target policies. The experiment involved taking random walks through mementos in a web archive, measuring the drift between target datetimes and observed datetimes. Results showed that sticky target policy reduced drift substantially compared to sliding policy, with a mean drift of 11.0 days versus 32.9 days. Drift was found to increase with walk length and decrease with more unique domains visited and link choices made.
Settling the Score: Street Performance Measures
Abstract: In an effort to better quantify the pedestrian and bicycle experience, this panel discusses multi-modal level of service and alternative methodologies for evaluating how well streets welcome walking and biking. The speakers will explore perspectives from practice and academia, as well as regional versus street segment approaches.
Presenters:
Presenter: Madeline Brozen UCLA Complete Streets Initiative
Co-Presenter: David Anspacher Montgomery County Planning Department
Co-Presenter: Jessica Horning Oregon DOT
Co-Presenter: Mike Lowry Dept. of Civil Engineering, University of Idaho
Co-Presenter: Conor Semler Kittelson & Associates, Inc.
During the opening plenary of the 2016 National Regional Transportation Conference, several presenters offered information about the regional planning work being conducted that ties transportation to community and economic development visions. Speakers included:
Gena McCullough, Bi-State Regional Commission (IL/IA); Jennifer Tinsley, Lower Savannah Council of Governments (SC); Elijah Sharp, New River Valley Regional Commission (VA); Mari Brunner, Southwest Regional Planning Commission (NH); Julio Portillo, River Valley Regional Commission (GA); Robby Cantrell, North Central Alabama Regional Council of Governments.
Pitfalls in alignment of observation models resolved using PROV as an upper o...Simon Cox
AGU Fall Meeting, 2015-12-16
A number of models for observation metadata have been developed in the earth and environmental science communities, including OGC’s Observations and Measurements (O&M), the ecosystems community’s Extensible Observation Ontology (OBOE), the W3C’s Semantic Sensor Network Ontology (SSNO), and the CUAHSI/NSF Observations Data Model v2 (ODM2). In order to combine data formalized in the various models, mappings between these must be developed. In some cases this is straightforward: since ODM2 took O&M as its starting point, their terminology is almost completely aligned. In the eco-informatics world observations are almost never made in isolation of other observations, so OBOE pays particular attention to groupings, with multiple atomic ‘Measurements’ in each oboe:Observation which does not have a result of its own and thus plays a different role to an om:Observation. And while SSN also adopted terminology from O&M, mapping is confounded by the fact that SSNO uses DOLCE as its foundation and places ssn:Observations as ‘Social Objects’ which are explicitly disjoint from ‘Events’, while O&M is formalized as part of the ISO/TC 211 harmonised (UML) model and sees om:Observations as value assignment activities.
Foundational ontologies (such as BFO, GFO, UFO or DOLCE) can provide a framework for alignment, but different upper ontologies can be based in profoundly different world-views and use of incommensurate frameworks can confound rather than help. A potential resolution is provided by comparing recent studies that align SSNO and O&M, respectively, with the PROV ontology. PROV provides just three base classes:
Entity, Activity and Agent. om:Observation is sub-classed
from prov:Activity, while ssn:Observation is sub-classed from prov:Entity. This confirms that, despite the same name, om:Observation and ssn:Observation denote different aspects of the observation process: the observation event, and the record of the observation event, respectively.
Alignment with the simple PROV classes has clarified this issue in a way that had previously proved difficult to resolve. The simple 3-class base model from PROV appears to provide just enough logic to serve as a lightweight upper ontology, particularly for workflow or process-based information.
2018 GIS in Education: Denver Street Trees and Road Safety a Geographic Infor...GIS in the Rockies
At the time this research was conducted, according to the National Highway Traffic Safety Administration (NHTSA) the United Stated had seen a 7.2% increase in traffic fatalities from 2014 to 2015 which was the largest increase seen in 5-decades. More recent reports from the NHTSA show that in 2016 there was an increase of 5.6% from 2015.
According to the National Association of City Transportation Officials (NACTO) Urban Street Design Guide, vehicle speed is a critical element in “cause and severity of crashes” and street trees are considered a speed reduction mechanism. The implication behind this statement is that street trees can be used as a mitigation element in roadway design to assist in increasing traffic safety.
With the use of geographic information systems (GIS) software, tree canopy spatial data was evaluated with 10 sets of previously grouped streets that include segment types: light, moderate, heavy, and arterial. This presentation will show what correlation(s) were discovered between tree canopy coverage and traffic safety at select street intersections and corridors based on research conducted in 2016. More specifically, tree canopy coverage will be analyzed with crash rates, vehicle speeds, total number of crashes and crash severity.
Topics will include spatial data details, methodology for data collection, creation, and analysis, and overall results.
PEARC17: Visual exploration and analysis of time series earthquake dataAmit Chourasia
Earthquake hazard estimation requires systematic investigation of past records as well as fundamental processes that cause the quake. However, detailed long-term records of earthquakes at all scales (magnitude, space and time) are not available. Hence a synthetic method based on first principals could be employed to generate such records to bridge this critical gap of missing data. RSQSim is such a simulator that generates seismic event catalogs for several thousand years at various scales. This synthetic catalog contains rich detail about the earthquake events and associated properties.
Exploring this data is of vital importance to validate the simulator as well as to identify features of interest such as quake time histories, conduct analyses such as calculating mean recurrence interval of events on each fault section. This work1 describes and demonstrates a prototype web based visual tool that enables domain scientists and students explore this rich dataset, as well as discusses refinement and streamlining of data management and analysis that is less error prone and scalable.
Builder.ai Founder Sachin Dev Duggal's Strategic Approach to Create an Innova...Ramesh Iyer
In today's fast-changing business world, Companies that adapt and embrace new ideas often need help to keep up with the competition. However, fostering a culture of innovation takes much work. It takes vision, leadership and willingness to take risks in the right proportion. Sachin Dev Duggal, co-founder of Builder.ai, has perfected the art of this balance, creating a company culture where creativity and growth are nurtured at each stage.
A tale of scale & speed: How the US Navy is enabling software delivery from l...sonjaschweigert1
Rapid and secure feature delivery is a goal across every application team and every branch of the DoD. The Navy’s DevSecOps platform, Party Barge, has achieved:
- Reduction in onboarding time from 5 weeks to 1 day
- Improved developer experience and productivity through actionable findings and reduction of false positives
- Maintenance of superior security standards and inherent policy enforcement with Authorization to Operate (ATO)
Development teams can ship efficiently and ensure applications are cyber ready for Navy Authorizing Officials (AOs). In this webinar, Sigma Defense and Anchore will give attendees a look behind the scenes and demo secure pipeline automation and security artifacts that speed up application ATO and time to production.
We will cover:
- How to remove silos in DevSecOps
- How to build efficient development pipeline roles and component templates
- How to deliver security artifacts that matter for ATO’s (SBOMs, vulnerability reports, and policy evidence)
- How to streamline operations with automated policy checks on container images
DevOps and Testing slides at DASA ConnectKari Kakkonen
My and Rik Marselis slides at 30.5.2024 DASA Connect conference. We discuss about what is testing, then what is agile testing and finally what is Testing in DevOps. Finally we had lovely workshop with the participants trying to find out different ways to think about quality and testing in different parts of the DevOps infinity loop.
Accelerate your Kubernetes clusters with Varnish CachingThijs Feryn
A presentation about the usage and availability of Varnish on Kubernetes. This talk explores the capabilities of Varnish caching and shows how to use the Varnish Helm chart to deploy it to Kubernetes.
This presentation was delivered at K8SUG Singapore. See https://feryn.eu/presentations/accelerate-your-kubernetes-clusters-with-varnish-caching-k8sug-singapore-28-2024 for more details.
State of ICS and IoT Cyber Threat Landscape Report 2024 previewPrayukth K V
The IoT and OT threat landscape report has been prepared by the Threat Research Team at Sectrio using data from Sectrio, cyber threat intelligence farming facilities spread across over 85 cities around the world. In addition, Sectrio also runs AI-based advanced threat and payload engagement facilities that serve as sinks to attract and engage sophisticated threat actors, and newer malware including new variants and latent threats that are at an earlier stage of development.
The latest edition of the OT/ICS and IoT security Threat Landscape Report 2024 also covers:
State of global ICS asset and network exposure
Sectoral targets and attacks as well as the cost of ransom
Global APT activity, AI usage, actor and tactic profiles, and implications
Rise in volumes of AI-powered cyberattacks
Major cyber events in 2024
Malware and malicious payload trends
Cyberattack types and targets
Vulnerability exploit attempts on CVEs
Attacks on counties – USA
Expansion of bot farms – how, where, and why
In-depth analysis of the cyber threat landscape across North America, South America, Europe, APAC, and the Middle East
Why are attacks on smart factories rising?
Cyber risk predictions
Axis of attacks – Europe
Systemic attacks in the Middle East
Download the full report from here:
https://sectrio.com/resources/ot-threat-landscape-reports/sectrio-releases-ot-ics-and-iot-security-threat-landscape-report-2024/
UiPath Test Automation using UiPath Test Suite series, part 4DianaGray10
Welcome to UiPath Test Automation using UiPath Test Suite series part 4. In this session, we will cover Test Manager overview along with SAP heatmap.
The UiPath Test Manager overview with SAP heatmap webinar offers a concise yet comprehensive exploration of the role of a Test Manager within SAP environments, coupled with the utilization of heatmaps for effective testing strategies.
Participants will gain insights into the responsibilities, challenges, and best practices associated with test management in SAP projects. Additionally, the webinar delves into the significance of heatmaps as a visual aid for identifying testing priorities, areas of risk, and resource allocation within SAP landscapes. Through this session, attendees can expect to enhance their understanding of test management principles while learning practical approaches to optimize testing processes in SAP environments using heatmap visualization techniques
What will you get from this session?
1. Insights into SAP testing best practices
2. Heatmap utilization for testing
3. Optimization of testing processes
4. Demo
Topics covered:
Execution from the test manager
Orchestrator execution result
Defect reporting
SAP heatmap example with demo
Speaker:
Deepak Rai, Automation Practice Lead, Boundaryless Group and UiPath MVP
UiPath Test Automation using UiPath Test Suite series, part 3DianaGray10
Welcome to UiPath Test Automation using UiPath Test Suite series part 3. In this session, we will cover desktop automation along with UI automation.
Topics covered:
UI automation Introduction,
UI automation Sample
Desktop automation flow
Pradeep Chinnala, Senior Consultant Automation Developer @WonderBotz and UiPath MVP
Deepak Rai, Automation Practice Lead, Boundaryless Group and UiPath MVP
PHP Frameworks: I want to break free (IPC Berlin 2024)Ralf Eggert
In this presentation, we examine the challenges and limitations of relying too heavily on PHP frameworks in web development. We discuss the history of PHP and its frameworks to understand how this dependence has evolved. The focus will be on providing concrete tips and strategies to reduce reliance on these frameworks, based on real-world examples and practical considerations. The goal is to equip developers with the skills and knowledge to create more flexible and future-proof web applications. We'll explore the importance of maintaining autonomy in a rapidly changing tech landscape and how to make informed decisions in PHP development.
This talk is aimed at encouraging a more independent approach to using PHP frameworks, moving towards a more flexible and future-proof approach to PHP development.
LF Energy Webinar: Electrical Grid Modelling and Simulation Through PowSyBl -...DanBrown980551
Do you want to learn how to model and simulate an electrical network from scratch in under an hour?
Then welcome to this PowSyBl workshop, hosted by Rte, the French Transmission System Operator (TSO)!
During the webinar, you will discover the PowSyBl ecosystem as well as handle and study an electrical network through an interactive Python notebook.
PowSyBl is an open source project hosted by LF Energy, which offers a comprehensive set of features for electrical grid modelling and simulation. Among other advanced features, PowSyBl provides:
- A fully editable and extendable library for grid component modelling;
- Visualization tools to display your network;
- Grid simulation tools, such as power flows, security analyses (with or without remedial actions) and sensitivity analyses;
The framework is mostly written in Java, with a Python binding so that Python developers can access PowSyBl functionalities as well.
What you will learn during the webinar:
- For beginners: discover PowSyBl's functionalities through a quick general presentation and the notebook, without needing any expert coding skills;
- For advanced developers: master the skills to efficiently apply PowSyBl functionalities to your real-world scenarios.
LF Energy Webinar: Electrical Grid Modelling and Simulation Through PowSyBl -...
Evaluating Sliding and Sticky Target Policies by Measuring Temporal Drift in Acyclic Walks Through a Web Archive�
1. EVALUATING SLIDING AND
STICKY TARGET POLICIES
BY MEASURING TEMPORAL
DRIFT IN ACYCLIC WALKS
THROUGH A WEB ARCHIVE
SCOTT G. AINSWORTH
MICHAEL L. NELSON
OLD DOMINION UNIVERSITY
COMPUTER SCIENCE
JCDL 2013
JULY 23-25, 2013
INDIANAPOLIS, INDIANA USA
12. JointConferenceonDigitalLibraries(JCDL)2013
MEMENTO HTTP EXTENSION*
Adds ability to request a particular date-time
Enables Sticky Target
Request
Response
7/23/13 Scott G. Ainsworth • Michael L. Nelson
12
GET <timegate>/http://www.cs.odu.edu/ HTTP/1.1
…
Accept-Datetime: Sat, 10 May 2005 11:21:00 GMT
…
HTTP/1.1 200 OK
…
Memento-Datetime: Sat, 14 May 2005 01:36:08 GMT
…
*https://datatracker.ietf.org/doc/draft-vandesompel-memento/
16. JointConferenceonDigitalLibraries(JCDL)2013
DRIFT COMPARISON
Page
Sliding Sticky
Datetime Drift Datetime Drift
CS Home
2005-05-14
01:36:08
–
2005-05-14
01:36:08
–
Science
Home
2005-04-22
00:17:52
22.1 days
2005-04-22
00:17:52
22.1 days
CS Home
2005-03-31
09:16:10
43.7 days
(+21.6 days)
2005-05-14
01:36:08
–
Mean 32.9 days 11.0 days
7/23/13 Scott G. Ainsworth • Michael L. Nelson
16
17. JointConferenceonDigitalLibraries(JCDL)2013
QUESTIONS
How much temporal drift is there with the two
policies?
Does the sticky policy reduce drift as expected?
If so, by how much?
How do
• Choice (number of links)
• Domains visited
• Walk length
Influence drift?
7/23/13 Scott G. Ainsworth • Michael L. Nelson
17
19. JointConferenceonDigitalLibraries(JCDL)2013
RELATED WORK
Control Crawl Data Quality, Future collections
• Spaniol et al. – crawling strategy
• Denev et al. – change rates by MIME type and
depth
• Ben Saad et al. – metadata from crawl used to
select best results from archive
Our Focus: Existing Data Quality
• Existing collections
• Datetime selection policies
7/23/13 Scott G. Ainsworth • Michael L. Nelson
19
21. JointConferenceonDigitalLibraries(JCDL)2013
DEFINITIONS
Walk Length
Number of successful steps
(HTTP 200 response)
Unique
Domains
Number of unique domains
(jcdl.org, amazon.com, etc.)
Choice
Number of unique links
(calculated per page)
Drift | target-datetime1 – Memento-Datetimei |
7/23/13 Scott G. Ainsworth • Michael L. Nelson
21
22. JointConferenceonDigitalLibraries(JCDL)2013
PROCESS BY EXAMPLE
Select a URI
• Random selection of 1 out of 4,000
4000 Sample URIs – same as JCDL 2011 paper
• DMOZ – a reference
• Search Engines – best random sampling
• Bitly – does shortening have an impact?
• Delicious – does popularity have an impact?
“How Much of the Web Is Archived?”
http://arxiv.org/abs/1212.6177
7/23/13 Scott G. Ainsworth • Michael L. Nelson
22
23. JointConferenceonDigitalLibraries(JCDL)2013
PROCESS BY EXAMPLE
First, select a URI
• Random selection of 1 out of 4,000
Second, download timemap
7/23/13 Scott G. Ainsworth • Michael L. Nelson
23
<http://api.wayback.archive.org/memento/20050507093740/http://www.cs.odu.edu/>;
rel="memento";
datetime="Sat, 07 May 2005 09:37:40 GMT",
<http://api.wayback.archive.org/memento/20050514013608/http://www.cs.odu.edu/>;
rel="memento";
datetime="Sat, 14 May 2005 01:36:08 GMT",
<http://api.wayback.archive.org/memento/20050515002903/http://www.cs.odu.edu/>;
rel="memento";
datetime="Sun, 15 May 2005 00:29:03 GMT",
<http://api.wayback.archive.org/memento/20050514013608/http://www.cs.odu.edu/>;
rel="memento";
datetime="Sat, 14 May 2005 01:36:08 GMT",
28. JointConferenceonDigitalLibraries(JCDL)2013
PROCESS BY EXAMPLE
The timemap downloaded, the best datetimes are
selected, and the memento downloaded…
Wayback Machine Memento API
7/23/13 Scott G. Ainsworth • Michael L. Nelson
28
Successful Steps 1 + 1 = 2
Unique Domains 1 + 0 = 1
Choice 48 + 36 = 84
Mean Drift (days) 11.0 WB 11.0 API
29. JointConferenceonDigitalLibraries(JCDL)2013
PROCESS BY EXAMPLE
Again for http://www.odu.edu
Wayback Machine Memento API
7/23/13 Scott G. Ainsworth • Michael L. Nelson
29
Successful Steps 2 + 1 = 3
Unique Domains 1 + 0 = 1
Choice 84 + 33 = 117
Mean Drift (days) 14.7 WB 7.4 API
31. JointConferenceonDigitalLibraries(JCDL)2013
PROCESS BY EXAMPLE
And for http://odusports.collegesports.com
Wayback Machine Memento API
7/23/13 Scott G. Ainsworth • Michael L. Nelson
31
Successful Steps 3 + 1 = 4
Unique Domains 1 + 1 = 2
Choice 117 + 77 = 194
Mean Drift (days) 18.2 WB 7.3 API
32. JointConferenceonDigitalLibraries(JCDL)2013
PROCESS BY EXAMPLE
And for http://www.vtext.com
Wayback Machine Memento API
7/23/13 Scott G. Ainsworth • Michael L. Nelson
32
Successful Steps 4 + 1 = 5
Unique Domains 2 + 1 = 3
Choice 194 + 14 = 208
Mean Drift (days) 20.3 WB 5.8 API
33. JointConferenceonDigitalLibraries(JCDL)2013
PROCESS BY EXAMPLE
And 404 stops the walk
Wayback Machine Memento API
7/23/13 Scott G. Ainsworth • Michael L. Nelson
33
HTTP Response:
• 404 Not Found
Successful Steps 4 + 1 = 5
Unique Domains 2 + 1 = 3
Choice 194 + 14 = 208
Mean Drift (days) 20.3 WB 5.8 API
34. JointConferenceonDigitalLibraries(JCDL)2013
STOP CAUSES
First Step Subsequent Steps
Stop Cause Count Percent Count Percent
Timemaps
HTTP 403 74 1.7% 4,803 9.1%
HTTP 404 1,327 30.1% 15,850 29.0%
HTTP 503 0 0.0% 43 0.1%
Other 2 0.0% 180 0.3%
Mementos
HTTP 403 52 1.2% 476 0.9%
HTTP 404 215 4.9% 3,633 6.8%
HTTP 503 1,957 44.4% 10,535 19.9%
Download failed 154 3.5% 589 1.1%
Not HTML 514 11.7% 2,856 5.4%
No Common Links 0 0.0% 12,957 24.4%
Other 117 2.7% 1,128 2.1%
Totals 4,412 53,050
7/23/13 Scott G. Ainsworth • Michael L. Nelson
34
38. JointConferenceonDigitalLibraries(JCDL)2013
MEDIAN DRIFT BY STEP
Median Drift by Step
Step Number
MedianDrift(Months)
1 10 20 30 40 50
01m2m3m
API
UI
●
●●●●●●●●●●●●●●●●●●●●●●●●
●
●●●●●●●●●●
●●●●
●
●
●●●●●●●●
●
●
●
●
●
●
●●●
●●●●●●●●●●●●●●●●●●●●●●
●●
●●
●●●●●
●
●
●
●
●●●●
●
●
● Sliding
● Sticky
MedianDrift(months)
7/23/13 Scott G. Ainsworth • Michael L. Nelson
38
Step Number
39. JointConferenceonDigitalLibraries(JCDL)2013
DRIFT BY STEP
SLIDING POLICY STICKY POLICY
Drift by Step (UI)
At least 1 memento
At least 8 mementos
At least 64 mementos
At least 512 mementos
At least 4,096 mementos
At least 32,768 mementos
Drift by Step (API)
Drift(Years)
1y2y3y4y5y6y7y8y9y10y
At least 1 memento
At least 8 mementos
At least 64 mementos
At least 512 mementos
At least 4,096 mementos
At least 32,768 mementos
Drift(years)
Step Number Step Number
7/23/13 Scott G. Ainsworth • Michael L. Nelson
39
43. JointConferenceonDigitalLibraries(JCDL)2013
FUTURE WORK
Integrate real-world walk patterns
• AlNoamany et al. – Internet Archive logs
• Domains users avoid – link farms, etc.
• Domain clusters
• Self referencing domains – 101celebrities.com
Check other archives
• Other archives now have Memento API
7/23/13 Scott G. Ainsworth • Michael L. Nelson
43
47. JointConferenceonDigitalLibraries(JCDL)2013
MEAN DRIFT BY STEP
7/23/13 Scott G. Ainsworth • Michael L. Nelson
47
Step Number
MeanDrift(months)
Mean Drift by Step
Step Number
MeanDrift(Months)
1 10 20 30 40 50
01m2m3m4m5m6m7m API
UI
●
●
●●● ●
●●●● ●●●● ●●
●
●
●
●
●
●●●
●
●●
●
●
●●
●
●●
●
●
● ●
●
●
●
●
● ●
● ●
● ●
●
●
●
●
●
●
●
●
●●●●
●●●
● ●●
●●
●●●
●
●●
●
●
● ●
●
●●
●●
●●
●
●
●● ●● ●●
●
● ●● ●●
●
● Sliding
● Sticky
● μ ○ σ
48. JointConferenceonDigitalLibraries(JCDL)2013
SLIDING TARGET
⟹ GET …/20050514013608/http://www.cs.odu.edu/ HTTP/1.1
⟸ HTTP/1.1 200 OKAY
⟹ GET …/20050514013608/http://sci.odu.edu/ HTTP/1.1
⟸ HTTP/1.1 302 FOUND
Location: …/20050522001752/http://sci.odu.edu/
⟹ GET …/20050522001752/http://sci.odu.edu/ HTTP/1.1
⟸ HTTP/1.1 200 OKAY
⟹ GET …/20050522001752/http://www.cs.odu.edu/ HTTP/1.1
⟸ HTTP/1.1 302 FOUND
Location: …/20050331091610/http://www.cs.odu.edu/
⟹ GET …/20050331091610/http://www.cs.odu.edu/ HTTP/1.1
⟸ HTTP/1.1 200 OKAY
7/23/13 Scott G. Ainsworth • Michael L. Nelson
48
49. JointConferenceonDigitalLibraries(JCDL)2013
SLIDING TARGET
⟹ GET …/20050514013608/http://www.cs.odu.edu/ HTTP/1.1
⟸ HTTP/1.1 200 OKAY
⟹ GET …/20050514013608/http://sci.odu.edu/ HTTP/1.1
⟸ HTTP/1.1 302 FOUND
Location: …/20050522001752/http://sci.odu.edu/
⟹ GET …/20050522001752/http://sci.odu.edu/ HTTP/1.1
⟸ HTTP/1.1 200 OKAY
⟹ GET …/20050522001752/http://www.cs.odu.edu/ HTTP/1.1
⟸ HTTP/1.1 302 FOUND
Location: …/20050331091610/http://www.cs.odu.edu/
⟹ GET …/20050331091610/http://www.cs.odu.edu/ HTTP/1.1
⟸ HTTP/1.1 200 OKAY
7/23/13 Scott G. Ainsworth • Michael L. Nelson
49
22 Days
44 Days
50. JointConferenceonDigitalLibraries(JCDL)2013
STICKY TARGET
⟹ GET <timegate>/http://www.cs.odu.edu/ HTTP/1.1
Accept-Datetime: Sat, 10 May 2005 11:21:00 GMT
⟸ HTTP/1.1 302 FOUND
Location: …/20050514013608/http://www.cs.odu.edu/
⟹ GET …/20050514013608/http://www.cs.odu.edu/ HTTP/1.1
⟸ HTTP/1.1 200 OKAY
⟹ GET <timegate>/http://sci.odu.edu/ HTTP/1.1
Accept-Datetime: Sat, 10 May 2005 11:21:00 GMT
⟸ HTTP/1.1 302 FOUND
Location: …/20050522001752/http://sci.odu.edu/
⟹ GET …/20050522001752/http://sci.odu.edu/ HTTP/1.1
⟸ HTTP/1.1 200 OKAY
⟹ GET <timegate>/http://www.cs.odu.edu/ HTTP/1.1
Accept-Datetime: Sat, 10 May 2005 11:21:00 GMT
⟸ HTTP/1.1 302 FOUND
Location: …/20050514013608/http://www.cs.odu.edu/
⟹ GET …/20050514013608/http://www.cs.odu.edu/ HTTP/1.1
⟸ HTTP/1.1 200 OKAY
7/23/13 Scott G. Ainsworth • Michael L. Nelson
50
51. JointConferenceonDigitalLibraries(JCDL)2013
STICKY TARGET (MEMENTO)
⟹ GET <timegate>/http://www.cs.odu.edu/ HTTP/1.1
Accept-Datetime: Sat, 10 May 2005 11:21:00 GMT
⟸ HTTP/1.1 302 FOUND
Location: …/20050514013608/http://www.cs.odu.edu/
⟹ GET …/20050514013608/http://www.cs.odu.edu/ HTTP/1.1
⟸ HTTP/1.1 200 OKAY
⟹ GET <timegate>/http://sci.odu.edu/ HTTP/1.1
Accept-Datetime: Sat, 10 May 2005 11:21:00 GMT
⟸ HTTP/1.1 302 FOUND
Location: …/20050522001752/http://sci.odu.edu/
⟹ GET …/20050522001752/http://sci.odu.edu/ HTTP/1.1
⟸ HTTP/1.1 200 OKAY
⟹ GET <timegate>/http://www.cs.odu.edu/ HTTP/1.1
Accept-Datetime: Sat, 10 May 2005 11:21:00 GMT
⟸ HTTP/1.1 302 FOUND
Location: …/20050514013608/http://www.cs.odu.edu/
⟹ GET …/20050514013608/http://www.cs.odu.edu/ HTTP/1.1
⟸ HTTP/1.1 200 OKAY
7/23/13 Scott G. Ainsworth • Michael L. Nelson
51
22 Days
0 Days
53. JointConferenceonDigitalLibraries(JCDL)2013
TWO TYPES OF DRIFT
Target Drift
• Drift introduced by changing the target datetime
• | received-datetime – original-datetime |
Memento Drift
• Drift introduced by not having the exact datetime
requested available.
• | received-datetime – requested-datetime |
7/23/13 Scott G. Ainsworth • Michael L. Nelson
53
Editor's Notes
Please forgive the long title. Let me explain it with a fable…
A student at ODU becomes curious about the history of the Computer Science Department and visits the Internet Archive’s Wayback Machine.
The student enters http://www.cs.odu.edu and is shown the available dates.The student navigates to2005 and selects 14 May @ 01:36:08.
The student review the Computer Science page.Finding the College of Scienceslink interesting link, the student clicks on it.
After reviewing the College of Sciences page, the student returns to the Computer Science page, and…
1. Whoa! That’s not what was expected!
What just happened.We expected the left side, but got the right side.This is a result of the applying the Sliding Target Policy.Highlight the temporal drift.
This is an example of the “Sliding Target Policy.”Here is how it works:We started on the May 14 page we selected.When The College of Sciences was clicked,May 14 was used as the target.
And, April 22 was nearest Memento (archived version).When The Computer Science was clicked,April 22 was used as the target.
And, March 31 was nearest Memento.
“What if the target datetime is held steady instead of being allowed to drift?”The Memento extension to HTTP enables this.
This is a very abbreviated introduction to the Memento API.The Memento API allows an HTTP client to negotiate a datetime.On request, the client add the Accept-Datetime header.On reply, the server sends the Memento-Datetime header, indicating the actual datetime of the memento returned.Memento-Datetime is generally the acquisition datetime of the archived copy.
Sticky target can be accomplished using the MementoFox extension to Firefox.MementoFox allows the datetime desired is entered and remain fixed.(CLICK)The nearest Memento is retrieved.(CLICK)In this case, the May 14 Computer Science page—same as we selected using the Wayback Machine UI.When the College of Sciences is clicked…(CLICK)
The April 22 page is shown again, because the target datetime is still 2005-05-14.So it is still the nearest.(CLICK)When Computer Science is clicked again…
May 15 is shown as expected.(PAUSE)
Here is a quick comparison:Review Sticky drift is 1/3 of Sliding
This leads to questions:How much temporal drift can be expected?How much improvement can Sticky provide (assuming it is the policy needed)?Does Sticky always produce less drift.
The rest of this presentation will take the following form:A brief discussion of related work and how this research improves our knowledge.Describe how we measured drift?A review of the results.A quick look at how this work can be refined.
The majority of work to date has focused on improving the quality of data acquisition.Spaniol et al. focused on strategy.Denev et a. looked at change rate by MIME type.Ben Saad et al. crawl metadata used to improve presentation to the user.Our focus is getting the best results from existing collectionsAfter all, we can’t go back and “fix” past data acquisition.
Let start with a few definitions.Walk length is the number of successful steps; step with HTTP 200 responses for both the timemap and memento.Choice is the sum of the number of unique links at each walk step.Unique domains is the number of domains seen during the walk. This is domains such as jcdl.org or amazon.com. Independent sites within domains were not segragated (e.g. wordpress.com is a single domain).Drift is the magnitude of the difference between the initial target datetime and Memento-Datetime.
Let us return to our fable starting with the selection of the first memento.The first step of the process is selecting a URI.
Next the URI’s timemap is downloaded.Timemaps are a computer-readable form the the calendar page.(CLICK)This is a partial timemap for www.cs.odu.edu.Once we have the timemap, a memento is randomly selected.(CLICK)This is the entry for ODU CS Home on May 14, 2005 02:48:46.
Next both mementos (Wayback Machine and Memento API) are downloaded.
And common links are determined.This completes the first iteration of the process.Let look at the statistics so far.
So far we have1 successful step1 unique domain (odu.edu)42 links (choice)And no drift. (But note that drift greater than 0 is not always the case on the first step.)
To start the next iteration, a link is randomly selected.
Subsequent iterations are similar to the first.The only difference is that since the target datetime could have drifted on the Wayback machine side, it is possible that two different mementos are selected.
From the College of Sciences, we go to the ODU home page.This adds a successful step,But does not add a new domain.It also adds 36 additional links.Note the missing image. This is quite common but does not change drift calculations.
This is an example of an acquisition-time redirect.
In this case, www.odusports.com redirected to odusports.collegesports.com, which is probably a service provider.
The ODU Sports page has a link to vtext.com, probably because Verizon was a sponsor.
Finally, clicking on “Get It Now” stops the walk with a 404.
Walks stop for many reasons.The main reasons are:(CLICK ON EACH)403: Access not allowed404: Not archived503: Not currently availableNot HTML (no links)No common links (divergent versions)
OccurrencesExponential scale.Very few walks make it pas mid-20s.Mean DriftShows that stick is 45-60 nearer on average(CLICK)Counter to intuition that drift decreases over timeAnd standard distribution is all over the place
The data is variable enough that median is the best measure of central tendency.The main point of this graph is that the Sticky policy reigns in drift andThe sliding policy allows it to continue to increase.Notes:The initial up curve is due to choosing a known Memento-Datetime.We suspect the drop starting at steps 42+ is due to large, self-referencing sites (101celebrities.com) and clusters of related sites.
Here is another look at the data.Again blue is the sliding policy and green sticky.Blacks and red are high density,Orange and red medium.Blues and greens low.An interesting note, even on the first step there is sometimes considerable drift.This happens when the archive redirects from one Memento-Datetime to another.Even though each of these graphs represents over 48K mementos, the sliding policy graph is more spread out because the drift is higher.But let’s focus on the highest density points, those with 64 or more Mementos.Here the increase drift is clearly visible in the increase height at nearly every step.
Next is drift by choice.Choice, on the horizontal scale, is exponential.Choice is the total choice per walk, so the data clusters at the lower number because there are more shorter walks.The key here is that drift does increase with choice, but not by much.
Number of domains on the other hand, has a dramatic effect on drift.Here, the horizontal access is the number of domains in a walk.The vertical access is the mean drift across all the walks with the same number of domains.Like walk length, the stick policy controls drift andThe sliding policy allows it to increase.
OccurrencesExponential scale.Very few walks make it pas mid-20s.Mean DriftShows that stick is 45-60 nearer on average(CLICK)Counter to intuition that drift decreases over timeAnd standard distribution is all over the place