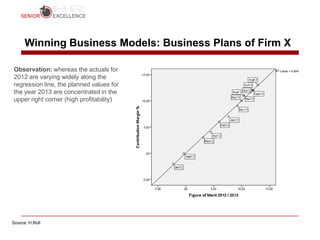
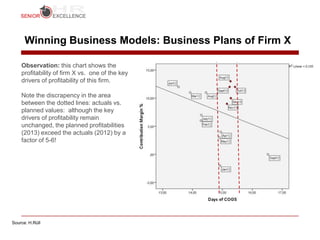
Winning Business Models: Evaluating Business
    Plans

    •       Further, we can use our approach to evaluate the consistency of
            business plans on the corporate level and/or on the divisional level
    •       We analyze a firm‘s past performance and identify the key drivers of
            performance/success
    •       We then take these drivers and study how well they are correlating with
            the performance of the group for the planning periods ahead
    •       Example: Firm X


Source: H.Rüll                     © Dr. Hartwig Ruell – Senior Excellence            1
Winning Business Models: Business Plans of Firm X

Observation: whereas the actuals for
2012 are varying widely along the
regression line, the planned values for
the year 2013 are concentrated in the
upper right corner (high profitability)


Source: H.Rüll
Winning Business Models: Business Plans of Firm X

    Observation: this chart shows the
    profitability of firm X vs. one of the key
    drivers of profitability of this firm.

    Note the discrapency in the area
    between the dotted lines: actuals vs.
    planned values: although the key
    drivers of profitability remain
    unchanged, the planned profitabilities
    (2013) exceed the actuals (2012) by a
    factor of 5-6!


Source: H.Rüll

Evaluating business plans

  • 1.
    Winning Business Models:Evaluating Business Plans • Further, we can use our approach to evaluate the consistency of business plans on the corporate level and/or on the divisional level • We analyze a firm‘s past performance and identify the key drivers of performance/success • We then take these drivers and study how well they are correlating with the performance of the group for the planning periods ahead • Example: Firm X Source: H.Rüll © Dr. Hartwig Ruell – Senior Excellence 1
  • 2.
    Winning Business Models:Business Plans of Firm X Observation: whereas the actuals for 2012 are varying widely along the regression line, the planned values for the year 2013 are concentrated in the upper right corner (high profitability) Source: H.Rüll
  • 3.
    Winning Business Models:Business Plans of Firm X Observation: this chart shows the profitability of firm X vs. one of the key drivers of profitability of this firm. Note the discrapency in the area between the dotted lines: actuals vs. planned values: although the key drivers of profitability remain unchanged, the planned profitabilities (2013) exceed the actuals (2012) by a factor of 5-6! Source: H.Rüll