The document summarizes the history and development of European integration from 1952 to present day, including:
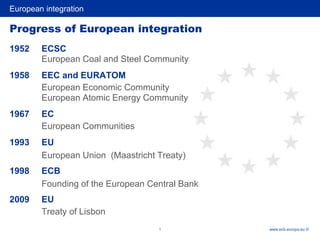
1) The establishment of early European institutions like the ECSC and EEC in the 1950s and 1960s and their evolution into the EU in 1993.
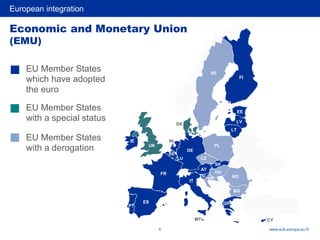
2) Several rounds of enlargement of the EU from 1973 to 2013 which increased membership from 6 original countries to 28 today.
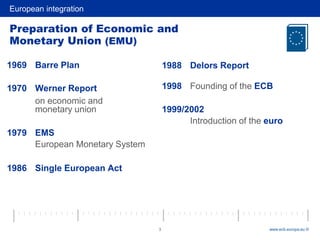
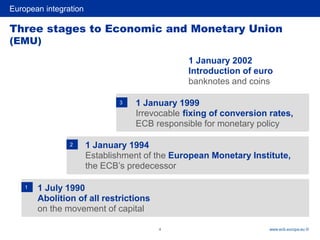
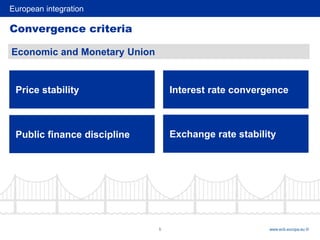
3) Key steps towards greater economic and monetary integration including the Werner Report, EMS, Single European Act, and Delors Report leading to the establishment of the ECB and adoption of the Euro.
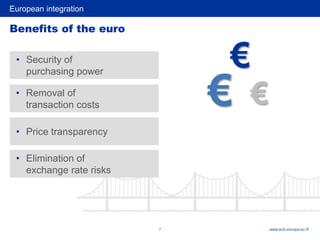
4) Benefits of Eurozone integration and unified currency include reduced transaction costs, security of purchasing power, elimination of