Download to read offline
![Available online at www.sciencedirect.com
Biomass and Bioenergy 26 (2004) 301 – 304
Short communication
Ethanol learning curve—the Brazilian experience
Josà Goldemberga , Suani Teixeira Coelhob , Plinio Mà rio Nastaric , Oswaldo Lucond;∗
e a
a SMA-TheS˜ o Paulo State Environmental Secretariat, Cabinet. Av. Prof. Frederico Hermann Jr 345,
a
SÃ o Paulo SP 05489090, Brazil
a
b CENBIO, the Brazilian National Center on Biomass, University of SÃ o Paulo, Av. Prof Luciano Gualberto 1289,
a
SÃ o Paulo 05508 010, Brazil
a
c DATAGRO, Calcada das Magnà lias 56 Alphaville, Barueri, SP 06453-000, Brazil
o
d SMA, CETESB Sao Paulo State Environmental Secretariat, Av. Prof. Frederico Hermann Jr 345, S˜ o Paulo 054 59 900, Brazil
a
Received 7 April 2003; received in revised form 9 May 2003; accepted 14 May 2003
Abstract
Economic competitiveness is a very frequent argument against renewable energy (RE). This paper demonstrates, through
the Brazilian experience with ethanol, that economies of scale and technological advances lead to increased competitiveness
of this renewable alternative, reducing the gap with conventional fossil fuels.
? 2003 Elsevier Ltd. All rights reserved.
Keywords: Ethanol; Learning curve; Brazil
The discussions at the Johannesburg 2002 World they cost more at present. A mandatory target on RE
Summit made clear that policies for renewable energy acts on the demand side of large markets in developed
(RE) are essential to achieve sustainable development countries, lowering costs through the “learning curve
in a broad sense. Environmental protection, job cre- e ect”. This approach is complementary to Type II
ation, alleviation of external debts in developing coun- Initiatives proposed at Johannesburg: partnerships that
tries, and security of supply are some of the key issues will create the grassroots for the RE movement.
to mention. For many products and services, unit costs decrease
A very common argument against RE is their eco- with increasing experience. This e ect is often referred
nomic competitiveness against mainly fossil fuels. The to as learning by doing, progress curve, experience
answer to this argument is exactly the objective of the curve or learning curve [2–4]. McDonald and Schrat-
Brazilian Energy Initiative (BEI), which proposed a tenholzer [5] provide a good overview on the subject,
minimum global target of 10% of energy from renew- stressing that for most products and services it is not
able sources, with the possibility of trading RE cer- the passage of time that leads to cost reductions, but
tiÿcates amongst countries [1]. The initiative aims at the accumulation of experience. Leaving a technol-
pushing governments to introduce renewables, even if ogy on the shelf, unlike a ÿne wine, will not make it
better. Interruptions in production and use can cause
∗ Corresponding author. Tel.: +55 11 3030 6159; fax: +55 11 a “forgetting by not doing” e ect. The learning curve
3030 6142. represents graphically how market experience reduces
E-mail address: oswaldol@cetesb.sp.gov.br (O. Lucon). prices for various energy technologies and how these
0961-9534/$ - see front matter ? 2003 Elsevier Ltd. All rights reserved.
doi:10.1016/S0961-9534(03)00125-9](https://image.slidesharecdn.com/ethanollearningcurvethebrazilianexperience-130124120810-phpapp01/85/Ethanol-learning-curve-the-brazilian-experience-1-320.jpg)
![Available online at www.sciencedirect.com
Biomass and Bioenergy 26 (2004) 301 – 304
Short communication
Ethanol learning curve—the Brazilian experience
Josà Goldemberga , Suani Teixeira Coelhob , Plinio Mà rio Nastaric , Oswaldo Lucond;∗
e a
a SMA-TheS˜ o Paulo State Environmental Secretariat, Cabinet. Av. Prof. Frederico Hermann Jr 345,
a
SÃ o Paulo SP 05489090, Brazil
a
b CENBIO, the Brazilian National Center on Biomass, University of SÃ o Paulo, Av. Prof Luciano Gualberto 1289,
a
SÃ o Paulo 05508 010, Brazil
a
c DATAGRO, Calcada das Magnà lias 56 Alphaville, Barueri, SP 06453-000, Brazil
o
d SMA, CETESB Sao Paulo State Environmental Secretariat, Av. Prof. Frederico Hermann Jr 345, S˜ o Paulo 054 59 900, Brazil
a
Received 7 April 2003; received in revised form 9 May 2003; accepted 14 May 2003
Abstract
Economic competitiveness is a very frequent argument against renewable energy (RE). This paper demonstrates, through
the Brazilian experience with ethanol, that economies of scale and technological advances lead to increased competitiveness
of this renewable alternative, reducing the gap with conventional fossil fuels.
? 2003 Elsevier Ltd. All rights reserved.
Keywords: Ethanol; Learning curve; Brazil
The discussions at the Johannesburg 2002 World they cost more at present. A mandatory target on RE
Summit made clear that policies for renewable energy acts on the demand side of large markets in developed
(RE) are essential to achieve sustainable development countries, lowering costs through the “learning curve
in a broad sense. Environmental protection, job cre- e ect”. This approach is complementary to Type II
ation, alleviation of external debts in developing coun- Initiatives proposed at Johannesburg: partnerships that
tries, and security of supply are some of the key issues will create the grassroots for the RE movement.
to mention. For many products and services, unit costs decrease
A very common argument against RE is their eco- with increasing experience. This e ect is often referred
nomic competitiveness against mainly fossil fuels. The to as learning by doing, progress curve, experience
answer to this argument is exactly the objective of the curve or learning curve [2–4]. McDonald and Schrat-
Brazilian Energy Initiative (BEI), which proposed a tenholzer [5] provide a good overview on the subject,
minimum global target of 10% of energy from renew- stressing that for most products and services it is not
able sources, with the possibility of trading RE cer- the passage of time that leads to cost reductions, but
tiÿcates amongst countries [1]. The initiative aims at the accumulation of experience. Leaving a technol-
pushing governments to introduce renewables, even if ogy on the shelf, unlike a ÿne wine, will not make it
better. Interruptions in production and use can cause
∗ Corresponding author. Tel.: +55 11 3030 6159; fax: +55 11 a “forgetting by not doing” e ect. The learning curve
3030 6142. represents graphically how market experience reduces
E-mail address: oswaldol@cetesb.sp.gov.br (O. Lucon). prices for various energy technologies and how these
0961-9534/$ - see front matter ? 2003 Elsevier Ltd. All rights reserved.
doi:10.1016/S0961-9534(03)00125-9](https://image.slidesharecdn.com/ethanollearningcurvethebrazilianexperience-130124120810-phpapp01/75/Ethanol-learning-curve-the-brazilian-experience-1-2048.jpg)
![302 J. Goldemberg et al. / Biomass and Bioenergy 26 (2004) 301 – 304
reductions in uence the dynamic competition among 1.000
technologies. It is a long-range strategic rather than
a short-term tactical concept [6]. 1985
Learning curves are empirical, with several bench- 1980
1985-2002
marks throughout the world. One of the most impor- 1980-1985 PR = 71%
US$(Oct.2002) /m3
PR =93%
tant examples—if not the most important—is the one 1990 2002
provided by Brazilian Alcohol Program (PROAL- 100
COOL), established in 1975 with the purpose of 1999
reducing oil imports by producing ethanol from sug-
arcane. The program has positive environmental, eco-
nomic and social aspects, and has become the most
important biomass energy program in the world [7].
In 1975, 91 Mt of sugarcane was produced, yielding
6 Mt of sugar and 555 km3 of ethyl alcohol (ethanol).
10
1000 10000 100000 1000000
In 2002, sugarcane production reached 320 Mt, yield-
Ethanol Cumulative Production (thousand m3)
ing 22:3 Mt of sugar and 12:6 Mm3 of ethanol. In
2002, the total land area covered by sugarcane planta- Fig. 1. Ethanol learning curve: prices, trends and progress ratios.
tions in Brazil was approximately 4:9 Mha (60% in the
State of S˜ o Paulo). The average productivity of sug-
a
arcane crops in Brazil is 65 t ha−1 , but in SÃ o Paulo
a public prices, inclusive of fuels. Due to this factor,
State there are mills with yields of up to 100 t ha−1 . together with economies of scale, the price fell much
In Brazil, ethanol is used in one of two ways: as an more rapidly, as shown in Fig. 1. Prices paid to pro-
octane enhancer and oxygenated additive to gasoline, ducers (made in terms of the internal currency, Real)
blended in the proportion of 20 –26% in volume of are proxies for costs. However, in the medium and
anhydrous ethanol (99.6 Gay-Lussac (GL) and 0.4% long term, the high competition in the ethanol activ-
water) to gasoline, a mixture called gasohol or in ity has caused the prices to move towards production
neat-ethanol engines, in the form of hydrated ethanol costs.
with 95:5 GL. The Progress ratio of the technology is the variation
Since the creation of PROALCOOL in 1997, prices of prices according to the cumulative sales. The lower
received by ethanol producers were determined by the the progress ratio, the more the drop in prices. Thus,
federal government, as were the prices of fuels in gen- an e cient technology penetration is one that has
eral. In May 1997, the price of anhydrated ethanol was achieved low PRs. In US dollars, sugarcane ethanol
liberalized, and the same occurred with the price of produced in Brazil has shown progress ratios of 93%
hydrated ethanol in February 1999. (1980 –1985) and 71% (1985 –2002). For compari-
Ethanol production costs were close to 100 US dol- son, there are European ÿgures [8] calculated for wind
lars a barrel in the initial stages of the Program in 1980. (PR=99% between 1981–1985 and PR=88% in 1985
Until 1985, as production increased, prices paid to pro- –2000), solar photovoltaics (PR= 77% in 1981–2000)
ducers re ected average costs of production, which and combined cycle gas turbines (PR=104%, i.e. cost
were surveyed by a government mandate through the increases between 1981–1989 and PR=81% in the
Getà lio Vargas Foundation. During this initial phase,
u 1985 –2002 period). Fig. 2 shows the price paid to
prices fell slowly re ecting the gains in agroindustrial alcohol producers compared to Rotterdam gasoline
yield and economies of scale captured by producers, prices. For an easier comprehension of the end-use
and transferred to consumers through the pricing reg- utility, prices were converted to US$ per GJ of each
ulation scheme. After 1985, however, prices were set fuel, assuming the low heating value of each.
at levels below the average costs of production, while In the early stages of the alcohol program, ethanol
the federal government tried to curb in ation by con- use became viable to consumers due to the pricing
trolling the average costs of production, while the fed- policy applied to fuels in Brazil. As the e ciency and
eral government tried to curb in ation by controlling cost competitiveness of ethanol production evolved](https://image.slidesharecdn.com/ethanollearningcurvethebrazilianexperience-130124120810-phpapp01/85/Ethanol-learning-curve-the-brazilian-experience-2-320.jpg)
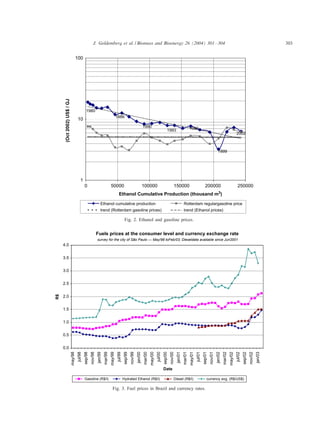
![304 J. Goldemberg et al. / Biomass and Bioenergy 26 (2004) 301 – 304
over time, and fuel prices were liberalized, this sup- References
port was no longer needed and was not applied. Of
great signiÿcance is the fact that the total amount of [1] Goldemberg J. The Brazilian energy initiative. Presented
investments in the agricultural and industrial sectors at the Johannesburg World Summit on Sustainable
Development; 2002.
for the production of ethanol for automotive use in the [2] Dutton JM, Thomas A. Treating progress function as a
period 1975 –1989 reached a total of US$4.92 billion managerial opportunity. Academy of Management Review
(US$ of 2001) directly invested in the program. On 1984;9:235.
the other hand, savings with foregone imports evalu- [3] Argote L, Epple D. Learning curves in manufacturing. Science
ated at international prices, have amounted to US$52.1 1990;247:920–4.
[4] Argote L. Organizational learning: creating, retaining and
billion (Jan 2003 US$) from 1975 to 2002 [9,10]. transferring knowledge. Dordrecht, Netherlands: Kluwer;
Presently, there are no subsidies for anhydrous or 1999.
hydrated ethanol production. Hydrated ethanol is sold [5] McDonald A, Schrattenholzer L. Learning rates for energy
for 60 –70% of the price of gasohol at the pump sta- technologies. Energy Policy 2001;29(4):255–61.
tion, due to signiÿcant reductions in production costs. [6] International Energy Agency—IEA. Experience curves for
energy technology policy. Organisation for Economic
These results show the economic competitiveness of Co-operation and Development, Paris: 2000.
ethanol when compared to gasoline. Considering the [7] Goldemberg J, Moreira JR. The alcohol program. Energy
higher consumption rates of neat-ethanol cars, the con- Policy 1999;27(4):229–45.
sumer is indi erent between hydrated ethanol for a [8] Goldemberg J, Coelho ST, Lucon O. How adequate policies
price at the station of up to 80.67% of that from gaso- can push renewables. Energy Policy, 22 February 2003,
doi:10.1016/S0301-4215(03)00077-6, in press.
hol. Fig. 3 shows a comparison for the main trans- [9] Datagro. Costs of fuels and cumulative sales in Brazil and
portation fuels used in Brazil in terms of the price paid Rotterdam. S˜ o Paulo: Datagro; 2003.
a
in local currency (Real) and the exchange rates to the [10] Nastari PM. Poupanca de divisas com o uso do alcool Ã
North American dollar. It demonstrates the long-term combustÃvel no Brasil (Savings by the use of ethanol fuel in
competitiveness of the ethanol fuel. Brazil). S˜ o Paulo: Informativo Datagro; January 2003.
a](https://image.slidesharecdn.com/ethanollearningcurvethebrazilianexperience-130124120810-phpapp01/85/Ethanol-learning-curve-the-brazilian-experience-4-320.jpg)

This document summarizes the learning curve experienced by Brazil's ethanol industry from 1975 to 2002. It found that ethanol production costs in Brazil fell from around $100 per barrel in 1980 to being competitive with gasoline prices by 2002 due to large increases in scale and technological improvements. The progress ratio, which measures the reduction in price with increased production, was 93% from 1980-1985 and 71% from 1985-2002. By 2002, ethanol in Brazil was produced at a large, competitive scale and no longer required subsidies to be cost-competitive with gasoline.


