التعليم في عصر الذكاء الاصطناعي مواطن التحدي ومناهل الفرص _.pdf
Estimating+the+median
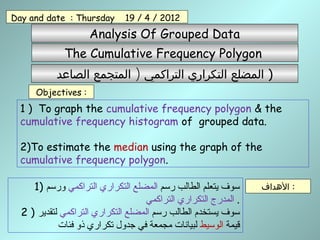
1. Analysis Of Grouped Data
)الصاعد المتجمع التراكمي التكراري المضلع )
Objectives :
1) رسم الطالب يتعلم سوفالتراكمي التكراري المضلعورسم
التراكمي التكراري المدرج .
2 ) رسم الطالب يستخدم سوفالتراكمي التكراري المضلعلتقدير
قيمةالوسيطفئات ذو تكراري جدول في مجمعة لبيانات
الهداف :
1 ) To graph the cumulative frequency polygon & the
cumulative frequency histogram of grouped data.
2)To estimate the median using the graph of the
cumulative frequency polygon.
Day and date : Thursday 19 / 4 / 2012
The Cumulative Frequency Polygon
2. )الصاعد المتجمع التراكمي التكراري المضلع )
Startar Activity : البداية نشاط :
Find the median of the following set of data :
التالية القيم لمجموعة الوسيط اوجد :
7 , 9 , 5 , 7 , 8 , 4 , 6
Day and date : Thursday 19 / 4 / 2012
The Cumulative Frequency Polygon
4 , 5 , 6 , 7 , 7 , 8 , 9
Median = 7
Find the median of the following set of data :
التالية القيم لمجموعة الوسيط اوجد :
7 , 9 , 5 , 7 , 8 , 4 , 6 , 54 , 5 , 5 , 6 , 7 , 7 , 8 , 9
Median = ( 6 + 7 ) ÷ 2
= 13 ÷ 2 = 6.5
3. Example.
the weights of a random sample of 36 students are shown in the
table below. من عشوائية عينة اوزان36ادناه بالجدول موضحة طالب
Graph the cumulative frequency polygon then Estimate the median of these
weights. الوسيط قيمة قدر ثم التراكمي التكراري المضلع .ارسم
370 -
660 -
850 -
940 -
730 -
320 -
frequencyMass ( kg )
Day and date : Thursday 19 / 4 / 2012
Analysis Of Grouped Data
4. Estimating the median
الوسيط تقدير
Class f c. f
20 – 3
30 – 7
40 – 9
50– 8
60 – 6
70 – 3
Total
•
•
•
•
•
•
∴ median ≈
49
Σ f = 36
3
10
19
27
33
36
Σ f
2
36
2
18= =
Intervals
C.F.
20
18
30 40 50 60 70 80
3
6
9
12
15
21
24
27
30
33
36
⇝
Thecumulativefrequencypolygon
التراكميالتكراريالمضلع
•
5. Cumulative Frequency polygon &
Cumulative frequency histogram.
Class f c. f
20 – 3
30 – 7
40 – 9
50– 8
60 – 6
70 – 3
Total
•
•
•
•
•
•
20 30 40 50 60 70 80
3
6
9
12
15
18
21
24
27
30
33
36
Σ f = 36
3
10
19
27
33
36
•
Intervals
C.F.
⇝
التراكمي التكراري المضلع
التراكمي التكراري والمدرج
6. The grades of 25 students are given in the table below :
Intervals
الفئات
( f ) ( c f )
40 – 49 3
50 – 59 4
60 – 69 5
70 – 79 7
80 – 89 4
90 – 99 2
total
درجات25طالبيلي كما :
worksheet
Mohamad badawi
hamadaa_math@yahoo.com
Mohamad badawi
hamadaa_math@yahoo.com
1) التراكمي التكراري المضلع ارسم
2) الوسيط قيمة لتقدر الرسم استخدم
1) Draw the cumulative frequency polygon
2) Use the graph to estimate the median
40 50 60 70 80 90 100
Intervals
5
10
15
20
25
C.F
⇝
7. The grades of 25 students are given in the table below :
Intervals
الفئات
F C . C F × C.C
40 – 49 3
50 – 59 4
60 – 69 5
70 – 79 7
80 – 89 4
90 – 99 2
total
درجات25طالبيلي كما :
Revision worksheet
Mohamad badawi
hamadaa_math@yahoo.com
Mohamad badawi
hamadaa_math@yahoo.com
1) الجدول اكمل
2) لهذه الحسابي المتوسط اوجد
الدرجات
1) Complete the table.
2) Find the mean of these grades.
Σ f =
Σ f × c.c =
3) Find the modal class and estimate
the mode.
4) Find the range of the grades.
3) قيمة وقدر المنوالية الفئة اوجد
المنوال
4) الدرجات لهذه المدى .اوجد
8. The grades of 25 students are given in the table below :
Intervals
الفئات
( f ) ( c f )
40 – 49 3 3
50 – 59 4 7
60 – 69 5
70 – 79 7
80 – 89 4 23
90 – 99 2
total
درجات25طالبيلي كما :
worksheet
Mohamad badawi
hamadaa_math@yahoo.com
Mohamad badawi
hamadaa_math@yahoo.com
1) التراكمي التكراري المضلع ارسم
2) الوسيط قيمة لتقدر الرسم استخدم
1) Draw the cumulative frequency polygon
2) Use the graph to estimate the median
40 50 60 70 80 90 100
Intervals
5
10
15
20
25
C.F
•
•
•
9. The grades of 25 students are given in the table below :
Intervals
الفئات
F C . C F × C.C
40 – 49 3 44.5
50 – 59 4 218
60 – 69 5 322.5
70 – 79 7 74.5
80 – 89 4
90 – 99 2
total
درجات25طالبيلي كما :
Revision worksheet
Mohamad badawi
hamadaa_math@yahoo.com
Mohamad badawi
hamadaa_math@yahoo.com
1) الجدول اكمل
2) لهذه الحسابي المتوسط اوجد
الدرجات
1) Complete the table.
2) Find the mean of these grades.
Σ f =
Σ f × c.c =
3) Find the modal class and estimate
the mode.
4) Find the range of the grades.
3) قيمة وقدر المنوالية الفئة اوجد
المنوال
3) الدرجات لهذه المدى .اوجد
Σ f × c.c
Σ f
=Mean =
10. The grades of 25 students are given in the table below :
Intervals
الفئات
F C . C F × C.C
40 – 49 3 44.5
50 – 59 4 218
60 – 69 5 322.5
70 – 79 7 74.5
80 – 89 4
90 – 99 2
total
درجات25طالبيلي كما :
Revision worksheet
Mohamad badawi
hamadaa_math@yahoo.com
Mohamad badawi
hamadaa_math@yahoo.com
1) الجدول اكمل
2) لهذه الحسابي المتوسط اوجد
الدرجات
1) Complete the table.
2) Find the mean of these grades.
Σ f =
Σ f × c.c =
3) Find the modal class and estimate
the mode.
4) Find the range of the grades.
3) قيمة وقدر المنوالية الفئة اوجد
المنوال
3) الدرجات لهذه المدى .اوجد
Σ f × c.c
Σ f
=Mean =