Download to read offline
![Astronomy & Astrophysics manuscript no. D2˙v5 c ESO 2011
September 6, 2011
Three Galactic globular cluster candidates found in the VVV
survey⋆
C. Moni Bidin1 , F. Mauro1 , D. Geisler1 , D. Minniti2 , M. Catelan2 , M. Hempel2 , E. Valenti3 , A. A. R. Valcarce2,5 , J.
Alonso-Garc´a2 , J. Borissova6 , G. Carraro4 , P. Lucas7 , A.-N. Chen´ 1,6 , M. Zoccali2 , and R. G. Kurtev6
ı e
1
Departamento de Astronom´a, Universidad de Concepci´ n, Casilla 160-C, Concepci´ n, Chile
ı o o
2
Departamento de Astronom´a y Astrof´sica, Pontificia Universidad Cat´ lica de Chile, Casilla 306, Santiago, Chile
ı ı o
3
European Southern Observatory, Karl Schwarzschild-Straße 2, D-85748 Garching bei M¨ nchen, Germany.
u
4
European Southern Observatory, Avda Alonso de Cordova, 3107, Casilla 19001, Santiago, Chile
5
Departamento de F´sica, Universidade Federal do Rio Grande do Norte, 59072-970 Natal, RN, Brazil
ı
6
Departamento de F´sica y Astronom´a, Facultad de Ciencias, Universidad de Valpara´so, Av. Gran Breta˜ a 1111, Valpara´so, Chile
ı ı ı n ı
7
Centre for Astrophysics Research, Science and Technology Research Institute, University of Hertfordshire, Hatfield AL10 9AB,
UK
Received / Accepted
ABSTRACT
Context. The census of Galactic globular clusters (GCs) is still incomplete, and about ten new objects are supposed to await discovery,
hidden behind the crowded and reddened regions of the Galactic bulge and disk.
Aims. We investigated the nature of three new GC candidates, discovered in the frames collected by the Vista Variables in the Via
Lactea (VVV) near-infrared survey. They will be called VVV CL002, VVV CL003, and VVV CL004.
Methods. We studied the results of PSF near-infrared photometry from VVV data for the three objects and their surrounding fields,
the proper motion information available in the literature and, when possible, we derived the cluster parameters by means of calibrated
indices measured on the color-magnitude diagrams.
Results. The evidence demonstrates that VVV CL002 is a newly discovered, small, moderately metal-rich ([Fe/H] ≈ −0.4) Galactic
GC. It is located at a Galactocentric distance of 0.7±0.9 kpc, and it could be one of the nearest GC to the Galactic center. Its character-
istics are more similar to those of low-mass, Palomar-like GCs than of more classical, old, and massive bulge GCs. VVV CL003 is the
first star cluster discovered in the Galactic disk on the opposite side of the center with respect to the Sun, at a Galactocentric distance
of ∼5 kpc. Its high metallicity ([Fe/H] ≈ −0.1) and location point to an open cluster, but a GC cannot be excluded. VVV CL004,
on the contrary, is most probably only a random clump of field stars, as indicated by both its low statistical significance and by the
impossibility to distinguish its stars from the surrounding field population.
Conclusions. We claim the detection of i) a new Galactic GC, deriving an estimate of its basic parameters; ii) a stellar aggregate,
probably an open cluster, in the disk directly beyond the Galactic center; and iii) an overdensity of stars, most probably an asterism.
Key words. Galaxy: bulge – globular clusters: general – globular clusters: individual: (VVV CL002, VVV CL003, VVV CL004) –
Surveys
1. Introduction et al. 2011), and Mercer 5 (Longmore et al. 2011). The family of
Galactic GCs is thus steadily increasing, although the true nature
The census of Galactic globular clusters (GCs) is still incom- of the GC candidates is not always easy to unveil, and some ob-
plete, because distant objects can easily hide behind the very jects are still debated (see, for example, Froebrich et al. 2008b).
crowded and highly reddened stellar fields in the direction of the
Galactic bulge and disk. Indeed, Ivanov et al. (2005) estimated GCs are old objects, whose age ranges from about half to
that there should be 10±3 undiscovered GCs hiding in the inner nearly one Hubble time. Their spatial distribution, and their
Milky Way. The advent of the new generation of extensive sur- physical/chemical properties, thus bear information about the
veys such as SDSS (Abazajian et al. 2009), 2MASS (Skrutskie Galactic formation and evolution processes. However, they con-
et al. 2006), and GLIMPSE (Benjamin et al. 2003) permitted tinuously loose mass along their entire lifetime, because of both
the detection of several new Galactic GCs. The December 2010 external processes such as Galactic tidal stress, and internal ones
compilation of the Harris (1996) catalog included seven new such as stellar evaporation (Meylan & Heggie 1997; Gnedin &
GCs not present in the February 2003 version, but seven more Ostriker 1997). The identification and the study of low-mass
objects have been proposed in the last years: SDSSJ1257+3419 GCs in the Galactic bulge can therefore provide new informa-
(Sakamoto & Hasegawa 2006), FSR 584 (Bica et al. 2007), tion about both its formation and chemical enrichment history,
FSR 1767 (Bonatto et al. 2007), FSR 190 (Froebrich et al. and the tidal forces governing its dense environment.
2008a), Pfleiderer 2 (Ortolani et al. 2009), VVV CL001 (Minniti In this paper, we analyze three new cluster candidates dis-
covered in the VISTA Variables in the Via Lactea (VVV) Public
⋆
Based on observations gathered with ESO-VISTA telescope (pro- Survey, which is gathering near-IR data of the Galactic bulge and
posal ID 172.B-2002). inner disk (Minniti et al. 2010; Saito et al. 2010; Catelan et al.
Correspondence to: cmbidin@astro-udec.cl 2011). This survey is scanning the central regions of the Milky](https://image.slidesharecdn.com/eso1141b-111021223422-phpapp02/85/Eso1141b-1-320.jpg)
![Astronomy & Astrophysics manuscript no. D2˙v5 c ESO 2011
September 6, 2011
Three Galactic globular cluster candidates found in the VVV
survey⋆
C. Moni Bidin1 , F. Mauro1 , D. Geisler1 , D. Minniti2 , M. Catelan2 , M. Hempel2 , E. Valenti3 , A. A. R. Valcarce2,5 , J.
Alonso-Garc´a2 , J. Borissova6 , G. Carraro4 , P. Lucas7 , A.-N. Chen´ 1,6 , M. Zoccali2 , and R. G. Kurtev6
ı e
1
Departamento de Astronom´a, Universidad de Concepci´ n, Casilla 160-C, Concepci´ n, Chile
ı o o
2
Departamento de Astronom´a y Astrof´sica, Pontificia Universidad Cat´ lica de Chile, Casilla 306, Santiago, Chile
ı ı o
3
European Southern Observatory, Karl Schwarzschild-Straße 2, D-85748 Garching bei M¨ nchen, Germany.
u
4
European Southern Observatory, Avda Alonso de Cordova, 3107, Casilla 19001, Santiago, Chile
5
Departamento de F´sica, Universidade Federal do Rio Grande do Norte, 59072-970 Natal, RN, Brazil
ı
6
Departamento de F´sica y Astronom´a, Facultad de Ciencias, Universidad de Valpara´so, Av. Gran Breta˜ a 1111, Valpara´so, Chile
ı ı ı n ı
7
Centre for Astrophysics Research, Science and Technology Research Institute, University of Hertfordshire, Hatfield AL10 9AB,
UK
Received / Accepted
ABSTRACT
Context. The census of Galactic globular clusters (GCs) is still incomplete, and about ten new objects are supposed to await discovery,
hidden behind the crowded and reddened regions of the Galactic bulge and disk.
Aims. We investigated the nature of three new GC candidates, discovered in the frames collected by the Vista Variables in the Via
Lactea (VVV) near-infrared survey. They will be called VVV CL002, VVV CL003, and VVV CL004.
Methods. We studied the results of PSF near-infrared photometry from VVV data for the three objects and their surrounding fields,
the proper motion information available in the literature and, when possible, we derived the cluster parameters by means of calibrated
indices measured on the color-magnitude diagrams.
Results. The evidence demonstrates that VVV CL002 is a newly discovered, small, moderately metal-rich ([Fe/H] ≈ −0.4) Galactic
GC. It is located at a Galactocentric distance of 0.7±0.9 kpc, and it could be one of the nearest GC to the Galactic center. Its character-
istics are more similar to those of low-mass, Palomar-like GCs than of more classical, old, and massive bulge GCs. VVV CL003 is the
first star cluster discovered in the Galactic disk on the opposite side of the center with respect to the Sun, at a Galactocentric distance
of ∼5 kpc. Its high metallicity ([Fe/H] ≈ −0.1) and location point to an open cluster, but a GC cannot be excluded. VVV CL004,
on the contrary, is most probably only a random clump of field stars, as indicated by both its low statistical significance and by the
impossibility to distinguish its stars from the surrounding field population.
Conclusions. We claim the detection of i) a new Galactic GC, deriving an estimate of its basic parameters; ii) a stellar aggregate,
probably an open cluster, in the disk directly beyond the Galactic center; and iii) an overdensity of stars, most probably an asterism.
Key words. Galaxy: bulge – globular clusters: general – globular clusters: individual: (VVV CL002, VVV CL003, VVV CL004) –
Surveys
1. Introduction et al. 2011), and Mercer 5 (Longmore et al. 2011). The family of
Galactic GCs is thus steadily increasing, although the true nature
The census of Galactic globular clusters (GCs) is still incom- of the GC candidates is not always easy to unveil, and some ob-
plete, because distant objects can easily hide behind the very jects are still debated (see, for example, Froebrich et al. 2008b).
crowded and highly reddened stellar fields in the direction of the
Galactic bulge and disk. Indeed, Ivanov et al. (2005) estimated GCs are old objects, whose age ranges from about half to
that there should be 10±3 undiscovered GCs hiding in the inner nearly one Hubble time. Their spatial distribution, and their
Milky Way. The advent of the new generation of extensive sur- physical/chemical properties, thus bear information about the
veys such as SDSS (Abazajian et al. 2009), 2MASS (Skrutskie Galactic formation and evolution processes. However, they con-
et al. 2006), and GLIMPSE (Benjamin et al. 2003) permitted tinuously loose mass along their entire lifetime, because of both
the detection of several new Galactic GCs. The December 2010 external processes such as Galactic tidal stress, and internal ones
compilation of the Harris (1996) catalog included seven new such as stellar evaporation (Meylan & Heggie 1997; Gnedin &
GCs not present in the February 2003 version, but seven more Ostriker 1997). The identification and the study of low-mass
objects have been proposed in the last years: SDSSJ1257+3419 GCs in the Galactic bulge can therefore provide new informa-
(Sakamoto & Hasegawa 2006), FSR 584 (Bica et al. 2007), tion about both its formation and chemical enrichment history,
FSR 1767 (Bonatto et al. 2007), FSR 190 (Froebrich et al. and the tidal forces governing its dense environment.
2008a), Pfleiderer 2 (Ortolani et al. 2009), VVV CL001 (Minniti In this paper, we analyze three new cluster candidates dis-
covered in the VISTA Variables in the Via Lactea (VVV) Public
⋆
Based on observations gathered with ESO-VISTA telescope (pro- Survey, which is gathering near-IR data of the Galactic bulge and
posal ID 172.B-2002). inner disk (Minniti et al. 2010; Saito et al. 2010; Catelan et al.
Correspondence to: cmbidin@astro-udec.cl 2011). This survey is scanning the central regions of the Milky](https://image.slidesharecdn.com/eso1141b-111021223422-phpapp02/75/Eso1141b-1-2048.jpg)
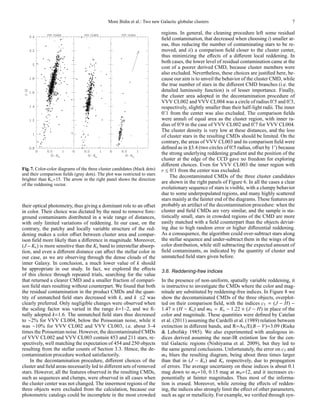
![8 Moni Bidin et al.: Two new Galactic globular clusters
Fig. 8. Reddening-free CMDs of the three field decontaminated clus-
ter candidates (black dots), overplotted to their comparison fields (grey
dots).
thetic isochrone experiments that the RGBs of two stellar popu-
lations of the same age but different metallicity, with [Fe/H]=0.0
and −1.5, would form two nearly parallel sequences separated
by less than ∆c3 ≈0.2. This, combined with the large errors,
causes two different populations to be difficult to distinguish.
Nevertheless, Figure 8 shows that the cluster sequence is redder
than the field in VVV CL003. For VVV CL002 the difference
is less evident, but both a linear and a quadratic fit of the upper
RGB (m4 ≤12.5) are between 0.01 and 0.04 magnitudes bluer in
the cluster than field. Then, the color differences between these
objects and their surrounding fields are not due to differential
reddening alone.
Figure 8 does not reveal much about VVV CL004, because
field and cluster sequences already overlapped in the (J − Ks )-Ks
plane. It can be noted, however, that some red stars in the upper
RGB (Ks = 11 − 13, see Figure 6) agree with the field locus in
the c3 -m4 diagram, indicating that some differential reddening is
present even in the direction of this object.
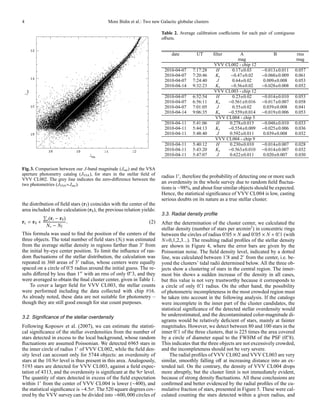
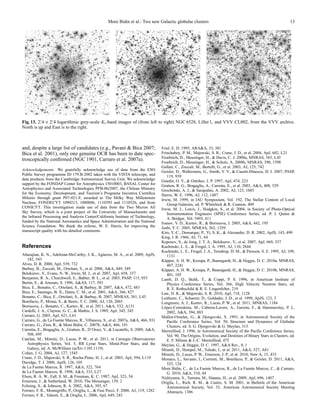
3.7. Proper motions
The information about proper motion of stars in the field of
an observed stellar overdensity is a very powerful tool to clar-
ify its nature, especially if combined with the photometric data
(e.g., Carraro 2005; Pavani & Bica 2007). As a matter of fact, a
study of new cluster candidates lacking an analysis of the proper
motions, would seem incomplete. Unfortunately, it provides no
real information for our three objects, because available data
are scarce, and at the estimated distances (∼10 kpc, see §3.9-
§3.10) a too high precision is required to detected an appreciable
difference with the field population. For example, the UCAC3 Fig. 9. Distribution of proper motions in the cluster area (full dots with
(Zacharias et al. 2010) and NOMAD (Zacharias et al. 2004) cat- error bars) and in the comparison field (small grey dots). Upper panel:
alogs, contain only 2 and 11 stars, respectively, in the inner 1′ of VVV CL002; Upper panel: VVV CL003; Lower panel: VVV CL004.
VVV CL002.](https://image.slidesharecdn.com/eso1141b-111021223422-phpapp02/85/Eso1141b-8-320.jpg)
![Moni Bidin et al.: Two new Galactic globular clusters 9
The proper motions of stars in the direction of VVV CL003 bution of the stars with Ks ≤17 located within |∆(J − Ks )| ≤0.07
and VVV CL004 and in their surrounding fields, drawn from the from the isochrone plotted in Figure 12, which fits the decontam-
PPMXL catalog (Roeser et al. 2010), are compared in the mid- inated cluster sequence with the parameters derived in §3.9. The
dle and lower panel of Figure 9. The cluster stars were taken resulting density map is shown in the upper panel of Figure 10,
′ ′
within 0. 8 (VVV CL003) and 0. 5 (VVV CL004) from the cen- where each 2′′ × 2′′ pixel is assigned the average density in the
ter, and the comparison field was defined as an annulus between 20′′ × 20′′ square centered on it. The local overedensity associ-
2′ and 5′ . Clearly, this comparison is inconclusive, and the av- ated to the cluster is clearly visible at (x,y)≈(250,750). The pro-
erage value in the cluster and field area do not differ by more cedure was then repeated shifting the same isochrone by 0.14
than 1 mas yr−1 in both components. According to our stellar magnitudes toward the red. The map is shown in the lower panel
counts, only 11% and 13% of the stars in the selected region of the same Figure, where the cluster overdensity is barely vis-
should be members of VVV CL003 and VVV CL004, respec- ible, lost in the patchy structures of the field. A random over-
tively. Attempting to isolate cluster members of VVV CL003 density of stars should, on the contrary, be observed in any re-
through the 2MASS photometry given in the PPMXL catalog, gion of the CMD where the field is found. This demonstrates
only three stars compatible with the cluster sequence can be that VVV CL002 is not a simple fluctuation of the field density.
identified. Still, we could be in the presence of a narrow, deep window in
′ the interstellar clouds, where a higher quantity of stars, on av-
The proper motions of stars within 0. 8 from the center of
VVV CL002 are offset with respect to the comparison field, as erage bluer because less reddened, would be found. However,
shown in the upper panel of Figure 9. Only 4.4 cluster mem- the presence of a similar color offset even in the reddening-free
bers (∼20%) are expected among the 22 entries of the PPMXL CMD argues against this hypothesis. Therefore, VVV CL002
catalog, and its very hard to assess the significance of the ob- and VVV CL003 are most likely two new stellar clusters.
served behavior. As an exercise, we will check if this offset Even VVV CL004 is a simple case, because all the evidence
is compatible with the detection of the peculiar movement of point to a random fluctuation of field stars. In fact, local stel-
VVV CL002. Assuming the escape velocity from the Galactic lar clustering is not very significant, its stars are photometrically
bulge (∼ 600 km s−1 , Lamb et al. 1996) as an upper limit for indistinguishable from the field population, and its radial den-
the tangential velocity, the proper motion of stars at 7.5 kpc sity profile, although well fitted with a King profile, is rather
from the Sun should not exceed 17 mas yr−1 . We will there- peculiar. Nevertheless, VVV CL004 could still be an open clus-
fore restrict the calculation to the stars with |µ| ≤20 mas yr−1 ter remnant (OCR), a dynamically evolved cluster in the last
because, considering the average error (∼8 mas yr−1 ), the clus- stage before dissolution. OCRs should appear as small groups
ter stars should not be found outside this range. The average of bright stars, depleted of the fainter Main Sequence objects
values are (µα , µδ )=(−2.8,−0.5) and (0.8,−3.0) for the cluster
¯ ¯ (de La Fuente Marcos 1997, 1998), as can be observed in the
and field stars, respectively. In the cluster area we can write field decontaminated CMD of VVV CL004.
Ntot µ = Nf µf + Nc µc for both components of proper motion,
¯ ¯ ¯ In the following section we will estimate the physical pa-
where the subscripts f and c denote the field and cluster mem- rameters of VVV CL002 and VVV CL003. The results are
bers, respectively, and N is the number of stars. We have Ntot =12, summarized in Table 3. A similar analysis is not presented for
and assuming Nc =5, Nf =7, we obtain (µ¯α , µδ )=(−7.7,3.0) for
¯ VVV CL004, both because the object is most probably not a real
cluster stars, that translates into a heliocentric tangential velocity cluster, and because the stars in the decontaminated CMD are too
of ∼300 km s−1 at 7.5 kpc. This is somewhat high, but an accept- few and dispersed for a reliable estimate. The most satisfactory
able value. The observed behavior of proper motions in the field isochrone fit of the VVV CL004 CMD is shown in Figure 12.
of VVV CL002 can therefore reflect the presence of a comoving It was obtained assuming [Fe/H] = −1.1, [α/Fe] = +0.30,
group of stars. (m−M)Ks =15.4, E(J − Ks )=0.82, and an age of 7.5 Gyr. It is not
the only solution, anyway, and other similar fits can be obtained
with a very different set of parameters.
3.8. The nature of the cluster candidates The transformations of Grocholski & Sarajedini (2002) were
Although the observed radial density profiles are well repre- used to link the theoretical K values to the observed Ks mag-
sented by the King law typical of stellar clusters, and the stel- nitudes. We relied on key photometric quantities measured on
lar overdensity associated with VVV CL002 and VVV CL003 the decontaminated CMDs, through the calibrations of Valenti
is statistically highly significant, we will not rely on stellar et al. (2004b) and Ferraro et al. (2006, hereafter F06). In par-
counts alone to conclude about the nature of the three clus- ticular, F06 define two sets of equations, for disk/halo-like and
ter candidates, because they can sometimes be misleading (see, bulge-like objects, depending on the assumed trend of the α-
for example, Villanova et al. 2004; Moni Bidin et al. 2010). enhancement with metallicity. In fact, the α-elements abundance
Unfortunately, the proper motions do not provide useful infor- affects the location and curvature of the RGB, which are bet-
mation at this regards. ter described as a function of the so-called global metallicity
The case of VVV CL003 is straightforward, because the ([M/H]) which, for [Fe/H] ≤ −1, can be expressed as
cluster sequence in the CMD is clearly distinct from the field [M/H] = [Fe/H] + log (0.638 fα + 0.362), (4)
one, hence this object cannot be only a fluctuation of the field
stellar density. The redder putative cluster sequence cannot be where fα is the α-elements enhancement factor (Salaris et al.
ascribed to a local fluctuation of reddening, because in this 1993). This relation, however, breaks down with increasing
case the extinction would be higher: a lack of stars would thus metallicity (VandenBerg et al. 2000; Kim et al. 2002).
be expected, instead of the observed significantly higher stellar
counts. The reddening-free CMD also supports this conclusion. 3.9. VVV CL002 parameters
The significance of the stellar overdensity detected in the di-
rection of VVV CL002 is the highest among the three candi- The decontaminated CMD of VVV CL002 shows a clump of
dates. As a further proof that the cluster and field stars originate stars at Ks ≈14. We interpret this as a signature of the clus-
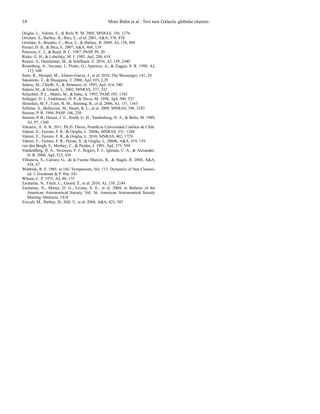
from different populations, we derived the spatial density distri- ter’s horizontal branch red clump. Following the prescriptions](https://image.slidesharecdn.com/eso1141b-111021223422-phpapp02/85/Eso1141b-9-320.jpg)
![10 Moni Bidin et al.: Two new Galactic globular clusters
at the upper limit of the metallicity range considered by F06,
and its red clump is therefore expected to be brighter, as indi-
cated by the theoretical values tabulated by Salaris & Girardi
(2002). In fact, Alves (2000) report a mean value 0.2 mag-
nitudes brighter than F06 for their solar-metallicity field sam-
ple. We finally adopted MK,0 =−1.50 ± 0.15 which, as shown
by Table 1 of Salaris & Girardi (2002), encompasses the the-
oretical expectations for stars at [Fe/H] = −0.4 in the age in-
terval from 1 to 11 Gyr. We thus obtain the apparent distance
modulus (m−M)Ks = 15.34 ± 0.21. From Equation 3.4 of F06,
it follows that the apparent magnitude at the unreddened color
(J − Ks )0 =0.7 is Ks =13.52. The observed color at this magni-
tude was obtained with a linear fit of the cluster RGB, restricted
to the range Ks =13-14 to limit the effects of the RGB curva-
ture. The comparison of this value with the expectation for null
reddening gave E(J − Ks ) = 1.50±0.15. The uncertainty asso-
ciated to the fit returned a too small error (±0.03 magnitudes),
while the reddening of Galactic GCs is usually uncertain to at
least 10% (see, for example, the discussion in Harris 1996, 2010
version). The error on E(J − Ks ) was therefore arbitrarily fixed
to the more realistic value given above. The reddening agrees
well with the value obtained by horizontally shifting a PGPUC
isochrone (Valcarce 2011; Valcarce et al. 2011, in preparation),
with the required metallicity, α-enhancement, and apparent dis-
tance modulus, to find the best fit of the observed RGB. Through
the transformations of Cardelli et al. (1989), the derived redden-
ing translates into E(B − V)=2.88±0.29, AKs = 1.02±0.10, im-
plying a true distance modulus (m−M)0 =14.32±0.23 and a dis-
Fig. 10. Upper panel: Spatial density of stars with Ks ≤ 17 lo- tance d=7.3±0.9 kpc. Had we used the mean intrinsic color of
cated within |∆(J − Ks )| ≤ 0.07 from the isochrone of Figure 12 for the red clump proposed by L´ pez-Corredoira et al. (2002), we
o
VVV CL002. The coordinates are given in pixels, and the density is in would have obtained E(J − Ks ) = 1.46±0.15, in good agree-
units of stars per arcmin2 . Lower panel: same as the upper panel, but ment with our estimate, but in this case the final isochrone fit
with an isochrone shifted 0.14 magnitudes toward the red. of the cluster CMD is of lesser quality. Schlegel et al. (1998)’s
maps give E(B − V)=3.47 in the direction of VVV CL002, but
this higher value should not be surprising, because it refers to
the total Galactic absorption, while the cluster should be located
of Kuchinski & Frogel (1995) and Kuchinski et al. (1995), we only half way to the end of the absorbing gas column. In any
linearly fitted the upper RGB from 0.6 mag above the clump case, the corrections proposed by Bonifacio et al. (2000) give
up to the brightest stars, obtaining a slope of −0.110. The fit E(B − V)=2.29, a value incompatible with our results.
is shown in Figure 6. This value is very similar to the slope At a distance of 7.3 kpc, the tidal and half-light angular
of the RGB of NGC 6528 (Ferraro et al. 2000) and Liller 1 radii of VVV CL002 (§3.3) translate into the physical dimen-
(Valenti et al. 2010), two metal-rich bulge globular clusters en- sions 3.8±0.5 and 1.6±0.3 pc, respectively. From the estimated
riched in α-elements ([α/Fe] ≈ +0.30). NGC 6528 is the bulge distance and the Galactic coordinates (l, b), assuming a solar
GC richest in iron, with [Fe/H] estimates in the range −0.1– Galactocentric distance R⊙ =8 kpc, we also derived the distance
+0.1 (Zoccali et al. 2004; Origlia et al. 2005; Carretta et al. from the Galactic center RGC =0.6±0.8 kpc, and the height above
2009), while Origlia et al. (2001) report [Fe/H] = −0.30 for the Galactic plane z=113±12 pc.
Liller 1. For VVV CL002 we used the F06 equations for bulge The cluster age was determined by fitting the lower part
systems, because of its location very close to the Galactic cen- of the decontaminated CMD with a PGPUC isochrone with
ter (see later), obtaining [M/H] = −0.16 ± 0.20 and, assuming the metallicity, α-enhancement, distance modulus, and redden-
[α/Fe] = +0.30, [Fe/H] = −0.4 ± 0.2 from Equation (4). The ing determined before. In Figure 12 we show this fit, with two
errors were derived from the uncertainties in the equation con- isochrones of different age. We found that a young age (∼6.5
stants estimated by Ferraro et al. (2000), which dominate the Gyr) was required to fit the feature at (Ks , (J−Ks )) ≈ (17, 2). This
error budget when compared to the uncertainties in the derived clump of stars, closely resembling the cluster’s sub-giant branch
slope. Had we used the equations for disk/halo objects, we would (SGB) and upper turn-off, was always observed when varying
have obtained [M/H] = −0.24 and [Fe/H] = −0.45, consistent the cluster area and the comparison field in the decontamination
with the adopted values. procedure. However, we regard this age estimate as uncertain,
The mean magnitude and color of the stars in the red clump because it completely relies on stars at the fainter end of our di-
of VVV CL002 are Ks = 13.80 ±0.15 and (J − Ks ) = 2.17 ±0.04, agram, but it can be regarded as a lower limit: had the cluster
where the rms of the measurements are taken as uncertainties on been younger, the SGB would have been brighter, and thus more
the average values. The absolute magnitude of the red clump clearly observed in our photometry. Deeper data unveiling the
weakly depends on the age and metallicity of the stellar pop- turnoff region are required to confirm these results. It must also
ulation. F06 propose MK,0 =−1.40 and a conservative error to be remembered that we used isochrones with Y=0.245, but a
take this effect into account, but still their calibration is more different helium abundance can affect the age estimate, because
suited for intermediate metal-poor, old clusters. VVV CL002 is stars with higher helium content evolve faster.](https://image.slidesharecdn.com/eso1141b-111021223422-phpapp02/85/Eso1141b-10-320.jpg)
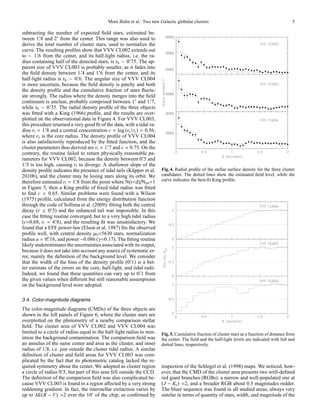
![Moni Bidin et al.: Two new Galactic globular clusters 11
The cluster distance, and all the other distance-dependent pa-
rameters such as RGC , z, and the physical size, depends on the as-
sumed absolute magnitude of the red clump. As an independent
test of our results, we estimated the distance modulus differen-
tially with respect to 47 Tucanae ([Fe/H] = −0.7, Gratton et al.
2003), and NGC 6528 ([Fe/H] ≈ 0), assuming the photometry
by Valenti et al. (2004a) to derive the shift in color and mag-
nitude between them and VVV CL002, and the Cardelli et al.
(1989) extinction coefficients. Despite the different metallicity
of the two comparison clusters, the resulting distance modulus
differs by only one tenth of magnitude in the two cases. We ob-
Fig. 11. Luminosity function of RGB stars in VVV CL003.
tain (m−M)0 =14.16, and a distance d=6.8 kpc. that agrees within
errors with our estimate. The difference is due to the old age of
the two comparison clusters (10–11 Gyr, Gratton et al. 2003;
Ortolani et al. 2001): the distance modulus derived with this em-
pirical method is 0.16 magnitudes lower than what we previously
obtained, and Salaris & Girardi (2002) predict that the red clump too red, partially overlapping and erasing the cluster clump. We
of a population of similar age and [Fe/H] = −0.4 would be 0.12– will therefore assume this group of stars is the cluster horizontal
0.15 magnitudes fainter than our assumption. We thus conclude branch red clump, but we warn that the subsequent analysis is
that, although the two estimates agree well, a distance shorter by based on this detection, that is not clear beyond any doubt.
about 0.5 kpc should be preferred if VVV CL002 is an old GC. Repeating the same procedures used for VVV CL002 (§3.9),
We estimated the total luminosity of the cluster integrating the slope of the upper RGB, estimated with the fit shown in the
the flux collected within increasing apertures up to the tidal ra- right panel of Figure 6, is −0.117. This value is lower than the
dius, and subtracting the expected field contribution. The mea- slope of any of the 27 Galactic GCs studied by Ferraro et al.
surements were performed with SExtractor (Bertin & Arnouts (2000) and Valenti et al. (2004b, 2010), indicating a high metal
1996) on the stacked tile in the J band, because many satu- content. The location of VVV CL003 in the Galactic disk outside
rated stars prevented a reliable estimate in the Ks -band frame. the bulge (see below) led us to adopt the F06 calibration for disk
We thus found a total magnitude Jtot = 12.5±0.2, and from the objects and no α-enhancement, obtaining [M/H] = [Fe/H] =
mean cluster color (J − K2 ) = 2.3±0.1 and the apparent dis- −0.1±0.2. For the absolute magnitude of the red clump, we opted
tance modulus, we obtain MK s = −5.1±0.3, which translates for the value proposed by Alves (2000), given the high metallic-
into MV = −3.4±0.3 assuming the synthetic colors of an old ity derived from the RGB slope. We thus obtained an apparent
stellar population calculated by Leitherer et al. (1999). distance modulus (m−M)Ks =16.58±0.12, E(J −Ks ) = 1.48±0.15
from Equation 2.4 of F06, and E(B − V)=2.85±0.29. Using the
calibration of L´ pez-Corredoira et al. (2002), we would have
o
3.10. VVV CL003 parameters obtained E(J − Ks )=1.46. On the contrary, Schlegel et al. (1998)
The interpretation of the decontaminated CMD of VVV CL003 give E(B − V)=3.34 in the direction of VVV CL003. As in the
must take into account the problems that its photometry pre- case of VVV CL002, this value is too high compared with our
sented. The diagram reveals a clear sequence of stars distinct estimates, while the corrections of Bonifacio et al. (2000) reduce
from the field population, resembling a cluster RGB. A sparse it too much, returning E(B − V)=2.19. However, the resolution
group of highly reddened stars is also visible to the right of this of the Schlegel et al. (1998) maps is too low for this region of
sequence. Many of them overlap with the cluster RGB in the the sky of strong reddening gradients, and it is not surprising
reddening-free CMD, and are probably the result of differen- that their average value in the resolution element does not coin-
tial reddening, while some are most probably foreground cool cide with the local absorption. It could also be that the relation
dwarfs, as they still keep their redder color even in Figure 8. R=AV /E(B − V)=3.1, required to transform the reddening in dif-
On the bluer side, a residual contamination is found. There is a ferent bands through the relations of Cardelli et al. (1989), is not
lack of stars fainter than Ks =16, probably due to the fact that al- valid in this highly obscured part of the sky.
most all the cluster area falls in the CCD border, where the data The reddening in the infrared bands implies AKs =
were collected in only one of the two jittered exposures forming 1.01±0.10, a true distance modulus (m−M)0 =15.57±0.16, and
a frame. The cluster RGB and the redder objects are visible for a distance d=13±1.0 kpc. With simple geometrical arguments
any definition of cluster and field area, provided that the latter based on the (l,b) coordinates given in Table 1, we obtain the
is not more distant than 2-3′ from the center, while the residual Galactic height z=166±14 pc, and the Galactocentric distance
contamination may change in color and quantity of stars depend- RGC =5.0±1.0 kpc. At a heliocentric distance of 13 kpc, the an-
ing on the location of the comparison field. gular size of VVV CL003 translates into the physical quantities
A dense group of stars in the cluster RGB is found at Ks =15. rt = 6.8±0.4 pc and rh = 2.3±0.4 pc.
This feature is more easily observed plotting the histogram of the An age estimate for VVV CL003 is impossible, because the
distribution of stars along the sequence, as shown in Figure 11. CMD does not reach the SGB. We found that the observed RGB
In this plot we considered only stars within 0.2 magnitudes in could be satisfactorily fitted with isochrones of virtually any age,
color from the RGB ridge line, defined as the isochrone plotted although lower values required a progressively higher reddening
in Figure 12. Unfortunately, the field and cluster RGBs are close to match the observed sequence. For example, an isochrone of
in this part of the CMD, and the behavior of this feature (and 2 Gyr better fitted the cluster CMD if E(J − Ks )=1.56 is as-
even its detection) strongly depends on the choice of the com- sumed. This is not necessarily a reason to prefer an older age
parison field. However, an enhanced residual contamination ap- for VVV CL003, because it could simply reflect the fact that the
peared at the same magnitude and a bluer color when the clump F06 relation used to estimate the reddening was calibrated on old
in the RGB was not found, indicating that the field RGB was stellar populations.](https://image.slidesharecdn.com/eso1141b-111021223422-phpapp02/85/Eso1141b-11-320.jpg)
![12 Moni Bidin et al.: Two new Galactic globular clusters
Table 3. Derived parameters of the two cluster candidates. very close to the Galactic center, VVV CL002 is therefore most
likely a GC.
VVV CL002 VVV CL003 So far, HP 1 is the closest known GC to the Galactic cen-
rh (′ ) 0.75±0.10 0.6±0.1 ter (RGC =0.5 kpc Barbuy et al. 2006), and only six GCs have
rh (pc) 1.6±0.3 2.3±0.4 been discovered in the inner 1 kpc (Harris 1996). VVV CL002,
rt (′ ) 1.8±0.1 1.8±0.1 with an estimated Galactocentric distance of 0.7 kpc, is therefore
rt (pc) 3.8±0.5 6.8±0.4 one of the innermost Galactic GCs. Curiously, the density profile
c = log (rh /rc ) 0.65±0.26 0.56±0.21
of VVV CL002 suggests the presence of tidal tails, a behavior
(m−M)0 14.32±0.23 15.57±0.16
d (kpc) 7.3±0.9 13.0±1.0 more easily observed when the cluster is close to the perigalac-
RGC (kpc) 0.7±0.9 5.0±1.0 ticon (K¨ pper et al. 2010a). If the connection between tidal tails
u
z (pc) 113±13 166±14 and perigalacticon was confirmed even for objects subject to the
E(J − Ks ) 1.50±0.15 1.48±0.15 intense stress of the inner Galaxy, then the cluster orbit would be
E(B − V) 2.88±0.29 2.85 ± 0.29 confined to the very central region of the Galaxy.
[M/H] −0.16 ± 0.2 −0.1 ± 0.2 VVV CL002 has a global metallicity close to NGC 6528
[Fe/H] −0.4 ± 0.2 −0.1 ± 0.2 and Liller 1, as indicated by the slope of the upper RGB. These
MV −3.4±0.3 - two objects are also bulge GCs very close to the Galactic center
Age (Gyr) ≥6.5 - (RGC =0.6 and 0.8 kpc, respectively; Valenti et al. 2010; Feltzing
& Johnson 2002) and, as in the case of VVV CL002, their
stars also are barely distinguished from the background bulge
population in the CMD (Davidge 2000). However, the similar-
ity cannot be drawn further, because their appearance is very
distinct. In Figure 13 we show a visual comparison between
the three objects, with Ks -band images from the VSA archive:
VVV CL002 is clearly sparser and less massive, resembling a
Palomar-like object more than a highly concentrated bulge GC
such as NGC 6528 and Liller 1. In fact, our estimate of its to-
tal luminosity is ∼3.5 magnitudes fainter than these two objects
(Webbink 1985; Peterson & Reed 1987; van den Bergh et al.
1991; Mallen-Ornelas & Djorgovski 1993). VVV CL002 is more
affine to moderately metal-rich, low-mass, and sparse GCs such
as Whiting 1 and Palomar 1, whose physical size are compara-
ble (rh =1.9 and 1.5-2.2 pc, respectively; Harris 1996; Rosenberg
et al. 1998). These two objects are relatively young (Rosenberg
et al. 1998; Carraro 2005), and are only slightly more metal-
poor (Carraro et al. 2007b; Monaco et al. 2011), although they
are one magnitude brighter (Harris 1996). Palomar 12 also has
a similar young age (Stetson et al. 1989; Geisler et al. 2007)
but has a lower metallicity (Cohen 2004), and it is physically
larger (Harris 1996). It is worth noting that both Whiting 1 and
Palomar 12 are associated with the Sagittarius dwarf spheroidal
galaxy (Irwin 1999; Carraro et al. 2007b; Law & Majewski
2010), while the extragalactic origin of Palomar 1 has been re-
peatedly proposed although never proven (e.g., Crane et al.
Fig. 12. Decontaminated CMDs of the three clusters, with the best- 2003; Frinchaboy et al. 2004; Belokurov et al. 2007).
fitting PGPUC isochrones defined in the text overplotted. The zero-age VVV CL003 is surely a physical cluster of stars, located
horizontal branch (ZAHB), in all the panels of the Figure, was cal-
culated with the helium abundance Y=0.245. For VVV CL002, two
in the Galactic disk beyond the center, outside the bulge, at a
isochrones at 6.5 Gyr (thick curve) and 8.5 Gyr (dashed curve) are Galactocentric distance of 5 kpc. Its high metallicity and its posi-
shown. tion in the Galaxy are more typical of an open cluster, although a
GC cannot be excluded. Deeper photometry, reaching at least the
cluster SGB two magnitudes fainter than the limit reached with
our data, is needed to estimate its age and, thus, better clarify
The high interstellar reddening gradient and the problematic its nature. Interestingly enough, to our knowledge it is the first
photometric data (§2.2) prevented a reliable estimate of the clus- stellar cluster ever discovered on the “dark side of the Galaxy”,
ter total luminosity. i.e. the Galactic disk on the other side of the center. The Open
Cluster Database4 (WEBDA, Mermilliod 1996) has no entry in
the direction of the bulge more distant than a few kpc.
4. Discussion and conclusions VVV CL004 is most probably only an asterism, and as such
it deserves no further attention. Nevertheless, the possibility of
The age of VVV CL002 is uncertain, but the proposed lower an OCR remains open, and this kind of object is of great inter-
limit of 6.5 Gyr, its subsolar metallicity, and its height above the est, because we are still lacking observational evidence of the
Galactic plane, twice the scale height of young objects (Joshi last stages of the cluster dynamical evolution. In fact, OCRs are
2005), argue in favor of an old cluster. On the other hand, Friel very elusive and easily confused with random field fluctuations
(1995) showed that old open clusters are completely absent in
4
the inner ∼7 kpc from the Galactic center. Because of its location http://www.univie.ac.at/webda/](https://image.slidesharecdn.com/eso1141b-111021223422-phpapp02/85/Eso1141b-12-320.jpg)

This document discusses three new globular cluster candidates found in the VVV (Vista Variables in the Via Lactea) near-infrared survey. 1) VVV CL002 is confirmed as a newly discovered, small, moderately metal-rich Galactic globular cluster located near the Galactic center. 2) VVV CL003 is likely an open cluster located in the Galactic disk beyond the center, though its high metallicity and location do not rule out the possibility that it is a globular cluster. 3) VVV CL004 is probably not a real cluster but just a random clump of field stars, as indicated by its low statistical significance and inability to distinguish its stars from field stars.


