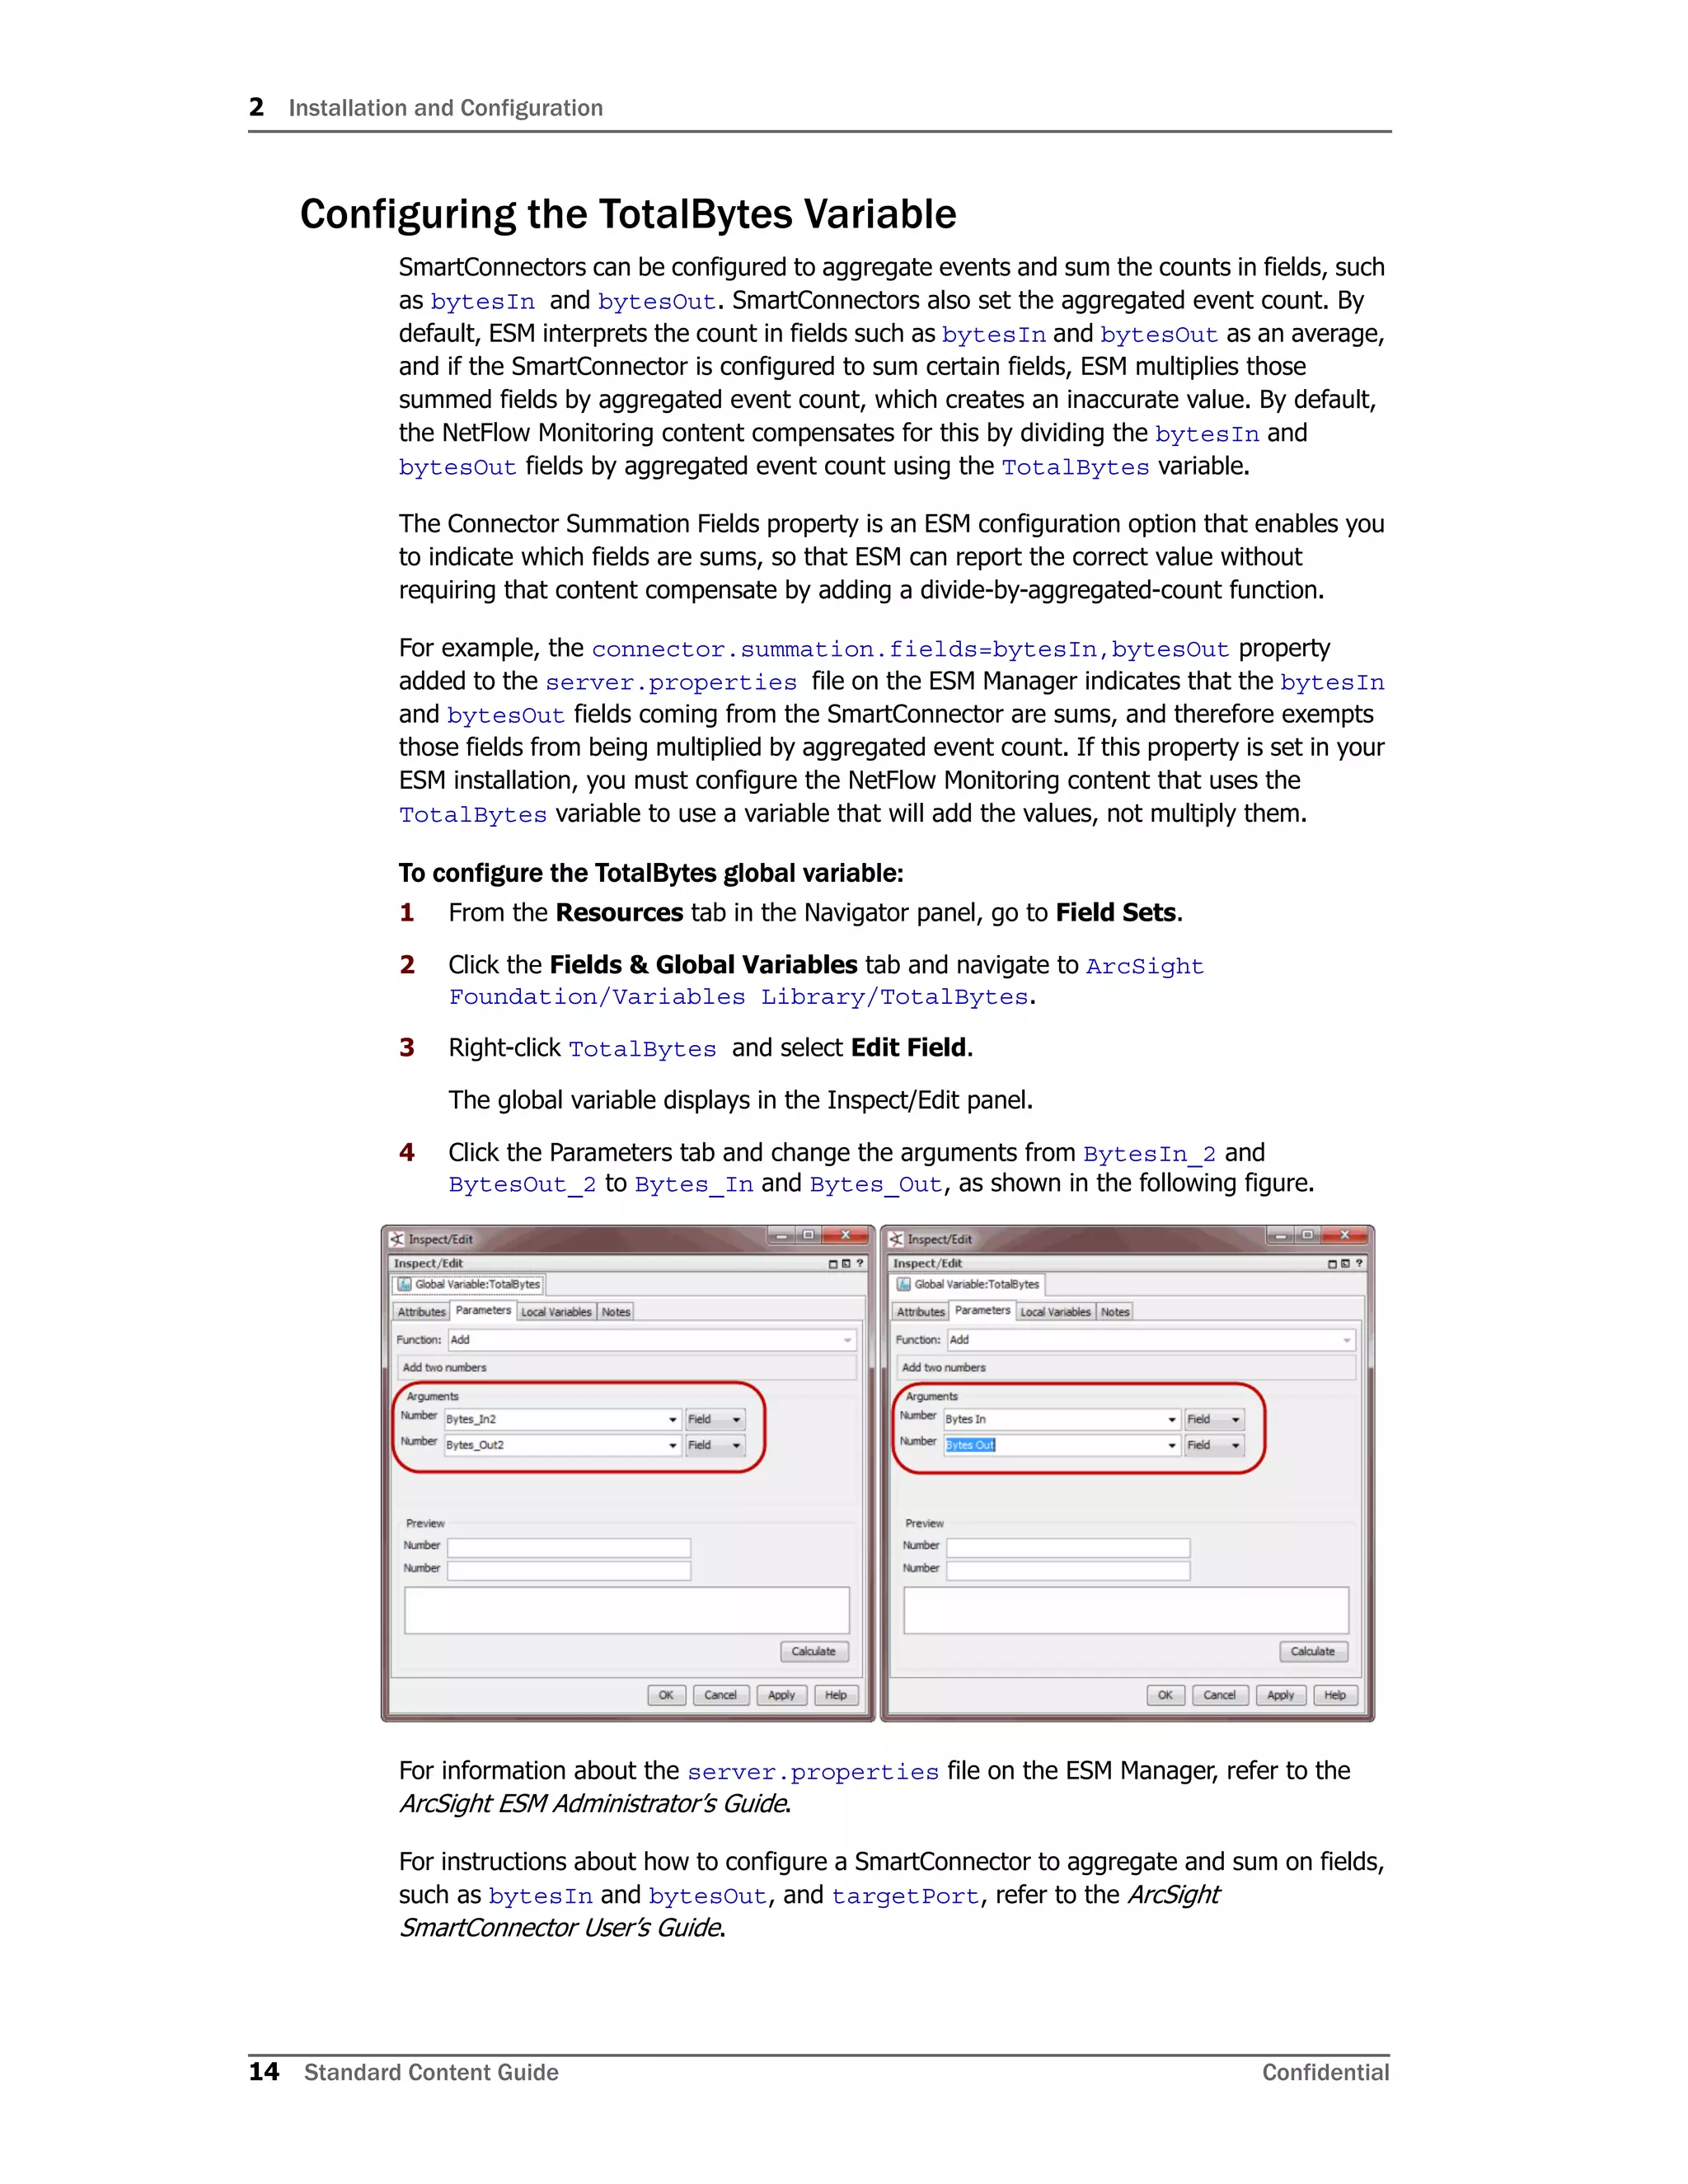
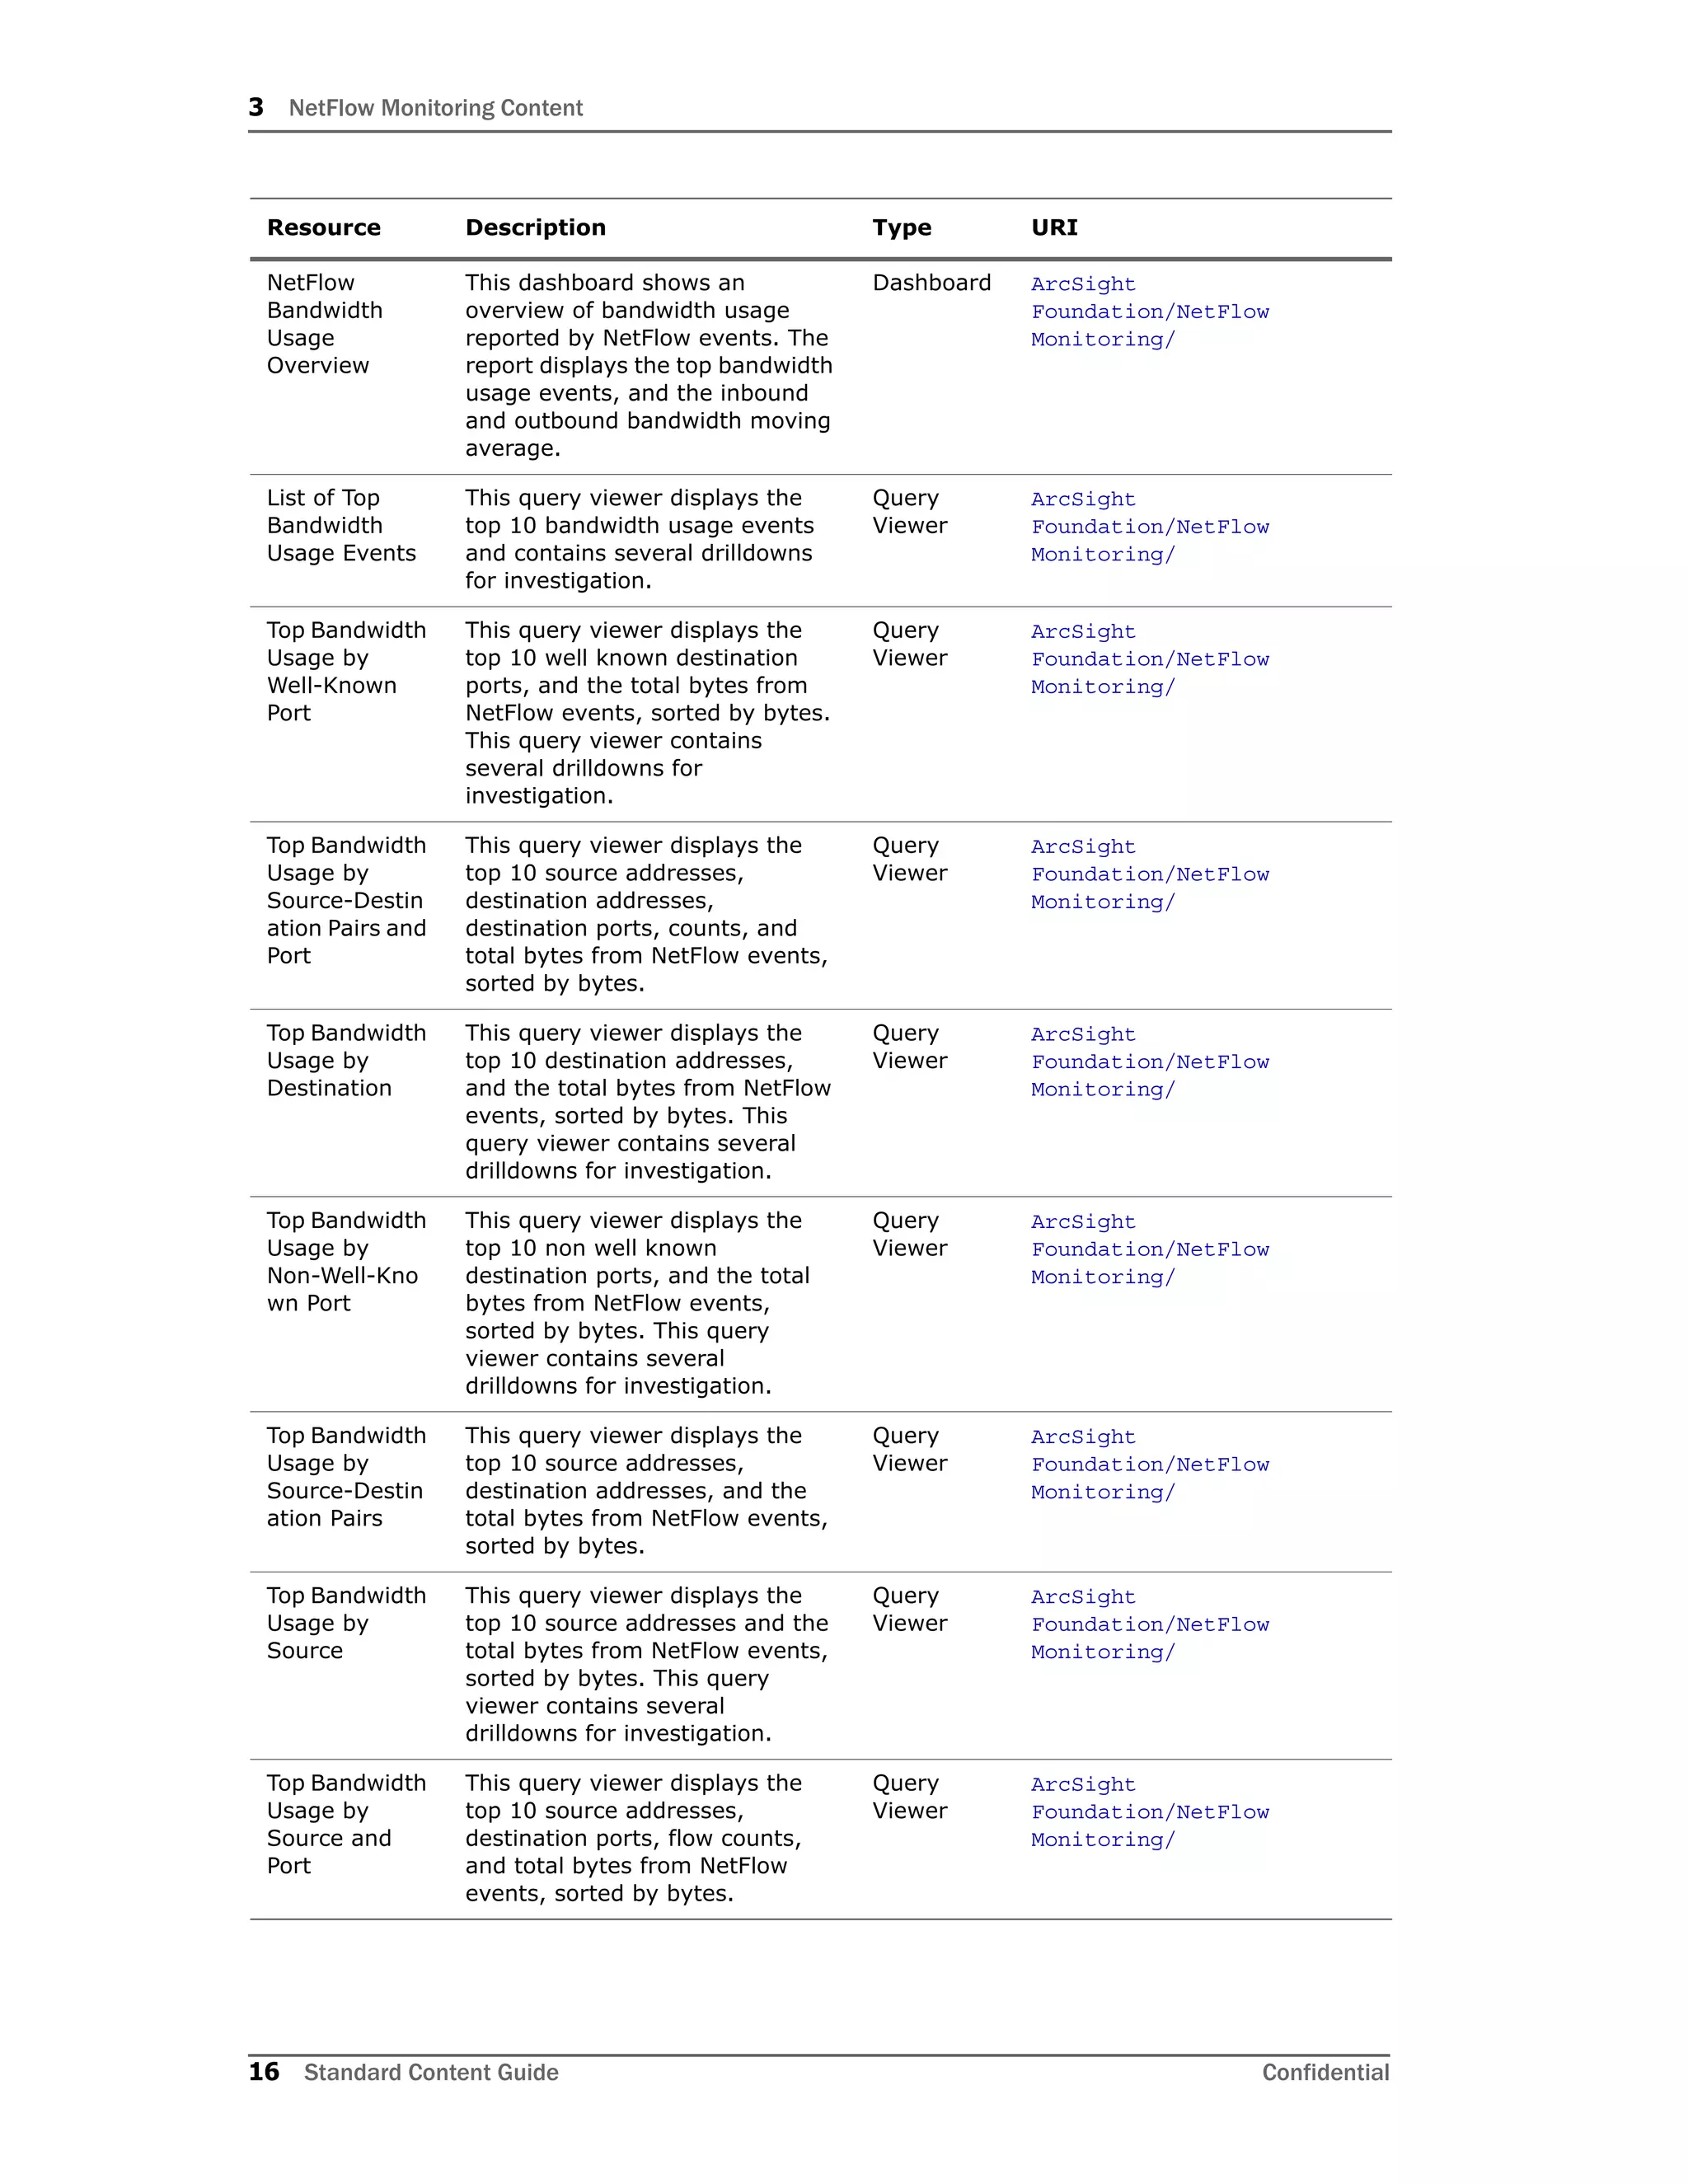
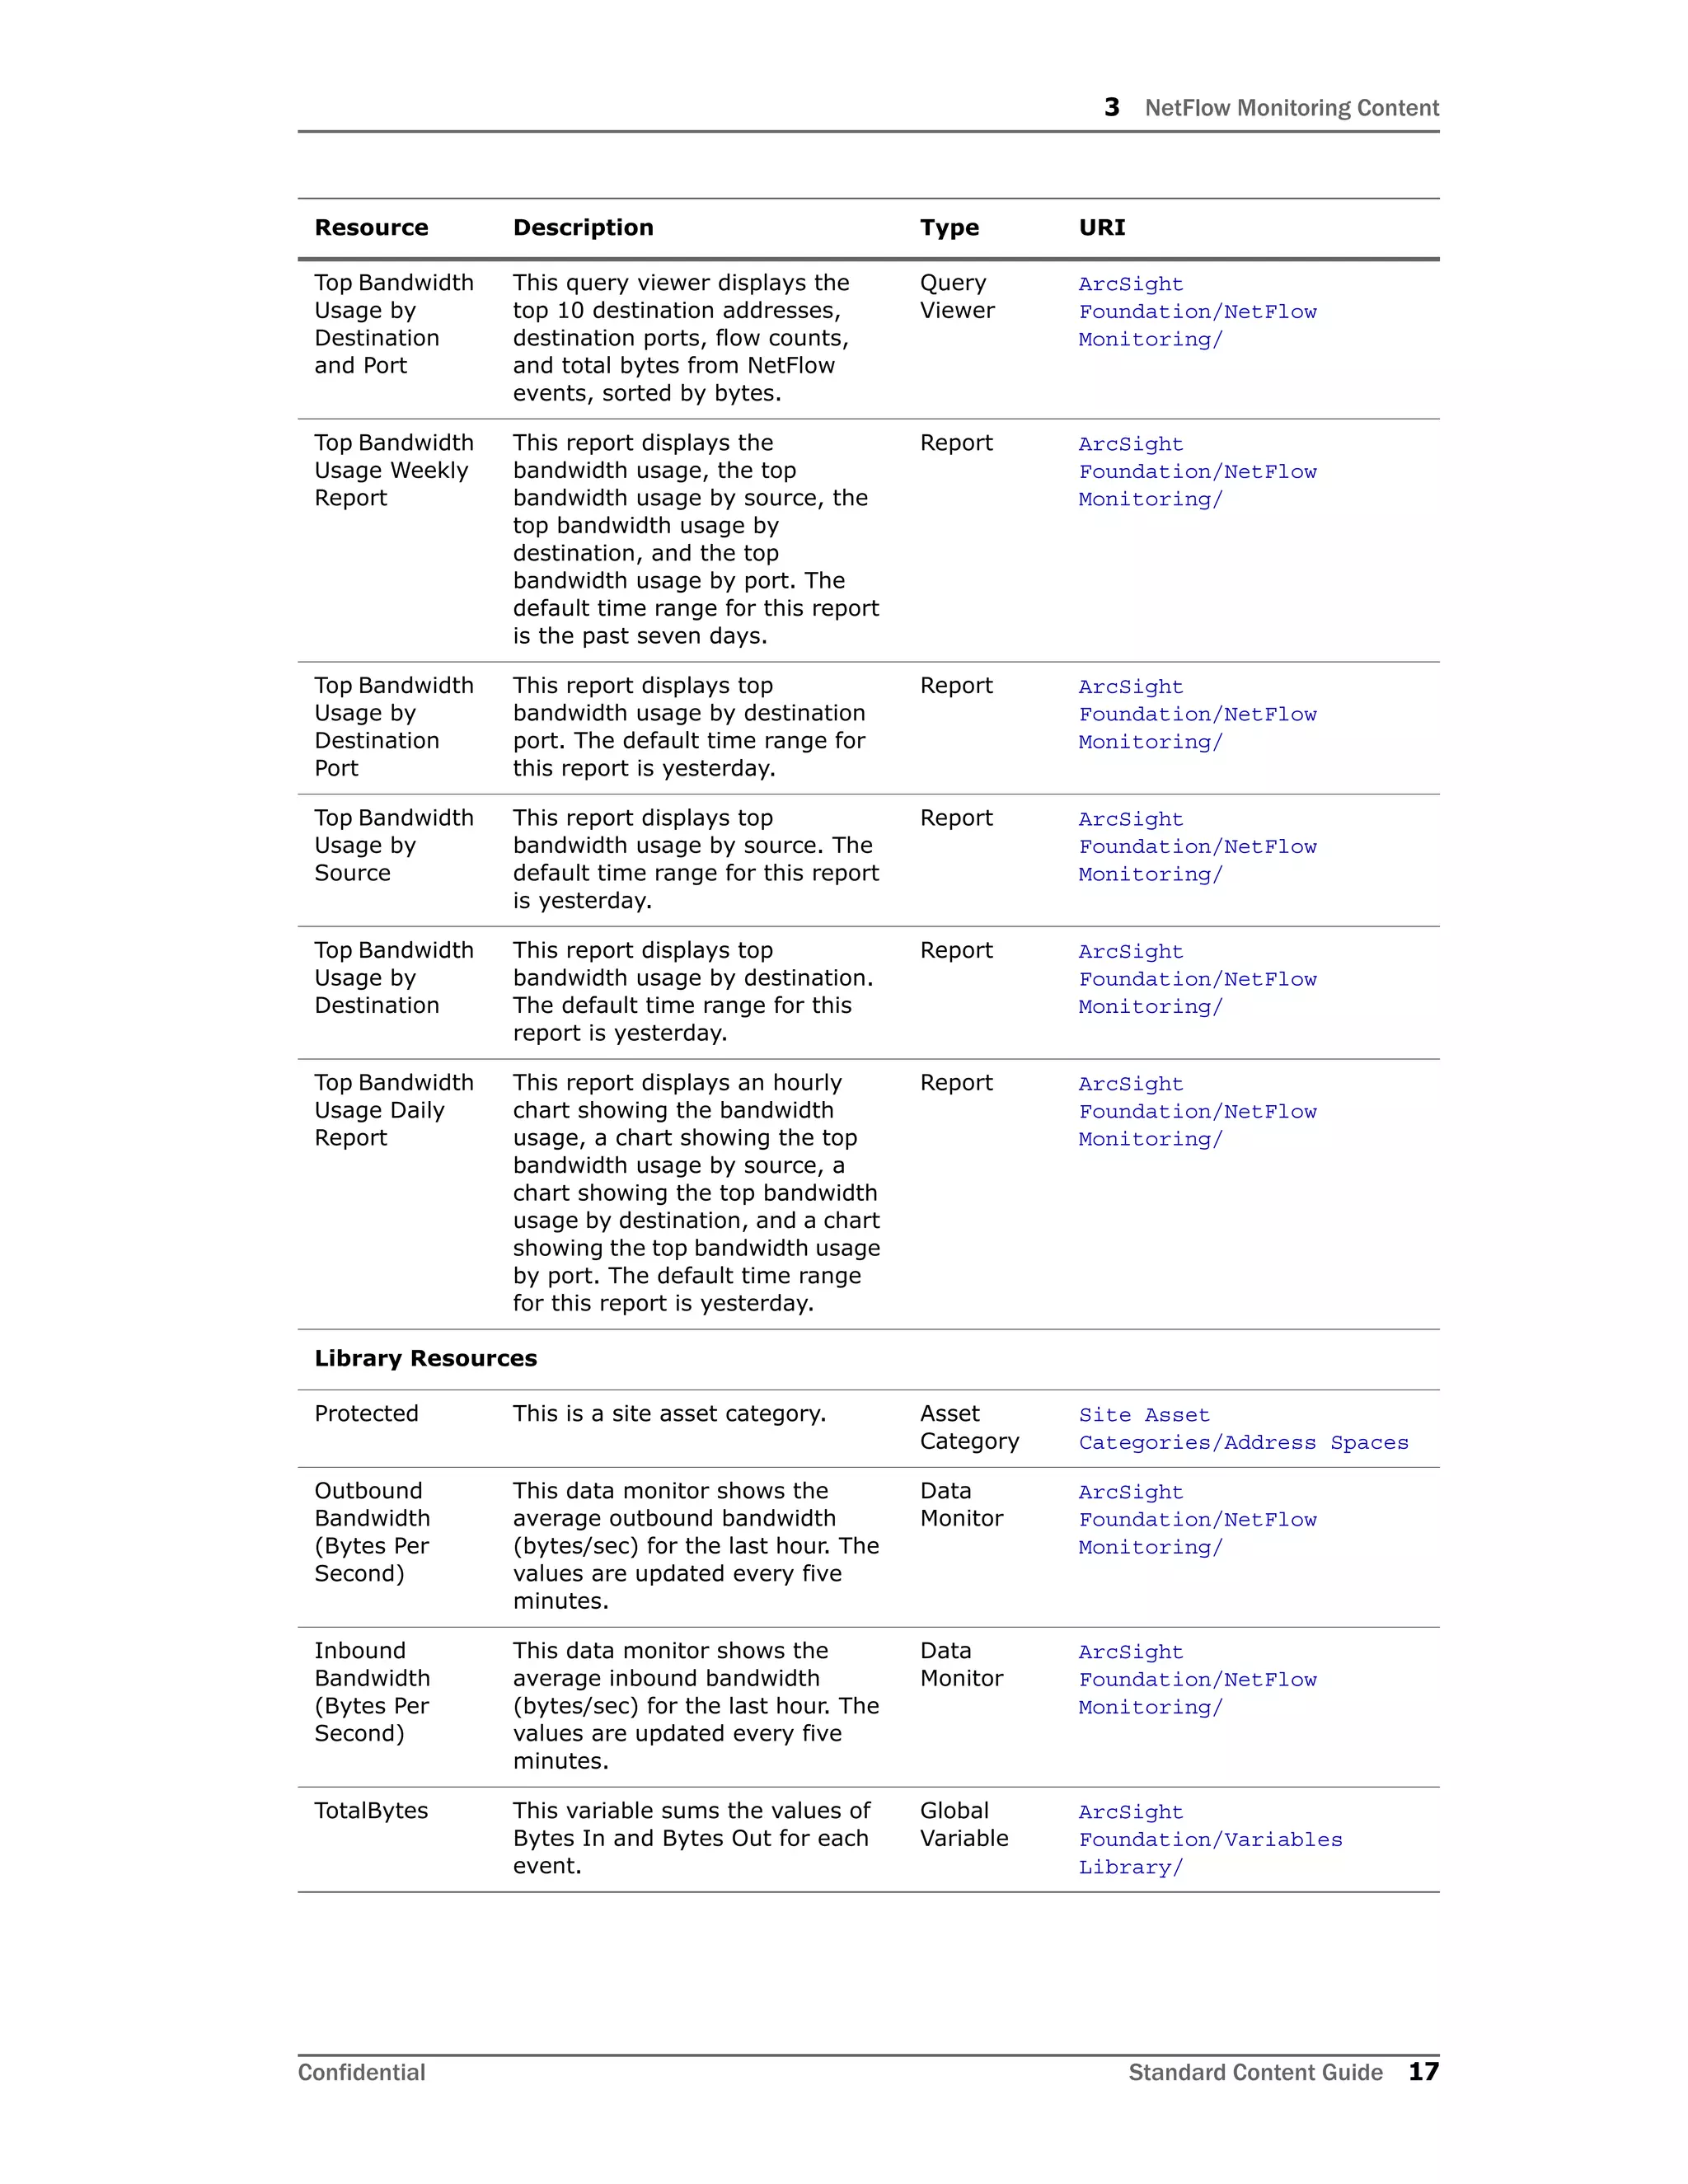
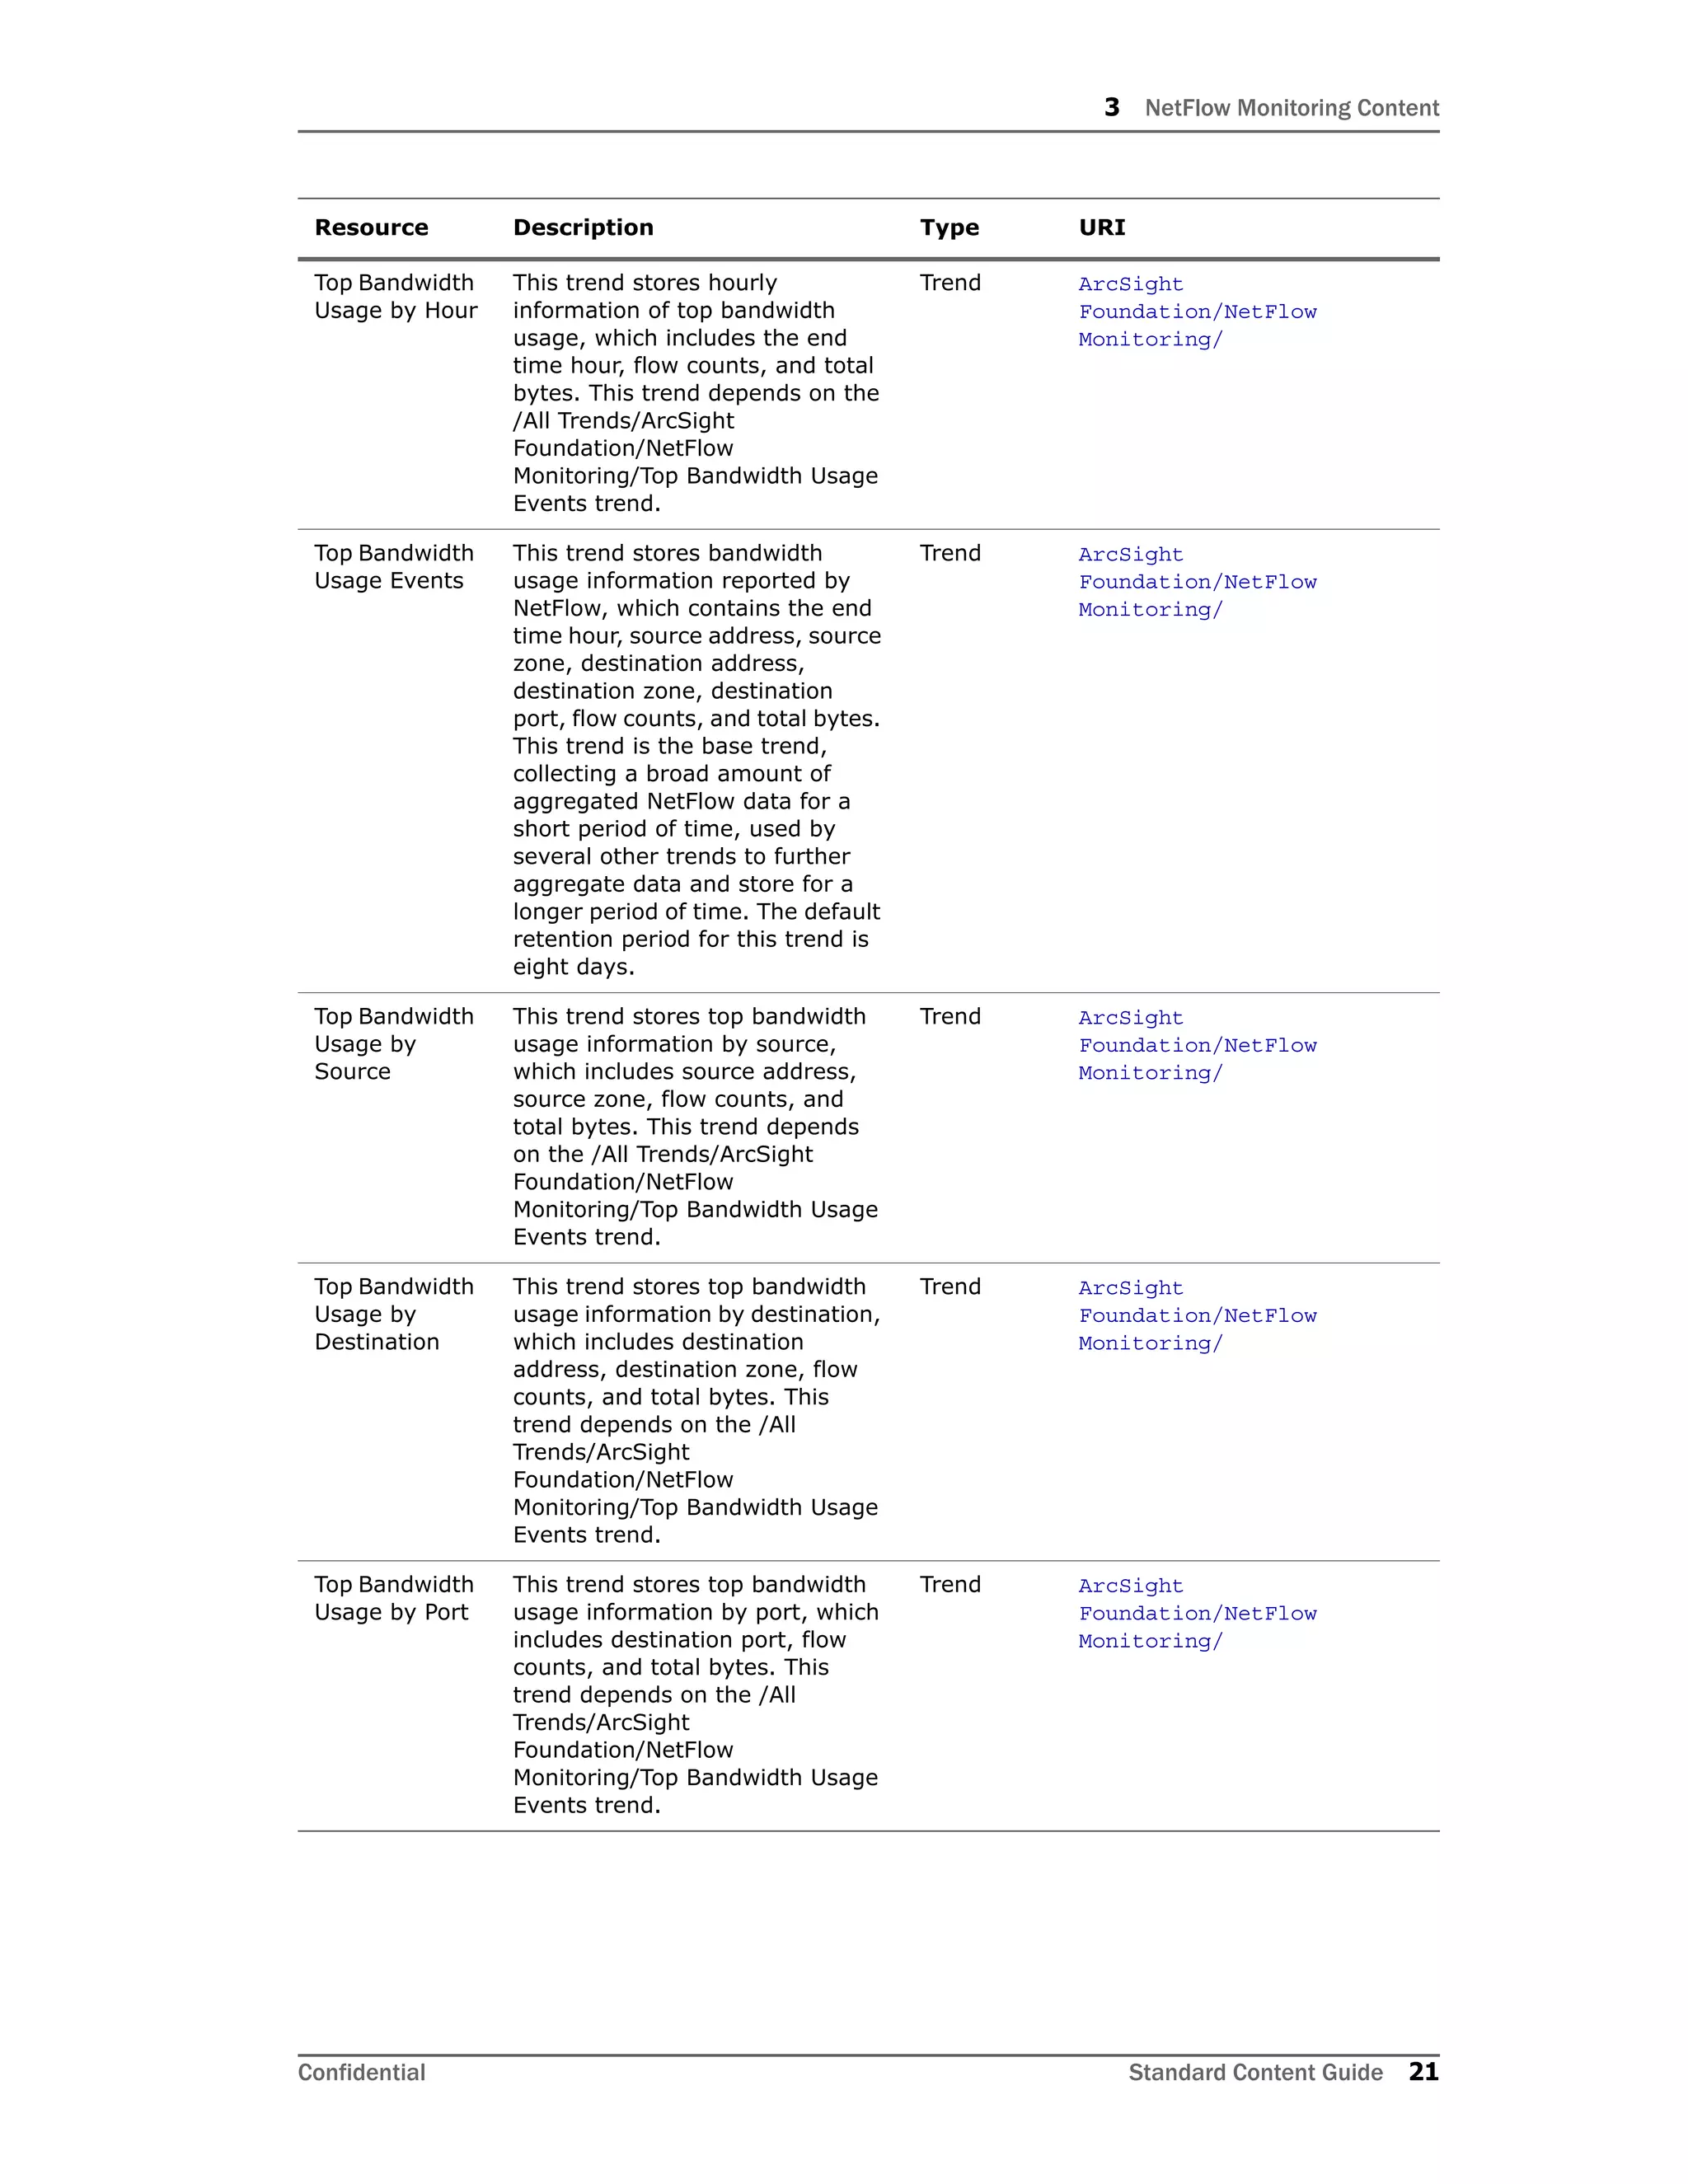
The document provides instructions for configuring NetFlow monitoring content in ArcSight ESM, including installing the NetFlow monitoring package, modeling the network, categorizing assets, ensuring filters capture relevant events, scheduling reports, restricting access to vulnerability reports, and configuring trends.
Oracle RAC Virtualized - In VMs, in Containers, On-premises, and in the CloudMarkus Michalewicz
This presentation discusses the support guidelines for using Oracle Real Application Clusters (RAC) in virtualized environments, for which general Oracle Database support guidelines are discussed shortly first.
First presented during DOAG 2021 User Conference, this presentation replaces its predecessor from 2016: https://www.slideshare.net/MarkusMichalewicz/how-to-use-oracle-rac-in-a-cloud-a-support-question
Code reviews are vital for ensuring good code quality. They serve as one of our last lines of defense against bugs and subpar code reaching production.
Yet, they often turn into annoying tasks riddled with frustration, hostility, unclear feedback and lack of standards. How can we improve this crucial process?
In this session we will cover:
- The Art of Effective Code Reviews
- Streamlining the Review Process
- Elevating Reviews with Automated Tools
By the end of this presentation, you'll have the knowledge on how to organize and improve your code review proces
Unleash Unlimited Potential with One-Time Purchase
BoxLang is more than just a language; it's a community. By choosing a Visionary License, you're not just investing in your success, you're actively contributing to the ongoing development and support of BoxLang.
How Does XfilesPro Ensure Security While Sharing Documents in Salesforce?XfilesPro
Worried about document security while sharing them in Salesforce? Fret no more! Here are the top-notch security standards XfilesPro upholds to ensure strong security for your Salesforce documents while sharing with internal or external people.
To learn more, read the blog: https://www.xfilespro.com/how-does-xfilespro-make-document-sharing-secure-and-seamless-in-salesforce/
Large Language Models and the End of ProgrammingMatt Welsh
Talk by Matt Welsh at Craft Conference 2024 on the impact that Large Language Models will have on the future of software development. In this talk, I discuss the ways in which LLMs will impact the software industry, from replacing human software developers with AI, to replacing conventional software with models that perform reasoning, computation, and problem-solving.
Into the Box Keynote Day 2: Unveiling amazing updates and announcements for modern CFML developers! Get ready for exciting releases and updates on Ortus tools and products. Stay tuned for cutting-edge innovations designed to boost your productivity.
Modern design is crucial in today's digital environment, and this is especially true for SharePoint intranets. The design of these digital hubs is critical to user engagement and productivity enhancement. They are the cornerstone of internal collaboration and interaction within enterprises.
Innovating Inference - Remote Triggering of Large Language Models on HPC Clus...Globus
Large Language Models (LLMs) are currently the center of attention in the tech world, particularly for their potential to advance research. In this presentation, we'll explore a straightforward and effective method for quickly initiating inference runs on supercomputers using the vLLM tool with Globus Compute, specifically on the Polaris system at ALCF. We'll begin by briefly discussing the popularity and applications of LLMs in various fields. Following this, we will introduce the vLLM tool, and explain how it integrates with Globus Compute to efficiently manage LLM operations on Polaris. Attendees will learn the practical aspects of setting up and remotely triggering LLMs from local machines, focusing on ease of use and efficiency. This talk is ideal for researchers and practitioners looking to leverage the power of LLMs in their work, offering a clear guide to harnessing supercomputing resources for quick and effective LLM inference.
We describe the deployment and use of Globus Compute for remote computation. This content is aimed at researchers who wish to compute on remote resources using a unified programming interface, as well as system administrators who will deploy and operate Globus Compute services on their research computing infrastructure.
Exploring Innovations in Data Repository Solutions - Insights from the U.S. G...Globus
The U.S. Geological Survey (USGS) has made substantial investments in meeting evolving scientific, technical, and policy driven demands on storing, managing, and delivering data. As these demands continue to grow in complexity and scale, the USGS must continue to explore innovative solutions to improve its management, curation, sharing, delivering, and preservation approaches for large-scale research data. Supporting these needs, the USGS has partnered with the University of Chicago-Globus to research and develop advanced repository components and workflows leveraging its current investment in Globus. The primary outcome of this partnership includes the development of a prototype enterprise repository, driven by USGS Data Release requirements, through exploration and implementation of the entire suite of the Globus platform offerings, including Globus Flow, Globus Auth, Globus Transfer, and Globus Search. This presentation will provide insights into this research partnership, introduce the unique requirements and challenges being addressed and provide relevant project progress.
top nidhi software solution freedownloadvrstrong314
This presentation emphasizes the importance of data security and legal compliance for Nidhi companies in India. It highlights how online Nidhi software solutions, like Vector Nidhi Software, offer advanced features tailored to these needs. Key aspects include encryption, access controls, and audit trails to ensure data security. The software complies with regulatory guidelines from the MCA and RBI and adheres to Nidhi Rules, 2014. With customizable, user-friendly interfaces and real-time features, these Nidhi software solutions enhance efficiency, support growth, and provide exceptional member services. The presentation concludes with contact information for further inquiries.
Your Digital Assistant.
Making complex approach simple. Straightforward process saves time. No more waiting to connect with people that matter to you. Safety first is not a cliché - Securely protect information in cloud storage to prevent any third party from accessing data.
Would you rather make your visitors feel burdened by making them wait? Or choose VizMan for a stress-free experience? VizMan is an automated visitor management system that works for any industries not limited to factories, societies, government institutes, and warehouses. A new age contactless way of logging information of visitors, employees, packages, and vehicles. VizMan is a digital logbook so it deters unnecessary use of paper or space since there is no requirement of bundles of registers that is left to collect dust in a corner of a room. Visitor’s essential details, helps in scheduling meetings for visitors and employees, and assists in supervising the attendance of the employees. With VizMan, visitors don’t need to wait for hours in long queues. VizMan handles visitors with the value they deserve because we know time is important to you.
Feasible Features
One Subscription, Four Modules – Admin, Employee, Receptionist, and Gatekeeper ensures confidentiality and prevents data from being manipulated
User Friendly – can be easily used on Android, iOS, and Web Interface
Multiple Accessibility – Log in through any device from any place at any time
One app for all industries – a Visitor Management System that works for any organisation.
Stress-free Sign-up
Visitor is registered and checked-in by the Receptionist
Host gets a notification, where they opt to Approve the meeting
Host notifies the Receptionist of the end of the meeting
Visitor is checked-out by the Receptionist
Host enters notes and remarks of the meeting
Customizable Components
Scheduling Meetings – Host can invite visitors for meetings and also approve, reject and reschedule meetings
Single/Bulk invites – Invitations can be sent individually to a visitor or collectively to many visitors
VIP Visitors – Additional security of data for VIP visitors to avoid misuse of information
Courier Management – Keeps a check on deliveries like commodities being delivered in and out of establishments
Alerts & Notifications – Get notified on SMS, email, and application
Parking Management – Manage availability of parking space
Individual log-in – Every user has their own log-in id
Visitor/Meeting Analytics – Evaluate notes and remarks of the meeting stored in the system
Visitor Management System is a secure and user friendly database manager that records, filters, tracks the visitors to your organization.
"Secure Your Premises with VizMan (VMS) – Get It Now"
Cyaniclab : Software Development Agency Portfolio.pdfCyanic lab
CyanicLab, an offshore custom software development company based in Sweden,India, Finland, is your go-to partner for startup development and innovative web design solutions. Our expert team specializes in crafting cutting-edge software tailored to meet the unique needs of startups and established enterprises alike. From conceptualization to execution, we offer comprehensive services including web and mobile app development, UI/UX design, and ongoing software maintenance. Ready to elevate your business? Contact CyanicLab today and let us propel your vision to success with our top-notch IT solutions.
Enhancing Research Orchestration Capabilities at ORNL.pdfGlobus
Cross-facility research orchestration comes with ever-changing constraints regarding the availability and suitability of various compute and data resources. In short, a flexible data and processing fabric is needed to enable the dynamic redirection of data and compute tasks throughout the lifecycle of an experiment. In this talk, we illustrate how we easily leveraged Globus services to instrument the ACE research testbed at the Oak Ridge Leadership Computing Facility with flexible data and task orchestration capabilities.
Designing for Privacy in Amazon Web ServicesKrzysztofKkol1
Data privacy is one of the most critical issues that businesses face. This presentation shares insights on the principles and best practices for ensuring the resilience and security of your workload.
Drawing on a real-life project from the HR industry, the various challenges will be demonstrated: data protection, self-healing, business continuity, security, and transparency of data processing. This systematized approach allowed to create a secure AWS cloud infrastructure that not only met strict compliance rules but also exceeded the client's expectations.
Globus Connect Server Deep Dive - GlobusWorld 2024Globus
We explore the Globus Connect Server (GCS) architecture and experiment with advanced configuration options and use cases. This content is targeted at system administrators who are familiar with GCS and currently operate—or are planning to operate—broader deployments at their institution.
Globus Compute wth IRI Workflows - GlobusWorld 2024Globus
As part of the DOE Integrated Research Infrastructure (IRI) program, NERSC at Lawrence Berkeley National Lab and ALCF at Argonne National Lab are working closely with General Atomics on accelerating the computing requirements of the DIII-D experiment. As part of the work the team is investigating ways to speedup the time to solution for many different parts of the DIII-D workflow including how they run jobs on HPC systems. One of these routes is looking at Globus Compute as a way to replace the current method for managing tasks and we describe a brief proof of concept showing how Globus Compute could help to schedule jobs and be a tool to connect compute at different facilities.
Strategies for Successful Data Migration Tools.pptxvarshanayak241
Data migration is a complex but essential task for organizations aiming to modernize their IT infrastructure and leverage new technologies. By understanding common challenges and implementing these strategies, businesses can achieve a successful migration with minimal disruption. Data Migration Tool like Ask On Data play a pivotal role in this journey, offering features that streamline the process, ensure data integrity, and maintain security. With the right approach and tools, organizations can turn the challenge of data migration into an opportunity for growth and innovation.
Paketo Buildpacks : la meilleure façon de construire des images OCI? DevopsDa...Anthony Dahanne
Les Buildpacks existent depuis plus de 10 ans ! D’abord, ils étaient utilisés pour détecter et construire une application avant de la déployer sur certains PaaS. Ensuite, nous avons pu créer des images Docker (OCI) avec leur dernière génération, les Cloud Native Buildpacks (CNCF en incubation). Sont-ils une bonne alternative au Dockerfile ? Que sont les buildpacks Paketo ? Quelles communautés les soutiennent et comment ?
Venez le découvrir lors de cette session ignite
5. Confidential Standard Content Guide 5
Chapter 1
NetFlow Monitoring Overview
This chapter discusses the following topics.
What is Standard Content?
Standard content is a series of coordinated resources (filters, rules, dashboards, reports,
and so on) that address common security and management tasks. Standard content is
designed to give you comprehensive correlation, monitoring, reporting, alerting, and case
management out of the box with minimal configuration. The content provides a full
spectrum of security, network, and configuration monitoring tasks, as well as a
comprehensive set of tasks that monitor the health of the system.
The standard content is installed using a series of packages, some of which are installed
automatically with the Manager to provide essential system health and status operations.
The remaining packages are presented as install-time options organized by category.
Standard content consists of the following:
ArcSight System content is installed automatically with the Manager and consists of
resources required for basic security processing functions, such as threat escalation
and priority calculations, as well as basic throughput channels required for
out-of-the-box functionality.
ArcSight Administration content is installed automatically with the Manager, and
provides statistics about the health and performance of ArcSight products. ArcSight
Administration is essential for managing and tuning the performance of content and
components.
ArcSight Foundations content (such as Configuration Monitoring, Intrusion
Monitoring, Network Monitoring, NetFlow Monitoring, and Workflow) are presented as
install-time options and provide a coordinated system of resources with real-time
monitoring capabilities for a specific area of focus, as well as after-the-fact analysis in
the form of reports and trends. You can extend these foundations with additional
resources specific to your needs or you can use them as a template for building your
own resources and tasks.
Shared Libraries - ArcSight Administration and several of the ArcSight Foundations
rely on a series of common resources that provide core functionality for common
“What is Standard Content?” on page 5
“Standard Content Packages” on page 6
“NetFlow Monitoring Content” on page 7
6. 1 NetFlow Monitoring Overview
6 Standard Content Guide Confidential
security scenarios. Dependencies between these resources and the packages they
support are managed by the Package resource.
Anti-Virus content is a set of filters, reports, and report queries used by ArcSight
Foundations, such as Configuration Monitoring and Intrusion Monitoring.
Conditional Variable Filters are a library of filters used by variables in standard
content report queries, filters, and rule definitions. The Conditional Variable Filters
are used by ArcSight Administration and certain ArcSight Foundations, such as
Configuration Monitoring, Intrusion Monitoring, Network Monitoring, and
Workflow.
Global Variables are a set of variables used to create other resources and to
provide event-based fields that cover common event information, asset, host, and
user information, and commonly used timestamp formats. The Global Variables
are used by ArcSight Administration and certain ArcSight Foundations.
Network filters are a set of filters required by ArcSight Administration and certain
ArcSight Foundations, such as Intrusion Monitoring and Network Monitoring.
Standard Content Packages
Standard content comes in packages (.arb files) that are either installed automatically or
presented as an install-time option. The following graphic outlines the packages.
Figure 1-1 The ArcSight System and ArcSight Administration packages at the base provide
content required for basic ArcSight functionality. The common packages in the center contain
shared resources that support ArcSight Administration and the ArcSight Foundation packages.
The packages shown on top are ArcSight Foundations that address common network security
and management scenarios.
Depending on the options you install, you will see the ArcSight System resources, the
ArcSight Administration resources, and some or all of the other package content.
The ArcSight Express package is present in ESM installations, but is not
installed by default. The package offers an alternate view of the Foundation
resources. You can install or uninstall the ArcSight Express package without
impact to the system.
7. 1 NetFlow Monitoring Overview
Confidential Standard Content Guide 7
NetFlow Monitoring Content
NetFlow is a network protocol developed by Cisco Systems to run on Cisco IOS-enabled
equipment for collecting IP traffic information. It is proprietary, but supported by platforms
other than Cisco IOS, such as Juniper routers and Linux.
NetFlow provides session-level data. Leveraging this information using ESM can help to
monitor network bandwidth usage and correlate it with other security logs (such as
firewall, IDS, authentication logs, and so on).
The NetFlow Monitoring content provides resources to monitor and report on top
bandwidth usage by source, destination and port.
This guide describes the NetFlow Monitoring content. For information about ArcSight
System or ArcSight Administration content, refer to the Standard Content Guide - ArcSight
System and ArcSight Administration. For information about an optional ArcSight
Foundation, refer to the Standard Content Guide for that Foundation. ESM documentation
is available on Protect 724 (https://protect724.arcsight.com).
When creating your own packages, you can explicitly include or exclude system
resources in the package. Exercise caution if you delete packages that might
have system resources; for example, zones. Make sure the system resources
either belong to a locked group or are themselves locked. For more information
about packages, refer to the ArcSight Console User’s Guide.
9. Confidential Standard Content Guide 9
Chapter 2
Installation and Configuration
This chapter discusses the following topics.
For information about upgrading standard content, see Appendix A‚ Upgrading Standard
Content‚ on page 139.
Installing the NetFlow Monitoring Package
The NetFlow Monitoring package is one of the standard content packages that are
presented as install-time options. If you selected all of the standard content packages to be
installed at installation time, the packages and their resources will be installed in the
ArcSight database and available in the Navigator panel resource tree. The package icon in
the Navigator panel package view will appear blue.
If you opted to exclude any packages at installation time, the package is imported into the
ESM package view in the Navigator panel, but is not available in the resource view. The
package icon in the package view will appear grey.
If you do not want the package to be available in any form, you can delete the package.
To install a package that is imported, but not installed:
1 In the Navigator panel Package view, navigate to the package you want to install.
2 Right-click the package and select Install Package.
3 In the Install Package dialog, click OK.
4 When the installation is complete, review the summary report and click OK.
The package resources are fully installed to the ArcSight database, the resources are
fully enabled and operational, and available in the Navigator panel resource tree.
To uninstall a package that is installed:
1 In the Navigator Panel Package view, navigate to the package you want to uninstall.
2 Right-click the package and select Uninstall Package.
3 In the Uninstall Package dialog, click OK.
The progress of the uninstall displays in the Progress tab of the Uninstalling Packages
dialog. If a message displays indicating that there is a conflict, select an option in the
Resolution Options area and click OK.
“Installing the NetFlow Monitoring Package” on page 9
“Configuring NetFlow Monitoring Content” on page 10
10. 2 Installation and Configuration
10 Standard Content Guide Confidential
4 When uninstall is complete, review the summary and click OK.
The package is removed from the ArcSight database and the Navigator panel resource
tree, but remains available in the Navigator panel package view, and can be
re-installed at another time.
To delete a package and remove it from the Console and the database:
1 In the Navigator Panel Package view, navigate to the package you want to delete.
2 Right-click the package and select Delete Package.
3 When prompted for confirmation of the delete, click Delete.
The package is removed from the Navigator panel package view.
Configuring NetFlow Monitoring Content
The list below shows the general tasks you need to complete to configure NetFlow
Monitoring content with values specific to your environment.
“Setting Up SmartConnectors and Modeling the Network” on page 10
“Categorizing Assets” on page 11
“Ensuring Filters Capture Relevant Events” on page 12
“Scheduling Reports” on page 12
“Restricting Access to Vulnerability View Reports” on page 12
“Configuring Trends” on page 13
Setting Up SmartConnectors and Modeling the Network
Configuring NetFlow Monitoring content starts with installing SmartConnectors and
configuring zones and networks for devices that report to ESM. The NetFlow Monitoring
content is triggered by NetFlow events from the following SmartConnectors:
A network model keeps track of the network nodes participating in the event traffic.
Modeling your network and categorizing critical assets using the standard asset categories
is what activates some of the standard content and makes it effective.
There are several ways to model your network. For information about populating the
network model, refer to the ArcSight Console User’s Guide or the ESM online Help. To learn
more about the architecture of the ESM network modeling tools, refer to the ESM 101
guide.
SmartConnector Device Version Supported
ArcSight IP Flow
SmartConnector
• Cisco NetFlow versions 5 and 9
• Flexible NetFlow from IOS 15.0
• Cisco ASA 8.2, and Juniper Networks J-Flow
versions 5 and 9
ArcSight QoSient ARGUS
SmartConnector
• QoSient ARGUS versions 2 and 3
11. 2 Installation and Configuration
Confidential Standard Content Guide 11
Categorizing Assets
After you have populated your network model with assets, apply the standard asset
categories to activate standard content that uses these categories.
Categorize all assets (or the zones to which the assets belong) that are internal to the
network with the /All Asset Categories/Site Asset Categories/
Address Spaces/Protected category.
Internal Assets are assets inside the company network. Assets that are not categorized
as internal to the network are considered to be external. Make sure that you also
categorize assets that have public addresses but are controlled by the organization
(such as web servers) as Protected.
Categorize all assets that are considered critical to protect (including assets that host
proprietary content, financial data, cardholder data, top secret data, or perform
functions critical to basic operations) with the /All Asset Categories/System
Asset Categories/Criticality/High or Very High category.
The asset categories most essential to basic event processing are those used by the
Priority Formula to calculate the criticality of an event. Asset criticality is one of the
four factors used by the Priority Formula to generate an overall event priority rating.
Asset categories can be assigned to assets, zones, asset groups, or zone groups. If
assigned to a group, all resources under that group inherit the categories.
You can assign asset categories individually using the Asset editor or in a batch using the
Network Modeling wizard. For information about how to assign asset categories using the
Console tools, refer to the ArcSight Console User’s Guide or the online Help.
For more about the Priority Formula and how it leverages these asset categories to help
assign priorities to events, refer to the ArcSight Console User’s Guide or the ESM 101 guide.
Assets with a private IP address (such as 192.168.0.0) are considered
Protected by the system, even if they are not categorized as such.
12. 2 Installation and Configuration
12 Standard Content Guide Confidential
Ensuring Filters Capture Relevant Events
Standard content relies on specific event field values to identify events of interest. Although
this method applies to most of the events and devices, be sure to test key filters to verify
that they actually capture the required events. For NetFlow Monitoring, follow the
procedure below to make sure that the NetFlow Traffic Reporting Devices filter captures
relevant events:
To ensure that a filter captures the relevant events:
1 Generate or identify the required events and verify that they are being processed by
ESM by viewing them in an active channel or query viewer.
2 Navigate to the NetFlow Traffic Reporting Devices filter, right-click the filter and
choose Create Channel with Filter. If you see the events of interest in the newly
created channel, the filter is functioning properly.
If you do not see the events of interest:
a Verify that the configuration of the active channel is suitable for the events in
question. For example, ensure that the event time is within the start and end time
of the channel.
b Modify the filter condition to capture the events of interest. After applying the
change, repeat Step 2 to verify that the modified filter captures the required
events.
Scheduling Reports
You can run reports on demand, automatically on a regular schedule, or both. By default,
NetFlow Monitoring reports are not scheduled to run automatically.
Evaluate the reports that come with NetFlow Monitoring, and schedule the reports that are
of interest to your organization and business objectives. For instructions about how to
schedule reports, refer to the ArcSight Console User’s Guide or the ESM online Help.
Restricting Access to Vulnerability View Reports
The Vulnerability View detail reports display a list of vulnerabilities generated by scanner
report events, and are therefore considered sensitive material. By default, the reports are
configured with read access for Administrators, Default User Groups, and Analyzer
Administrators. Administrators and Analyzer Administrators also have write access to this
group.
To eliminate these events from view, you have to create a special filter and apply it to the
appropriate users groups. When restricting access to the Vulnerability View reports, be
aware of the following:
Because access is inherited, the parent group must have the same or more liberal
permissions than the vulnerability reports.
If you need to move the reports to a group with tighter permissions, also move the
trends and queries that support them, in both the Detail and Operational Summaries
sections.
To get a complete view of the resources attached to these reports, run a resource
graph on the individual filters or the parent group (right-click the resource or group
and select Graph View).
13. 2 Installation and Configuration
Confidential Standard Content Guide 13
Configuring Trends
Trends are a type of resource that can gather data over longer periods of time, which can
be leveraged for reports. Trends streamline data gathering to the specific pieces of data
you want to track over a long range, and breaks the data gathering up into periodic
updates. For long-range queries, such as end-of-month summaries, trends greatly reduce
the burden on system resources. Trends can also provide a snapshot of which devices
report on the network over a series of days.
NetFlow Monitoring content includes several trends, which are all enabled by default.
To disable a trend, go to the Navigator panel, right-click the trend you want to disable and
select Disable Trend.
For more information about trends, refer to the the ArcSight Console User’s Guide or the
ESM online Help.
Adjusting Trend Schedules
NetFlow Monitoring content contains five trends. Four of the trends are trend-on-trends,
which all collect data from a single base trend (Top Bandwidth Usage Events). Do not
schedule the four trend-on-trends to run before the base trend completes its daily query
run. By default, the trends are scheduled to run daily at the times indicated below:
By default, each trend uses midnight of the date the package was installed as the date and
time the trend will start collecting information. To adjust the schedule or start date/time for
the trend, edit the values in the Schedule tab of the Inspect/Edit panel for the trend.
To enable a disabled trend, you must first change the default start date in
the Trend editor.
If the start date is not changed, the trend takes the default start date
(derived from when the trend was first installed), and backfills the data from
that time. For example, if you enable the trend six months after the first
install, these trends try to get all the data for the last six months, which
might cause performance problems, overwhelm system resources, or cause
the trend to fail if that event data is not available.
Trend Name Scheduled run time
Top Bandwidth Usage by Destination 3:33:36 AM
Top Bandwidth Usage by Hour 2:40:34 AM
Top Bandwidth Usage by Port 3:15:50 AM
Top Bandwidth Usage by Source 3:07:08 AM
Top Bandwidth Usage Events (base trend) 1:15:09 AM
14. 2 Installation and Configuration
14 Standard Content Guide Confidential
Configuring the TotalBytes Variable
SmartConnectors can be configured to aggregate events and sum the counts in fields, such
as bytesIn and bytesOut. SmartConnectors also set the aggregated event count. By
default, ESM interprets the count in fields such as bytesIn and bytesOut as an average,
and if the SmartConnector is configured to sum certain fields, ESM multiplies those
summed fields by aggregated event count, which creates an inaccurate value. By default,
the NetFlow Monitoring content compensates for this by dividing the bytesIn and
bytesOut fields by aggregated event count using the TotalBytes variable.
The Connector Summation Fields property is an ESM configuration option that enables you
to indicate which fields are sums, so that ESM can report the correct value without
requiring that content compensate by adding a divide-by-aggregated-count function.
For example, the connector.summation.fields=bytesIn,bytesOut property
added to the server.properties file on the ESM Manager indicates that the bytesIn
and bytesOut fields coming from the SmartConnector are sums, and therefore exempts
those fields from being multiplied by aggregated event count. If this property is set in your
ESM installation, you must configure the NetFlow Monitoring content that uses the
TotalBytes variable to use a variable that will add the values, not multiply them.
To configure the TotalBytes global variable:
1 From the Resources tab in the Navigator panel, go to Field Sets.
2 Click the Fields & Global Variables tab and navigate to ArcSight
Foundation/Variables Library/TotalBytes.
3 Right-click TotalBytes and select Edit Field.
The global variable displays in the Inspect/Edit panel.
4 Click the Parameters tab and change the arguments from BytesIn_2 and
BytesOut_2 to Bytes_In and Bytes_Out, as shown in the following figure.
For information about the server.properties file on the ESM Manager, refer to the
ArcSight ESM Administrator’s Guide.
For instructions about how to configure a SmartConnector to aggregate and sum on fields,
such as bytesIn and bytesOut, and targetPort, refer to the ArcSight
SmartConnector User’s Guide.
15. Confidential Standard Content Guide 15
Chapter 3
NetFlow Monitoring Content
The NetFlow Monitoring content contains resources that:
Monitor, investigate, and report on bandwidth usage by source, destination, and port.
Monitor the bandwidth moving average and identify top bandwidth usage by source,
destination, and port.
Report on bandwidth usage in daily or weekly increments using trends and by source,
destination, and port.
You can use this information to build correlation content; for example, you can build a rule
that correlates NetFlow events with other security logs, such as firewall or IDS logs.
Configuration
Refer to “Configuring NetFlow Monitoring Content” on page 10 for general content
configuration.
Devices
The following device types can supply events that apply to the NetFlow Monitoring
resources:
Network devices with NetFlow enabled
Resources
The following table lists the information presentation and data processing resources in the
NetFlow Monitoring content.
Table 3-1 Resources in the NetFlow Monitoring Content
Resource Description Type URI
Monitor Resources
Top NetFlow
Bandwidth
Usage
Monitoring
This dashboard shows the top
bandwidth usage as reported by
NetFlow events, showing top
bandwidth usage by source,
destination, well-known port, and
non well-known port.
Dashboard ArcSight
Foundation/NetFlow
Monitoring/
16. 3 NetFlow Monitoring Content
16 Standard Content Guide Confidential
NetFlow
Bandwidth
Usage
Overview
This dashboard shows an
overview of bandwidth usage
reported by NetFlow events. The
report displays the top bandwidth
usage events, and the inbound
and outbound bandwidth moving
average.
Dashboard ArcSight
Foundation/NetFlow
Monitoring/
List of Top
Bandwidth
Usage Events
This query viewer displays the
top 10 bandwidth usage events
and contains several drilldowns
for investigation.
Query
Viewer
ArcSight
Foundation/NetFlow
Monitoring/
Top Bandwidth
Usage by
Well-Known
Port
This query viewer displays the
top 10 well known destination
ports, and the total bytes from
NetFlow events, sorted by bytes.
This query viewer contains
several drilldowns for
investigation.
Query
Viewer
ArcSight
Foundation/NetFlow
Monitoring/
Top Bandwidth
Usage by
Source-Destin
ation Pairs and
Port
This query viewer displays the
top 10 source addresses,
destination addresses,
destination ports, counts, and
total bytes from NetFlow events,
sorted by bytes.
Query
Viewer
ArcSight
Foundation/NetFlow
Monitoring/
Top Bandwidth
Usage by
Destination
This query viewer displays the
top 10 destination addresses,
and the total bytes from NetFlow
events, sorted by bytes. This
query viewer contains several
drilldowns for investigation.
Query
Viewer
ArcSight
Foundation/NetFlow
Monitoring/
Top Bandwidth
Usage by
Non-Well-Kno
wn Port
This query viewer displays the
top 10 non well known
destination ports, and the total
bytes from NetFlow events,
sorted by bytes. This query
viewer contains several
drilldowns for investigation.
Query
Viewer
ArcSight
Foundation/NetFlow
Monitoring/
Top Bandwidth
Usage by
Source-Destin
ation Pairs
This query viewer displays the
top 10 source addresses,
destination addresses, and the
total bytes from NetFlow events,
sorted by bytes.
Query
Viewer
ArcSight
Foundation/NetFlow
Monitoring/
Top Bandwidth
Usage by
Source
This query viewer displays the
top 10 source addresses and the
total bytes from NetFlow events,
sorted by bytes. This query
viewer contains several
drilldowns for investigation.
Query
Viewer
ArcSight
Foundation/NetFlow
Monitoring/
Top Bandwidth
Usage by
Source and
Port
This query viewer displays the
top 10 source addresses,
destination ports, flow counts,
and total bytes from NetFlow
events, sorted by bytes.
Query
Viewer
ArcSight
Foundation/NetFlow
Monitoring/
Resource Description Type URI
17. 3 NetFlow Monitoring Content
Confidential Standard Content Guide 17
Top Bandwidth
Usage by
Destination
and Port
This query viewer displays the
top 10 destination addresses,
destination ports, flow counts,
and total bytes from NetFlow
events, sorted by bytes.
Query
Viewer
ArcSight
Foundation/NetFlow
Monitoring/
Top Bandwidth
Usage Weekly
Report
This report displays the
bandwidth usage, the top
bandwidth usage by source, the
top bandwidth usage by
destination, and the top
bandwidth usage by port. The
default time range for this report
is the past seven days.
Report ArcSight
Foundation/NetFlow
Monitoring/
Top Bandwidth
Usage by
Destination
Port
This report displays top
bandwidth usage by destination
port. The default time range for
this report is yesterday.
Report ArcSight
Foundation/NetFlow
Monitoring/
Top Bandwidth
Usage by
Source
This report displays top
bandwidth usage by source. The
default time range for this report
is yesterday.
Report ArcSight
Foundation/NetFlow
Monitoring/
Top Bandwidth
Usage by
Destination
This report displays top
bandwidth usage by destination.
The default time range for this
report is yesterday.
Report ArcSight
Foundation/NetFlow
Monitoring/
Top Bandwidth
Usage Daily
Report
This report displays an hourly
chart showing the bandwidth
usage, a chart showing the top
bandwidth usage by source, a
chart showing the top bandwidth
usage by destination, and a chart
showing the top bandwidth usage
by port. The default time range
for this report is yesterday.
Report ArcSight
Foundation/NetFlow
Monitoring/
Library Resources
Protected This is a site asset category. Asset
Category
Site Asset
Categories/Address Spaces
Outbound
Bandwidth
(Bytes Per
Second)
This data monitor shows the
average outbound bandwidth
(bytes/sec) for the last hour. The
values are updated every five
minutes.
Data
Monitor
ArcSight
Foundation/NetFlow
Monitoring/
Inbound
Bandwidth
(Bytes Per
Second)
This data monitor shows the
average inbound bandwidth
(bytes/sec) for the last hour. The
values are updated every five
minutes.
Data
Monitor
ArcSight
Foundation/NetFlow
Monitoring/
TotalBytes This variable sums the values of
Bytes In and Bytes Out for each
event.
Global
Variable
ArcSight
Foundation/Variables
Library/
Resource Description Type URI
18. 3 NetFlow Monitoring Content
18 Standard Content Guide Confidential
External
Source
This filter identifies events
originating from outside the
company network.
Filter ArcSight
Foundation/Common/Network
Filters/Boundary Filters/
Inbound
NetFlow Traffic
This filter identifies NetFlow
events coming from external
sources targeting the internal
network.
Filter ArcSight
Foundation/NetFlow
Monitoring/
Outbound
Events
This filter identifies events
originating from inside the
company network, targeting the
outside network.
Filter ArcSight
Foundation/Common/Network
Filters/Location Filters/
Outbound
NetFlow Traffic
This filter identifies NetFlow
events coming from internal
sources targeting the external
network.
Filter ArcSight
Foundation/NetFlow
Monitoring/
Bytes Out is
NULL
This filter is designed for
conditional expression variables.
The filter identifies events where
the Bytes Out is NULL.
Filter ArcSight
Foundation/Common/Conditio
nal Variable
Filters/Bytes/
Internal
Source
This filter identifies events
coming from inside the company
network.
Filter ArcSight
Foundation/Common/Network
Filters/Boundary Filters/
Internal Target This filter identifies events
targeting inside the company
network.
Filter ArcSight
Foundation/Common/Network
Filters/Boundary Filters/
QoSient Argus
Events
This filter identifies events from
Argus SmartConnectors.
Filter ArcSight
Foundation/NetFlow
Monitoring/
Bytes In is
NULL
This filter is designed for
conditional expression variables.
The filter identifies events in
which the Bytes In is NULL.
Filter ArcSight
Foundation/Common/Conditio
nal Variable
Filters/Bytes/
NetFlow Traffic
Reporting
Devices
This filter identifies NetFlow
traffic reporting devices. By
default, the filter contains
QoSient Argus, NetFlow V5, and
NetFlow V9 events.
Filter ArcSight
Foundation/NetFlow
Monitoring/
External
Target
This filter identifies events
targeting the outside network.
Filter ArcSight
Foundation/Common/Network
Filters/Boundary Filters/
NetFlow V9
Events
This filter identifies NetFlow
version 9 events.
Filter ArcSight
Foundation/NetFlow
Monitoring/
Inbound
Events
This filter identifies events
coming from the outside network
targeting inside the company
network.
Filter ArcSight
Foundation/Common/Network
Filters/Location Filters/
Non-Well-Kno
wn Ports
This filter identifies events in
which the Target Port is not NULL
and is greater than 1024.
Filter ArcSight
Foundation/NetFlow
Monitoring/
Resource Description Type URI
19. 3 NetFlow Monitoring Content
Confidential Standard Content Guide 19
NetFlow V5
Events
This filter identifies NetFlow
version 5 events.
Filter ArcSight
Foundation/NetFlow
Monitoring/
Well-Known
Ports
This filter identifies events in
which the Target Port is not NULL
and is less than or equal to 1024.
Filter ArcSight
Foundation/NetFlow
Monitoring/
Top Bandwidth
Usage by
Source-Destin
ation Pairs
This query returns the source
address, destination address,
flow counts, and total bytes
(Bytes In + Bytes Out) from
NetFlow events within the last
hour.
Query ArcSight
Foundation/NetFlow
Monitoring/
Top Bandwidth
Usage by
Destination -
Trend on Trend
This query identifies the
destination address, destination
zone, flow counts, and total bytes
from the Top Bandwidth Usage by
Destination trend.
Query ArcSight
Foundation/NetFlow
Monitoring/Trend/
Top Bandwidth
Usage by
Source
This query returns the source
address and total bytes (Bytes In
+ Bytes Out) from NetFlow
events within the last hour.
Query ArcSight
Foundation/NetFlow
Monitoring/
Top Bandwidth
Usage by Hour
- Trend on
Trend
This query returns bandwidth
usage information by hour from
the Top Bandwidth Usage by Hour
trend.
Query ArcSight
Foundation/NetFlow
Monitoring/Trend/
Top Bandwidth
Usage by
Source and
Port
This query identifies the source
address, destination port, flow
counts, and total bytes (Bytes In
+ Bytes Out) from NetFlow
events within the last hour.
Query ArcSight
Foundation/NetFlow
Monitoring/
Top Bandwidth
Usage by
Destination
This query identifies the
destination address and total
bytes (Bytes In + Bytes Out)
from NetFlow events within the
last hour.
Query ArcSight
Foundation/NetFlow
Monitoring/
Top Bandwidth
Usage Events
This query identifies the source
address, destination address,
destination port, flow counts, and
total bytes (Bytes In + Bytes
Out) from NetFlow events within
the last hour. This query is used
by the Top Bandwidth Usage
Events trend.
Query ArcSight
Foundation/NetFlow
Monitoring/
Top Bandwidth
Usage by Day
- Trend on
Trend
This query identifies the
bandwidth usage information by
day from the Top Bandwidth
Usage by Hour trend.
Query ArcSight
Foundation/NetFlow
Monitoring/Trend/
Top Bandwidth
Usage by Port
- Trend
This query identifies the
destination port, flow counts, and
total bytes from the trend Top
Bandwidth Usage Events.
Query ArcSight
Foundation/NetFlow
Monitoring/Trend/
Resource Description Type URI
20. 3 NetFlow Monitoring Content
20 Standard Content Guide Confidential
Top Bandwidth
Usage by
Well-Known
Port
This query returns the
destination port and total bytes
(Bytes In + Bytes Out) from
NetFlow events within the last
hour in which the destination port
is well-known.
Query ArcSight
Foundation/NetFlow
Monitoring/
Top Bandwidth
Usage by Hour
- Trend
This query returns bandwidth
usage information by hour from
the Top Bandwidth Usage Events
trend.
Query ArcSight
Foundation/NetFlow
Monitoring/Trend/
Top Bandwidth
Usage by Port
- Trend on
Trend
This query identifies the target
port, flow counts, and total bytes
from the Top Bandwidth Usage by
Port trend.
Query ArcSight
Foundation/NetFlow
Monitoring/Trend/
Top Bandwidth
Usage by
Destination
and Port
This query identifies the
destination address, destination
port, flow counts, and total bytes
(Bytes In + Bytes Out) from
NetFlow events within the last
hour.
Query ArcSight
Foundation/NetFlow
Monitoring/
Top Bandwidth
Usage by
Source - Trend
This query returns the source
address, source zone, and total
bytes from the Top Bandwidth
Usage Events trend.
Query ArcSight
Foundation/NetFlow
Monitoring/Trend/
Top Bandwidth
Usage by
Non-Well-Kno
wn Port
This query returns the
destination port and total bytes
(Bytes In + Bytes Out) from
NetFlow events in which the
destination port is not
well-known within the last hour.
Query ArcSight
Foundation/NetFlow
Monitoring/
Top Bandwidth
Usage by
Destination -
Trend
This query identifies the
destination address, destination
zone, flow counts, and total bytes
from the Top Bandwidth Usage
Events trend.
Query ArcSight
Foundation/NetFlow
Monitoring/Trend/
List of Top
Bandwidth
Usage Events
This query returns the source
address, destination address,
destination port, flow counts, and
total bytes (Bytes In + Bytes
Out) from NetFlow events within
the last hour.
Query ArcSight
Foundation/NetFlow
Monitoring/
Top Bandwidth
Usage by
Source-Destin
ation Pairs and
Port
This query identifies the source
address, destination address,
destination port, flow counts, and
total bytes (Bytes In + Bytes
Out) from NetFlow events within
the last hour.
Query ArcSight
Foundation/NetFlow
Monitoring/
Top Bandwidth
Usage by
Source - Trend
on Trend
This query returns the source
address, source zone, and total
bytes from the Top Bandwidth
Usage by Source trend.
Query ArcSight
Foundation/NetFlow
Monitoring/Trend/
Resource Description Type URI
21. 3 NetFlow Monitoring Content
Confidential Standard Content Guide 21
Top Bandwidth
Usage by Hour
This trend stores hourly
information of top bandwidth
usage, which includes the end
time hour, flow counts, and total
bytes. This trend depends on the
/All Trends/ArcSight
Foundation/NetFlow
Monitoring/Top Bandwidth Usage
Events trend.
Trend ArcSight
Foundation/NetFlow
Monitoring/
Top Bandwidth
Usage Events
This trend stores bandwidth
usage information reported by
NetFlow, which contains the end
time hour, source address, source
zone, destination address,
destination zone, destination
port, flow counts, and total bytes.
This trend is the base trend,
collecting a broad amount of
aggregated NetFlow data for a
short period of time, used by
several other trends to further
aggregate data and store for a
longer period of time. The default
retention period for this trend is
eight days.
Trend ArcSight
Foundation/NetFlow
Monitoring/
Top Bandwidth
Usage by
Source
This trend stores top bandwidth
usage information by source,
which includes source address,
source zone, flow counts, and
total bytes. This trend depends
on the /All Trends/ArcSight
Foundation/NetFlow
Monitoring/Top Bandwidth Usage
Events trend.
Trend ArcSight
Foundation/NetFlow
Monitoring/
Top Bandwidth
Usage by
Destination
This trend stores top bandwidth
usage information by destination,
which includes destination
address, destination zone, flow
counts, and total bytes. This
trend depends on the /All
Trends/ArcSight
Foundation/NetFlow
Monitoring/Top Bandwidth Usage
Events trend.
Trend ArcSight
Foundation/NetFlow
Monitoring/
Top Bandwidth
Usage by Port
This trend stores top bandwidth
usage information by port, which
includes destination port, flow
counts, and total bytes. This
trend depends on the /All
Trends/ArcSight
Foundation/NetFlow
Monitoring/Top Bandwidth Usage
Events trend.
Trend ArcSight
Foundation/NetFlow
Monitoring/
Resource Description Type URI
23. Confidential Standard Content Guide 23
A
ArcSight Administration
overview 5
ArcSight Foundations overview 5
ArcSight System
overview 5
asset categories
Protected 11, 17
Very High 11
B
Bytes In is NULL filter 18
Bytes Out is NULL filter 18
C
content packages 6
D
dashboards
NetFlow Bandwidth Usage Overview 16
Top NetFlow Bandwidth Usage Monitoring 15
data monitors
Inbound Bandwidth (Bytes Per Second) 17
Outbound Bandwidth (Bytes Per Second) 17
E
External Source filter 18
External Target filter 18
F
filters
Bytes In is NULL 18
Bytes Out is NULL 18
External Source 18
External Target 18
Inbound Events 18
Inbound NetFlow Traffic 18
Internal Source 18
Internal Target 18
NetFlow Traffic Reporting Devices 18
NetFlow V5 Events 19
NetFlow V9 Events 18
Non-Well-Known Ports 18
Outbound Events 18
Outbound NetFlow Traffic 18
QoSient Argus Events 18
Well-Known Ports 19
G
global variables
TotalBytes 17
I
Inbound Bandwidth (Bytes Per Second) data monitor 17
Inbound Events filter 18
Inbound NetFlow Traffic filter 18
Internal Source filter 18
Internal Target filter 18
L
List of Top Bandwidth Usage Events query 20
List of Top Bandwidth Usage Events query viewer 16
N
NetFlow Bandwidth Usage Overview dashboard 16
NetFlow Traffic Reporting Devices filter 18
NetFlow V5 Events filter 19
NetFlow V9 Events filter 18
Non-Well-Known Ports filter 18
O
Outbound Bandwidth (Bytes Per Second) data monitor
17
Outbound Events filter 18
Outbound NetFlow Traffic filter 18
P
packages
deleting 10
installing 9
uninstalling 9
Protected asset category 17
Q
QoSient Argus Events filter 18
queries
List of Top Bandwidth Usage Events 20
Top Bandwidth Usage by Day - Trend on Trend 19
Top Bandwidth Usage by Destination 19
Top Bandwidth Usage by Destination - Trend 20
Top Bandwidth Usage by Destination - Trend on
Trend 19
Top Bandwidth Usage by Destination and Port 20
Top Bandwidth Usage by Hour - Trend 20
Index
24. Index
24 Standard Content Guide Confidential
Top Bandwidth Usage by Hour - Trend on Trend 19
Top Bandwidth Usage by Non-Well-Known Port 20
Top Bandwidth Usage by Port - Trend 19
Top Bandwidth Usage by Port - Trend on Trend 20
Top Bandwidth Usage by Source 19
Top Bandwidth Usage by Source - Trend 20
Top Bandwidth Usage by Source - Trend on Trend
20
Top Bandwidth Usage by Source and Port 19
Top Bandwidth Usage by Source-Destination Pairs
19
Top Bandwidth Usage by Source-Destination Pairs
and Port 20
Top Bandwidth Usage by Well-Known Port 20
Top Bandwidth Usage Events 19
query viewers
List of Top Bandwidth Usage Events 16
Top Bandwidth Usage by Destination 16
Top Bandwidth Usage by Destination and Port 17
Top Bandwidth Usage by Non-Well-Known Port 16
Top Bandwidth Usage by Source 16
Top Bandwidth Usage by Source and Port 16
Top Bandwidth Usage by Source-Destination Pairs
16
Top Bandwidth Usage by Source-Destination Pairs
and Port 16
Top Bandwidth Usage by Well-Known Port 16
R
reports
Top Bandwidth Usage by Destination 17
Top Bandwidth Usage by Destination Port 17
Top Bandwidth Usage by Source 17
Top Bandwidth Usage Daily Report 17
Top Bandwidth Usage Weekly Report 17
S
shared libraries 5
T
Top Bandwidth Usage by Day - Trend on Trend query 19
Top Bandwidth Usage by Destination - Trend on Trend
query 19
Top Bandwidth Usage by Destination - Trend query 20
Top Bandwidth Usage by Destination and Port query 20
Top Bandwidth Usage by Destination and Port query
viewer 17
Top Bandwidth Usage by Destination Port report 17
Top Bandwidth Usage by Destination query 19
Top Bandwidth Usage by Destination query viewer 16
Top Bandwidth Usage by Destination report 17
Top Bandwidth Usage by Destination trend 21
Top Bandwidth Usage by Hour - Trend on Trend query
19
Top Bandwidth Usage by Hour - Trend query 20
Top Bandwidth Usage by Hour trend 21
Top Bandwidth Usage by Non-Well-Known Port query 20
Top Bandwidth Usage by Non-Well-Known Port query
viewer 16
Top Bandwidth Usage by Port - Trend on Trend query 20
Top Bandwidth Usage by Port - Trend query 19
Top Bandwidth Usage by Port trend 21
Top Bandwidth Usage by Source - Trend on Trend query
20
Top Bandwidth Usage by Source - Trend query 20
Top Bandwidth Usage by Source and Port query 19
Top Bandwidth Usage by Source and Port query viewer
16
Top Bandwidth Usage by Source query 19
Top Bandwidth Usage by Source query viewer 16
Top Bandwidth Usage by Source report 17
Top Bandwidth Usage by Source trend 21
Top Bandwidth Usage by Source-Destination Pairs and
Port query 20
Top Bandwidth Usage by Source-Destination Pairs and
Port query viewer 16
Top Bandwidth Usage by Source-Destination Pairs query
19
Top Bandwidth Usage by Source-Destination Pairs query
viewer 16
Top Bandwidth Usage by Well-Known Port query 20
Top Bandwidth Usage by Well-Known Port query viewer
16
Top Bandwidth Usage Daily Report report 17
Top Bandwidth Usage Events query 19
Top Bandwidth Usage Events trend 21
Top Bandwidth Usage Weekly Report report 17
Top NetFlow Bandwidth Usage Monitoring dashboard 15
TotalBytes global variable 17
TotalBytes variable 14
trends
Top Bandwidth Usage by Destination 21
Top Bandwidth Usage by Hour 21
Top Bandwidth Usage by Port 21
Top Bandwidth Usage by Source 21
Top Bandwidth Usage Events 21
V
variable, TotalBytes 14
W
Well-Known Ports filter 19