The Network Monitoring content monitors network traffic and bandwidth usage. It provides statistics to identify network anomalies. Key configuration tasks include:
1. Configuring the SmartConnector to aggregate similar network events to improve performance.
2. Modeling the network and categorizing assets to activate standard content rules and filters.
3. Enabling relevant rules, configuring filters to capture needed data, and ensuring filters work as intended.
4. Configuring notifications, reports, trends, and cases to monitor the network and detect issues.


![2 Installation and Configuration
Confidential Standard Content Guide 15
b On the Filter tab in the Event conditions window, double-click the condition
Device Product = Argus [ignore case]. Delete Argus and type in the
name of your device as your device reports it to the ArcSight SmartConnector; for
example, NetFlow. Click OK.
c In the Event conditions window, double-click the condition Device Vendor =
Qosient [ignore case]. Delete Qosient and type in the name of your
device as your device reports it to the ArcSight SmartConnector; for example,
Cisco. Click OK in the condition. An example is shown below.
d Repeat Step a through Step c for each of your network monitoring devices.
e Click OK to apply changes and close the filter editor.
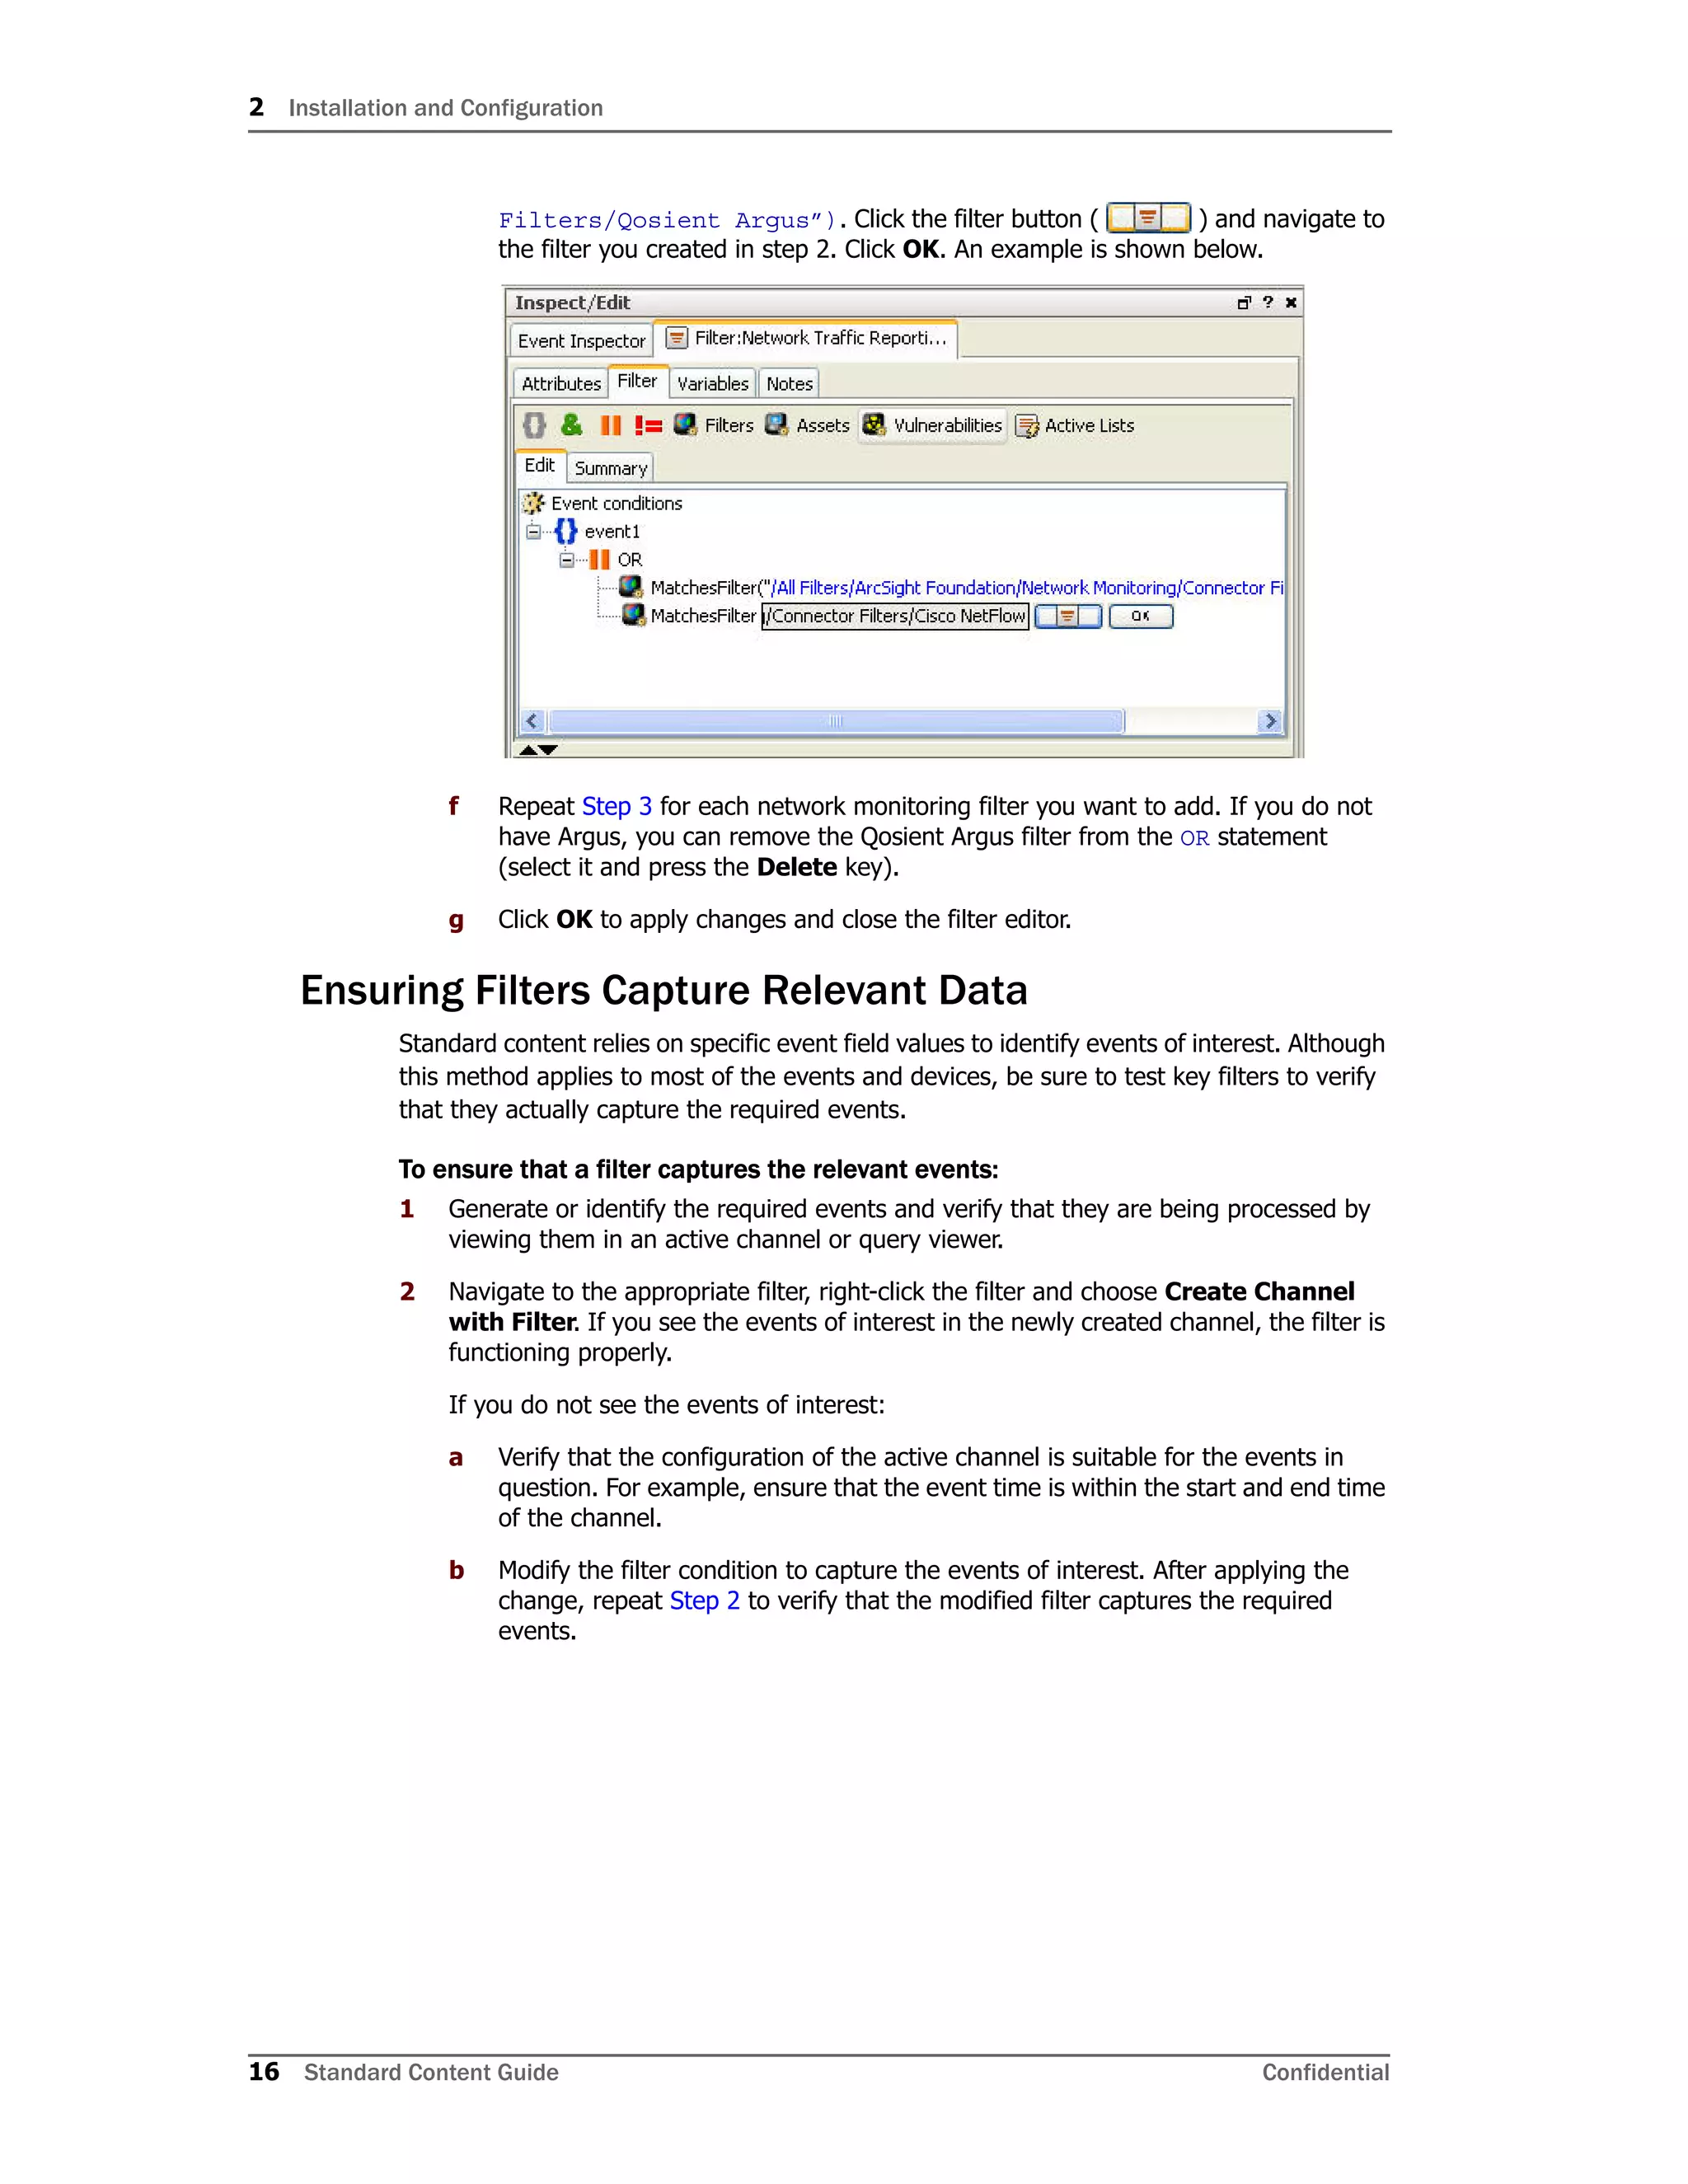
3 Modify the Network Traffic Reporting Devices filter to point to the filter(s) you created
in Step 2.
a Open the Network Traffic Reporting Devices filter in the Inspect/Edit panel.
b On the Filter tab in the Event conditions window, select event1 and click the OR
operator ( ).
c Select the first condition, MatchesFilter(“/All Filters/ArcSight
Foundation/Network Monitoring/Connector Filters/Qosient
Argus”), and select Copy from the Edit menu.
d Select the OR operator and select Paste from the Edit menu.
e Double-click the second condition, MatchesFilter(“/All
Filters/ArcSight Foundation/Network Monitoring/Connector
Depending on how you want to organize your content, you can also
express all your network reporting devices in a single filter. When
adding vendors and products to the expression, add an OR clause to
the event1 base.](https://image.slidesharecdn.com/esm5-170529110655/75/Esm5-5-scg-network-1-15-2048.jpg)