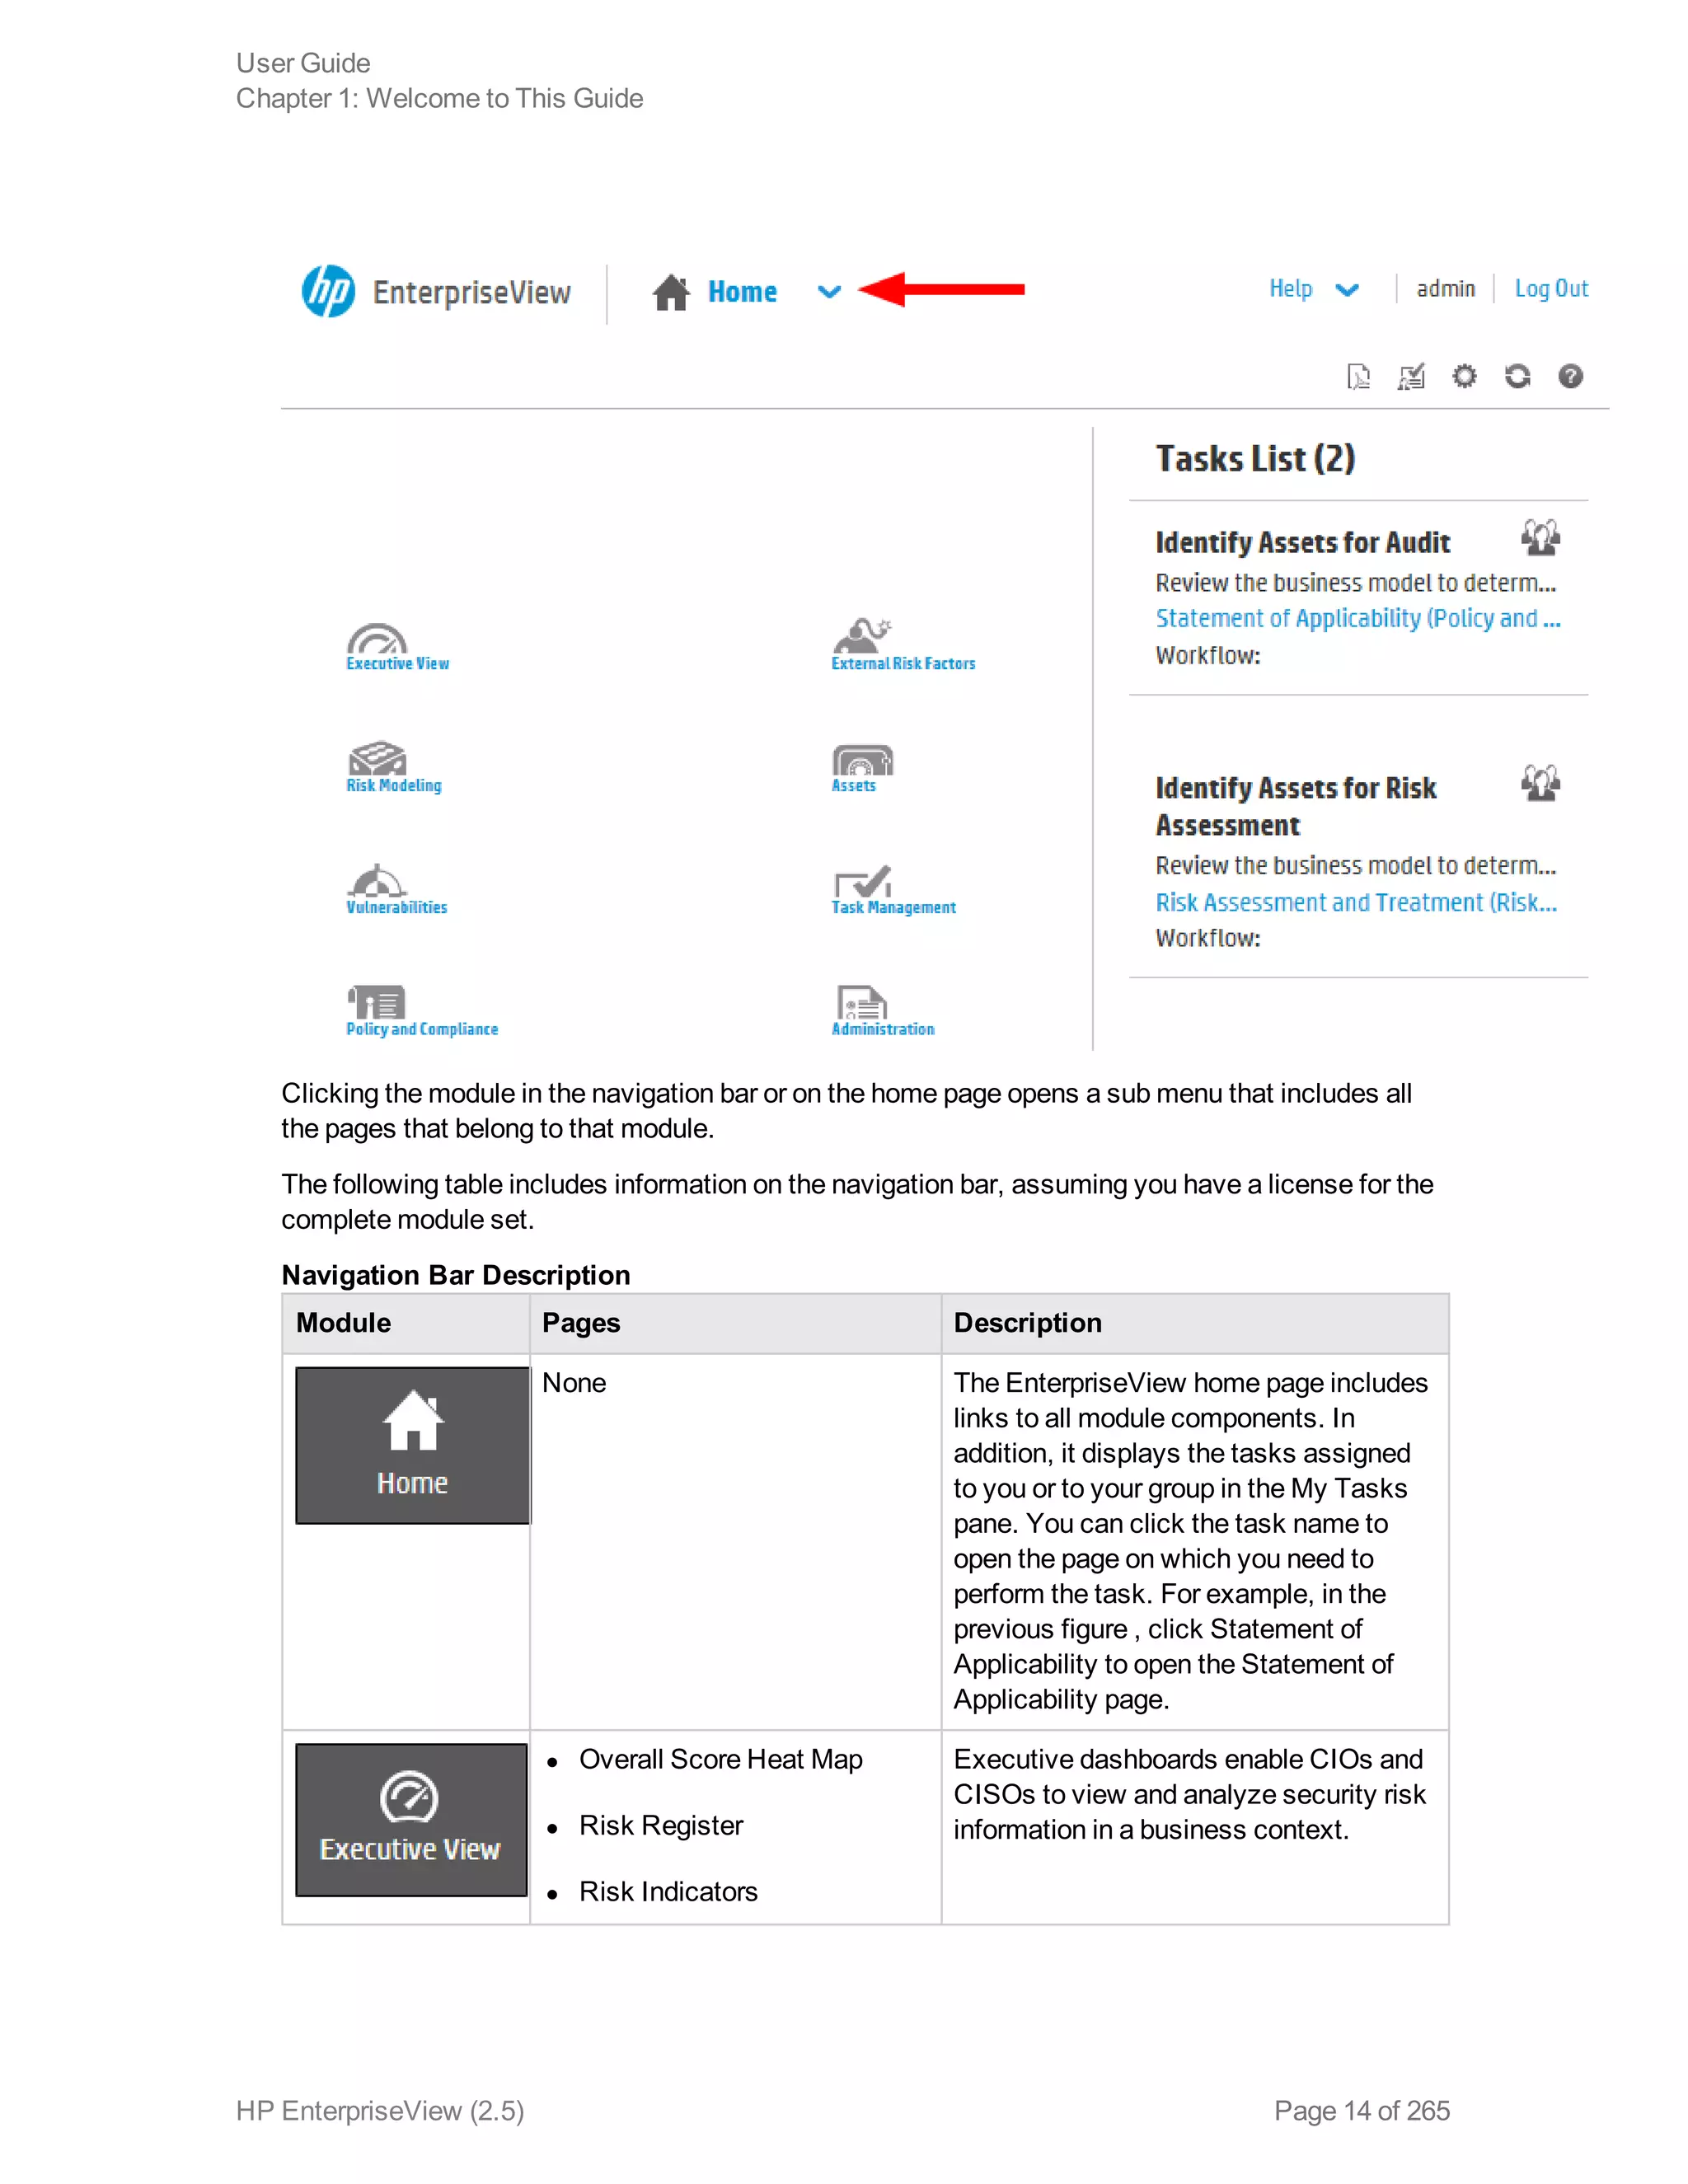
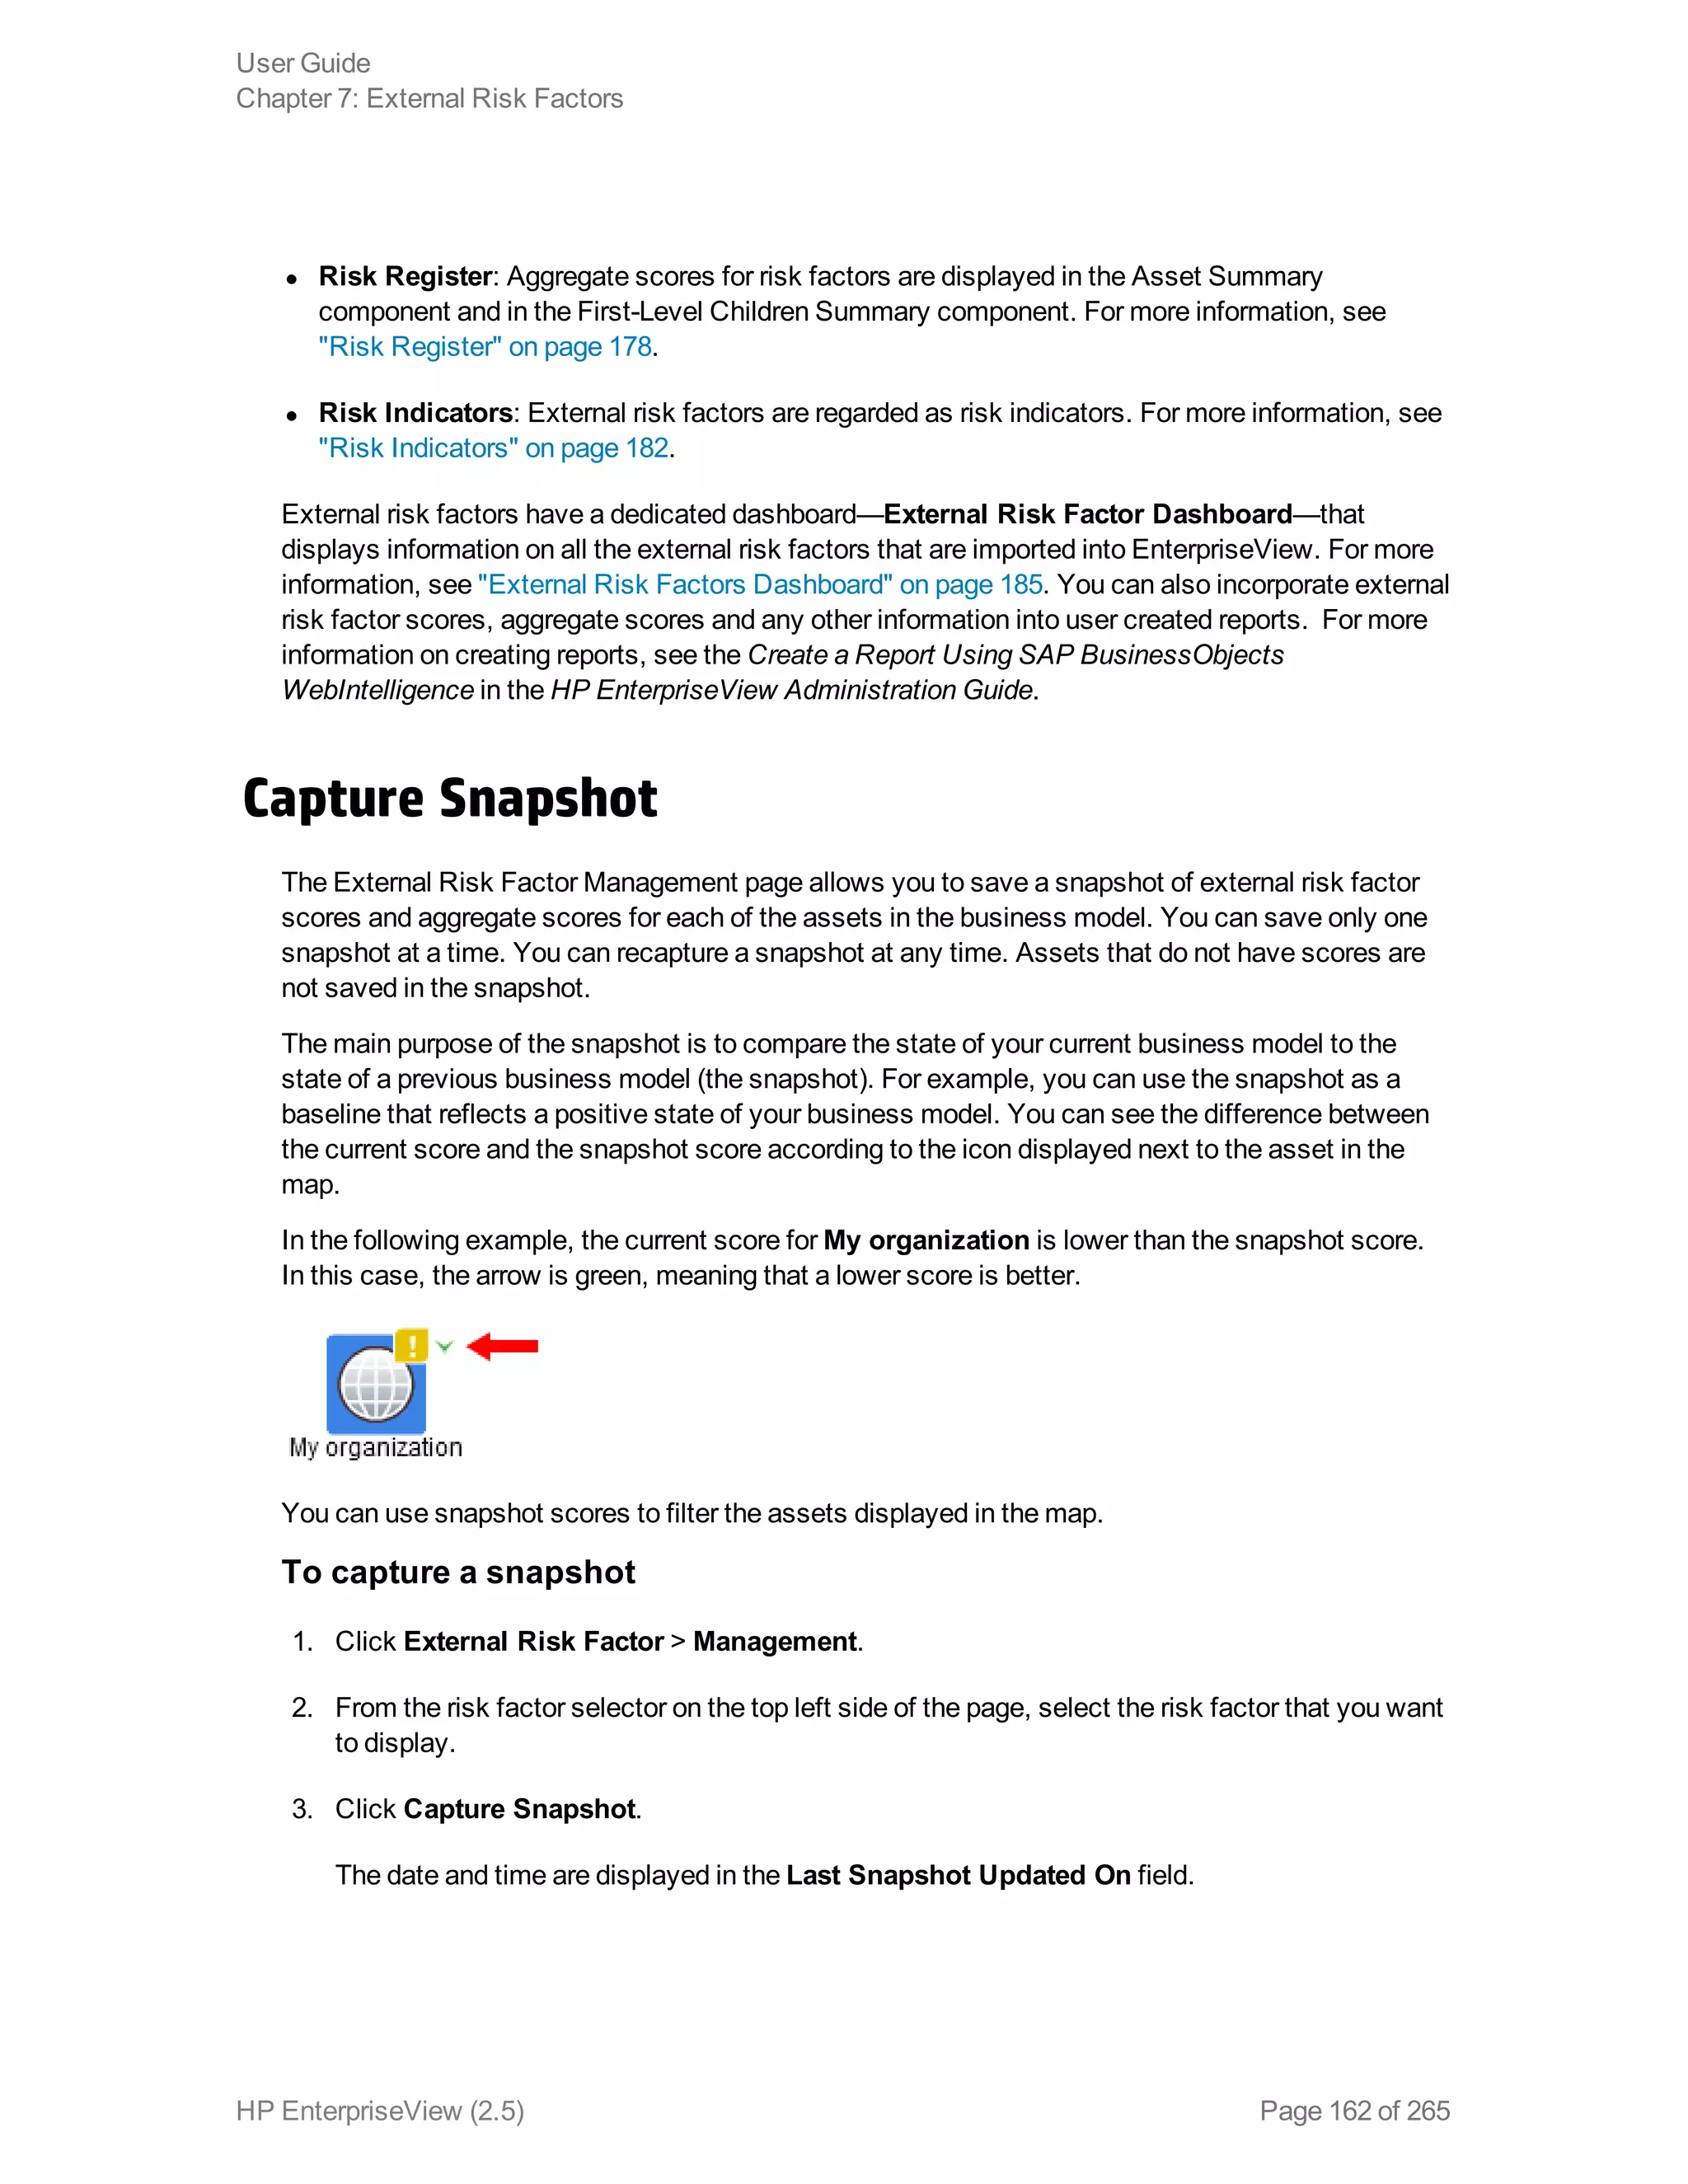
HP EnterpriseView
For the Windows Operating System
Software Version: 2.5
User Guide
Document Release Date: April 2014
Software Release Date: April 2014
Legal Notices
Warranty
The only warranties for HP products and services are set forth in the express warranty statements
accompanying such products and services. Nothing herein should be construed as constituting an
additional warranty. HP shall not be liable for technical or editorial errors or omissions contained
herein.
The information contained herein is subject to change without notice.
The network information used in the examples in this document (including IP addresses and host
names) is for illustration purposes only.
Restricted Rights Legend
Confidential computer software. Valid license from HP required for possession, use or copying.
Consistent with FAR 12.211 and 12.212, Commercial Computer Software, Computer Software
Documentation, and Technical Data for Commercial Items are licensed to the U.S. Government
under vendor's standard commercial license.
Copyright Notice
© Copyright 2011 - 2014 Hewlett-Packard Development Company, L.P.
Follow this link to see a complete statement of copyrights and acknowledgements for all ArcSight
products: http://www.arcsight.com/copyrightnotice.
Trademark Notices
Adobe™ is a trademark of Adobe Systems Incorporated.
Microsoft® and Windows® are U.S. registered trademarks of Microsoft Corporation.
UNIX® is a registered trademark of The Open Group.
This document is confidential.
Support
Visit the HP Software Support Online web site at: http://www.hp.com/go/hpsoftwaresupport
This web site provides contact information and details about the products, services, and support
that HP Software offers.
User Guide
HP EnterpriseView (2.5) Page 2 of 265
HP Software online support provides customer self-solve capabilities. It provides a fast and
efficient way to access interactive technical support tools needed to manage your business. As a
valued support customer, you can benefit by using the support web site to:
l Search for knowledge documents of interest
l Submit and track support cases and enhancement requests
l Download software patches
l Manage support contracts
l Look up HP support contacts
l Review information about available services
l Enter into discussions with other software customers
l Research and register for software training
Most of the support areas require that you register as an HP Passport user and sign in. Many also
require a support contract. To register for an HP Passport ID, go to:
http://h20229.www2.hp.com/passport-registration.html
To find more information about access levels, go to:
http://h20230.www2.hp.com/new_access_levels.jsp
HP Software Solutions Now accesses the HPSW Solution and Integration Portal Web site. This
site enables you to explore HP Product Solutions to meet your business needs, includes a full list of
Integrations between HP Products, as well as a listing of ITIL Processes. The URL for this Web
site is http://h20230.www2.hp.com/sc/solutions/index.jsp
User Guide
HP EnterpriseView (2.5) Page 3 of 265
Contents
Chapter 1: Welcome to This Guide 11
About EnterpriseView 11
What's New 12
Navigating the User Interface 13
Chapter 2: Asset Profiling 19
Business Model Authorization 19
Common Platform Enumeration 20
Manage Asset Types 21
How to Build a Business Model 23
Create a Business Model View 24
Create an Asset 25
Authorize a User to Work with an Asset 27
Connect an Asset to the Business Model 28
Search for an Asset 29
Filter Assets by a CPE 29
Disconnect an Asset from the Business Model 30
Delete an Asset 30
Add a CPE to an Asset 31
Asset Properties 32
Asset Profiling Window 35
Chapter 3: Policy and Compliance 42
About Unified Compliance Framework 43
Manage Policies 45
Create a Policy 45
Activate a Policy 47
Import a Policy 47
Delete a Policy 48
Set Statement of Applicability 48
User Guide
Contents
HP EnterpriseView (2.5) Page 4 of 265
Audit Assets 50
Assess Asset Compliance 51
Assess Control Maturity 52
Clear Assessment on Assets 54
Control to Vulnerability Mapping 54
Use Configuration Vulnerabilities to Determine Compliance Score 55
Use Network and Application Vulnerabilities to Refine Compliance Score 56
Map Controls to Vulnerabilities 57
Edit Control to Vulnerability Mapping 57
Delete Vulnerability to Control Mapping 58
Policy Mapping 59
About the Policy Mappings Import Job 59
Import UCF Mappings 59
Map Controls 60
Search for Controls 61
Delete Mapping Between Controls 61
Policy Mapping Window 62
Configure Compliance and Maturity Score Ranges 63
Policy Builder Window 64
Policy and Compliance Assessment Window 70
P5 Control Maturity Model Guidelines 76
Control Scores Aggregation Mechanism 77
Aggregation on the Business Model Level 79
Aggregation on Policy Level 81
Weights and Criticality Level 83
Chapter 4: Risk Management 85
Create a Threat Library 86
Create an Actor 87
Create an Operation 88
Connect Actor to Operation 88
Disconnect Actor from Operation 89
User Guide
Contents
HP EnterpriseView (2.5) Page 5 of 265
Assign Threats to Assets 89
Assess the Risk on an Asset 92
Risk Treatment 93
About Risk Treatment Methods 93
Mitigate Risk Automatically Using Policy Controls 95
Map Controls to Threats 96
Edit Control to Threat Mapping 97
Delete Control to Threat Mapping 97
Create a Treatment Plan 98
Mitigate Risk 99
Add a Control Action 100
Add a Manual Action 102
Accept Risk 104
Defer Risk 104
Transfer Risk 105
Avoid Risk 106
Risk Settings 106
Configure Risk Score Aggregation Method 107
Configure Risk Assessment Settings 107
Configure Risk Score Ranges 109
Configure Asset Risk Settings 110
Risk Score Aggregation Mechanism 110
Residual Risk Score Calculation 112
Impact Score Calculation 112
Threat Library Builder Window 115
Threat Assignment Window 119
Risk Assessment and Treatment Window 123
Chapter 5: Vulnerability Management 129
Vulnerability Types 130
Web Application 130
Network 130
User Guide
Contents
HP EnterpriseView (2.5) Page 6 of 265
Configuration 130
Common Vulnerability Scoring System 131
Configuration Vulnerabilities Scoring Method 131
About the Vulnerability Life Cycle 133
Manage the Vulnerability Life Cycle 135
Attach a Vulnerability to an Asset 135
Vulnerability Settings 136
Configure Asset Vulnerability Score Aggregation Parameters 136
Configure Vulnerability Score Ranges 137
Configure Asset Vulnerability Score Formula 137
Vulnerability Properties 140
Asset Vulnerability Score Aggregation Mechanism 147
Vulnerability Error Handling 148
Vulnerability Management Window 149
Vulnerability Assignment Window 153
Vulnerability Dictionary 156
Chapter 6: Key Performance Indicators 158
Configure KPI Settings 158
Out-of-the-Box KPIs 159
Chapter 7: External Risk Factors 161
Capture Snapshot 162
Edit External Risk Factor Score 163
Configure External Risk Factor Ranges 163
Configure External Risk Factor KPI Settings 164
External Risk Factor Management Window 164
Out-of-the-Box Risk Factors 173
Chapter 8: Dashboards and Reports 174
Printing Reports 175
Root Cause Analysis 177
Risk Register 178
Overall Score Heat Map 181
User Guide
Contents
HP EnterpriseView (2.5) Page 7 of 265
Risk Indicators 182
External Risk Factors Dashboard 185
Risk Modeling Dashboard 187
Risk Heat Map and Scorecard 189
Compliance Dashboard 191
Compliance by Policy Dashboard 192
Policy Compliance Map 194
Vulnerability Dashboard 195
Task Management Dashboard 197
EnterpriseView Universe 199
Chapter 9: Task Management 238
Manage Workflow Templates 239
Create a Workflow Template 239
Upload a Workflow Template to EnterpriseView 243
Edit a Workflow Template 243
Delete a Workflow Template from EnterpriseView 244
Manage Workflows 244
Create a New Workflow 245
Delete a Workflow 246
Edit Workflow Properties 247
Change the Task Group 247
Manage Your Tasks 248
Workflow Properties 250
Task Properties 251
Workflow Management Window 253
EnterpriseView Page IDs 259
Workflow Template Shape Repository 260
Chapter 10: Settings 261
Configure Overall Score Formula Weights 263
Configure Asset Overall Score Ranges 264
Configure Criticality Level Ranges 264
User Guide
Contents
HP EnterpriseView (2.5) Page 8 of 265
Configure Risk Mitigation Workflow Templates 265
User Guide
Contents
HP EnterpriseView (2.5) Page 9 of 265
Page 10 of 265HP EnterpriseView (2.5)
User Guide
Contents
Chapter 1: Welcome to This Guide
Welcome to HP EnterpriseView User Guide. This guide provides you with information about all of
the operational aspects of EnterpriseView.
This guide is intended for all EnterpriseView users.
This guide includes the following chapters:
"Asset Profiling" on page 19
"Policy and Compliance" on page 42
"Risk Management" on page 85
"Vulnerability Management" on page 129
"Key Performance Indicators" on page 158
"External Risk Factors" on page 161
"Dashboards and Reports" on page 174
"Task Management" on page 238
"Settings" on page 261
About EnterpriseView
EnterpriseView is a framework that enables Chief Information Officers (CIOs) and Chief
Information Security Officers (CISOs) to analyze security risk information in a business context
and prioritize actions to minimize that risk. By tying IT risk and compliance information to business
services it ensures alignment with management objectives. EnterpriseView bridges the gap
between IT operations and the security office by interconnecting and consolidating business
processes across the organization and establishing a rational basis for decision making. This
product incorporates a holistic, enterprise approach, streamlining and integrating risk, compliance,
threat and vulnerability information, while providing a business context to executives. It anticipates
threats and provides continuous monitoring, by regularly updating and testing security related
functions.
HP EnterpriseView (2.5) Page 11 of 265
The main modules in EnterpriseView are:
l Policy and Compliance Management: This module enables you to assess and audit the
assets in your organization. Use the policy builder to create customized policies and the
Statement of Applicability (SoA) feature to apply controls to assets. EnterpriseView includes
out-of-the-box policies, such as Unified Compliance Framework (UCF) enabling "audit once -
comply with many" functionality.
l Risk Management: This module enables you to manage all aspects of the risk life cycle. Use
the flexible and expandable threat library to define the threats that may potentially harm your
organization, create threat scenarios by assigning threats to assets, analyze the risk and
specify its impact and likelihood, and mitigate the risk by using controls or other effective
actions.
l Vulnerability Management: This module collects vulnerabilities from vulnerability assessment
tools, removes duplicates, assigns them to assets, and prioritizes them accordingly, allowing
you to manage the remediation process.
l External Risk Factors: This module enables you to import risk factor information from external
sources, manage it and display it on top of the business model and in dashboards.
l Asset Management: Assets are the building blocks of the business model, which is the
foundation for all core EnterpriseView functionality. The business model depicts the entire
organization from high-level business assets to low-level IT assets, on which policy, risk, and
vulnerability operations are performed. You can create the business model by synchronizing
EnterpriseView with an external asset repository or by creating it by using the Assets module.
l Dashboards and Reports: This module includes sophisticated executive dashboards, such as
Risk Register, and reports, and enables you to create your own customized dashboards and
reports.
l Task Management: EnterpriseView enables you to create, manage, and monitor workflows.
Use workflows to structure and streamline your organization’s processes and assign tasks to
the relevant people.
What's New
This topic describes the new features and enhancements added in this release.
Configuration Vulnerabilities
EnterpriseView now supports the import of configuration vulnerabilities from scanners, along with
network and application vulnerabilities that have been supported until now. For more information on
configuration vulnerabilities, see "Vulnerability Types" on page 130. The vulnerability lifecycle has
been updated to accommodate configuration vulnerabilities, as well as the control to vulnerability
mapping capabilities. Configuration vulnerabilities have a different and stronger affect on controls
than network and application vulnerabilities; they can be used to fully determine the compliance of
User Guide
Chapter 1: Welcome to This Guide
HP EnterpriseView (2.5) Page 12 of 265
an asset with a control and are regarded as an automatic means of assessment. For more
information, see "Use Configuration Vulnerabilities to Determine Compliance Score" on page 55.
Enhanced External Risk Factor Management Capabilities
EnterpriseView now includes an External Risk Factor Management page, allowing you to centrally
manage all of your external risk factors on top of your business model. On this page you can
compare the state of your risk posture using snapshots, use advanced search and filter capabilities
to create different view on your business model, and edit scores manually. For more information,
see "External Risk Factors" on page 161.
New HP Experience Look and Feel
A new clean and crisp look and feel that enhances the user experience across the entire
application.
New Navigation Panel and Toolbar
This version of EnterpriseView includes a new navigation panel and a general toolbar, that appears
on all EnterpriseView pages and includes capabilities such as refresh, access to My Tasks, access
to Settings, report generation, and context sensitive help, providing a better user experience across
the application. For more information, see "Navigating the User Interface " below.
Navigating the User Interface
You can navigate the EnterpriseView user interface using the navigation bar or by clicking on the
module name in the home page. The navigation bar and the home page provide you access to all the
modules and pages in EnterpriseView.
The module pages to which you have access depend on the following factors:
l Your EnterpriseView license. Modules for which you are not licensed are disabled.
l Your role. Pages that you do not have permissions for are not displayed.
The content to which you have access to depends on your authorization. For more information, see
"Business Model Authorization" on page 19.
EnterpriseView stores the last asset and policy element that you worked on. When you navigate
EnterpriseView, the UI pages appear in the context of that asset or that policy element. For
example, you can view statistical information for a specific asset in the different dashboards
without having to select the asset in every dashboard. The context is also saved when you log out.
The navigation bar
To access the navigation bar, click Home.
User Guide
Chapter 1: Welcome to This Guide
HP EnterpriseView (2.5) Page 13 of 265
Clicking the module in the navigation bar or on the home page opens a sub menu that includes all
the pages that belong to that module.
The following table includes information on the navigation bar, assuming you have a license for the
complete module set.
Module Pages Description
None The EnterpriseView home page includes
links to all module components. In
addition, it displays the tasks assigned
to you or to your group in the My Tasks
pane. You can click the task name to
open the page on which you need to
perform the task. For example, in the
previous figure , click Statement of
Applicability to open the Statement of
Applicability page.
l Overall Score Heat Map
l Risk Register
l Risk Indicators
Executive dashboards enable CIOs and
CISOs to view and analyze security risk
information in a business context.
Navigation Bar Description
User Guide
Chapter 1: Welcome to This Guide
HP EnterpriseView (2.5) Page 14 of 265
Module Pages Description
l Risk Heat Map and
Scorecard
l Risk Modeling Dashboard
l Threat Library Builder
l Threat Assignment
l Risk Assessment and
Treatment
l Control to Threat Mapping
Use the flexible and expandable threat
library to define threat scenarios for the
assets in your organization's business
model and specify impact and probability
to calculate their risk.
l Vulnerability Dashboard
l Vulnerability Assignment
l Vulnerability Management
l Vulnerability Dictionary
Manage and remediate the
vulnerabilities according to their severity
and the criticality level of your assets.
l Compliance by Policy
Dashboard
l Compliance Dashboard
l Compliance Map
l Policy Builder
l Statement of Applicability
l Policy and Compliance
Assessment
l Policy Mapping
l Control to Vulnerability
Mapping
Define policies or use out-of-the-box
policies to define a statement of
applicability and perform audit.
l External Risk Factors
Dashboard
l External Risk Factors
Management
View and analyze risk factor information
imported into EnterpriseView from
external sources.
Navigation Bar Description, continued
User Guide
Chapter 1: Welcome to This Guide
HP EnterpriseView (2.5) Page 15 of 265
Module Pages Description
Asset Profiling Create and manage a business model
that depicts your organization from high-
level business assets to low-level IT
assets, on which policy, risk, and
vulnerability management is performed.
l Task Management
Dashboard
l Workflow Management
Create, manage, and monitor workflows.
Use workflows to structure and
streamline your organization’s
processes and assign tasks to the
relevant people.
l Audit Log
l Configuration
l Job Management
l User Management
l Dashboard Builder
l KPI Management
Administer EnterpriseView by creating
customized dashboards, managing roles
and permissions, monitoring batch jobs
and managing application settings.
Navigation Bar Description, continued
The toolbar
The EnterpriseView toolbar appears on every page except for the Configuration page. The toolbar
appears on the top right side of every page.
User Guide
Chapter 1: Welcome to This Guide
HP EnterpriseView (2.5) Page 16 of 265
The toolbar includes the tools described in the following table.
Tool Description
Generate
Report
Generate Report
Click this button to generate a report.
Select a report from the list of reports. If you are prompted, select to always allow
pop-ups from the EnterpriseView server. You can save the report as a PDF.
This button does not appear on pages that do not have reports. If you create a report
for that page and assign it to the category of that page, then the button will appear on
the toolbar.
My
Tasks
Click this button to open the My Tasks dialog box. For more information, see
"Manage Your Tasks" on page 248.
Settings
Click this button to open the Settings dialog box. For more information, see
"Settings" on page 261.
Toolbar Description
User Guide
Chapter 1: Welcome to This Guide
HP EnterpriseView (2.5) Page 17 of 265
Tool Description
Refresh
Click this button to refresh the information on this page.
Help on
this
page
Click this button to open the help relevant to this page.
Toolbar Description, continued
The Tasks List
For information on the Tasks List, see "Manage Your Tasks" on page 248.
User Guide
Chapter 1: Welcome to This Guide
HP EnterpriseView (2.5) Page 18 of 265
Chapter 2: Asset Profiling
In EnterpriseView, an asset is an entity that represents a physical or logical resource in the system.
For example, assets can represent hardware, software, services, people, documents or business
units.
Assets are the building blocks of the business model. They are organized into a hierarchical format
based on the dependencies in your organization’s IT environment.The EnterpriseView business
model depicts the entire IT environment, from the highest level of the organization (such as an
office location or a line of business) to the lowest level (such as a software application). Each entity
in the EnterpriseView business model is an asset. For more information on building a business
model, see "How to Build a Business Model" on page 23.
The business model is the foundation for all core EnterpriseView functionality. Using a business
model, risk and regulation compliance (policies) can be assessed effectively, providing "apply
once—affect all" capabilities. Policies can be applied to top level assets and trickled down to all
lower level assets that belong to that hierarchy. Conversely, risk assessments and policy audits
can be performed on lower level assets and then trickled up and aggregate to top level assets,
providing a business centric analysis of security risk and policy compliance. Data analysis,
scorecards, and reports can be viewed on all asset levels, providing stakeholders in an organization
with access to data that is relevant to their role. An extensive business model provides
EnterpriseView users with more accurate information about the organization's overall risk.
Assets in the business model are restricted to authorized users, with the exception of the
Administrator, who is automatically authorized to work on the entire business model. For more
information, see "Business Model Authorization" below.
There are many different types of assets, which are divided into categories. For more
information,see "Manage Asset Types" on page 21.
Business Model Authorization
When EnterpriseView is first deployed, there is only one asset defined: My Organization. All other
assets must be imported from an external asset repository or created manually. The Administrator
(the user defined during installation) is the only user who is automatically authorized to view or edit
all assets in EnterpriseView. Users must be authorized to work with at least one asset in order to
work on any page in EnterpriseView that is associated with assets (has an asset selector
component), primarily, the Asset Profiling page. Therefore, when creating the business model, the
Administrator must grant users and groups access rights to work with assets that are relevant to
them. This does not mean that the Administrator must create the entire business model. The
Administrator can authorize users that have EDIT ASSETS permissions (such as Asset Profilers)
 to work on select business model branches. After these users are authorized, they can continue
creating the business model and authorizing other EnterpriseView users and groups to work with
the assets that are relevant to them. To authorize users to work with an asset, see "Authorize a
User to Work with an Asset" on page 27.
HP EnterpriseView (2.5) Page 19 of 265
The access rights of a user determine the scope of action that the user has in EnterpriseView. For
example, a user with a Policy Auditor role with access rights to the Main Office asset, will be able to
see the Main Office branch in the business model and perform an audit on that branch. This user will
not be able to see any other assets in EnterpriseView. This concept is applied throughout
EnterpriseView and includes all the pages, dashboards, and printable reports.
Asset access rights are automatically inherited from parent assets, therefore, when a user is
authorized to work on an asset, the user can also work on all of the asset's children. Access rights
can be granted on any asset, but can be revoked only on the asset on which they were granted;
inherited access rights cannot be revoked.
Assets that are unattached can be viewed or edited by any user that has EDIT ASSETS
permissions. After an asset is attached to the business model, only authorized users can work with
the asset.
Common Platform Enumeration
Common Platform Enumeration (CPE) is a structured naming scheme for describing and identifying
classes of applications, operating systems, and hardware devices present among an enterprise’s
computing assets. The official version of the CPE Product Dictionary is maintained by National
Institute for Standards and Technology (NIST).
In EnterpriseView, a CPE is primarily an asset property that helps identify the asset by using this
standardized method. But it is also one of the vulnerability properties, for the vulnerabilities defined
in the vulnerability dictionary.This means that you can use CPEs as a source of information for
identifying potential vulnerabilities on your organizations assets. CPEs are updated along with the
vulnerability dictionary.
A CPE has the following URI-based format:
cpe:/<part>:<vendor>:<product>:<version>:<update>:<edition>:<language>
The part field includes one of the following values: 
l a for applications
l h for hardware platforms
l o for operating systems
Fields at the end of the URI can be left off.
For example:
cpe:/a:hp:loadrunner:11.50.
This format is based on the CPE 2.2 version, although the CPEs in the dictionary are from version
2.3.
User Guide
Chapter 2: Asset Profiling
HP EnterpriseView (2.5) Page 20 of 265
When you create assets locally, you can add or removes CPEs to these assets, as required. But
when you import assets from an external asset repository, you cannot add or remove their
corresponding CPEs.
CPEs are supported when you import assets from a CSV file or from ESM; they are not supported if
you import assets from UCMDB.
Note: If your business model is based on ESM, CPEs are derived from data found in
ESM asset categories. This means that your business model must be category-based in order
to include CPEs.
Manage Asset Types
EnterpriseView includes the following asset categories:
l Organization: Includes only one asset type—Organization. The Organization is the starting
point of the business model. EnterpriseView includes a predefined Organization asset.
l Location: Includes types such as Country, City, and Building.
l Business: Includes a business reference or a line of business, such as online banking.
l IP: Includes only one asset type—IP Address. EnterpriseView supports both IPv4 and IPv6.
l Infrastructure Elements: Includes hardware, such as a computer (network entity) or a printer.
l Running Software: Includes software applications, such as a mail server or a database.
l People: Includes groups and individuals.
l Documents: Includes one asset type—Document.
Each of these categories includes various predefined asset types. In addition to the asset types
that come with EnterpriseView, you can add new asset types to any category, except the
Organization category, which includes only one Organization asset.
You can also edit or delete an asset type.
Note: Deleting or renaming an asset type in the Configuration module only affects new assets;
they do not affect existing assets in the business model. Existing assets of the deleted or
renamed type are displayed with a question mark icon.
To add an asset type
1. Click Administration > Configuration.
User Guide
Chapter 2: Asset Profiling
HP EnterpriseView (2.5) Page 21 of 265
2. In the Configuration module, in the left pane, click Asset Management > Asset Type
Categories, and then click the asset category to which you want to add an asset type.
3. In the right pane, click the Add configuration to configuration set button, and then do
the following:
n In the Type box, enter the internal name of the asset type.
n In the Label box, enter the display name of the asset type.
n From the Icon list, select the image for the asset type icon.
4. Save and apply the configuration changes. For more information, see the Save and Apply
Configuration Changes section in the HP EnterpriseView Deployment Guide.
To edit an asset type
1. Click Administration > Configuration.
2. In the Configuration module, in the left pane, click Asset Management > Asset Type
Categories, and then click the asset category to which the asset type that you want to edit
belongs.
3. In the right pane, make the required changes for the asset type that you want to change.
4. Save and apply the configuration changes. For more information, see the Save and Apply
Configuration Changes section in the HP EnterpriseView Deployment Guide.
To delete an asset type
1. Click Administration > Configuration.
2. In the Configuration module, in the left pane, click Asset Management > Asset Type
Categories, and then click the asset category from which you want to delete an asset type.
3. In the right pane, click the asset type that you want to delete, and then click the Remove
configuration from the configuration set button.
4. Save and apply the configuration changes. For more information, see the Save and Apply
Configuration Changes section in the HP EnterpriseView Deployment Guide.
User Guide
Chapter 2: Asset Profiling
HP EnterpriseView (2.5) Page 22 of 265
How to Build a Business Model
There are two ways to build a business model in EnterpriseView:
l Import: you can synchronize EnterpriseView with the external asset repository that is the
primary asset management system in your organization.
Note: You can add assets that you created in EnterpriseView to an imported business
model.
l Create locally: you can use EnterpriseView as the primary asset management system of your
organization and build a business model within EnterpriseView.
The following procedures outline the steps for creating a business model in EnterpriseView.
To import a business model
1. Follow the instructions in the Synchronize Assets with External Asset Repository section in
the HP EnterpriseView Deployment Guide.
2. During the first import, all imported assets are saved as Unattached. Follow the instructions in
"Connect an Asset to the Business Model" on page 28. Repeat this process until all imported
assets are connected to the business model.
Creating the business model from imported assets is a one-time task. After the business
model is created, each subsequent synchronization automatically updates the business model
for all existing assets, and only newly introduced assets are saved as unattached.
3. Authorize users to work with assets, as described in "Authorize a User to Work with an Asset"
on page 27.
To build a local business model
1. Review the predefined asset types.
a. Click Administration > Configuration.
b. In the Configuration window, click Asset Management > Asset Type Categories.
c. Review the asset types for all categories to see whether they reflect the asset types
required by your organization's business model.
d. If required, add asset types, as described in "Manage Asset Types" on page 21.
User Guide
Chapter 2: Asset Profiling
HP EnterpriseView (2.5) Page 23 of 265
2. Create the business model.
a. Click Assets > Asset Profiling.
b. In the Asset Profiling window, click the New tab. The predefined My organization asset
icon is displayed in the map area.
c. Click the My organization asset.
d. In the asset card, click the Edit Asset Properties button, and enter the asset name
and any other information that you have on this asset.
e. Follow the instructions in "Create an Asset" on the next page to add assets to the business
model.
f. For each asset that you create, authorize users to work with it, as described in "Authorize a
User to Work with an Asset" on page 27
Create a Business Model View
A view is a specific business model composition that displays only the assets that you want to see
on the map. A view allows you to concentrate on the assets that interest you the most without being
distracted by the multitude of assets in your organization. You can create multiple views that allow
you to manage different parts of the organization. For example, you can create a view that includes
only business assets that belong to a major office, or a view that includes only servers in a specific
office building.
You can create views in the following pages:
l Asset Profiling
Views on this page include asset composition.
l Risk Indicators
Views on this page include asset composition and the risk factor.
l External Risk Factor Management
Views on this page include asset composition, the risk factor, and the score type.
The views are not shared between pages, meaning that you must create separate views for each
page.
After you save the view, when you reopen the page, the business model displayed in the map area
is resized to the default zoom and to fit to window.
You can also modify a view.
Assets that were disconnected from the business model are not displayed in the view.
User Guide
Chapter 2: Asset Profiling
HP EnterpriseView (2.5) Page 24 of 265
To create a new view
1. Click Assets > Asset Profiling.
Note:
n To create a view in the Risk Indicators page, click Executive View > Risk
Indicators.
n To create a view in the External Risk Factors Management page, click External
Risk Factors >Management.
2. In the business model map, expand and collapse assets as needed, to create the map
composition that you require.
3. In the toolbar, click the arrow next to the Save button, and then click Save New View.
4. In the Save View dialog box, in the Name box, enter a name for the view, and then click OK.
The view that you created is added to the list of views and are available from the You are
viewing list.
To modify an existing view
1. Click Assets > Asset Profiling.
Note:
n To modify a view in the Risk Indicators page, click Executive View > Risk
Indicators.
n To modify a view in the External Risk Factors Management page, click External
Risk Factors >Management.
2. From the You are viewing list, select the view that you want to modify.
3. Make the required changes to the view.
4. Click Save.
Create an Asset
New assets must be connected to the business model. You cannot create an unattached asset, but
you can create a new asset and then detach it from the business model. For more information, see
"Disconnect an Asset from the Business Model" on page 30.
User Guide
Chapter 2: Asset Profiling
HP EnterpriseView (2.5) Page 25 of 265
To create an asset
1. Click Assets > Asset Profiling.
2. Search for the source (parent) asset, as described in "Search for an Asset" on page 29, or click
the asset in the map.
3. In the asset's asset card, click the Connect to another asset (mark as source asset)
button.
The connection panel is displayed in the map area.
4. In the left pane, click the New tab.
5. On the New tab, click the asset type that you want to create and connect to the business
model.
6. In the left pane, click the Create as target asset button. This asset will be connected to
the business model as a child asset.
7. In the connection panel, click Create and Connect.
The asset is added to the business model and the Edit Asset Properties dialog box opens.
8. In the Edit Asset Properties dialog box, enter the relevant information, and then click Save.
For a detailed description on asset properties, see "Asset Properties" on page 32.
9. To cancel the connection, in the connection panel, click Cancel.
You can also drag the asset from the New tab and drop it on the parent asset in the map area.
For example, to create a city asset under the My organization asset, drag the City asset from
the left pane and drop it on the My organization asset in the map area. The following path is
created:
User Guide
Chapter 2: Asset Profiling
HP EnterpriseView (2.5) Page 26 of 265
Authorize a User to Work with an Asset
By default, the Administrator has access rights to all assets and the asset owner is automatically
authorized to work with the asset; all other users must be authorized manually. For detailed
information on authorization, see "Business Model Authorization" on page 19.
Note: You must have access rights to at least one asset in order to perform this task.
To authorize a user to work with an asset
1. Click Assets > Asset Profiling.
2. Search for the asset to which you want to grant access rights, as described in "Search for an
Asset" on page 29.
3. Click the asset in the search results, and then click the Edit Asset Properties button.
4. In the Edit Asset Properties dialog box, click the Authorized Users tab.
5. In the Search for Users or Groups box, enter the name or the partial name of the user or
group that you want to add to the list of authorized users, and then click Add.
6. Click Save.
The user that you added to the list now has access rights to the asset and all of its children.
User Guide
Chapter 2: Asset Profiling
HP EnterpriseView (2.5) Page 27 of 265
Connect an Asset to the Business Model
You can connect unattached assets to the business model or connect assets that are already part
of the business model to a different parent asset.
There are two scenarios in which assets are saved as unattached in EnterpriseView:
l Assets are saved as unattached the first time that they are imported from an external asset
repository. After the business model is created, each subsequent synchronization automatically
updates the business model for all existing assets, and only newly introduced assets are saved
as unattached.
l Assets that have been disconnected from the business model are also saved as unattached.
To connect an asset to the business model
1. Click Assets > Asset Profiling.
2. In the left pane, click the Unattached tab and find the asset that you want to connect to the
business model, or search for the asset, as described in "Search for an Asset" on the next
page.
3. Click the Mark as target asset button. This asset will be connected to the business model
as a child asset.
The connection panel is displayed in the map area.
4. Search for the source (parent) asset, as described in "Search for an Asset" on the next page or
click the asset in the map.
5. In the asset card of the source parent, click the Connect to another asset (mark as source
asset) button.
6. In the connection panel, click Connect.
The asset is added to the business model.
7. To cancel the connection, in the connection panel, click Cancel.
Note: You can also drag the asset from the left pane and drop it on the parent asset in the map
area.
User Guide
Chapter 2: Asset Profiling
HP EnterpriseView (2.5) Page 28 of 265
Search for an Asset
You can search for a name or a partial name of any asset, either attached to the business model or
unattached, in the Search tab. You can also search for an asset according to the user or group that
is authorized to work on that asset.
To search for an asset
1. Click Assets > Asset Profiling, and then, in the left pane, click the Search tab.
2. In the Search asset name box, enter the asset name or a partial asset name, and then press
ENTER.
The search results are displayed in the left pane. The two immediate parent assets are
displayed next to each asset that is found.
3. Click Advanced to search by asset category or type. Select the category or type from the list,
and then click Search.
4. To display the asset in the business model map, click the Show on Map button.
To search for an asset by user or group
1. Click Assets > Asset Profiling, and then, in the left pane, click the Authorized User tab.
2. In the Search asset by user or group box, enter the name of the user or group according to
which you want to search, and then press ENTER.
The search results are displayed in the left pane.
Note: Only assets on which the user or group are authorized to work on directly (as
opposed to assets that inherited the access rights) are displayed.
Filter Assets by a CPE
You can filter assets by a CPE in order to create a business model view that is product or vendor
specific. For example, you can create a filter that displays a segment of the business model that
includes only servers that host an Oracle database. For more information on CPEs, see "Common
Platform Enumeration" on page 20.
The filter is applied to the entire Asset Profiling page. This means that if you filter the page and
search for assets, you will receive search results out of the filtered results.
User Guide
Chapter 2: Asset Profiling
HP EnterpriseView (2.5) Page 29 of 265
To filter assets by a CPE
1. Click Assets > Asset Profiling.
2. In the Asset Profiling page, in the Filter by CPEs box, enter the CPE 
(vendor:product:version) or a partial CPE (vendor:product).
The business model is collapsed.
3. Expand the business model to display the assets that are associated with the CPE.
The assets that are displayed in the map in the business model are assets that are directly
associated with the CPE and their parent assets. The full hierarchy is displayed.
Disconnect an Asset from the Business Model
To disconnect an asset from the business model you must delete the relationship between the
asset and its parent.
You can delete only relationships that you created within EnterpriseView. You cannot delete
relationships that you imported from an external asset repository.
If the asset has only one parent, then when it is disconnected, it is saved as unattached; the asset
itself is not deleted. If the asset has more than one parent, then it remains in the business model.
Disconnected assets can be reconnected to the business model at any time.
To disconnect an asset from the business model
1. Click Assets > Asset Profiling.
2. Search for the asset that you want to disconnect, as described in "Search for an Asset" on the
previous page.
3. In the Search tab, click the asset that you want to disconnect, and then click the Show on
Map button.
4. In the map area, click the relationship between the asset that you want to disconnect and its
parent asset, and then press DELETE.
5. Click Yes to confirm the action.
The disconnected asset can be viewed in the Unattached tab in the left pane.
Delete an Asset
You can only delete assets created in EnterpriseView. In order to preserve the integrity of the
business model, assets imported from an external asset repository cannot be deleted directly from
User Guide
Chapter 2: Asset Profiling
HP EnterpriseView (2.5) Page 30 of 265
EnterpriseView; they must be deleted in the system from which they originated. When the business
model is next synchronized, the change will be displayed in EnterpriseView.
To delete an asset
1. Click Assets > Asset Profiling.
2. Search for the asset that you want to delete, as described in "Search for an Asset" on page 29.
3. Click the asset that you want to delete and then click the Delete button or select the asset
in the map and press DELETE.
A confirmation message is displayed. Confirm this action by clicking Yes.
Note: If you delete an asset that has children, then the asset is deleted and the children
are saved as unattached.
Add a CPE to an Asset
You can add or remove CPEs that are associated with an asset. You can add CPEs only to asset
that belong to the following categories:
l Running Software
l Infrastructure Element
l IP 
You can add CPEs only to assets that were created in EnterpriseView. CPEs that were imported
from a CSV file or from ArcSight ESM cannot be removed and are read-only.
To add a CPE to an asset
1. Click Assets > Asset Profiling.
2. Search for the asset to which you want to add a CPE, as described in "Search for an Asset" on
page 29.
3. Click the asset in the search results, and then click the Edit Asset Properties button.
4. In the Edit Asset Properties dialog box, click the CPEs tab.
5. In the search box, enter a CPE (vendor:product:version) or a partial CPE (vendor:product).
Note: To optimize your search, enter the full vendor and product name.
User Guide
Chapter 2: Asset Profiling
HP EnterpriseView (2.5) Page 31 of 265
6. Click Add.
7. Click Save.
To remove a CPE from an asset
1. Click Assets > Asset Profiling.
2. Search for the asset from which you want to remove a CPE, as described in "Search for an
Asset" on page 29.
3. Click the asset in the search results, and then click the Edit Asset Properties button.
4. In the Edit Asset Properties dialog box, click the CPEs tab.
5. From the list of CPEs, click the CPE that you want to remove, and then click the Remove this
CPE from the asset button.
6. Click Save.
Asset Properties
The asset properties include the following information:
l Asset General Properties
The following table describes all of the properties for each asset category.
l Authorized Users
 You can add or remove users and groups that are authorized to work on the asset. For more
information, see "Authorize a User to Work with an Asset" on page 27.
l CPEs
A CPE is an asset identifier. For more information, see "Common Platform Enumeration" on
page 20.
You can add or remove CPEs that are associated with the asset. CPEs that were imported from
a CSV file or from ArcSight ESM cannot be removed and are read-only.
You can filter assets according to their CPE, as described in "Filter Assets by a CPE" on page
29.
User Guide
Chapter 2: Asset Profiling
HP EnterpriseView (2.5) Page 32 of 265
Category Property Description
General Name The name of the asset. It is displayed in the business
model's graphic view along with the asset type icon.
This field is mandatory.
Description Additional information about the asset.
Type The asset type.
Source The source name for the Organization asset is System.
The source name for assets created in EnterpriseView is
empty.
For assets imported from an external asset repository, the
source name is the same as the connector name defined in
the Configuration module.
Owner The person responsible for the asset and who is contacted
in situations requiring manual intervention. The asset owner
is automatically authorized to work with the asset.
Location Latitude The geographical coordinates of the asset's location.
Longitude The geographical coordinates of the asset's location.
Address The street address of the asset.
ZIP Code The asset location ZIP code.
City The city of the asset.
State The state of the asset.
Country The country of the asset.
Criticality Level A numeric index, between 0 and 10, indicating the severity
of a potential catastrophe and the probability of its
occurrence.
The default criticality level of all assets is 1.
The criticality level of an asset affects the weight of its
scores when policy assessment aggregation, risk
aggregation, and vulnerability score aggregation are done.
For more information, see "Weights and Criticality Level" on
page 83, "Risk Score Aggregation Mechanism" on page
110, and "Asset Vulnerability Score Aggregation
Mechanism" on page 147.
Asset General Properties
User Guide
Chapter 2: Asset Profiling
HP EnterpriseView (2.5) Page 33 of 265
Category Property Description
Business Criticality Level See above description.
Value A numeric, monetary value.
Infrastructure
Element
OS Name The operating system that is installed on the infrastructure
element.
OS Version The version of the operating system that is installed on the
infrastructure element.
Running
Software
Application
Name
The name of the application.
Application
Version
The version of the application.
IP DNS Name The server name as defined in the network DNS.
MAC Address The server MAC address.
IP Address The server IP address.
People Role The role of the person or the group in the organization.
Documents Version The version of the document.
Purpose The purpose for which the document was created.
Classification The type of document, such as legal or technical.
Release Date The date on which the document was published.
Asset General Properties, continued
User Guide
Chapter 2: Asset Profiling
HP EnterpriseView (2.5) Page 34 of 265
Asset Profiling Window
The Asset Profiling window enables you to create and maintain your organization's business
model.The different areas and the functionalities available in each area are described in the
following sections. For information on the EnterpriseView toolbar, see "Toolbar Description" on
page 17.
Map Area
UI Element Description
(Layout)
Display the business model in a tree layout
Displays the business model in a tree structured graph.
(Layout)
Display the business model in a circular layout
Displays the business model in an interconnected ring and star topology.
Optimize Layout
Refreshes the layout of the business model in the graph.
Fit to Window
Resizes and displays the entire business model in the map area.
You are Viewing The name of the view that is displayed. If there are multiple views, you
can select a different view from the list.
User Guide
Chapter 2: Asset Profiling
HP EnterpriseView (2.5) Page 35 of 265
UI Element Description
Save New View Creates a new view based on the current business model view displayed
in the map.
Access this option by clicking the arrow next to the Save button.
After you save the view, when you reopen the Asset Profiling page, the
business model displayed in the map area is resized to the default zoom
and to fit to window.
Note: Assets that were disconnected from the business model are
not displayed in the view.
Views are user-specific; you cannot see views that other users created.
For more information, see "Create a Business Model View" on page 24.
Save Saves the changes that you made to the view displayed on the map.
Filter by CPEs Filter the business model by a CPE.
For more information, see "Filter Assets by a CPE" on page 29.
Zoom
Zooms the business model in and out.
Refresh
Refreshes the data on the page.
Left Pane
User Guide
Chapter 2: Asset Profiling
HP EnterpriseView (2.5) Page 36 of 265
UI Element Description
Search tab Enables you to search for a name or a partial name of any asset in
EnterpriseView, connected to the business model or unattached. You
can also search by asset category or type by clicking Advanced.
Unattached tab Includes assets that have either been imported from an external asset
repository and have not been connected to the business model or any
asset that has been disconnected from the business model.
New tab Displays all of the asset types according to categories. When you create
a new asset in EnterpriseView you also connect it to the business
model.
Authorization Enables you to search for assets according to users or groups that are
authorized to work with the assets. For more information, see "To search
for an asset by user or group" on page 29.
Delete
Deletes the selected asset.
You can delete only assets created in EnterpriseView. In order to
preserve the integrity of the business model, assets imported from an
external asset repository cannot be deleted directly from EnterpriseView;
they must be deleted in the system from which they originated. When the
business model is next synchronized, the change will be displayed in
EnterpriseView. If you delete an asset that has children, then the asset
is deleted and the children are saved as unattached.
This button is available in:
l Search tab
l Unattached tab
l Asset Card
Show on Map
Displays the asset in the business model in the map area.
This button is disabled if the asset is unattached.
This button is available in the Search tab.
User Guide
Chapter 2: Asset Profiling
HP EnterpriseView (2.5) Page 37 of 265
UI Element Description
Edit Asset Properties
Opens the Edit Asset Properties dialog box. For more information on
asset properties, see "Asset Properties" on page 32.
This button is available in:
l Search tab
l Unattached tab
l Asset Card
Connect to another asset (mark as source asset)
Marks an asset as the parent asset when you connect an asset to the
business model. A source asset must be attached to the business
model.
This button is available in:
l Search tab
l Asset Card
Mark as target asset
Marks an asset as the child asset when you connect it to the business
model. A target asset can be unattached or already connected to the
business model.
This button is available in:
l New tab
l Unattached tab
l Search tab after the source asset has been defined
l Asset Card after the source asset has been defined
Refresh
Refreshes the business model to display any changes that might have
occurred, for example, synchronization with an external asset repository.
Available in all tabs.
Collapse
Collapses the left pane.
User Guide
Chapter 2: Asset Profiling
HP EnterpriseView (2.5) Page 38 of 265
UI Element Description
Expand
Expands the left pane.
Asset Card
You can open the asset card by clicking on the asset in the business model map.
The asset card includes the asset name, category and type. The following table includes the
functionality available from the asset card.
UI Element Description
See "Delete" on page 37.
See "Connect to another asset (mark as source asset)" on the previous
page
See "Mark as target asset" on the previous page.
See "Edit Asset Properties" on the previous page.
User Guide
Chapter 2: Asset Profiling
HP EnterpriseView (2.5) Page 39 of 265
UI Element Description
Expand Displays the direct children of the asset in the business model map.
Click More > Expand.
If the asset has more than 20 children, then the assets are not displayed
automatically in order not to overload the business model. In this case,
the Show Children on Map for Asset dialog box is displayed, enabling
you to select the children you want to display. The number of direct
children that an asset has is displayed in the business model map by the
asset name.
You can also expand by double-clicking the asset.
Note: You cannot expand an asset that has more than 1000 children
in the business model. If you attempt to expand such an asset, you
will receive an error message.
Collapse Hides the direct children of the asset in the business model map.
Click More > Collapse.
You can also collapse by double-clicking the asset.
Show Parents Displays the parent assets of the asset in the business model map.
Click More > Show Parents.
Hide Parents Hides the parent assets of the asset in the business model map.
Click More > Hide Parents.
Open Properties
Displays properties in read-only mode. For more information on asset
properties, see "Asset Properties" on page 32.
Close Properties
Closes properties view.
User Guide
Chapter 2: Asset Profiling
HP EnterpriseView (2.5) Page 40 of 265
Mini-Map
When the business model is expanded to a larger size than the map area, you can navigate it by
clicking and dragging in the mini-map area.
To expand or collapse the mini-map, click the Expand/Collapse button.
User Guide
Chapter 2: Asset Profiling
HP EnterpriseView (2.5) Page 41 of 265
Chapter 3: Policy and Compliance
Organizations must fulfill a set of legal, statutory, regulatory, and contractual requirements in order
to satisfy their trading partners, contractors, service providers, and socio-cultural environment.
These requirements are bound in policies. EnterpriseView provides a set of integrated components
that create a complete security policy compliance management framework.
The following components comprise the stages of policy management:
l Policy creation and library
The EnterpriseView policy library includes out-of-the-box policies, such as NIST800-53 (revision
3), PCI DSS v2.0, and HIPAA Security Rule (NIST), and a Unified Compliance Framework
(UCF) 2013 Q1 release. UCF contains a comprehensive set of IT regulatory compliance
controls compiled from hundreds of industry standard polices such as PCI, HIPAA ,and
ISO/IEC 27001, allowing you to assess once and comply with many. For more information, see
"About Unified Compliance Framework" on the next page.
EnterpriseView Policy Builder includes a highly configurable policy template for defining in-
house policies, as described in "Create a Policy" on page 45. The policy template can be easily
simplified or enhanced. It can be configured to include basic control definitions, blocks of text for
emulating the different parts of traditional industry standard policy books (such as sections and
chapters on various levels) or it can be more comprehensive, including parameters such as
auditing attributes (for example: priority, GRC designation, type, and purpose).
Control maturity and compliance acceptance levels are derived from the maturity and
compliance score ranges, defined, and can be edited in the Policy Builder. For more information,
see "Configure Compliance and Maturity Score Ranges" on page 63.
l Policy Mapping
EnterpriseView policy mapping enables you to perform policy compliance assessments on
assets for a single policy and create compliance reports for multiple policies, saving you the
effort of assessing the compliance for each policy to which your organization is obligated. For
more information, see "Policy Mapping" on page 59.
l Control to Vulnerability Mapping
EnterpriseView enables you to map controls, from any policy, to any vulnerability defined in the
vulnerability dictionary in order to refine or determine asset compliance scores. Configuration
vulnerabilities can be used to automatically determine compliance, while network and
application vulnerabilities can be used to refine a score applied either manually or automatically.
For more information, see "Control to Vulnerability Mapping" on page 54.
l Setting Statements of Applicability (SoA)
The SoA identifies the controls chosen for the assets in the organization. The SoA is derived
from the output of the risk assessment and directly relates the selected controls back to the
HP EnterpriseView (2.5) Page 42 of 265
original risks they are intended to mitigate. Both industry standard and in-house controls can be
applied, as described in "Set Statement of Applicability" on page 48. Applied controls are trickled
down to lower-level assets and can be viewed at any point on the business model hierarchy, but
can also be overridden for specific assets. Controls that are not applicable are also defined,
complying with industry best practices.
l Auditing
EnterpriseView enables you to assess policy compliance and control maturity for all assets that
comprise your organization's business model, as described in "Audit Assets" on page 50.
EnterpriseView applies a Control Maturity Model, which is aligned primarily with the widely
adopted Capability Maturity Model (CMM), in order to benchmark IT processes, performance,
and capability, performed through the Policy Assessment module. The Control Maturity Model is
implemented by a scoring method that is based on five factors that make up the overall control
score. This scoring method results in a higher level of quality in the deployment of a security
control on an asset. For more information, see "P5 Control Maturity Model Guidelines" on page
76.
The policy assessment module also supports control audit annotation and attachments.
About Unified Compliance Framework
Unified Compliance Framework (UCF) is an industry-vetted compliance database that includes a
comprehensive set of IT regulatory compliance controls from hundreds authority documents, such
as PCI, HIPAA,and ISO/IEC 27001. UCF eliminates overlapping controls and bridges the gaps
between the different authority documents, providing you with a harmonized list of controls.
In EnterpriseView, UCF is portrayed as a single policy, allowing you to assess one policy while
complying with the many policies to which your organization is obligated.
The structure of the UCF policy in EnterpriseView is a simplified version of the original framework,
which includes main security categories containing a flat list of controls. The controls are grouped
according to main security categories (known as Impact Zones in UCF) and include their control ID.
The following table includes the mapping between EnterpriseView policy elements and their
corresponding elements in UCF.
User Guide
Chapter 3: Policy and Compliance
HP EnterpriseView (2.5) Page 43 of 265
EnterpriseView UCF Additional Information
Policy Authority
Document
In the original framework, every control includes Citations.
Each citation includes a reference to an authority
document that has this control or a similar, corresponding
control.
In EnterpriseView, UCF is represented as a policy entity.
The various authority documents, such as PCI, HIPAA,
and ISO/IEC 27001, are not represented as standalone
policies. Instead, they are used to filter controls when
creating the Statement of Applicability, as described in
"Set Statement of Applicability" on page 48 and for
reporting purposes.
Main Security
Category
Impact Zone UCF includes impact zones, such as:
l Leadership and High Level objectives
l Audit and Risk Management
l Product Design and Development
l Acquisition of Technology
l Operational Management
l Human Resources Management
l Records Management
l Technical Security
l Physical Security
l Systems Continuity
l Monitoring and Reporting
l Privacy
l System Hardening Through Configuration Management
Control Text Control
Statement
In some cases when a Control Statement does not exist,
then the control text reflects the Policy Statement.
Title Control Title
User Guide
Chapter 3: Policy and Compliance
HP EnterpriseView (2.5) Page 44 of 265
Manage Policies
This section includes information about how to manage policies.
Create a Policy 45
Activate a Policy 47
Import a Policy 47
Delete a Policy 48
Create a Policy
EnterpriseView includes the Unified Compliance Framework, as described in "About Unified
Compliance Framework" on page 43. You can also create your own policies. When you create a
new policy, you can decide on the complexity of its format and you can configure the control
template to suit the needs of your organization and the specific policy.
Creating the policy is a two-step process:
1. Create the policy and configuring the policy template. We recommend planning the policy
template in advance. However, you can modify the template at any time.
2. Add content to the policy.
After you have created a new policy, if you want to begin working with the policy, you need to
activate it, as described in "Activate a Policy" on page 47.
You can fully modify policies that you created in EnterpriseView. For out-of-the-box policies or
imported policies, you can modify the control template and add guidelines to controls, but you
cannot modify the content of the policy.
To create a new policy and configure the policy template
1. Click Policy and Compliance > Policy Builder.
2. On the Policy Builder tab, click Create Policy.
3. In the Template page, do the following, and then click Save or Save and Activate:
a. In the Policy Name box, enter a name for the policy.
b. In the Policy Description box, enter a description for the policy.
c. In the Control Template area, select the attributes relevant for this policy according to the
information available in the Template tab, as described in "Policy Builder Window" on page
64.
User Guide
Chapter 3: Policy and Compliance
HP EnterpriseView (2.5) Page 45 of 265
To add content to the policy
1. Click Policy and Compliance > Policy Builder.
2. In the Policy Builder page, in the left pane, click the Content tab. In the left pane, from the
policy drop-down list, select the policy to which you want to add content.
3. Follow these steps to add a Main Security Category. For more information on policy attributes,
see "Policy Builder Window" on page 64.
a. In the left pane, click the New Main Security Category button.
b. In the right pane, enter the following information, and then click Save:
o Paragraph Number: Can be any alphanumeric string, up to 255 characters.
o Title: Of the security category.
o Text:  Any additional text explaining this security category.
4. Add more security category levels, if required:
a. In the left pane, click the security category to which you want to add another level, and then
click the New Security Category button.
b. In the right pane, enter the paragraph number, title, and text.
c. Click Save.
5. Add controls to the security categories, as required:
a. In the left pane, click the security category to which you want to add the control, and then
click the New Control button.
b. In the left pane, enter basic control information, as described in "Policy Builder Window" on
page 64. If required, expand Guidelines and Additional Auditing Information to enter
additional control information.
c. Click Save.
6. Repeat steps 3 through 5 to complete the policy content.
User Guide
Chapter 3: Policy and Compliance
HP EnterpriseView (2.5) Page 46 of 265
Activate a Policy
You must activate a policy before you can start working with it. Policies that you do not activate are
not displayed in any of the pages that belong to the Policy and Compliance module, except for the
Policy Builder.
There are two ways to activate a policy: 
l Through the policy builder. We recommend this option when you want to create a policy and
immediately activate it.
l Through the EnterpriseView Settings dialog box. We recommend this option for managing the
state of all the policies in EnterpriseView.
To activate a policy through the Policy Builder
1. If you have not just created the policy, click Policy and Compliance > Policy Builder and
from the top left pane, select the policy that you want to activate.
2. Click the Settings tab, and then select the Activate Policy check box.
3. Click Save.
To activate a policy through the EnterpriseView Settings dialog box
1. On the EnterpriseView toolbar, click Settings.
2. In the Settings dialog box, click Policy and Compliance > Policy Administration.
3. In the Policy Administration page, select the check boxes of the policies that you want to
work with.
4. If you want to work with UCF authority documents, select the Unified Compliance
Framework check box, and then select the authority documents with which you want to work.
n You can search for a specific authority documents or sort them by Name or by Selected
Items.
n You can select the Select All check box to automatically select all the authority documents
displayed on the page. If you already filtered the list, then only the filtered results are
selected.
5. Click Save.
Import a Policy
You can import policies in XML format from your local computer into EnterpriseView. The XML file
must match the XML Schema Definition (XSD), which you can find in the following location:
User Guide
Chapter 3: Policy and Compliance
HP EnterpriseView (2.5) Page 47 of 265
<server_URL>/redcat/content/policy.xsd
Note:
l The paragraph numbers of all the policy elements in the XML must be unique.
l Policy names in EnterpriseView are unique; you cannot import a policy that already exists.
To import a policy
1. Click Policy and Compliance > Policy Builder, and then click Import Policy.
2. In the Select file to upload by dialog box, navigate to the location of the file, select the file,
and then click Open.
3. After the policy is imported, you are prompted to activate the policy.
Delete a Policy
Note: You cannot restore a deleted policy.
Out-of-the-box policies and policies that are in an assessment process cannot be deleted. If you
delete a policy that is mapped to another policy, then these mappings are deleted.
To delete a policy
1. Click Policy and Compliance > Policy Builder.
2. In the left pane, from the policy list, select the policy that you want to delete, and then, on the
top right-hand side, in the Policy Toolbar, click Delete Policy.
3. A confirmation message is displayed. Click OK to confirm this action.
Set Statement of Applicability
You can apply controls to assets, which will be assessed during the auditing phase. Once applied,
controls are automatically trickled down to all lower-level (children) assets. You can override these
settings and reapply controls to the lower-level assets.
Note: After an asset has entered the assessment process (at least one control that is applied
to the asset is already assessed for a specific policy), then none of the controls that are applied
to this asset can be removed. However, controls that are not applied to this asset can be
applied at any time.
User Guide
Chapter 3: Policy and Compliance
HP EnterpriseView (2.5) Page 48 of 265
To comply with industry best practices, we recommend explicitly identifying controls that are not
applicable to the asset.
To apply controls to assets
1. Click Policy and Compliance > Statement of Applicability.
2. In the Statement of Applicability page, in the left pane, in the Organization tab, expand the
business model tree and locate the asset for which you want to set applicability. You can also
search for an asset, as described in "Search for an Asset" on page 29.
3. In the Unassigned Controls pane, from the policy list, select the required policy.
All of the controls that belong to this policy but have not yet been assigned to the asset that you
have selected are displayed below the policy. The controls are grouped according to their
security category.
4. Click next to the security category to expand and display the controls. The number of
unassigned controls in the security category is displayed. For example, (12/12) means that 12
out of 12 controls that belong to the security category are not yet assigned to the asset that you
have selected.
5. If you select the Unified Compliance Framework policy, then you can filter the results
according to a specific authority document or policy in EnterpriseView. For more information,
see "About Unified Compliance Framework" on page 43. Enter the name of the authority
document in the Filter by authority document box. The results are filtered accordingly.
6. From the list of controls, do the following:
a. Drag the controls that you want to apply to the asset to the Applied to Asset area. You
can drag an entire security category or a main security category.
b. Drag the controls that are not applied to the asset to the Not Applied to Asset area.
c. Drag controls or security categories between the Applied to Asset area and the Not
Applied to Asset area, as needed.
The controls that you applied to the asset are automatically applied to all its child assets. All
controls that inherit their applicability from their parent asset are marked with the Inherited
from: <asset> icon. If you decide that a policy, a control, or a set of controls are no longer
relevant to an asset, then you can return the controls to the Unassigned Controls pane. The
controls are removed from all children.
You can override these settings and reapply controls to any asset, as described in the following
procedure.
To override control applicability
1. Click Policy and Compliance > Statement of Applicability.
User Guide
Chapter 3: Policy and Compliance
HP EnterpriseView (2.5) Page 49 of 265
2. In the Statement of Applicability page, in the left pane, in the Organization tab, expand the
business model tree and locate the asset for which you want to override applicability. You can
also search for an asset, as described in "Search for an Asset" on page 29.
3. Make the necessary changes by dragging the controls from the Applied to Asset area to the
Not Applied to Asset area and vice versa. Controls for which applicability has been
overridden are marked with the Inheritance Exception: <asset> icon.
Audit Assets
EnterpriseView enables you to apply a quantitative assessment to assets on two levels:
l Asset Compliance: Helps assess compliance with a policy control.
l Control Maturity: Helps identify capability gaps. These gaps can be demonstrated to
management, and action plans can then be developed to bring these controls up to the desired
capability target level.
There are a number of methods to assess asset compliance and control maturity. The following
table includes a description of the assessment types.
Method Description
Manual The score is applied manually.
A manual assessment overrides all automatic assessment
methods.
Automatic External
systems
(REST API)
The score is imported from an external system, such as HP
Server Automation (SA).
Scores from external systems have precedence over
configuration vulnerabilities and aggregation.
Configuration
vulnerabilities
Relevant only for compliance assessment.
Under certain circumstances, configuration vulnerabilities
determine the compliance score. For more information, see
"Control to Vulnerability Mapping" on page 54.
Scores from configuration vulnerabilities have precedence
over aggregation.
Aggregation The default score. The aggregate score of a control is
overridden by any other assessment method. For more
information, see "Control Scores Aggregation Mechanism" on
page 77.
Assessment Methods
The precedence of the assessment methods is as follows:
User Guide
Chapter 3: Policy and Compliance
HP EnterpriseView (2.5) Page 50 of 265
If the control that you are assessing is mapped to another control and they are both applied to the
asset, then an indication that the control is mapped is displayed, and you can access the mapped
control details.
To assess asset compliance, see "Assess Asset Compliance" below.
To assess control maturity, see "Assess Control Maturity" on the next page.
Assets are assessed in the Policy Assessment window. For more information, see "Policy and
Compliance Assessment Window" on page 70.
When assessments are obsolete, you can clear them, as described in "Clear Assessment on
Assets" on page 54.
Assess Asset Compliance
For information on the different assessment methods, see "Assessment Methods" on the previous
page.
To assess compliance
1. Click Policy and Compliance > Assessment.
2. In the left pane, click Select an Asset, expand the asset tree, and click the asset that you
want to assess. Alternatively, search for the asset by entering its name. Click OK.
The policies that are relevant to this asset (those that have at least one control assigned to the
asset) are displayed in the left pane.
3. From the left pane, select the required policy. Expand the policy, and then click the control that
you want to assess.
The Assessment tab opens in the right pane.
4. In the right pane, in the Compliance Assessment area, click the Edit Base Compliance
Score button.
5. In the Edit Compliance Assessment dialog box, select one of the following options, and then
click Save:
n Manual: In the box, enter a score between 0-100, or use the slider.
n Automatic: The score is provided by the system, depending on the available assessment
methods. to learn more, see "Assessment Methods" on the previous page.
User Guide
Chapter 3: Policy and Compliance
HP EnterpriseView (2.5) Page 51 of 265
6. Select the Ignore Vulnerabilities check box, if you want to disable the affect of vulnerabilities
mapped to this control. Network or application vulnerabilities can affect the compliance score
only under certain circumstances. For more information, see "Use Network and Application
Vulnerabilities to Refine Compliance Score" on page 56.
7. In the Implementation Details box, enter the details of how you implemented this control.
8. Click Save.
If there are network and application vulnerabilities mapped to the control, then the compliance
score is automatically recalculated (reduced) to include the impact of the vulnerabilities. For
more information, see "Control to Vulnerability Mapping" on page 54.
The Compliance Score is trickled up and aggregated to higher-level assets for every applied
control. The value is displayed in the left pane in the asset tree. For more information, see
"Control Scores Aggregation Mechanism" on page 77.
The date and time of this assessment is updated in the Last Updated On field.
Assess Control Maturity
Review the P5 Control Maturity Model Guidelines, as described in "P5 Control Maturity Model
Guidelines" on page 76 in order to determine the appropriate control maturity score to apply to each
maturity factor.
To assess control maturity
1. Click Policy and Compliance > Assessment.
2. In the left pane, click Select an Asset, expand the asset tree, and click the asset that you
want to assess. Alternatively, search for the asset by entering its name. Click OK.
The policies that are relevant to this asset (those that have at least one control assigned to the
asset) are displayed in the left pane.
3. From the left pane, select the required policy. Expand the policy, and then click the control that
you want to assess.
The Assessment tab opens in the right pane.
4. In the right pane, in the Maturity Assessment area, click the Edit P5 Maturity Factor Scores
button.
The Maturity Score is a weighted average of all maturity factors. Maturity factor weights are
defined in the policy template. For more information, see "P5 Applicability Weights" on page
66.
User Guide
Chapter 3: Policy and Compliance
HP EnterpriseView (2.5) Page 52 of 265
5. In the Edit Maturity Assessment dialog box, select the maturity factor that you want to
assess.
In the following example, the People factor is selected.
6. Select one of the following options, and then click Save:
n Manual: In the box, enter a score between 0-5, or use the slider. Review the P5 Control
Maturity Model Guidelines, as described in "P5 Control Maturity Model Guidelines" on page
76 in order to determine the appropriate control maturity score to apply to each maturity
factor.
n Automatic: The score is provided by the system, depending on the available assessment
methods. To learn more, see "Assessment Methods" on page 50.
The maturity score is calculated, in addition to the maturity assessment progress, which
reflects how many maturity factors have been assessed. Each maturity factor counts for a
percentage of the overall score, depending on the number of maturity factors employed. For
example, if all maturity factors are employed, then each factor counts for 20% of the overall
score. If two out of the five maturity factors have been assessed, then the maturity
assessment progress will be 40%. The scores and progress are displayed in the Control
Data area. For more information, see "Policy and Compliance Assessment Window" on
page 70.
The Maturity Score and the Maturity Progress are trickled up and aggregated to higher-
level assets for every applied control. Their values are displayed in the left pane in the asset
User Guide
Chapter 3: Policy and Compliance
HP EnterpriseView (2.5) Page 53 of 265
tree. For more information, see "Control Scores Aggregation Mechanism" on page 77.
The date and time of this assessment is updated in the Last Updated On field.
Clear Assessment on Assets
You can clear assessments on assets for outdated audits.
This action can be performed only by users who have access rights to the Organization asset.
This action is performed on the entire business model, meaning that the assessments on all assets
are cleared for the policies that you select. This action invokes the Archive Trend Data Job.
For more information on this job, see the Archive Trend Data section in the HP EnterpriseView
Administration Guide.
Note: When you clear assessments, they are deleted permanently. Notes or attachments
connected to these assessments are also deleted. This action cannot be reversed.
To clear assessments
1. Click Policy and Compliance > Assessment.
2. On the Policy and Compliance Assessment window, click Clear Assessment.
3. On the Clear Assessment dialog box, select the policies for which you want to clear
assessments, and then click OK.
This action might take a few minutes. Refresh the page to see the changes.
Control to Vulnerability Mapping
There is an inherent correlation between vulnerabilities and policy controls. Vulnerabilities are a
factor throughout the life cycle of a control. A vulnerability may be the primary cause for defining a
control, its existence or lack of it may affect the organization's decision of applying a control, and its
persistence affects the level of compliance of a control.
A vulnerability score can be used to determine the compliance score or to refine it, depending on the
vulnerability type:
l Determine: Configuration vulnerabilities determine the base compliance score. For more
information, see "Use Configuration Vulnerabilities to Determine Compliance Score" on the next
page.
l Refine: Network and application vulnerabilities refine the compliance scores, Meaning that they
alter the base compliance score and are reflected in the final compliance score. For more
User Guide
Chapter 3: Policy and Compliance
HP EnterpriseView (2.5) Page 54 of 265
information, see "Use Network and Application Vulnerabilities to Refine Compliance Score" on
the next page.
A control can be mapped to more than one vulnerability and more than one vulnerability type. This
means that, theoretically, a control's base compliance score can be determined by a configuration
vulnerability and then refined by network and application vulnerabilities, resulting in the final
compliance score.
EnterpriseView includes out-of-the-box mappings between vulnerabilities defined in the
vulnerability dictionary and the policies provided with EnterpriseView. These mappings represent
the correlation between controls and vulnerabilities.
Vulnerabilities automatically affect the compliance score of a control when the following conditions
occur:
l The vulnerability is mapped to the control
l The control is applied to an asset
l The vulnerability is attached to the asset
Through the Control to Vulnerability mapping page (Policy and Compliance > Control to
Vulnerability mapping page, you can search for specific mappings using free text.
Note: You can perform wildcard searches. For example, if you type ser*, the results will
contain words beginning with ser (such as server and service). An asterisk cannot be placed
before a string (*ser).
You can add new mappings, edit existing mappings, or delete mappings. For more information, see
"Map Controls to Vulnerabilities " on page 57, "Edit Control to Vulnerability Mapping" on page 57,
and "Delete Vulnerability to Control Mapping" on page 58 respectively.
Use Configuration Vulnerabilities to Determine
Compliance Score
You can use configuration vulnerabilities to determine compliance scores. Configuration
vulnerabilities are considered an automatic scoring method, along with assessments imported from
external systems. You can override the score manually. For more information on the different
assessment methods, see "Audit Assets" on page 50.
There can be more than one configuration vulnerability mapped to a control. Each vulnerability can
have a different check result: passed, failed, or unknown. For more information on check results,
see "Score" on page 140.
The formula that is used to determine the compliance score for an asset for a control is the sum of
passed and unknown configuration vulnerabilities divided by the sum of passed, unknown, and
failed vulnerabilities multiplied by their weights (1,2, and 4 accordingly).
User Guide
Chapter 3: Policy and Compliance
HP EnterpriseView (2.5) Page 55 of 265
*100
n
n n n* 4+ * 1+ * 2
Passed Vul nerabilities nUnknown Vulnerabilities
Failed Vul nerabilities Passed Vul nerabilities UnknownVul nerabilities
+
Examples:
l If there is one passed configuration vulnerability, then the score is 100.
l If there is one unknown configuration vulnerability, then the score is 50.
l If there is one failed configuration vulnerability, then the score is 0.
Use Network and Application Vulnerabilities to Refine
Compliance Score
You can use network and application vulnerabilities to refine compliance scores.
The compliance score is affected as follows:
l If the control is either manually or automatically assessed, then the vulnerability lowers the
control's compliance score. The following indication is displayed on the screen below the
compliance score:
"Score is affected by <n> vulnerabilities. Reduced by m%."
You can click the "n vulnerabilities" link to view the details of the vulnerabilities that are mapped
to the control. For more information, see "Score is affected by <n> vulnerabilities " on page 75.
l If the control is not assessed, then its compliance score is changed from Not Assessed to "0".
Note: This feature can be disabled for each control by selecting the Ignore Vulnerabilities
check box in the Policy Assessment window, as described in "Policy and Compliance
Assessment Window" on page 70.
Most mappings are between a control and a group of vulnerabilities rather than between a control
and an individual vulnerability. Vulnerabilities are grouped according to different vulnerability
categories. EnterpriseView adopted the Common Weakness Enumeration (CWE) system for
identifying most vulnerability groups. Other vulnerability groups are internal and can be identified by
an "EVG" prefix.
The formula that is used to determine the impact of vulnerabilities on a control's compliance score
considers the following variables:
l The vulnerability score. For more information on the vulnerability score, see "Vulnerability
Properties" on page 140.
There is a negative correlation between the vulnerability score and the control's compliance
score; the higher the vulnerability score, the lower the compliance score will be.
User Guide
Chapter 3: Policy and Compliance
HP EnterpriseView (2.5) Page 56 of 265
l The number of vulnerabilities that are mapped to the control.
l The weight of the vulnerability with the highest score.
Map Controls to Vulnerabilities
You can add new control to vulnerability mappings.
To map a control to vulnerabilities
1. Click Policy and Compliance > Control to Vulnerability Mapping.
2. On the Control to Vulnerability Mapping page, click Add Mapping.
3. On the Select a Control page, do the following: 
a. From the Policy list, select a policy.
b. Expand the policy tree and select the control that you want to map.
c. Click Next.
4. On the Select Vulnerabilities page, do the following:
a. From the Select vulnerability type list, select either Network and Application or
Configuration.
b. if you selected Network and Application, then select one of the following options:
o Groups: Select groups of vulnerabilities to map to a control.
o Vulnerabilities: Select individual vulnerabilities to map to a control.
c. From the list, select the group (for network and application only) or vulnerability that you
want to map to the control, and then click the Add to Mapping button.
To remove groups (for network and application only) or vulnerabilities from the mapping, click
the Remove from Mapping button.
5. Click Finish.
Edit Control to Vulnerability Mapping
You can edit existing control to vulnerabilities mappings.
User Guide
Chapter 3: Policy and Compliance
HP EnterpriseView (2.5) Page 57 of 265
To edit a mapping
1. Click Policy and Compliance > Control to Vulnerability Mapping.
2. On the Control to Vulnerability Mapping page, select the mapping that you want to edit, and
then click Edit Mapping.
You can search for specific mappings by using free text search.
Note: You can perform wildcard searches. For example, if you type ser*, the results will
contain words beginning with ser (such as server and service). An asterisks cannot be
placed before a string (*ser).
3. To add vulnerabilities, on the Edit Mapping dialog box, do the following:
a. From the Select vulnerability type list, select either Network and Application or
Configuration.
b. If you selected Network and Application, select either Groups or Vulnerabilities.
c. From the list of groups (only for network and application) or vulnerabilities, select the group
or vulnerability that you want to map to the control, and then click the Add to Mapping
button.
4. To remove groups (only for network and application) or vulnerabilities from the mapping, click
the Remove from Mapping button.
5. Click Finish.
Delete Vulnerability to Control Mapping
You can delete both user-created and out-of-the-box mappings.
To delete a mapping
1. Click Policy and Compliance > Control to Vulnerability Mapping.
2. On the Control to Vulnerability Mapping page, select the mapping that you want to delete,
and then click the Delete Mapping button.
You can search for specific mappings using free text.
3. Click Yes to confirm the action.
User Guide
Chapter 3: Policy and Compliance
HP EnterpriseView (2.5) Page 58 of 265
Policy Mapping
EnterpriseView allows you to map controls from one policy to another policy. For more information
on mapping policy controls, see "Map Controls" on the next page. When assets are being assessed
by auditors, if a control is mapped to another control and both controls are applied to the asset, then
the auditor can access the details of the mapped control (for both source controls and target
controls) from the Policy Assessment window. This capability helps you reduce the effort of
assessing the compliance for each and every policy to which your organization is obligated.
EnterpriseView includes mappings between controls in the Unified Compliance Framework (UCF)
 policy and the controls of the rest of the policies provided with EnterpriseView. You can import
mappings between UCF and policies that are not included in your EnterpriseView package, such as
ISO/IEC 27001 and ISO/IEC 27002. For more information on obtaining this content, contact your
EnterpriseView representative. For more information on importing UCF mappings, see "Import UCF
Mappings" below.
About the Policy Mappings Import Job
The Policy Mappings Import Job imports mappings between UCF controls and controls of other
policies into the EnterpriseView database, as follows:
Note: The job can import multiple files. Each file is handled separately. As such, it is possible
for one file to be imported successfully, while another import fails. To verify the status of each
file, refer to the following log:
<EnterpriseView Installation Folder>logsredcat.log
1. The process opens the first file from the following location:
<EnterpriseView Installation Folder>contentpolicyMapping
2. The process identifies the policy that is mapped to UCF. The name of the policy in the file must
match the name of the policy in EnterpriseView.
3. The process copies all the mappings into the EnterpriseView database. The control data in the
file must be identical to the control data in EnterpriseView. If it is not identical, the import of the
file fails.
4. If there is another mappings file, the process proceeds to the next file.
Import UCF Mappings
You can import mappings between UCF and policies that are not included in your EnterpriseView
package, such as ISO/IEC 27001 and ISO/IEC 27002. For more information on obtaining this
content, contact your EnterpriseView representative.
User Guide
Chapter 3: Policy and Compliance
HP EnterpriseView (2.5) Page 59 of 265
Before you begin, make sure that the policies for which you are importing mappings, are in
EnterpriseView. For information on importing policies, see "Import a Policy" on page 47.
To import UCF mappings
1. Copy the mapping files to the following location:
<EnterpriseView Installation Folder>contentpolicyMapping
2. Run the PolicyMappingsImportJob from the Job Management module, as described in the
Launch Batch Jobs Manually section in the HP EnterpriseView Administration Guide.
For more information on the Policy Mappings Import Job, see "About the Policy Mappings
Import Job" on the previous page.
Map Controls
Control mapping is a two-way mapping; controls from policy A are mapped to controls from policy B
and vice versa.
To map controls between policies
1. Click Policy and Compliance > Policy Mapping.
2. In the Policy A pane, from the Select a policy list, select a policy.
The security categories of the policies are displayed. Expand the security categories to display
their controls. Controls in policy A that are not mapped appear in bold.
3. In the Policy B pane, from the Select a policy list, select a policy.
The security categories of the policies are displayed . Expand the security categories to
display their controls.
4. From the Policy A pane, from the list of controls, select the control that you want to map, and
drag it to the A column in the Mapped Controls table or click Map .
The control that you added to the mapping is displayed in a regular font style (not bold) in the
policy tree in the Policy A pane.
Note: You cannot add controls to the Mapped Controls table until both Policy A and
Policy B are selected.
5. From the Policy B pane, from the list of controls, select the control that you want to map, and
drag it to the B column in the Mapped Controls table that reads "Drag here", or click Map.
The Mapped Controls table displays only the paragraph number of the control; it does not
display the control title.
User Guide
Chapter 3: Policy and Compliance
HP EnterpriseView (2.5) Page 60 of 265
6. Repeat steps 4 and 5 until all of the required controls are mapped.
A control from policy A is displayed only once in the Mapped Controls table, even if it is
mapped to more than one control from policy B. However, if more than one control from policy
B is mapped to the same control from policy A, then all of the controls from policy B are
displayed in the same table cell.
Search for Controls
You can search for mapped or unmapped controls.
To search for controls
1. Click Policy and Compliance > Policy Mapping.
2. You can search for controls in policy A and in policy B. Do one of the following:
a. In the Policy A pane, from the Select a policy list, select a policy. In the Search
Controls box, enter the control paragraph number, title or both. You can also enter a partial
search string.
b. In the Policy B pane, from the Select a policy list, select a policy. In the Search
Controls box, enter the control paragraph number, title, or both. You can also enter a
partial search string.
To search for mapped controls
1. Click Policy and Compliance > Policy Mapping.
2. In the Policy A pane, from the Select a policy drop-down list, select a source policy, and in
the Policy B pane, from the Select a policy drop-down list, select a policy.
All of the control mappings between the two policies that you selected are displayed.
3. In the Mapped Controls pane, in the Search Controls box, enter the paragraph number of
any control from either policies. You can also enter a partial search string.
Note: The search field is not case-sensitive.
Delete Mapping Between Controls
You can delete mappings between the controls of various policies.
Note: Changes made to control mapping might be reflected in policy assessment reports.
User Guide
Chapter 3: Policy and Compliance
HP EnterpriseView (2.5) Page 61 of 265
To delete a mapping between controls
1. Click Policy and Compliance > Policy Mapping.
2. In the Mapped Controls table, locate the mapping that you want to delete. You can use the
Search Associated Controls box to filter the mappings. For more information, see "Search
for Controls" on the previous page.
3. Click the Delete Mapping button. A confirmation message is displayed. Confirm this
action.
The mapping is deleted from the Mapped Controls table.
Policy Mapping Window
The Policy Mapping window enables you to map controls between two policies. For more
information, see "Policy Mapping" on page 59. The different areas and the functionalities available
in each area are described in the following sections. For information on the EnterpriseView toolbar,
see "Toolbar Description" on page 17.
UI Element Description
Click this button to add the selected control to the Associated
Control table.
This button is enabled only when you have selected both policy
A and policy B and when an unmapped control in the policy A is
selected.
You can also drag and drop controls to the Mapped Controls
table. For more information, see "Map Controls" on page 60.
Click a control and then click this button to display the control
details.
<Search Controls> This page provides three different search options:
l Search Controls (policy A). Search within the list of
controls that belong to policy A, both mapped and not
mapped.
l Search Controls (policy B). Search within the list of
controls that belong to the policy B, both mapped and not
mapped.
l Search Associated Controls. Search for controls that are
already mapped, from the Mapped Controls pane.
For more information, see "Search for Controls" on the previous
page.
User Guide
Chapter 3: Policy and Compliance
HP EnterpriseView (2.5) Page 62 of 265
UI Element Description
Click the control that you want to delete from the A column in
the Mapped Controls pane, and then click this button. For
more information, see "Delete Mapping Between Controls" on
page 61.
<% controls mapped> The percentage of controls from policy B that are mapped to
controls in policy A. Displayed on the bottom of the Policy B
pane.
<Controls not mapped:> The number of controls from policy A that are displayed in the
Mapped Controls table, but do not have a control from policy B
mapped to them. This indication helps you manage your
mappings by filtering controls that are in the process of being
mapped and for which mapping has not been completed.
To the left, you can also see a list of these controls, by control
paragraph number. Click in the list, and then select the control
to which you want to navigate to in the Mapped Controls table.
Go to previous unassociated control / Go to next
unassociated control
This button helps you navigate between controls in policy A that
are displayed in the Mapped Controls table but that do not
have a control from policy B mapped to them.
Configure Compliance and Maturity Score Ranges
You can configure the ranges for the score severity indication for compliance and maturity scores.
Scores are displayed with one of the following icons:
High score
Medium score
Low score
This configuration is reflected throughout the application wherever these scores are displayed. For
example, in the Policy and Compliance Assessment page.
To configure maturity and compliance score ranges
1. On the EnterpriseView toolbar, click the Settings button.
2. In the Settings dialog box, click Policy and Compliance > Compliance and Maturity
Score Ranges.
User Guide
Chapter 3: Policy and Compliance
HP EnterpriseView (2.5) Page 63 of 265
3. In the Compliance and Maturity Score Ranges page, drag the slider to define the ranges for
maturity or compliance score, and then click Save.
Policy Builder Window
The Policy Builder window enables you to define new policies according to a configurable template,
edit existing policies, delete policies, import policies, and create reports. The different areas and the
functionalities available in each area are described in the following sections. For information on the
EnterpriseView toolbar, see "Toolbar Description" on page 17.
Policy Builder Toolbar
UI Element Description
<Policy list> Select a policy from the list.
Content tab See "Content Tab" on page 66
Template tab See "Template Tab" below
Import Policy Click this button to import a policy. For more information, see
"Import a Policy" on page 47.
Create Policy Click this button to create a new policy. For more information, see
"Create a Policy" on page 45.
Delete Policy Click this button to delete a policy.
This button is disabled if the assessment process has begun
(meaning that at least one control that is applied to an asset is
assessed).
Note:  If you delete a policy that includes controls that are
already assigned to an asset, whether the controls are
applied to the asset or not, then the assignment and any
related assessment are deleted.
Policy Builder Toolbar
Template Tab
User Guide
Chapter 3: Policy and Compliance
HP EnterpriseView (2.5) Page 64 of 265
Use this screen to configure the control template for each policy that you create.
UI Element Description
Control Text
Guideline
Introduction
Guidelines
Guideline
Additional Text
Control
Additional Text
The Basic attributes include content elements. Selecting an attribute adds
a text box to the control in which you can add content. For example, if the
control has numerous guidelines, you can select the Guidelines attribute.
If you add Guidelines to your template, when you create the content for the
policy, you will have the option of adding tags (short, descriptive text) to
the guidelines. You can remove a tag by clicking the X on the right side of
the tag. Tag names are limited to 64 characters.
The Control Text attribute is selected by default.
Priority You can prioritize controls by selecting this check box. The following
priorities can be applied:
l Low
l Medium
l High
GRC Designation You can categorize the controls according to the following criteria:
l Regulation
l Legal Status
l Standards
l Threats
Type You can further categorize the controls according to the following criteria:
l Management
l Technical
l Operations
Template Tab
User Guide
Chapter 3: Policy and Compliance
HP EnterpriseView (2.5) Page 65 of 265
UI Element Description
Purpose Additional segmentation according to purpose:
l Confidentiality
l Integrity
l Availability
l Audit
l Privacy
Control Weight You can apply a weight between 0 and 100 to a control. The control weight
affects the aggregation calculation when the policy assessment score is
trickled up. For more information, see "Weights and Criticality Level" on
page 83.
If this check box is not selected, then all of the controls will have the same
weight.
P5 Applicability
Weights
You can apply different weights to the P5 control maturity factors. For more
information on P5 control maturity factors, see "Maturity Score" on page
72. For example, if the organization business strategy is focused on the
human factor, give People a higher weight than the other factors. The
weights affect the calculation of the P5 maturity score when a control is
assessed.
By default, all of the P5 control maturity factors are selected. Clearing the
check box will remove the specific factor from the control, meaning that the
factor is not displayed when the control is assessed.
You can narrow down the factors for a specific control further when you
add content to the policy. For more information, see "Create a Policy" on
page 45.
Attachments You can add the ability to upload, download, or delete attachments from a
policy. For more information, see "Attachments" on page 69.
Template Tab, continued
Content Tab
Use this screen to add content to a policy that you created.
User Guide
Chapter 3: Policy and Compliance
HP EnterpriseView (2.5) Page 66 of 265
UI Element Description
New Main Security Category
A Security Category lets you group controls with common characteristics.
It is like a heading, but it includes a Text field where you can add a
description of the category. Examples of security categories in ISO can
be: Asset Management, Risk Assessment and Treatment, and Security
Policy. Examples of security categories in COBIT can be: Plan and
Organize, Acquire and Implement.
A policy can include a hierarchy of security categories. The first level must
be a Main Security Category. A main security category can only serve as
a first-level category, meaning that you cannot create a main security
category under a main security category.
Click this button to create a new Main Security Category. In the right pane,
enter the security category information.
New Security Category
After you created a Main Security Category, you can create another level
of categories using Security Categories.You can create multiple levels of
Security Categories.
Click on the parent category (it may be a Main Security Category or a
regular Security Category), and then click this button. In the right pane,
enter the security category information.
New Control
Controls are typically used to make sure that risks are reduced to an
acceptable level. Controls are guidelines and rules and are the foundation
of any policy; you must define controls in order to assess an asset's
compliance with your organization's rules and regulations.
Click the security category to which the control belongs, and then click
this button. In the right pane, enter the control information.
Note: A control cannot be created directly under the policy, it must be
created under a security category.
Delete
Deletes a Main Security Category, Security Category, or Control.
Left Pane (Content Toolbar)
User Guide
Chapter 3: Policy and Compliance
HP EnterpriseView (2.5) Page 67 of 265
UI Element Description
Move Up/Move Down
Changes the order of any one of the following items in the policy tree:
l Main Security Category within a policy
l Security Category within a policy or within another security category
l Control within a security category. In order to move a control between
security categories, you need to drag and drop the control.
Left Pane (Content Toolbar), continued
UI Element Description
Paragraph
Number
An alphanumeric string, up to 255 characters, that uniquely identifies the
security category or the control.
Title The title of the security category or the control.
Control Text A description of the control.
Guidelines Includes the following information, as defined in the policy template:
l Guideline Introduction
l Guidelines: To add a guideline, click Add Guideline, and then, in the
Guideline box, enter the guideline text. To delete a guideline, click the
Delete Guideline button next to the guideline that you want to delete.
To add a tag to a guideline, enter a tag name and click Add.
l Guideline Additional Text
l Control Additional Text
Right Pane
User Guide
Chapter 3: Policy and Compliance
HP EnterpriseView (2.5) Page 68 of 265
UI Element Description
Additional
Auditing
Attributes
Includes the following information, as defined in the policy template:
l Priority: For more information, see "Priority" on page 65.
l GRC Designation: For more information, see "GRC Designation" on
page 65.
l Type: For more information, see "Type" on page 65.
l Purpose: For more information, see "Purpose" on page 66.
l Control Weight: For more information, see "Control Weight" on page
66.
l P5 Applicability Weights: For more information, see "P5 Applicability
Weights" on page 66.
Right Pane , continued
Attachments
UI Element Description
Upload Click this button to attach a file to this assessment.
The maximum file size is 5.00 MB.
Delete To delete a file from this control assessment, click the file that
you want to delete, and then click this button.
Download To download a file to your local computer, click the file that you
want to download, and then click this button.
User Guide
Chapter 3: Policy and Compliance
HP EnterpriseView (2.5) Page 69 of 265
Policy and Compliance Assessment Window
The Policy and Compliance Assessment window enables you to audit assets by assessing the
control maturity and asset compliance with a control, for each asset. The different areas and the
functionalities available in each area are described in the following sections. For information on the
EnterpriseView toolbar, see "Toolbar Description" on page 17.
Policy and Compliance Assessment Toolbar
UI Element Description
<Asset Selector> Select the asset that you want to assess from this list or search for
an asset by entering its name.
Clear Assessment Click this button to clear assessments on the entire business
model. For more information, see "Clear Assessment on Assets"
on page 54.
Left Pane
The left pane includes an hierarchical view of the policy or policies, and assessment information on
the policy, security categories, and controls. For detailed information on how the assessment
information is calculated, see "Control Scores Aggregation Mechanism" on page 77.
UI Element Description
Compliance tab Click this tab to display the assessment progress and the
compliance score for each policy element (policy, security
categories, and controls).
User Guide
Chapter 3: Policy and Compliance
HP EnterpriseView (2.5) Page 70 of 265
UI Element Description
Maturity tab Click this tab to display the assessment progress and the control
maturity score for each policy element ((policy, security
categories, and controls).
Reflects the assessment progress in both Compliance and
Maturity tabs.
Provides a visual indication of how much each policy element is
assessed. For the exact assessment percentage, hover over the
relevant icon.
For information on how assessment progress is calculated, see
"Control Scores Aggregation Mechanism" on page 77.
<Score Range> The score range for a specific policy element is indicated by one of
the following icons:
High score
Medium score
Low score
The ranges are determined in "Configure Compliance and Maturity
Score Ranges" on page 63.
The actual score is displayed next to this icon.
Right Pane (Summary)
The summary area in the right pane includes information that is displayed on each of the tabs.
UI Element Description
Last Updated On The last date and time that the control was assessed for the
specific asset.
User Guide
Chapter 3: Policy and Compliance
HP EnterpriseView (2.5) Page 71 of 265
UI Element Description
Maturity Score Measured as a score between 0 and 5.
The evolutionary state of a control when it is applied to a specific
asset, comprised by the weighted average of five factors: People,
Procedure, Process, Product, Proof, also known in
EnterpriseView as P5 maturity factors. For example, if the scores
are: People=5, Procedure=5, Process=5, Product=3, and
Proof=3, then the control maturity score is 4.2.
Maturity Progress Measured as a percent.
The maturity assessment progress reflects how many maturity
factors have been assessed. Each maturity factor counts for a
percentage of the overall score, depending on the number of
maturity factors employed. For example, if all maturity factors are
employed, then each factor counts for 20% of the overall score,
so if two out of five maturity factors have been assessed, then the
maturity assessment progress will be 40%.
Note: If the control employs fewer than five factors, then the
percentage distribution changes accordingly.
Compliance Score See "Compliance Score" on page 75.
Compliance Progress Measured as a percent.
The compliance assessment progress reflects the percentage of
overall asset compliance with a policy.
Control Mappings Indicates whether the control is mapped to other controls. Is
displayed under the following conditions:
l The assessed control is mapped to another control in a
different policy.
l The control to which it is mapped is applied to the same asset
(SoA).
You can click the "n controls" link to see the details of these
controls. For more information on mapping controls between
polices, see "Policy Mapping" on page 59.
User Guide
Chapter 3: Policy and Compliance
HP EnterpriseView (2.5) Page 72 of 265
Assessment Tab
UI Element Description
Compliance Assessment In this area you assess how compliant the selected asset is with
the selected control.
User Guide
Chapter 3: Policy and Compliance
HP EnterpriseView (2.5) Page 73 of 265
UI Element Description
Base Compliance Score This score is the compliance score before network and application
vulnerabilities are considered. If there are no network and
application vulnerabilities that affect compliance, then the base
compliance score and the final compliance score are identical.
To edit this score, click the Edit base Compliance Score
button. For more information, see "Assess Asset Compliance" on
page 51.
An icon representing the assessment method is displayed (see
the following four icons).
Score applied manually
This icon indicates that a score was applied manually.
Score imported from external source
This icon indicates that a score was applied automatically by
importing the assessment from an external system.
Aggregate score
This icon indicates that a score was aggregated from its lower
level assets.
For more information, see "Control Scores Aggregation
Mechanism" on page 77.
Score determined by configuration vulnerabilities
This icon indicates that a score was determined by configuration
vulnerabilities.
For more information, see "Use Configuration Vulnerabilities to
Determine Compliance Score" on page 55.
Ignore Vulnerabilities Select this check box if you want to disable the affect of
vulnerabilities mapped to this control. For information on the
correlation between vulnerabilities and controls, see "Use
Network and Application Vulnerabilities to Refine Compliance
Score" on page 56.
User Guide
Chapter 3: Policy and Compliance
HP EnterpriseView (2.5) Page 74 of 265
UI Element Description
Score is affected by <n>
vulnerabilities
This indication is displayed only if the vulnerabilities that are
mapped to the control are also attached to the asset that is being
assessed. Click the "n vulnerabilities" link to view information
about these vulnerabilities.
Reduced by m%
This indication is displayed only if the assessment on the control
was saved.
The vulnerabilities reduce the compliance score. The reduction is
expressed as a percent and is done automatically when you click
Save. To override this effect, select the Ignore Vulnerabilities
check box, but note that selecting this check box also ignores
imported automatic assessments.
For more information on the correlation between vulnerabilities
and controls, see "Control to Vulnerability Mapping" on page 54.
Compliance Score This number defines how compliant the asset is with the control.
It is calculated as: Base Compliance Score - affect of network
and application vulnerabilities.
Maturity Assessment In this area you assess how mature the control is.
Maturity Score The maturity score is the average of all the P5 maturity score
factors.
To determine the maturity score, click the Edit P5 Maturity
Factor Scores button. For more information, see "Assess
Control Maturity" on page 52.
Implementation Details Record details of how this control has been implemented.
Details Tab
This tab displays information about the control, such as the control text and guidelines. For more
information on control details, see "Content Tab" on page 66.
Attachment Tab
UI Element Description
Upload Click this button to attach a file to this assessment.
The maximum file size is 5.00 MB.
Delete To delete a file from this control assessment, click the file that
you want to delete, and then click this button.
User Guide
Chapter 3: Policy and Compliance
HP EnterpriseView (2.5) Page 75 of 265
UI Element Description
Download To download a file to your local computer, click the file that you
want to download, and then click this button.
Notes Tab
You can add comments and notes to the assessment.
In the text box, enter the required information, and then click Upload. The information is displayed
in a table and includes the creation date and the user name. Click the icon next to the date in
order to view the entire note. You cannot delete or edit notes.
P5 Control Maturity Model Guidelines
The P5 Model states that there are five basic factors to every control that must exist in order for that
control to perform properly.
The following describes the factors of the P5 Model:
l P1: People Assigned staff to oversee and manage controls.
l P2: Policy/Procedure Governance documentation used to specify and manage control.
l P3: Process Operational sequence of activities designed to reduce risk.
l P4: Product Defense-in-depth technologies/solutions to manage/mitigate risk.
l P5: Proof Metrics or validation methods used to track control effectiveness.
Key
Performance
Indicators
0
Not
Performed
1
Performed
Informally
2
Planned and
Tracked
3
Well Defined
4
Quantitativel
y Controlled
5
Continuousl
y Improving
P1: People No personnel
assigned to
control
Part-time
personnel
assigned
Full-time
personnel
assigned
Formally
trained
personnel
assigned
Certified
personnel
assigned
Back-up
personnel
assigned
P2: Policy &
Procedure
No policy for
control exists
Assumed
policy, not
documented
or widely
known
Formal
published
policy with
acknowledgm
ent
Policy applied
to third parties
Policy actively
enforced by
HR departme
nt
Policy
externally
reviewed
User Guide
Chapter 3: Policy and Compliance
HP EnterpriseView (2.5) Page 76 of 265
Key
Performance
Indicators
0
Not
Performed
1
Performed
Informally
2
Planned and
Tracked
3
Well Defined
4
Quantitativel
y Controlled
5
Continuousl
y Improving
P3: Process No process for
control exists
Assumed
processes, not
documented
or widely
known
Task list
oriented
processes
Detailed
narrative-
based
descriptive
processes
Processes
include
evidence of
change control
Processes can
be used by
external
personnel to
perform
control
P4: Product No product for
control exists
Default, open
source or
shareware
solution
deployed
Standardized
point solution
(tool)
deployed,
results
monitored
Tool deployed
with specific
SLA and/or
KPI targets
tracked
Tool deployed
with integrated
management,
logging and
reporting
Multiple layer
tools deployed,
providing
defense in-
depth
approach
P5: Proof No proof for
control exists
Subjective
verbal
attestation
only
Subjective
results;
however,
regularly
reported in
written format
Results
automatically
tracked and
reviewed by
internal audit
Results
independently
reviewed
and/or
validated by
3rd party
Formal
independent
attestations by
TOD/TOE
(SAS 70,
SysTrust etc.)
Control Scores Aggregation Mechanism
In EnterpriseView, assessments that are done on lower-level assets, such as servers, are
automatically trickled up to higher-level assets, such as a department; this mechanism is called
aggregation.
Aggregation is performed on two different levels: 
1. Aggregation on the business model level
Parent assets get the aggregate compliance score, control maturity score, compliance
assessment progress and maturity assessment progress from their children, for each control.
This is done for the entire business model hierarchy.
2. Aggregation on the policy level
After aggregation is done on the business model level, security categories, main security
categories and, lastly, the policy inherit the compliance score, control maturity score
compliance assessment progress and maturity assessment progress from the controls. This is
done separately for each asset in the entire policy hierarchy. If more than one policy is applied
to the asset, then the asset receives the lowest compliance and maturity scores.
The following table includes a description of all assessment parameters.
User Guide
Chapter 3: Policy and Compliance
HP EnterpriseView (2.5) Page 77 of 265
Parameter Description
Compliance Score Measured as a percent.
The compliance of an asset
with a specific control.
Control Maturity Score Measured as a score
between 0-5.
The evolutionary state of a
control when it is applied to a
specific asset, comprised by
the weighted average of five
factors: People, Procedure,
Process, Product, and Proof
(also known in
EnterpriseView as P5
maturity factors). For
example, if the scores are:
People=5, Procedure=5,
Process=5, Product=3, and
Proof=3, then the control
maturity score is 4.2.
User Guide
Chapter 3: Policy and Compliance
HP EnterpriseView (2.5) Page 78 of 265
Parameter Description
Maturity Assessment Progress Measured as a percent.
The maturity assessment
progress reflects the
percentage of the overall
control maturity within a
policy.
Each maturity factor counts
for a percentage of the
overall score, depending on
the number of maturity
factors employed. For
example, if all maturity
factors are employed, then
each factor counts for
20% of the overall score, and
if out of the five maturity
factors two have been
assessed, then the maturity
assessment progress will be
40%.
Note: This parameter is
significant only in policy-
level aggregation.
Compliance Assessment
Progress
Measured as a percent.
The compliance assessment
progress reflects the
percentage of overall asset
compliance with a policy.
Note: This parameter is
significant only in policy-
level aggregation.
Note: Assets that have not been assessed for compliance or control maturity do not affect the
aggregation calculation. For example, asset A has two children: asset B and asset C. Asset
B is assessed and C is not assessed. Asset A will receive the score from asset B.
Aggregation on the Business Model Level
The following sections describe the aggregation mechanism for each of the parameters.
User Guide
Chapter 3: Policy and Compliance
HP EnterpriseView (2.5) Page 79 of 265
Note: Scores are aggregate from a child asset to a parent asset only for controls that are
applied to both child and parent assets.
Compliance Score
A parent asset gets the average compliance score of all its children, on a specific control.
Total ComplianceScores
Number of Children
∑( )
∑( )
For example:
For control X
If
Compliance score for child asset B= 100%
Compliance score for child asset C=0%
Then
Compliance score for parent asset A=50%
Control Maturity Score
Aggregation is done in two steps:
1. A parent asset gets the average score for each P5 maturity factor of all its children.
2. The final control maturity score is the weighted average of the P5 maturity factor scores.
For example:
For control X
If
Child asset A has the following scores on its P5 maturity factors:
People=5, Policy/Procedure=5, Process=5, Product=3, Proof=3
Child asset B has the following scores on its P5 maturity factors:
User Guide
Chapter 3: Policy and Compliance
HP EnterpriseView (2.5) Page 80 of 265
People=5, Policy/Procedure=4, Process=3, Product=3, Proof=5
Then
The parent asset will inherit the following P5 maturity factor scores:
People=5, Policy/Procedure=4.5, Process=4, Product=3, Proof=4
and the overall control maturity score will be 4.1
Aggregation on Policy Level
The following diagram shows the flow of aggregation between policy elements:
Meaning:
1. The assessment parameters of all controls under a specific security category are aggregated
to that security category.
2. The assessment parameters of all security categories under a specific main security category
are aggregated to that main security category.
3. All assessment parameters for the main security categories are aggregated to the policy.
In the following examples, Policy A has the following format:
1 Main Security Category
1.1 Security Category
1.1.1 Control A
User Guide
Chapter 3: Policy and Compliance
HP EnterpriseView (2.5) Page 81 of 265
1.1.2 Control B
Compliance Score
A policy element gets the average compliance score of all its contained elements, for a specific
asset.
For example:
If
Compliance score for Control A (1.1.1)= 100
Compliance score for Control B (1.1.2) =0
Then
Security Category (1.1), Main Security Category (1) and Policy A inherit the average score of
50.
Control Maturity Score
Aggregation is done in two steps:
1. A policy element gets the average score for each P5 maturity factor of all its contained policy
elements.
2. The final control maturity score is the weighted average of the P5 maturity factor scores.
For example:
If
Control A (1.1.1) has the following scores on its P5 maturity factors:
P1=5, P2=5, P3=5, P4=3, P5=3
Control B (1.1.2) has the following scores on its P5 maturity factors:
P1=5, P2=4, P3=3, P4=3, P5=5
Then
Security Category (1.1), Main Security Category (1) and Policy A inherit a control maturity
score of 4.1.
Note: Some dashboards display the score on the P5 control maturity factor level. In this
example, the following scores will be displayed:
P1=5, P2=4.5, P3=4, P4=3, P5=4
Maturity/Compliance Assessment Progress
A policy element inherits the average maturity/compliance assessment progress of all its contained
policy elements, on a specific asset.
User Guide
Chapter 3: Policy and Compliance
HP EnterpriseView (2.5) Page 82 of 265
For example: 
If
Maturity assessment progress
for Control A (1.1.1) = 100% (fully assessed)
Maturity assessment progress
for Control B (1.1.2)= 0% (not assessed)
Then
Security Category (1.1), Main Security Category (1) and Policy A is 50%
Weights and Criticality Level
Aggregation of assessment scores is affected by the following factors:
l Criticality Level. One of the asset properties; it is determined when an asset is created in the
business model, but can be modified at any time. For more information, see "Criticality Level" on
page 33.The criticality level determines the weight of an asset's scores when it is aggregated on
the business model level; it does not affect aggregation on the policy level.
For example:
If
For child asset A: Compliance Score= 100, Criticality Level=1
For child asset B: Compliance Score =10, Criticality Level=2
Then
Compliance Score for parent asset=40
Calculation:
(100 * 1) + (10 * 2)
(1 + 2)
l Control Weight. One of the policy properties, configurable through the control template. It is
determined when a control is defined in a policy. It can be modified until the assessment process
on a policy begins. The control weight determines the weight of a specific control in regard to
other controls within a specific policy when it is aggregated on the policy level; it does not affect
aggregation on the business model level. For more information, see "Control Weight" on page
66.
For example:
If
User Guide
Chapter 3: Policy and Compliance
HP EnterpriseView (2.5) Page 83 of 265
Compliance Score for Control A (1.1.1)= 10, Control Weight=100
Compliance Score for Control B (1.1.2) =100, Control Weight=50
Then
Security Category (1.1), Main Security Category (1) and Policy A inherit the weighted
average score of 40.
Calculation: 
(10 * 100) + (100 * 50)
(100 + 50)
User Guide
Chapter 3: Policy and Compliance
HP EnterpriseView (2.5) Page 84 of 265
Chapter 4: Risk Management
Risk management is the continuous process of identifying, assessing, mitigating, and monitoring
risk. EnterpriseView supports self-directed information security risk evaluation that enables you to
make information protection decisions based on risks to your critical information-technology
assets.
EnterpriseView offers you the following capabilities for managing risk in your organization:
1. Create a threat library.
The Threat Library Builder is the foundation of the Risk Modeling module. The Threat Library
Builder offers ready-to-use threats that are common to most organizations. Threats, made up
of an initiator (referred to as Actor in EnterpriseView) and the threatening incident (referred to as
Operation in EnterpriseView), can be added, modified or deleted, according to the requirements
of the organization. An actor can be anything from a hacker to a technical failure and operations
may range from natural disasters to malicious actions. EnterpriseView provides simple drag
and drop capabilities to create threats, which are displayed as visual threat trees. For more
information, see "Create a Threat Library" on the next page.
2. Identify potential risks to your organization.
The Risk Modeling module supports scenario-based risk identification. By associating a
certain threat with an asset, you create a threat scenario which can later be assessed. For
more information, see "Assign Threats to Assets" on page 89.
3. Assess risk on threat scenarios.
Risk assessment directly affects the business strategy and the objectives of the organization.
EnterpriseView supports risk analysis and evaluation by applying a qualitative value (such as
low, medium, or high) to relevant impact areas and defining the likelihood of the threat scenario
occurring. The risk scores are calculated from these parameters and are used to prioritize risks
for mitigation. Risk acceptance levels are based on the risk tolerance level that you define for
each risk individually. For more information, see "Assess the Risk on an Asset" on page 92.
4. Create a risk treatment plan.
The treatment plan should coincide with your organization's risk management strategy and the
risk tolerance level (the amount of risk that your organization is willing to accept). For more
information on creating a treatment plan, see "Create a Treatment Plan" on page 98.
Risk can be mitigated, accepted, avoided, deferred, or transferred. For more information on
each of these methods, see "About Risk Treatment Methods" on page 93.
You can use policy controls to mitigate risk by using EnterpriseView's control to threat
mapping capabilities to automatically correlate controls to threats and reduce the risk score.
For more information, see "Mitigate Risk Automatically Using Policy Controls" on page 95.
5. Monitor risk.
HP EnterpriseView (2.5) Page 85 of 265
Risk monitoring is a constant process that can be done throughout the risk life cycle.
EnterpriseView includes dashboards and printable reports that help you analyze the origin of
the risk in your organization. For example, the Risk Register provides an overview of all the
status of the risk factors that affect your organization, Risk Indicators helps you quickly locate
high risk assets in your organization, and the Risk Modeling Dashboard displays detailed
information on modeled risk. Use the drill down functionality to navigate the different
dashboards and pages and find the root cause of the risks in your organization. For more
information, see "Dashboards and Reports" on page 174 and "Root Cause Analysis" on page
177.
In addition, EnterpriseView offers flexible risk score configuration. You can assign weights to the
impact areas that comprise the impact score, configure risk score and probability thresholds for
defining risk severity, select the risk aggregation method that best reflects your organization's
strategy, and determine the thresholds of risk KPIs. For more information, see "Risk Settings" on
page 106.
Create a Threat Library
A threat is a potential cause of an unwanted incident which may result in harm to the organization.
For example, someone could initiate a denial-of-service attack against an organization's mail
server, or a fire or natural disaster could damage an organization's IT hardware. A threat is created
when a threat actor exploits a vulnerability.
In EnterpriseView, threats consist of an actor and an operation.
Relative weights can be ascribed to the different actors or to actor categories, and to the various
factors that are affected by the threat (such as financial, reputation, productivity, fines/legal, and
safety and health), known in EnterpriseView as impact areas. For more information, see "Configure
Risk Assessment Settings" on page 107.
The Threat Library Builder offers ready- to-use threats that are common to most organizations. You
can add, modify, or delete threats, operations, and actors according to the requirements of your
organization. For more information on maintaining threats, actors and operations, see "Threat
Library Builder Window" on page 115.
To create a new threat
1. If the actor required for this threat does not exist in the threat library, follow the instructions in
"Create an Actor" on the next page.
2. If the operation required for this threat does not exist in the threat library, follow the instructions
in "Create an Operation" on page 88.
3. Connect an actor to an operation, as described in "Connect Actor to Operation" on page 88.
User Guide
Chapter 4: Risk Management
HP EnterpriseView (2.5) Page 86 of 265
Create an Actor
An actor is a potential initiator of a violation of the security requirements (confidentiality, integrity,
availability) of an asset in your organization.
Actors are divided into categories. EnterpriseView includes the following categories.
Category Description
End Users This category represents threats to the asset that are caused by users
authorized by the organization.
Threats in this category require direct action by a person and can be
deliberate or accidental in nature.
External Users This category represents threats to the asset that result from physical
access to the asset.
Threats in this category require direct action by a person and can be
deliberate or accidental in nature.
IT Users This category represents threats to the asset through the organization’s
technical infrastructure.
Threats in this category require direct action by a person and can be
deliberate or accidental in nature.
Physical Threats This category includes problems or situations that are outside the
control of an organization. This category of threats includes natural
disasters (such as floods or earthquakes) and interdependency risks.
Interdependency risks include the unavailability of critical
infrastructures (such as power supply).
Technical Failures This category includes problems with an organization’s information
technology and systems. Examples include hardware defects, software
defects, malicious code (such as viruses), and other system-related
problems.
You can create an actor under an existing category or create a new category.
To create an actor
1. Click Risk Modeling > Threat Library Builder.
2. On the Actors tab, from the actor tree, click the category to which you want to add a new actor,
and then click the New Actor button.
3. On the Actors dialog box, do the following, and then click Save:
User Guide
Chapter 4: Risk Management
HP EnterpriseView (2.5) Page 87 of 265
a. Name: Enter a unique name for the actor.
b. Description: Enter a description for the actor, which will appear as a tooltip.
The new actor is displayed in the actor tree.
To create a new actor category
1. Click Risk Modeling > Threat Library Builder.
2. On the Actors tab, click the New Category button.
3. On the New Category dialog box, do the following, and then click Save:
a. Name: Enter a unique name for the category.
b. Description: Enter a description for the category, which will appear as a tooltip.
The new category is displayed in the actor tree.
Create an Operation
An operation is the violation of the security requirements of an asset performed by an actor.
EnterpriseView includes numerous predefined operations.
To create an operation
1. Click Risk Modeling > Threat Library Builder.
2. On the Operations tab, click the New Operation button.
3. On the Operations dialog box,do the following, and then click Save.
a. Name: Enter a unique name for the operation.
b. Information Security Threat Type: If the threat is an information security threat, then
select the type.
c. Description: Enter a description. This description will appear as a tooltip for the operation.
The new operation is displayed in the operations tree. Operations are sorted alphabetically.
Connect Actor to Operation
You can create a threat by connecting an actor and an operation.
User Guide
Chapter 4: Risk Management
HP EnterpriseView (2.5) Page 88 of 265
To connect an actor and an operation
1. Click Risk Modeling > Threat Library Builder.
2. On the Actors tab, from the actors tree, locate the required actor. To expand the actors tree,
click next to the category. Drag the actor to which you want to connect an operation to the
map area. If the actor already has operations that are connected to it, they are displayed in the
map area.
3. Click the Operations tab. From the list of operations, locate the operation that you want to
attach to the actor, and drag it onto the actor icon in the map area.
The operation is connected to the actor and is displayed in the Operations section in the map
area.
4. To disconnect an operation from an actor, click the operation in the graph, and then press
DELETE.
Disconnect Actor from Operation
You can delete a threat by disconnecting an actor from an operation.
To disconnect an actor from an operation
1. Click Risk Modeling > Threat Library Builder.
2. On the Actors tab, from the actors tree, locate the required actor. To expand the actors tree,
click next to the category. Drag the actor to the map area.
3. Click the operation in the map are, and then press DELETE.
Assign Threats to Assets
When you assign a threat to an asset you create a Threat Scenario. A threat scenario is a situation
in which an asset can be compromised. It generally consists of a threat (an actor and an operation),
and an asset. Threat scenarios provide a simple way to determine if a risk exists that could affect
your asset. An asset can have many threats associated with it.
The following diagram shows an asset that has several threat scenarios. The path marked in red is
a single threat scenarion.
User Guide
Chapter 4: Risk Management
HP EnterpriseView (2.5) Page 89 of 265
To create a threat scenario, connect a threat to an asset. You can connect threats to assets from
both the Graph view and the Table view.
After you assign threats to assets, you can assess the risk for the assets. For more information,
see "Assess the Risk on an Asset" on page 92.
To assign a threat to an asset (Graph view)
1. Click Risk Modeling > Threat Assignment.
2. In the Threat Assignment window, from the Asset list, select the asset to which you want to
assign threats.
3. Click the Graph button.
The left pane is divided into two areas: 
n Associated Threats displays all the threats that are already associated with the asset
n Unassociated Threats displays all the threats that are not associated with the asset
User Guide
Chapter 4: Risk Management
HP EnterpriseView (2.5) Page 90 of 265
All threats are grouped by actor and category.
4. To expand the threats tree, click next to the category/actor.
5. From the Unassociated Threats area, click the threat that you want to assign to the asset,
and then click Add or drag the threat to the map area. You can also assign an entire group of
threats, either grouped by actor or by category, by clicking the category or actor. To multi-
select threats, press CRTL and click the threats you want to assign.
The threat is displayed in the Associated Threats area and in the map area.
6. To disconnect a threat from an asset, from the Associated Threats area, click the threat that
you want to remove, and then click Remove.
Caution: If you disconnect a threat that has risk scores applied, then all the data on this
threat is deleted and cannot be restored.
The threat is displayed in the Unassociated Threats area and is removed from the map area.
You can also drag and drop threats between the Unassociated Threats and Associated
Threats areas.
To assign a threat to an asset (Table view)
1. Click Risk Modeling > Threat Assignment.
2. In the Threat Assignment window, from the Asset list, select the asset to which you want to
assign threats.
3. Click the Table button.
4. From the Show Threats drop-down list, select Unassociated to Asset or All Threats.
5. From the table, select the Associated check box for all the relevant threats, and then click
Save.
6. To disconnect a threat from an asset, from the Show Threats drop-down list, select
Associated to Asset or All Threats, from the table, clear the Associated check box for all the
relevant threats, and then click Save.
Caution: If you disconnect a threat that has risk scores applied, then all the data on this
threat is deleted and cannot be restored.
User Guide
Chapter 4: Risk Management
HP EnterpriseView (2.5) Page 91 of 265
Assess the Risk on an Asset
After you assign threats to assets, you can assess the risk for the assets.
To assess risk on an asset
1. Click Risk Modeling > Risk Assessment and Treatment.
2. In Risk Assessment and Treatment window, from the Asset list, select the asset that you
want to assess.
All threats assigned to this asset are displayed in the left pane.
Note: Make sure that you are in the Assessment and Treatment view by clicking the
Assessment and Treatment button on the toolbar.
3. From the list of threats in the left pane, click the threat that you want to assess. To expand the
threats tree, click next to the category/actor.
4. In the right pane, in the Assessment section, click the Edit Assessment button.
5. In the Risk Tolerance Level box, enter the maximum level of risk exposure that you are willing
to accept for this asset in this threat scenario.
6. In the Impact Areas table, click the Value cell of each impact area and select a value.
The values are configurable, as described in "Configure Risk Assessment Settings" on page
107.
The impact score is automatically calculated and displayed on the screen. For more
information on how the score is calculated, see "Impact Score Calculation" on page 112.
7. In the Probability box, enter a number between 0 and 1, up to two places after the decimal
point. For example, 0.5.
The Inherent Risk Score is automatically calculated as the Impact Score X Probability.
If the inherent risk score exceeds the risk tolerance level, then you receive the warning
"Exceeds the tolerance level".
8. Change the Risk Status to Assessed.
9. Click Save.
The impact score and the inherent risk score are applied to the operation, actor, and actor
category and the inherent risk score is aggregated to the asset, as described in "Residual Risk
Score Calculation" on page 112. All scores are copied to the Treatment section.
User Guide
Chapter 4: Risk Management
HP EnterpriseView (2.5) Page 92 of 265
The date and time of this assessment is updated in the Last Updated On field.
Risk Treatment
Risk treatment is the process of selecting and implementing a course of action to reduce risk. After
you identify and assess the risk, you need to evaluate which treatment method is most suitable for
handling the risk. EnterpriseView supports the following methods for handling risk: mitigation,
acceptance, transference, avoidance, and deferral. For more information on these methods, see
"About Risk Treatment Methods" below.
You can use policy controls to mitigate risk by using EnterpriseView's control to threat mapping
capabilities to automatically correlate controls to threats and reduce the risk score. For more
information, see "Mitigate Risk Automatically Using Policy Controls" on page 95.
After you have decided how to handle the risk, create a treatment plan, as described in "Create a
Treatment Plan" on page 98.
About Risk Treatment Methods
EnterpriseView includes the following methods for handling risk:
l Mitigation
Also referred to as Risk Reduction.
Mitigating risk means that you take action to reduce the impact or the likelihood of a risk. For
example, installing fire extinguishers in your office buildings can reduce the impact of a fire, if it
occurs. In this example, the impact is reduced while the probability does not change.
For more information, see "Mitigate Risk" on page 99.
EnterpriseView allows you to mitigate risk in the following ways:
n Control Action
By using control-based actions. This is the most common methods for reducing risk.
Optimally, your Statement of Applicability will always be up-to-date, all controls will be as
compliant as they possibly can, and all relevant controls will be mapped to the appropriate
threat. In this case, risk will be mitigated automatically, as described in "Mitigate Risk
Automatically Using Policy Controls" on page 95. If this is not the case, though, you may
need to create a control action in order to either add controls to your Statement of Applicability
or to make the controls more compliant (increasing their compliance score). For more
information, see "Add a Control Action" on page 100.
User Guide
Chapter 4: Risk Management
HP EnterpriseView (2.5) Page 93 of 265
n Manual Action
By creating manual actions when controls are insufficient. For more information, see "Add a
Manual Action" on page 102.
In any case, both impact score and probability can be reduced manually to create the residual
risk score.
l Acceptance
Also referred to as Risk Retention.
Accepting risk means that you acknowledge that the risk can happen without doing anything to
prevent it. Typically, this method is used when a risk is low or is less than the risk tolerance
level. You may decide that the cost of reducing this risk is too high compared to accepting it.
This treatment activity can be limited in time. If it is, then the owner is required to evaluate and
address the risk after the expiration date passes. The owner receives an email notification when
the expiration date passes.
For more information on accepting risk, see "Accept Risk" on page 104.
l Transference
Also referred to as Risk Sharing.
Transferring risk means that you transfer the responsibility of reducing the risk exposure from
your organization to a third party. For example, a common third party is an insurance company. If
one of the risks in your organization is laptop theft, then insuring all company laptops against
theft is a means of transferring the risk to the insurance company.
This treatment activity is limited in time and the owner is required to evaluate and address the
risk after the expiration date passes. The owner receives an email notification when the
expiration date passes.
For information on transferring risk, see "Transfer Risk" on page 105.
l Avoidance
Avoiding risk means that you do not perform a certain activity so that the risk does not occur. For
example, if one of the entry doors to your office building is not secure and poses a high risk for
unwanted intruders, then you can decommission that entry door, allowing employees entry
through other doors. This course of action will help you avoid the risk.
This treatment activity is limited in time and the owner is required to evaluate and address the
risk after the expiration date passes. The owner receives an email notification when the
expiration date passes.
For information on avoiding risk, see "Avoid Risk" on page 106
User Guide
Chapter 4: Risk Management
HP EnterpriseView (2.5) Page 94 of 265
l Deferral
Deferring risk means that you decide to postpone handling the risk to a future date, when the risk
is less likely to happen. Typically, this method is used when the initial risk is low.
This treatment activity can be limited in time. If it is, then the owner is required to evaluate and
address the risk after the expiration date passes. The owner receives an email notification when
the expiration date passes.
For information on deferring risk, see "Defer Risk" on page 104.
Mitigate Risk Automatically Using Policy Controls
There is an inherent correlation between policy controls and risks; controls are used to mitigate risk
in a risk treatment plan, and, in turn, the output of the risk treatment process facilitates in identifying
security requirements or controls that need to be added to the statement of applicability.
EnterpriseView includes control to threat mapping capabilities that enable you to automatically
reduce the risk scores by using the controls that are part of your Statement of Applicability. This
capability saves you the trouble of repeatedly calculating the potential affect of a control on a threat
every time you conduct a risk audit. A formula is used to calculate the affect of the controls. The
output of this formula is an adjusted probability. The adjusted probability is used to calculate the
residual risk.
EnterpriseView includes out-of-the-box mappings for the threats and controls that are included in
EnterpriseView, and enables you to add additional mappings for any new control or threat
introduced into the system. For more information, see "Map Controls to Threats" on the next page,
"Edit Control to Threat Mapping" on page 97, and "Delete Control to Threat Mapping" on page 97.
Controls automatically affect the probability of a threat scenario when the following conditions
occur:
l The control is mapped to the threat.
l The control is applied to an asset and a threat is attached to the same asset.
l The control has a compliance score resulting from a manual assessment, an automatic
assessment, or affecting vulnerabilities.
The compliance score of the control is entered into a formula that recalculates the probability of the
risk, creating a new Adjusted Probability. The direction of the relationship (positive/negative)
between the compliance score of the control and the probability of the risk depends on whether the
compliance score is higher or lower than 85:
l If the control's compliance score is higher than the 85, then the compliance score reduces the
probability of the risk.
l If the control's compliance score is lower than the 85, then the compliance score increases the
probability of the risk.
User Guide
Chapter 4: Risk Management
HP EnterpriseView (2.5) Page 95 of 265
The following formulas are used:
If higher than the 85
NewTempProbability TreatedProbability α Tre tedProb bility= − * *
ControlScore β
β
−
100−
If lower than the 85
( )NewTempProbability TreatedProbability α Tre tedProb bility= + * * 1−
ControlScore
β
Note: If the calculation result is higher than 1, then the NewTempProbability will be 1.
If there is more than one control mapped to the threat, the probability for each is calculated
separately and then averaged to the adjusted probability. The adjusted probability is:
AdjustedProbability =
NewTempProbability
Number of Controls
∑
EnterpriseView includes mappings of controls from the following policies:
l Payment Card Industry (PCI) Data Security Standard (DSS) Version 2.0
l HIPAA Security Rule – NIST
l NIST Special Publication (SP) 800 53, Revision 3
l ISO 27002:2005
l Unified Compliance Framework (UCF) 2013 Q1 release
Map Controls to Threats
You can add new control to threat mappings.
To map controls to threats
1. Click Risk Modeling > Control to Threat Mapping.
2. On the Control to Threat Mapping page, click Add Mapping.
3. On the Select a Threat page, expand the tree and select an operation.
4. On the Select Controls for Mapping page, from the Policy list, select a policy.
5. From the list of controls, select the controls that you want to map to the threat, and then click
the Add to Mapping button.
To remove controls from the mapping, click the Remove from Mapping button.
User Guide
Chapter 4: Risk Management
HP EnterpriseView (2.5) Page 96 of 265
6. Click Finish.
Edit Control to Threat Mapping
You can edit existing control to threat mappings.
To edit a mapping
1. Click Risk Modeling > Control to Threat Mapping.
2. On the Control to Threat Mapping page, select the mapping that you want to edit, and then
click Edit Mapping.
You can search for specific mappings by using free text search.
Note: You can perform wildcard searches. For example, if you type ser*, the results will
contain words beginning with ser (such as server and service). An asterisks cannot be
placed before a string (*ser).
3. To add controls, do the following:
a. On the Edit Mapping dialog box, from the policy list, select a policy.
b. From the list of controls, select the controls that you want to map to the threat, and then
click the Add to Mapping button.
4. To remove controls from the mapping, click the Remove from Mapping button.
5. Click Finish.
Delete Control to Threat Mapping
You can delete both user-created and out-of-the-box mappings.
Note: If you delete a mapping then any affect that control has on a threat scenario is
eliminated.
To delete a mapping
1. Click Risk Modeling > Control to Threat Mapping.
2. On the Control to Threat Mapping page, select the mapping that you want to delete, and then
click the Delete Mapping
User Guide
Chapter 4: Risk Management
HP EnterpriseView (2.5) Page 97 of 265
button.
You can search for specific mappings using free text.
Note: You can perform wildcard searches. For example, if you type ser*, the results will
contain words beginning with ser (such as server and service). An asterisks cannot be
placed before a string (*ser).
3. Click Yes to confirm the action.
Create a Treatment Plan
A risk treatment plan is necessary in order to describe how you respond to potential risk. The
treatment plan is comprehensive and provides all the information required about the proposed
actions, time plans, resource requirements, and roles and responsibilities.
EnterpriseView supports the following methods for handling risk: mitigation, acceptance,
transference, avoidance, and deferral. For more information on these methods, see "About Risk
Treatment Methods" on page 93. You can incorporate any combination of methods in your
treatment plan. For example, you can take action, such as applying controls, to reduce the risk of a
threat scenario until it is well below the risk tolerance level and then accept the residual risk.
You can create a treatment plan only after you have assessed the risk of a threat scenario. For
more information on assessing risk, see "Assess the Risk on an Asset" on page 92.
Note: Initially, all risk scores: impact area values, impact score, and probability that are
displayed in the Treatment area, are the same as the scores that are displayed in the
Assessment area. This is because you did not begin treatment. Until you begin treatment,
whenever you change assessment scores, they will be reflected in the Treatment area. But at
the moment you begin treatment, if you change the scores in the Assessment area, they are
no longer reflected in the Treatment area.
To create a treatment plan
1. Click Risk Modeling > Risk Assessment and Treatment.
2. In the Risk Assessment and Treatment window, from the Asset list, select an asset.
All threats assigned to this asset are displayed in the left pane.
Note: Make sure that you are in Assessment and Treatment view by clicking the
Assessment and Treatment button on the toolbar.
User Guide
Chapter 4: Risk Management
HP EnterpriseView (2.5) Page 98 of 265
3. From the list of threats in the left pane, click the threat that you want to handle. To expand the
threats tree, click next to the category/actor.
4. In the right pane, in the Treatment section, click the Edit Treatment button.
5. From the Select a treatment method list, select the method that you want to use, and then
click Add.
6. According to the method that you selected, follow the instructions in one of the following
procedures:
n Mitigate risk, as described in "Mitigate Risk" below.
n Accept risk, as described in "Accept Risk" on page 104.
n Transfer risk, as described in "Transfer Risk" on page 105.
n Avoid risk, as described in "Avoid Risk" on page 106.
n Defer risk, as described in "Defer Risk" on page 104.
7. You can use any number of methods in your treatment plan.
8. To delete a treatment activity, under the treatment activity that you want to delete, click the
Delete button.
9. Change the Risk Status to reflect the treatment status.
Mitigate Risk
When you mitigate risk you take action to reduce the impact or the likelihood of the risk. A
mitigation treatment activity can include one or more action plans for reducing risk. You can create
the following types of actions:
l Control action
l Manual action
For more information, see "Mitigation" on page 93.
To mitigate risk
1. In the Risk Assessment and Treatment window, in the Treatment area, from the Select a
treatment method list, select Mitigate, and then click Add.
2. In the Description field, enter necessary information about this treatment activity.
User Guide
Chapter 4: Risk Management
HP EnterpriseView (2.5) Page 99 of 265
3. In the Owner field, enter the name of the owner of this treatment activity. The owner of this
activity is responsible for managing all the actions required to carry out this treatment activity.
4. In the Due Date field, enter the date on which all actions for mitigating the risk should be
completed. If this date passes and not all actions are completed, then the owner of this
treatment activity receives an email notification that the treatment activity is overdue.
5. Create an action. Select one of the following options:
n Create a control action, as described in "Add a Control Action" below.
n Create a manual action, as described in "Add a Manual Action" on page 102.
6. Add as many actions as necessary.
7. After you complete an action or at any time during the treatment process, update the impact
score and probability according to the treatment that you implemented, as follows:
a. In the Treatment section, click the Edit Treatment button.
b. If the impact was reduced due to treatment, then update the values in the Impact Areas,
as necessary.
c. If the probability of this risk was reduced due to treatment, then in the Treated Probability
box, enter a new value.
The Adjusted Probability is modified according to any control to threat mapping and to
the treated probability. For more information on control to threat mapping, see "Mitigate
Risk Automatically Using Policy Controls" on page 95.
The residual score is calculated as follows:
Residual Risk Score = Adjusted/Treated Probability X Impact Score (as defined in
the Treatment section).
d. In the Treatment section, click Save.
e. To delete the mitigation treatment activity, under the actions table, click Delete the
mitigation treatment activity button.
Add a Control Action
You can add one or more control actions to your mitigation treatment activity. After you create the
action, you can create a workflow for carrying out the action plan. The workflow that is created is
based on the template that is set in Settings. EnterpriseView includes a default template for
creating a workflow for a control action, but you can change these settings, as described in
"Configure Risk Mitigation Workflow Templates" on page 265.
User Guide
Chapter 4: Risk Management
HP EnterpriseView (2.5) Page 100 of 265
To add a control action
1. In the Risk Assessment and Treatment window, in the Treatment section, click Add Action
and select Control.
2. In the New Control Action dialog box, enter the information described in the following table:
Property Description
Name Enter a short, descriptive name for this action.
If you create a workflow from the action, then the workflow name will
be:
"Action ID + Action Name"
Owner Enter the name of the user who is responsible for handling this action.
If you create a workflow from this action, then this user will also be the
owner of the workflow that is created. The owner of this workflow will
be responsible for carrying out the workflow.
Due Date Enter the date on which this action should be completed.
If you publish this action, then this due date will also be the due date of
the workflow that is created. After an action is published, and a
workflow is created, then the due date can be changed on the
workflow from Task Management > Workflow Management, as
described in "Edit Workflow Properties" on page 247.
If the workflow is not completed by the due date, then an email
notification is sent to the workflow owner who is also the action
owner.
Status The initial status of the action is New.
If you publish this action, then after the workflow is created, the status
of the action is automatically updated to In Progress. After the
workflow is completed, it is automatically updated to Completed.If
you do not publish this action, then you can change the status of this
action manually.
3. In the New Control Action dialog box, review the controls in the table. The controls that are
displayed in this table are all controls that are mapped to the threat. For more information on
control to threat mapping, see "Mitigate Risk Automatically Using Policy Controls" on page 95.
Note: Controls can only be selected once in a treatment plan. If you already created a
control action and selected controls, they will not be displayed again in a different control
action.
User Guide
Chapter 4: Risk Management
HP EnterpriseView (2.5) Page 101 of 265
The controls are either already applied to the asset (in your Statement of Applicability) or not
yet applied. Select the following controls, and then click OK:
n Controls applied to asset: Select controls that are already applied to the asset if you think
that their compliance score can be improved (increased). If the compliance scores of these
controls are improved, then they will automatically reduce the risk. Selecting these controls
means that they will be reassessed.
n Controls not applied to asset: Select controls that are not applied to the asset, but that
you think should be applied to the asset in order to reduce the risk. Selecting these controls
means that they will be added to the statement of applicability and reassessed.
If you publish this action, then the list of controls and instructions will be displayed in the
Controls tab in the Workflow properties in the Workflow Management window and in the My
Tasks dialog box.
4. In the Risk Assessment and Treatment window, click Save.
5. To publish the action, click the Create a workflow from this action button.
A workflow is created. The name and due date of the workflow are the same as the action's.
6. To delete an action, click the Delete Action button.
7. To edit the action properties, click the Edit Action button.
Add a Manual Action
You can add one or more manual actions to your mitigation treatment activity. After you create the
action, you can create a workflow for carrying out the action plan. The workflow that is created is
based on the template that is set in Settings. EnterpriseView includes a default template for
creating a workflow for a manual action, but you can change these settings, as described in
"Configure Risk Mitigation Workflow Templates" on page 265.
To add a manual action
1. In the Risk Assessment and Treatment window, in the Treatment section, click Add Action
and select Manual.
2. In the New Manual Action dialog box, enter the information described in the following table,
and then click OK:
User Guide
Chapter 4: Risk Management
HP EnterpriseView (2.5) Page 102 of 265
Property Description
Name Enter a short, descriptive name for this action.
If you create a workflow from the action, then the workflow name will
be: 
"Action ID + Action Name"
Owner Enter the name of the user who is responsible for handling this action.
If you create a workflow from this action, then this user will also be the
owner of the workflow that is created. The owner of this workflow will
be responsible for carrying out the workflow.
Due Date Enter the date on which this action should be completed.
If you create a workflow from this action, then this due date will also
be the due date of the workflow that is created. After a workflow is
created, then the due date can be changed on the workflow from Task
Management > Workflow Management, as described in "Edit
Workflow Properties" on page 247.
If the workflow is not completed by the due date, then an email
notification is sent to the workflow owner who is also the action
owner.
Status The initial status of the action is New.
If you publish this action, then after the workflow is created, the status
of the action is automatically updated to In Progress. After the
workflow is completed, it is automatically updated to Completed.If
you do not publish this action, then you can change the status of this
action manually, as you see fit.
Action Plan Enter a step by step description of how this action should be carried
out.
If you create a workflow for this action, then this information will be
displayed in the workflow Description property.
Resources Enter any necessary resources required to carry out the action plan.
If you create a workflow for this action, then this information will be
displayed in the workflow Description property.
Budget/Cost Enter any necessary monetary information.
If you create a workflow for this action, then this information will be
displayed in the workflow Description property.
User Guide
Chapter 4: Risk Management
HP EnterpriseView (2.5) Page 103 of 265
3. In the Risk Assessment and Treatment window, click Save.
4. To publish the action, click the Create a workflow from this action button.
A workflow is created. The name and due date of the workflow are the same as the action's.
5. To delete an action, click the Delete Action button.
6. To edit the action properties, click the Edit Action button.
Accept Risk
When you accept risk you acknowledge the risk without doing anything to prevent it. For more
information, see "Acceptance" on page 94.
To accept a risk
1. In the Risk Assessment and Treatment window, in the Treatment area, from the Select a
treatment method list, select Accept, and then click Add.
2. From the Reason list, select the reason for accepting the risk. If the reason is not listed, select
Other and enter a detailed description.
3. If you want to reevaluate the risk after a period of time, then select the Accept this risk for a
limited time check box.
If you selected this check box, then the Description, Owner, and Expiration Date fields are
mandatory.
4. In the Description box, enter information necessary for reevaluating this treatment activity.
5. In the Owner box, enter the name of the owner of this treatment activity. The owner of this
activity is responsible for reevaluating this treatment activity after the expiration date. On the
expiration date, the owner will receive an email notification about this activity.
6. In the Expiration Date box, enter the date after which the Accept treatment activity is no
longer valid.
7. Click Save.
Defer Risk
When you defer a risk you decide that you don't want to handle it in the present and you want to
postpone handling it at a later date. For more information, see "Deferral" on page 95.
User Guide
Chapter 4: Risk Management
HP EnterpriseView (2.5) Page 104 of 265
To defer a risk
1. In the Risk Assessment and Treatment window, in the Treatment area, from the Select a
treatment method list, select Defer, and then click Add.
2. From the Reason list, select the reason for deferring the risk. If the reason is not listed, select
Other and enter a detailed description.
3. Select the Accept this risk for a limited time check box.
4. In the Description box, enter information necessary for reevaluating this treatment activity.
5. In the Owner box, enter the name of the owner of this treatment activity. The owner of this
activity is responsible for handling the risk after the expiration date. On the expiration date, the
owner will receive an email notification about this activity.
6. In the Expiration Date box, enter the date to which you want to postpone handling this risk.
7. Click Save.
Transfer Risk
When you transfer risk, you transfer the responsibility of reducing the risk exposure from your
organization to a third party. For more information, see "Transference" on page 94.
To transfer a risk
1. In the Risk Assessment and Treatment window, in the Treatment area, from the Select a
treatment method list, select Transfer, and then click Add.
2. In the Description box, enter information necessary for reevaluating this treatment activity.
3. In the Owner box, enter the name of the owner of this treatment activity. The owner of this
activity is responsible for reevaluating this treatment activity after the expiration date.
4. In the Expiration Date box, enter the date after which the Transfer treatment activity is no
longer valid.
On the expiration date, if this activity is not completed (status Completed), then the owner will
receive an email notification about this activity.
5. From the Status list, select the status for this treatment activity.
6. In the Action Plan box, enter the course of action that you are taking for transferring this risk.
7. In the Resources box, enter the resources required for transferring this risk. For example,
details about the third party employed to handle this risk.
User Guide
Chapter 4: Risk Management
HP EnterpriseView (2.5) Page 105 of 265
8. In the Budget/Cost box, enter monetary information. For example, the price of annual
insurance.
9. Click Save.
Avoid Risk
When you avoid risk you avoid performing a specific activity so that the risk is nullified. For more
information, see "Avoidance" on page 94.
To avoid risk
1. In the Risk Assessment and Treatment window, in the Treatment area, from the Select a
treatment method list, select Avoid, and then click Add.
2. In the Description box, enter information necessary for reevaluating this treatment activity.
3. In the Owner box, enter the name of the owner of this treatment activity. The owner of this
activity is responsible for reevaluating this treatment activity after the expiration date.
4. In the Expiration Date box, enter the date after which the avoid treatment activity is no longer
valid.
On the expiration date, if this activity is not completed (status Completed), then the owner will
receive an email notification about this activity.
5. From the Status list, select the status for this treatment activity.
6. In the Action Plan box, enter the course of action that you are taking for avoiding this risk.
7. In the Resources box, enter the resources required for avoiding this risk, if necessary.
8. In the Budget/Cost box, enter monetary information, if necessary.
9. Click Save.
Risk Settings
You can configure the following risk settings:
l Decide how the risk score is aggregated, as described in "Configure Risk Score Aggregation
Method" on the next page.
l Define impact areas and actor and category weights, as described in "Configure Risk
Assessment Settings" on the next page.
User Guide
Chapter 4: Risk Management
HP EnterpriseView (2.5) Page 106 of 265
l Define the thresholds that indicate the severity of your risk scores, as described in "Configure
Risk Score Ranges" on page 109.
l Override the general threshold definitions for a specific asset, as described in "Configure Asset
Risk Settings" on page 110.
Configure Risk Score Aggregation Method
Before you can begin working with the Risk Modeling module, you need to select a risk score
aggregation method. For more information on the risk score aggregation methods and mechanism,
see the Risk Score Aggregation Mechanism section in the HP EnterpriseView User Guide.
To configure risk score aggregation method
1. Click Administration > Configuration.
2. In the Configuration module, in the left pane, click the Risk Aggregation Method folder, and
then click the Risk Aggregation Method page.
3. In the right pane, from the Risk Aggregation Method list, select an option:
n Average (default)
n Override Children
n Average of Children
For more information on the different methods, see "Risk Score Aggregation Mechanism" on
page 110.
4. Save and apply the configuration changes. For more information, see the Save and Apply
Configuration Changes section in the HP EnterpriseView Deployment Guide.
Configure Risk Assessment Settings
Risk assessment settings include applying weights to actors and their categories, creating or
deleting impacts, and selecting the number of ranks for the impact area values.
To apply weights to categories and actors
1. On the EnterpriseView toolbar, click Settings.
2. On the Settings dialog box, click Risk Modeling > Actor Weights.
3. On the Actor Weights page, locate the category/actor for which you want to change the
weight. To expand the category and display actors, click next to the category. Click the
weight to make it editable.
User Guide
Chapter 4: Risk Management
HP EnterpriseView (2.5) Page 107 of 265
4. Enter a weight between 0 and 100.
5. Click Save.
Note: You can override these settings for a specific asset, as described in "Configure
Asset Risk Settings" on page 110.
To manage impact area settings
1. On the EnterpriseView toolbar, click Settings.
2. On the Settings dialog box, click Risk Modeling > Impact Area.
3. Do one of the following:
n To add an impact area, click the Create new impact area button. In the Name cell,
enter a name for the impact area. Click the weight to make it editable and enter a weight
between 0 and 100.
n To delete an impact area, click the Delete impact area button.
Caution: Deleting an impact area results in the reassessment of all assets.
n To apply a weight to an impact area, click the weight to make it editable, and enter a weight
between 0 and 100.
4. Click Save.
To select the number of impact area values
Note: You cannot change the number of ranks while there are risk assessments.
1. On the EnterpriseView toolbar, click Settings.
2. On the Settings dialog box, click Risk Modeling > Impact Area Values.
3. Select the number of values for the impact areas.
The following table includes the score for each of the values, depending on the number of ranks
User Guide
Chapter 4: Risk Management
HP EnterpriseView (2.5) Page 108 of 265
you select:
Number of Ranks Low Medium High Very High Urgent
Three 33 66 100 - -
Four 25 50 75 100 -
Five 20 40 60 80 100
4. Click Save.
Configure Risk Score Ranges
You can configure the ranges for the score severity indication for the impact score, risk scores, and
threat probability.
Risk scores are displayed with one of the following icons:
Low score
Medium score
High score
This configuration is reflected throughout the application, wherever these measurements are
displayed. For example, on the Risk Modeling Assessment page, wherever an impact score,
inherent, or residual risk score is displayed.
To configure risk score ranges
1. On the EnterpriseView toolbar, click the Settings button.
2. On the Settings dialog box, click Risk Modeling > Risk Score Ranges.
3. Under Risk Score Ranges, drag the slider to define the impact score, and inherent and
residual risk score ranges.
4. Click Save.
To define probability ranges
1. On the EnterpriseView toolbar, click Settings.
2. On the Settings dialog box, click Risk Modeling > Risk Score Ranges.
3. Under Probability Ranges, drag the slider to define the probability ranges.
4. Click Save.
User Guide
Chapter 4: Risk Management
HP EnterpriseView (2.5) Page 109 of 265
Configure Asset Risk Settings
You can override the default weights applied to categories and actors for a specific asset.
To override default weights for categories and actors
1. Click Risk Modeling > Threat Assignment.
2. On the Threat Assignment window, click the Asset Risk Settings button.
3. On the Asset Risk Settings dialog box, locate the category/actor for which you want to
change the weight. To expand the category and display actors, click next to the category.
Click the weight to make it editable.
4. Enter a weight between 0 and 100.
5. Click Save.
Risk Score Aggregation Mechanism
The aggregate risk score is generally defined as the weighted average of aggregate risk scores of
the asset's children, but is dependant on the calculation method selected, as described below. This
score is applied to an asset automatically. It is not displayed in the Risk Modeling Assessment
window, but is one of the parameters in various reports and dashboards, such as the Risk Register.
For more information, see "Risk Register" on page 178.
There are three methods available for calculating the aggregate risk score:
Note: If an asset does not have children, then the risk score is used instead of the aggregate
risk score.
l Average: The weighted average of aggregate risk scores of an asset's children including the risk
score of asset itself. This is the default method. The asset's risk score and the aggregate risk
score of its children is taken into account.
AggregateRiskScoreChildren CriticalityLevel AssetRiskScore CriticalityLevel
CriticalityLevel
∑( * ) + *
∑( )
l Override Children: If the asset already has a risk score, then its aggregate risk score receives
the value of the risk score. If the asset does not have a risk score, then its aggregate risk score
is calculated according to the Average formula. The asset's risk score takes precedence over its
children's aggregate risk score.
Asset risk score or
AggregateRiskScoreChildren CriticalityLevel
CriticalityLevel
∑( * )
∑( )
User Guide
Chapter 4: Risk Management
HP EnterpriseView (2.5) Page 110 of 265
l Average of Children: The weighted average of aggregate risk scores of an asset's children,
excluding the risk score of the asset itself. The aggregate risk score children takes precedence
over the asset's risk score.
AggregateRiskScoreChildren CriticalityLevel
CriticalityLevel
∑( * )
∑( )
For instructions on how to configure the risk score aggregation method, see "Configure Risk Score
Aggregation Method" on page 107.
User Guide
Chapter 4: Risk Management
HP EnterpriseView (2.5) Page 111 of 265
Residual Risk Score Calculation
The residual risk score that is applied to a threat scenario is also calculated and applied separately
on the actor, actor category, and asset.
The following table describes how the risk scores are calculated for each of these elements.
Threat
Element Risk score calculation
Threat
Scenario
The residual risk score is calculated as the Treated Impact Score
multiplied by the Adjusted Probability or Treated Probability
(depending on whether there are control to threat mappings).
For detailed information on how the impact score is calculated, see
"Impact Score Calculation" below.
Actor The actor receives the score of the threat scenario with the highest
risk.
Actor
Category
The weighted average of all actor scores.
Actor Score Actor Weight
Actor Weights
∑( * )
∑( )
Asset The weighted average of all actor category scores.
Category Score Category Weight
Category Weights
∑( * )
∑( )
Impact Score Calculation
The impact score of an identified risk is a calculation of the values associated with the impact areas
of a specific threat scenario and its weight.
Impact areas and their weights are defined on the organization level in Settings. For more
information, see "Configure Risk Assessment Settings" on page 107.
The following steps outline the formula for calculating the Impact Score:
1. For each impact area, a score is calculated separately:
ImpactAreaScore=
ImpactAreaValue ImpactAreaWeight*
100
2. Impact Area Scores are aggregated in a way that each additional impact area has relative
influence on the final Impact Score.
User Guide
Chapter 4: Risk Management
HP EnterpriseView (2.5) Page 112 of 265
a. The first Impact Area Score serves as a base for the Impact Score, which we will call the
Temporary Impact Score.
b. The second Impact Area Score is multiplied by
TemporaryImpactScore100 −
100 and then added to
the first Impact Area Score. The resulting score is the new Temporary Impact Score.
c. Each of the consecutive Impact Area Scores is multiplied by
TemporaryImpactScore100 −
100
creating a new Temporary Impact Score. After all the Impact Area Scores are aggregated,
then the Temporary Impact Score = Impact Score.
Example:
Weight Impact Area Value Impact Area Score
50 Financial High 50 * 100
100
= 50
50 Reputation High 50 * 100
100
= 50
50 Productivity Low 50 * 33
100
= 16.5
50 Fines/Legal Low 50 * 33
100
= 16.5
50 Safety and Health Medium 50 * 66
100
= 33
Financial = 50
Financial + Reputation = 50 + 50*
(100 − 50)
100 = 75
Financial + Reputation + Productivity = 50 + 50*
(100 − 50)
100 + 16.5*
(100 − 75)
100 = 79.125
Financial +Reputation + Productivity + Fines/Legal = 50 + 50*
(100 − 50)
100 + 16.5*
(100 − 75)
100
+ 16.5*
(100 − 79.125)
100 = 82.569
Financial +Reputation + Productivity + Fines/Legal + Safety and Health = 50 + 50*
(100 − 50)
100 + 16.5*
(100 − 75)
100 + 16.5*
(100 − 79.125)
100 + 33*
(100 − 82.569)
100 = 88.321
3. Because the formula cannot yield a maximum score of 100, the result is normalized to 100, in
order to align with impact score ranges (0-100).
User Guide
Chapter 4: Risk Management
HP EnterpriseView (2.5) Page 113 of 265
In the example above, the result is 88.321 and the highest possible score is 96.875 (for five
impact areas, when all impact area values are High). The score, in this case, is
(88.321 * 100)
96.875
=91.17.
4. The Impact Area Scores are summed and compared to the result from the formula. The lowest
score of the two is the final Impact Score. In the example above, the sum of all Impact Area
Scores is 50+50+16.5+16.5+33=166, which means that the final Impact Score is 91.17.
This final step is done in order to make sure that the Impact Score distribution is optimal.
User Guide
Chapter 4: Risk Management
HP EnterpriseView (2.5) Page 114 of 265
Threat Library Builder Window
The Threat Library Builder enables you to create and manage threats and their building blocks
(actors and operations). The different areas and the functionalities available in each area are
described in the following sections. For information on the EnterpriseView toolbar, see "Toolbar
Description" on page 17.
Left Pane
UI Element Description
<Search box> Search
Search for a category, actor, or operation. Enter a name, full or partial. All
matches are displayed.
Actors tab The Actors tab displays all of the actors that are defined in
EnterpriseView in a tree view, grouped by categories.
New Category
Click this button to create a new actor category. For more information,
see "Create an Actor" on page 87.
User Guide
Chapter 4: Risk Management
HP EnterpriseView (2.5) Page 115 of 265
UI Element Description
New Actor
Click this button to create a new actor. For more information, see
"Create an Actor" on page 87.
Delete (category or actor)
Select the category or actor from the actor tree, and then click this
button. Deleting a category automatically deletes all of its actors.
Note: Deleting an actor that is associated with a threat,
automatically deletes the threat. Moreover, if the threat is already
assessed, then the impact is also deleted.
Edit (category or actor)
Select the category or actor from the actor tree, and then click this button
to edit the name and description of a category or an actor.
Copy and Paste (actor)
You can duplicate actors using the copy/paste functionality.
Select an actor from the actor tree, and then click the Copy button.
On the actor tree, click the category to which you want to copy the actor,
and then click the Paste button. You can copy the actor under the
same category. A new actor is created with the following name:
Copy of <original actor name>
You can rename the actor by clicking the Edit button.
If the actor is connected to operations, then associations are also
copied.
Connect Actor to Operation
Select an actor from the actors tree, click an operation on the graph, and
then click this button.
This button is enabled only when the actor and operation are not yet
connected.
Operations tab The Operations tab displays a list of all the operations defined in
EnterpriseView.
User Guide
Chapter 4: Risk Management
HP EnterpriseView (2.5) Page 116 of 265
UI Element Description
New Operation
Click this button to create a new operation. For more information, see
"Create an Operation" on page 88.
Edit Operation
Select the operation from the operation list, and then click this button to
edit the name and description of the operation.
Delete Operation
Select the operation from the operation list, and then click this button.
Note: Deleting an operation that is associated with a threat,
automatically deletes the threat. Moreover, if the threat is already
assessed, then the impact is also deleted.
Connect Operation to Actor
Select an operation or operations (press CTRL to multi-select) from the
operations list, click the actor in the graph, and then click this button.
The operation/operations that you selected are connected to the actor
and displayed in the map area.
User Guide
Chapter 4: Risk Management
HP EnterpriseView (2.5) Page 117 of 265
Graph Area
The graph area displays a graphic depiction of the threats in the threats library. You can choose to
display one threat or multiple threats.
l To display threats: On the Actors tab, open the category, select the actors that you want to
display, and drag them to the map area.
l To display a category’s actors and their connected operations: On the Actors tab, select the
categories that you want to display and drag them to the map area.
l To disconnect an operation from an actor, in the graph area, click the operation that you want to
disconnect, and then press DELETE.
Mini-Map
When a threat includes multiple operations and is larger than the graph area, you can navigate it by
clicking and dragging in the mini-map area.
To expand or collapse the mini-map, click the Expand/Collapse button.
User Guide
Chapter 4: Risk Management
HP EnterpriseView (2.5) Page 118 of 265
Threat Assignment Window
The Threat Assignment window enables you to create threat scenarios by assigning threats to
assets. The different areas and the functionalities available in each area are described in the
following sections. For information on the EnterpriseView toolbar, see "Toolbar Description" on
page 17.
Toolbar
UI Element Description
<Asset Selector> Select the asset for which you want to create threat scenarios. Select an
asset from the list or search for an asset by entering its name.
Graph (view)
In this view the window is divided into the following sections:
l Toolbar
l Left pane
l Map area
l Properties pane
l Mini-map
This is the default view.
Table (view)
In this view, all threats are displayed in a table. You can associate a
threat with an asset or unassociate a threat from an asset.
Asset Risk Settings
Override the default weights applied to categories and actors for a
specific asset.
User Guide
Chapter 4: Risk Management
HP EnterpriseView (2.5) Page 119 of 265
Left Pane
The left pane is divided into two areas:
l Associated Threats: The top area displays all the threats that are associated with the asset.
l Unassociated Threats: The bottom area displays all the threats that are not associated with the
asset.
UI Element Description
<Search Threats> Search for threats by operation.
Start typing an operation name to filter the list of associated and
unassociated threats.
<Threats tree> The threats tree displays all of the actors and their associated
operations, grouped by category. The category is the first level, the actor
is the second level, and its associated operations is the third level,
displayed in alphabetical order.
User Guide
Chapter 4: Risk Management
HP EnterpriseView (2.5) Page 120 of 265
UI Element Description
Add Add threats to asset
From the Unassociated Threats area, select the threats that you want
to assign to an asset, and then click this button.
The threat scenario is displayed in the map area. For more information,
see "Assign Threats to Assets" on page 89.
Remove Remove the selected threat from the asset
From the Associated Threats area, select the threats that you want to
remove from the asset, and then click this button.
The threat scenario is removed from the graph area. For more
information, see "Assign Threats to Assets" on page 89.
Graph Area
The graph area displays the following information:
l Asset name: Appears in the upper left side.
l Threat scenario graph: Displays (from top to bottom) the category, actor, and operation.
Clicking the graph entity displays its properties in the Properties pane on the right.
User Guide
Chapter 4: Risk Management
HP EnterpriseView (2.5) Page 121 of 265
Properties Pane
UI Element Description
Category Properties Includes the name and description of the threat category.
Actor Properties Includes the name and description of the threat actor.
Operation Properties Includes the name and description of the threat operation.
Mini-map
When a threat includes multiple operations and is larger than the graph area, you can navigate it by
clicking and dragging in the Mini-map area.
To expand or collapse the mini-map, click the Expand/Collapse button.
User Guide
Chapter 4: Risk Management
HP EnterpriseView (2.5) Page 122 of 265
Risk Assessment and Treatment Window
The Risk Assessment and Treatment window enables you to assess risks on assets and treat
them. The different areas and the functionalities available in each area are described in the following
sections. For information on the EnterpriseView toolbar, see "Toolbar Description" on page 17.
Toolbar
UI Element Description
<Asset Selector> Select the asset that you want to assess or treat from this list or
search for an asset by entering its name.
Assessment and Treatment
In this view, the window is divided into the following sections:
l Toolbar
l Asset Summary
l Left pane
l Assessment Area
l Treatment Area
This view allows you to both assess and treat risks. It is the default
view.
Assessment View
In this view, the window is divided into the following sections:
l Toolbar
l Asset Summary
l Table
This view provides assessment information on each threat
scenario.
User Guide
Chapter 4: Risk Management
HP EnterpriseView (2.5) Page 123 of 265
Asset Summary
The asset summary includes the number of risks that the asset has and the residual risk score of
the asset. For information on how the residual risk score of the asset is calculated, see "Residual
Risk Score Calculation" on page 112.
Left Pane
UI Element Description
<Search Threats> Search for threats by operation.
Start typing an operation name to filter the list of associated and
unassociated threats.
<Associated
Threats>
The threats tree displays all of the actors and their associated
operations, grouped by category. The category is the first level, the actor
is the second level, and its associated operations is the third level,
displayed in alphabetical order.
These threats are assigned to the asset and need to be assessed and
treated. You can select a threat by expanding the tree.
User Guide
Chapter 4: Risk Management
HP EnterpriseView (2.5) Page 124 of 265
Assessment Area
The assessment area enables you to assess the risk for a specific threat scenario.
When you open this page, then this area is displayed in a summary view. To perform an
assessment, click the Edit Assessment button.
UI Element Description
Risk Status Change the status of the risk in order to reflect the life cycle of the
risk. The statuses are:
l Not Assessed: This status means that the threat is assigned to
the asset, but that it has not been assessed yet.
l Assessed: This status means that the risk on the threat
scenario has been assessed, but has not been treated.
l Treatment in Progress: This status means that you have
created a treatment plan, but that it has not yet been carried out
fully.
l Treatment Completed: This means that the risk has been
treated and that the treatment plan and all the action plans
derived from the treatment plan have been carried out.
User Guide
Chapter 4: Risk Management
HP EnterpriseView (2.5) Page 125 of 265
UI Element Description
Notes
Click this button to add or view notes.
To add a note, on the Notes dialog box, enter a note, and then click
Add.
Attachments
Click this button to upload, delete, or download attachments.
Impact Areas Impact areas comprise the impact of a risk. You can add, edit,
delete impact areas, and change their weights as described in
"Configure Risk Assessment Settings" on page 107.
To assign an impact area value, click in the Value cell and select
the appropriate value. For information on the score behind each
value, see "Configure Risk Assessment Settings" on page 107.
Risk Tolerance Level The maximum level of risk exposure that you are willing to accept
for this asset in this threat scenario.
Enter a number between 0 and 100. If the inherent risk score and
residual risk score are higher that the risk tolerance level, then a
warning is displayed below these scores.
Impact Score The impact score is a calculation of all the values of the impact
areas. For information on how this score is calculated, see "Impact
Score Calculation" on page 112.
Probability The probability that this threat will occur. Enter a number between
zero and one.
Inherent Risk Score The risk to an asset, for a specific threat scenario, in the absence of
any actions you might take to alter either the probability or impact.
This is the risk before treatment.
This score is calculated as the impact score multiplied by the
probability (Inherent Risk Score = Impact Score X Probability).
User Guide
Chapter 4: Risk Management
HP EnterpriseView (2.5) Page 126 of 265
Treatment Area
The treatment area enables you to handle the risk for a specific threat scenario.
When you open this page, then this area is displayed in a summary view. To perform view and edit
treated risk score, click the Edit Treatment button.
UI Element Description
Notes
Click this button to add or view notes.
To add a note, on the Notes dialog box, enter a note, and then click
Add.
User Guide
Chapter 4: Risk Management
HP EnterpriseView (2.5) Page 127 of 265
UI Element Description
Attachments
Click this button to upload, delete, or download attachments.
Impact Areas See "Impact Areas" on page 126.
Before you begin treatment, the values of the impact areas are the
same as those presented in the Assessment area.
After you carry out your treatment plan, you can manually modify
the impact areas to reflect the reduced risk.
Treated Impact Score See "Impact Score" on page 126.
Before you begin treatment, the treated impact score is the same
as the impact score presented in the Assessment area.
After you carry out your treatment plan, and you modify the impact
areas to reflect the reduced risk, then a new impact score is
calculated.
Treated Probability See "Probability" on page 126.
Before you begin treatment, the treated probability is the same as
the probability presented in the Assessment area.
After you carry out your treatment plan, you can manually modify
the probability to reflect the reduced risk.
This threat scenario is
affected by <n>
controls.The probability
is reduced/increased by
m%.
This indication is displayed only if the controls that are mapped to
the threat are also attached to the asset that is being assessed.
Click the "n controls" link to view information about these controls.
For more information on control to threat mapping, see "Mitigate
Risk Automatically Using Policy Controls" on page 95.
In this case, control compliance scores can either reduce or
increase the treated probability. The result is the Adjusted
Probability.
Adjusted Probability The adjusted probability is the treated probability after it has been
reduced or increased by control compliance scores. See
explanation above.
Residual Risk Score The residual score is the risk that remains after you have attempted
to mitigate the inherent risk. It is calculated as the treated impact
score multiplied by the adjusted probability (Residual Score =
Treated Impact Score X Adjusted Probability).
User Guide
Chapter 4: Risk Management
HP EnterpriseView (2.5) Page 128 of 265
Chapter 5: Vulnerability Management
In EnterpriseView, a vulnerability is a flaw or a weakness in a software application or a system
configuration issue that can be exploited by an attacker and used to gain access to a system or a
network or impact the confidentiality, integrity, and availability of a system or a network. For
example, a user account that does not have a password, or an input validation error, such as SQL
injection.
EnterpriseView supports three types of vulnerabilities:
l Network
l Application
l Configuration
For more information on each type, see "Vulnerability Types" on the next page.
The Vulnerabilities module enables you to manage the life cycle of vulnerabilities in your
organization including collection, aggregation, prioritization, and remediation. For more information
on the vulnerability life cycle, see "About the Vulnerability Life Cycle" on page 133. You can
manage the vulnerability's life cycle by applying statuses aiding you in managing remediation, as
described in "Manage the Vulnerability Life Cycle" on page 135.
The Vulnerabilities module enables you to view vulnerabilities that affect an asset and its children in
a summarized view or a detailed view. Both views offer filtering capabilities so that, for example,
vulnerabilities can be viewed within a specific score range or a specific location.
EnterpriseView assigns vulnerabilities to specific assets in your business model, but you can also
attach or remove vulnerabilities to assets manually, as described in "Attach a Vulnerability to an
Asset" on page 135. Asset vulnerability scores are derived from vulnerability scores (see "Common
Vulnerability Scoring System" on page 131) and the asset's criticality level (see "Criticality Level"
on page 33) and are trickled up and aggregated to top-level assets, providing business context to
the state of your organization's security.
EnterpriseView imports vulnerability information from output generated by the following vulnerability
assessment tools:
l Tenable Nessus Vulnerability Scanner
l McAfee Vulnerability Manager (Foundscan)
l Qualys Guard
l Rapid7 Nexpose
l HP WebInspect
The vulnerability information is imported into EnterpriseView using ArcSight SmartConnectors. For
information on deploying ArcSight SmartConnectors, see the Import Vulnerabilities From
Vulnerability Assessment Tools section in the HP EnterpriseView Deployment Guide.
HP EnterpriseView (2.5) Page 129 of 265
EnterpriseView is CVE (Common Vulnerabilities and Exposures) and CCE (Common Configuration
Enumeration) compliant, aligned with most established dictionary of common names for publicly
known information security vulnerabilities. However, EnterpriseView also supports management of
vulnerabilities from sources that do not have a CVE or a CCE classification.
The same vulnerability can be reported numerous times and by numerous vulnerability assessment
tools. EnterpriseView aggregates these reports into a single vulnerability, in order to eliminate
duplication of data, allowing you to manage the vulnerability only once.
You can archive closed application and network vulnerabilities, as described in the Archive
Vulnerabilities section in the HP EnterpriseView Administration Guide.
Vulnerability Types
EnterpriseView distinguishes between three vulnerability types:
l Web Application (referred to as "Application" in the user interface)
l Network
l Configuration
Following is a description of each type of vulnerability:
Web Application
Web application vulnerabilities are vulnerabilities that are found by Web application vulnerability
scanners. A Web application vulnerability scanner communicates with a Web application (a 3rd
party application or a custom application) through the application's URL in order to identify
vulnerabilities in the application and its architecture. The scanner searched for security flaws based
on a database of known flaws. Examples of Web application vulnerabilities include: cross-site
scripting, SQL injection, and remote file inclusion.
Network
Network vulnerabilities are vulnerabilities that are found by network vulnerability scanners. A
network vulnerability scanner scans all the network elements (such as operating system, ports,
services, and firewalls) and runs tests applicable to each host. An example of a network
vulnerability is include: TCP/IP stack buffer overflow.
Configuration
Configuration vulnerabilities are actually misconfigurations in network elements, such as servers,
applications, and firewalls. Configuration checks are defined in a configuration file provided in
OVAL (Open Vulnerability and Assessment Language) format and are entered into the scanner.
Examples of configuration checks include: port numbers that are higher than 2000 must be closed
User Guide
Chapter 5: Vulnerability Management
HP EnterpriseView (2.5) Page 130 of 265
to communication, and all users defined in an Active Directory must have a password with over X
characters and must include special characters.
The scanner provides information for both correct configurations and misconfigurations, as opposed
to Web application and network vulnerabilities, which only report weaknesses.
Most vulnerability properties are shared between the different types, but there are also some
differences. For more information on the various vulnerability properties. see "Vulnerability
Properties" on page 140.
Common Vulnerability Scoring System
The Common Vulnerability Scoring System (CVSS) is an industry standard vulnerability scoring
system for assessing the severity IT vulnerabilities. It is widely adopted by commercial and open-
source products, such as McAfee, National Vulnerability Database, Qualys, and Tenable network
Security.
EnterpriseView uses CVSS v2 as the scoring system for the network and application vulnerabilities
defined in the vulnerability dictionary. For more information on the vulnerability dictionary, see
"Vulnerability Dictionary" on page 156.
The score defined in the vulnerability dictionary is based on the following metrics:
l Base:  Represent the intrinsic qualities of a vulnerability.
l Temporal: Represent the characteristics of a vulnerability that change over time but are not
related to your organization's environment.
Because temporal metrics are dynamic by nature, the vulnerability score is regularly updated by
EnterpriseView labs. Every time you update the vulnerability dictionary in EnterpriseView, you
receive the most updated vulnerability scores. In addition to the vulnerability score, EnterpriseView
displays the scoring vector, providing you a breakdown of the score calculation. For more
information on the vulnerability score, see "Vulnerability Properties" on page 140.
After a vulnerability is attached to an asset, the vulnerability score on that asset is recalculated to
include environmental metrics. Therefore, the vulnerability score defined in the vulnerability
dictionary will usually be different than the vulnerability score on a specific asset.
Configuration Vulnerabilities Scoring Method
Configuration vulnerabilities utilize a different scoring method than network and application
vulnerabilities. For more information on the network and application vulnerability scoring method,
see "Common Vulnerability Scoring System" above
The score of configuration vulnerabilities depends on a combination of the vulnerability status and
the configuration check results provided by the scanner. Common check result values
include: Pass, Fixed, Error, Failed, Unknown, Not Applicable, Not Checked, not Selected, and
Warning. These results can be divided into the following categories:
User Guide
Chapter 5: Vulnerability Management
HP EnterpriseView (2.5) Page 131 of 265
Category Check Results
Referred to in
EnterpriseView As
Configured correctly Pass and Fixed Passed
Misconfigured Failed and Error Failed
Correct configuration could
not be determined
Unknown, Not Applicable, Not
Checked, not Selected, and
Warning
Unknown
Check Result Categories
Any check result that you receive will fall into one of these three categories, even if it is a different
value that the values listed above.
When a configuration vulnerability enters EnterpriseView, it automatically receives a score:
l Vulnerabilities that are configured correctly are given the status Closed and receive the score 0.
l Vulnerabilities that are misconfigured are given the status Open and receive the score 10.
l Vulnerabilities for which correct configuration could not be determined are given the status Open
and receive the score 5.
Because you have the ability to change the vulnerability status manually, there can be other
combinations. The following table includes all combinations and their score.
Vulnerability Status Category Score
Closed All 0
Open Misconfigured 10
Open Correct configuration
could not be determined
5
Open Configured correctly 10
Configuration Vulnerabilities Scoring Method
User Guide
Chapter 5: Vulnerability Management
HP EnterpriseView (2.5) Page 132 of 265
About the Vulnerability Life Cycle
In EnterpriseView, the vulnerability life cycle is managed by using the vulnerability's status (see
"Status" on page 143) and the vulnerability's remediation status (see "Remediation Status" on page
142). For more information about managing the vulnerability life cycle, see "Manage the
Vulnerability Life Cycle" on page 135. Vulnerability remediation has both manual and automatic
aspects. For more information on the automatic aspects, see the About the Vulnerability Import Job
section in the EnterpriseView Deployment Guide.
The following example outlines how to manage the vulnerability life cycle:
1. When a vulnerability occurrence is first imported into EnterpriseView, it can have one of the
following status combinations:
n A New remediation status and an Open status. Remediation status Reopened is handled
the same as remediation status New.
n A Passed remediation status and a Closed status, relevant only for configuration
vulnerabilities. Does not require further handling.
2. A user with an appropriate role assigns New and Reopened vulnerabilities to users for
handling.
Note: Users can use the Notes parameter to communicate information to one another or
for any other comments that the user wants to document.
3. The user to whom the vulnerability is assigned must first determine whether the vulnerability is
an actual problem.
n If the vulnerability is not found to be significant, then the user can close it, and change its
remediation status to Not an Issue. Cases in which vulnerabilities are identified as non-
issues include vulnerabilities that have very low scores, when the organization uses
security tools that provide virtual patching to solve security issues in the network, and any
other case in which insignificant reports unnecessarily overload the system.
n If the vulnerability is found to be significant, then the user investigates methods for solving
the problem. The user can use the Solution parameter (see "Solution" on page 146 to help
solve the problem. When the solution is found, the user changes the remediation status to
Awaiting Remediation.
4. After the vulnerability is fixed, the user changes the vulnerability's remediation status to
Awaiting Verification.
5. The user verifies that the vulnerability is fixed by rescanning the network.
6. If the vulnerability is not reported, then the user changes the vulnerability status to Closed and
the remediation status to Resolved.
User Guide
Chapter 5: Vulnerability Management
HP EnterpriseView (2.5) Page 133 of 265
7. If a new vulnerability instance is reported for a closed and resolved vulnerability, then the
vulnerability status is changed to Open and the remediation status is changed to Reopened,
automatically.
8. Closed network and application vulnerabilities can be archived if they have not been updated
or reported for certain (configurable) amount of time. For more information, see the Archive
Vulnerabilities section in the HP EnterpriseView Administration Guide.
The following flowchart depicts the process described above.
User Guide
Chapter 5: Vulnerability Management
HP EnterpriseView (2.5) Page 134 of 265
Manage the Vulnerability Life Cycle
You can change vulnerability statuses, as described in the following procedure. For information on
the vulnerability life cycle, see "About the Vulnerability Life Cycle" on page 133.
To manage the vulnerability life cycle
1. Click Vulnerabilities > Management.
2. From the grid, select the relevant vulnerability, and then click the Details View button.
3. In the Status Management, perform the following steps, and then click Save:
a. If required, change the Status field.
b. From the Remediation Status list, select the relevant status.
c. If required, use the Notes parameter to communicate information with other users or for
any other comments that you want to document.
Attach a Vulnerability to an Asset
During the Vulnerability Import Job, vulnerabilities are mapped and attached to assets. For more
information, see the About the Vulnerability Import Job section in the HP EnterpriseView
Deployment Guide. In some cases, vulnerabilities cannot be mapped to assets, which results in
unattached vulnerabilities. You can manually attach vulnerabilities to assets through the
Vulnerability Assignment window. You can also detach vulnerabilities from one asset and reattach
them to a another asset. Users with VIEW VULNERABILITIES permissions can view unattached
vulnerabilities, regardless of their asset access rights. After a vulnerability is attached to an asset,
only users with access rights to that asset can see the vulnerabilities.
Note: In order to put vulnerabilities in a business context, it is important to attach all
vulnerabilities to assets. The more vulnerabilities are attached to assets the more accurate the
overall asset risk score will be.
To attach a vulnerability to an asset
1. Click Vulnerabilities > Assignment.
2. On the Vulnerability Assignment window, in the Assets pane, select the asset to which you
want to attach a vulnerability/vulnerabilities using either of the following methods:
n In the Organization tab, expand the organization tree.
n In the Search tab, enter the asset name or a partial name.
User Guide
Chapter 5: Vulnerability Management
HP EnterpriseView (2.5) Page 135 of 265
The Unattached Vulnerabilities pane displays all the vulnerabilities that have been imported
into EnterpriseView that are not currently attached to an asset.
3. If necessary, you can filter the vulnerabilities according to the vulnerability score or status, or
by clicking More Filters. For more information on the vulnerability properties in the Filter
Vulnerabilities dialog box, see "Summary View Grid" on page 140.
4. From the Unattached Vulnerabilities, select the vulnerability that you want to attach to the
asset, and then click . You can also select multiple vulnerabilities by pressing
CTRL and selecting the vulnerabilities from the list.
The vulnerability/vulnerabilities are displayed in the Attached Vulnerabilities pane.
To detach a vulnerability from an asset
1. Click Vulnerabilities > Assignment.
2. On the Vulnerability Assignment window, in the Assets pane, select the asset from which
you want to detach the vulnerabilities.
3. From the Attached Vulnerabilities pane, select the vulnerability or vulnerabilities that you
want to detach from the asset, and then click .
The vulnerability/vulnerabilities are displayed in the Unattached Vulnerabilities pane.
Vulnerability Settings
You can configure the following vulnerability settings:
l Decide how the asset vulnerability score should be aggregated, as described in "Configure
Asset Vulnerability Score Aggregation Parameters" below
l Define the thresholds that indicate the severity of your vulnerability scores, as described in
"Configure Vulnerability Score Ranges" on the next page
l Decide how to determine the asset vulnerability score, as described in "Configure Asset
Vulnerability Score Formula" on the next page
Configure Asset Vulnerability Score Aggregation
Parameters
You can configure the asset vulnerability score aggregation parameters to better suit your business
needs and your organization's structure. For more information on these parameters, see "Asset
Vulnerability Score Aggregation Mechanism" on page 147.
User Guide
Chapter 5: Vulnerability Management
HP EnterpriseView (2.5) Page 136 of 265
To configure asset vulnerability score aggregation parameters
1. On the EnterpriseView toolbar, click the Settings button.
2. In the Settings dialog box, click Vulnerabilities > Asset Vulnerability Score Aggregation.
3. In the Asset Vulnerability Score Aggregation page, enter the following information:
n Maximum Children in Calculation. Lower the impact of the children severity on the
score.
n Children Multiplier. Lower the impact of the children on the score.
Note: This change recalculates scores for the entire business model, therefore it might
take some time until the updated scores are apparent.
4. Click Save.
Configure Vulnerability Score Ranges
You can configure the ranges for the score severity indication for vulnerability scores.
Vulnerability scores are displayed with one of the following icons:
Low score
Medium score
High score
This configuration is reflected throughout the application, wherever these scores are displayed. For
example, on the Vulnerability Management page, in the Score column in the grid.
To configure vulnerability score ranges
1. On the EnterpriseView toolbar, click the Settings button.
2. In the Settings dialog box, click Vulnerabilities > Vulnerability Ranges.
3. Under Vulnerability Score Ranges, drag the slider to define the score ranges.
4. Click Save.
Configure Asset Vulnerability Score Formula
The asset vulnerability score is affected by all the vulnerabilities that are attached to the asset.
You can select one of the following methods for calculating the asset vulnerability score:
User Guide
Chapter 5: Vulnerability Management
HP EnterpriseView (2.5) Page 137 of 265
l Max score: The asset vulnerability score is the score of the vulnerability with the highest score
out of all the vulnerabilities attached to the asset.
With this method, all vulnerability types are equal.
For example:
An asset has three vulnerabilities attached. The vulnerabilities have the following scores:
Vul1=7
Vul2=9
Vul3=4
In this case, the asset vulnerability score is 9.
l Weighted average: The asset vulnerability score is the weighted average of the highest
vulnerability score out of each vulnerability type.
The formula is: 
HighestScoreFor VulnerabilityType Weight
Weights
Σ *
Σ .
With this method, you can decide whether one vulnerability type is more influential than another
type.
For example:
An asset has four vulnerabilities attached; two configuration vulnerabilities and two network
vulnerabilities. The vulnerabilities have the following scores:
n Network
Vul1=7
Vul2=4
n Configuration
Vul3=10
Vul4=0
User Guide
Chapter 5: Vulnerability Management
HP EnterpriseView (2.5) Page 138 of 265
Network vulnerabilities have a weight of 100, while configuration vulnerabilities have a weight of
50.
Out of the network vulnerabilities , the highest score is 7. Out of the configuration vulnerabilities,
the highest score is 10.
The calculation is: (100*7+50*10)/(100+50) and the asset vulnerability score is 8.
The method that you select for calculating the asset vulnerability score affects the aggregate
asset vulnerability score. The aggregation method is also configurable, as described in
"Configure Asset Vulnerability Score Aggregation Parameters" on page 136.
To configure the asset vulnerability score formula
1. On the EnterpriseView toolbar, click the Settings button.
2. In the Settings dialog box, click Vulnerabilities > Asset Vulnerability Score Formula.
3. Select one of the following options:
n The score of the vulnerability with the highest score out of all the vulnerabilities
attached to the asset
n The weighted average of the highest vulnerability score out of each vulnerability
type
4. If you selected The weighted average of the highest vulnerability score out of each
vulnerability type, set the weights for each of the vulnerability types by dragging the slider. If
you set the weight to zero, then all the vulnerabilities of that type will not affect the vulnerability
asset score.
5. Click Save.
User Guide
Chapter 5: Vulnerability Management
HP EnterpriseView (2.5) Page 139 of 265
Vulnerability Properties
The following tables describe all the vulnerability properties according to where they are displayed
in the Vulnerabilities module.
Some properties are relevant only to specific vulnerability types.
Summary View Grid
The Summary View is available from the Vulnerability Management window.
Each record in the summary view grid is an occurrence of a vulnerability in a specific location.
Property Description
ID A common classification ID. This ID can be defined in the
vulnerability dictionary or not.
It can be a CVE, CCE, or identification provided by the scanner.
CVE IDs are linkable to the NVD website.
Type See "Vulnerability Types" on page 130.
Score The vulnerability score is the severity level of the vulnerability
expressed as a number between 0 and 10. It is calculated by
EnterpriseView labs.
The scoring system varies between the different vulnerability types:
l Network and Web application vulnerabilities
The score is CVSS version 2.0 compliant. For more information,
see "Common Vulnerability Scoring System" on page 131. Scores
of new vulnerabilities that do not exist in the dictionary are
imported from the scanner and are normalized to the
EnterpriseView scoring system.
l Configuration vulnerabilities
 The score is determined according to the vulnerability status and
the check results from the scanner. For more information, see
"Configuration Vulnerabilities Scoring Method" on page 131.
User Guide
Chapter 5: Vulnerability Management
HP EnterpriseView (2.5) Page 140 of 265
Property Description
Location The location displayed depends on the type of the vulnerability. Each
type has the following location formats:
l Network and configuration: <Hostname>:<Network Port>.
Hostname and IP address are interchangeable.
l Application: <Normalized URI>:<Vulnerable Parameter>.
The original URI indicating the location of the vulnerability is
normalized by the Vulnerability Import Job. The vulnerable
parameter is isolated from the query string passed in the original
URI.
User Guide
Chapter 5: Vulnerability Management
HP EnterpriseView (2.5) Page 141 of 265
Property Description
Remediation Status The remediation status depends on the vulnerability status, meaning
that a vulnerability with status Open has different remediation status
options than a vulnerability with status Closed. Some statuses can
be applied manually and some are applied automatically by
EnterpriseView.
The following options are available:
l New: The default remediation status for open vulnerabilities.
l Passed: Applicable to only for configuration vulnerabilities. The
remediation status for vulnerabilities that have passed the
configuration check. This remediation status is given
automatically by the system, according to the check status
reported by the scanner. For more information, see Last Scan
Status. Because the configuration is correct, the vulnerability
status is Closed.
l Reopened: A closed vulnerability can be automatically reopened
by EnterpriseView if a new instance of the same vulnerability
occurrence is found.
l Assigned: An open vulnerability is assigned to a system user.
l Awaiting Remediation: Remediation for an open vulnerability
was found, but has not been applied.
l Not an Issue: A closed vulnerability that was identified as
irrelevant to the organization, due to its severity, to the probability
of an attack using this vulnerability or for any other reason defined
by the organization. A vulnerability with this status will not be
reopened.
l Awaiting Verification: Remediation was applied to a
vulnerability, but was not verified.
l Resolved: The vulnerability was fixed.
l Automatically Closed: Applicable only for network and
application vulnerabilities. This status is assigned automatically
when a vulnerability has been open for more than N days and none
of its properties have been changed (based on the Last Updated
On property). The number of days is configurable in the
Configuration module. For more information, see the Schedule and
Activate Vulnerabilities Import Job section in the HP
EnterpriseView Deployment Guide.
User Guide
Chapter 5: Vulnerability Management
HP EnterpriseView (2.5) Page 142 of 265
Property Description
Status The following options are available:
l Open: The default status of all vulnerabilities that are imported into
EnterpriseView. As long as the vulnerability exists, its status is
open. A vulnerability can be reopened automatically by
EnterpriseView if a new instance of the same vulnerability
occurrence is found.
l Closed: You can manually change the status to Closed. Open
vulnerabilities are automatically closed by EnterpriseView if they
have been open for more than N days. The number of days is
configurable in the Configuration module.For more information,
see the Schedule and Activate Vulnerabilities Import Job section
in the HP EnterpriseView Deployment Guide.
Closed vulnerabilities do not affect the vulnerability scores of
assets in the business model.
Attached to Asset The asset name in the EnterpriseView business model to which the
vulnerability is attached. Vulnerabilities can be attached
automatically to IP assets according to their host, IP address or MAC
address. Vulnerabilities can also be attached manually to assets. If a
vulnerability is not attached to an asset, then this field is empty. For
more information, see "Attach a Vulnerability to an Asset" on page
135.
Times Reported The number of instances of a vulnerability occurrence.
Imported vulnerabilities can be reported more than once, either by
different vulnerability assessment tools or due to multiple scans from
the same tool.
First Reported On The date that the vulnerability occurrence was first reported, as
recorded by the external source from which the vulnerability was
imported.
Format: Mon Day, Year
Example: Jan 16, 1970
Last Reported On The date that the vulnerability occurrence was last reported, as
recorded by the external source from which the vulnerability was
imported.
Title A short description of the vulnerability.
Details View
The Details View is available from the Vulnerability Management window. The Details View
displays information on a single vulnerability occurrence.
User Guide
Chapter 5: Vulnerability Management
HP EnterpriseView (2.5) Page 143 of 265
Category Property Description
General ID See "ID" on page 140
Type See "Vulnerability Types" on page 130.
Score See "Score" on page 140.
Related CVEs Not relevant for configuration vulnerabilities.
The CVE identifiers of related vulnerabilities. Defined
by EnterpriseView labs.
CVE IDs are linkable to the NVD website.
References The identifiers defined by various sources for
vulnerabilities that are similar or related to the
vulnerability defined in the EnterpriseView
vulnerability dictionary.
CVE IDs are linkable to the NVD website.
Groups Vulnerabilities are grouped according to different
vulnerability categories. EnterpriseView adopted the
Common Weakness Enumeration (CWE) system for
identifying most vulnerability groups. Other
vulnerability groups are internal and can be identified
by an "EVG" prefix.
CWE IDs are linkable to the NVD website.
Details A detailed description of the vulnerability.
Location See "Location" on page 141.
Attached to Asset See "Attached to Asset" on the previous page
Times Reported See "Times Reported" on the previous page.
First Reported On See "First Reported On" on the previous page
Last Updated On The last time that one of the properties of the
vulnerability occurrence was changed. This property
is not updated if a vulnerability is attached or
detached from an asset or if a new note has been
added.
User Guide
Chapter 5: Vulnerability Management
HP EnterpriseView (2.5) Page 144 of 265
Category Property Description
Last Scan Status Relevant only for configuration vulnerabilities.
Typically, scanners provide a status for configuration
vulnerability checks. Common values include: Pass,
Fixed, Error, Unknown, Not Applicable, Not
Checked, not Selected, and Warning. If a scanner
provides such a status, then it is displayed as this
property.
If the last scan status is Passed or Fixed, then the
remediation status is Passed. For more information,
see "Remediation Status" on page 142.
Host The host where the vulnerability was found.
Port Relevant only for network vulnerabilities.
The port where the vulnerability was found.
Vulnerable
Parameter
Relevant only for application vulnerabilities.
The parameter from the URI that is used to exploit the
vulnerability. For example, User ID can be the
vulnerable parameter in case of an SQL injection
vulnerability.
Platform Relevant only for configuration vulnerabilities.
The application or operating system where the
vulnerability was found.
Associated
Technical
Mechanism
Relevant only for configuration vulnerabilities.
The method by which the configuration is
implemented.
Conceptual
Parameters
Relevant only for configuration vulnerabilities.
A list of valid values of the field or property that needs
to be configured.
Note: the following properties are relevant only for network and application vulnerabilities;
they are not relevant for configuration vulnerabilities.
User Guide
Chapter 5: Vulnerability Management
HP EnterpriseView (2.5) Page 145 of 265
Category Property Description
CVSS Base Score Represents the intrinsic qualities of a vulnerability.
This score is static. For more information on CVSS,
see "Common Vulnerability Scoring System" on page
131.
Temporal Score Represent the characteristics of a vulnerability that
change over time but are not related to the
organization's environment. This score is updated
when the vulnerability dictionary content is updated,
as described in the About the Dictionary Information
Import Job section in the HP EnterpriseView
Administration Guide.
For more information on CVSS, see "Common
Vulnerability Scoring System" on page 131.
Vector The components from which the score was
calculated and their values. Both base and temporal
metrics. Click the Show link to see how the score
was derived.
Remediation Solution A recommended solution for fixing the vulnerability,
as provided from the vulnerability assessment tool.
Filter (TippingPoint) The signature number of the TippingPoint filter.
Instances
The Instances tab is available from the Details View page.
The Instances tab includes all the instances reported for a single vulnerability occurrence. The data
displayed is provided by the connectors.
Property Description
Reported On The date and time that the vulnerability instance was reported by the
connector.
Source Rule ID The identifier of the rule that corresponds to the vulnerability defined
in the vulnerability assessment tool.
CVEs A list of CVEs that correspond to the scanner rule, as provided by the
connector.
Scanner The name of the vulnerability assessment tool.
Scanner Type Network or Application.
Scanner Version The version of the vulnerability assessment tool.
User Guide
Chapter 5: Vulnerability Management
HP EnterpriseView (2.5) Page 146 of 265
Property Description
Origin Information on the instance origin. A concatenation of the following
parameters separated by a dash:
l Source name: Nessus, Qualys, McAfee, or WebInspect.
l The output of the scanner, either file name or URL
l CSV file name (connector output)
l The line number where the vulnerability was reported in the
CSV file
Example, Nessus-/home/Credit Card Vulns/Visa/nessus_report_
WebTrends.nessus- 2011-09-06-17-42-19.done.csv-555
IP Relevant for network and configuration vulnerabilities.
IP address where the vulnerability was found.
MAC Relevant for network and configuration vulnerabilities.
MAC address where the vulnerability was found.
Asset Vulnerability Score Aggregation Mechanism
The aggregate asset vulnerability score is calculated as the higher score out of the following:
l The direct asset vulnerability score, which is the highest score out of all the vulnerability scores
of open vulnerabilities that are associated with the asset.
l
m
n
*
AggregatedAssetVulnerabilityScore CriticalityLevel of top Children
CriticalityLevel
∑( * )
∑( )
n m=Children Multiplier: This variable is a number between 0 and 1 (inclusive) that is
typically used to decrease the impact of the children on the aggregate asset vulnerability
score; the lower the number, the smaller the effect. Consider the structure of your business
model when configuring this variable. For example, if you have a flat organizational structure,
then the children will have a bigger impact then if you have a structure with many levels of
hierarchy.
n n=Maximum Children in Calculation: Sorted primarily by aggregate asset vulnerability
score and secondarily by criticality level. This variable is used to decrease the impact of the
children severity on the aggregate asset vulnerability score; the higher the number, the
smaller the impact. Consider the structure of your business model when configuring this
variable. For example, if assets in your business model have a maximum of five children
each, then it would be meaningless if this variable is configured to six.
User Guide
Chapter 5: Vulnerability Management
HP EnterpriseView (2.5) Page 147 of 265
For more information on configuring these variables, see the Configure Vulnerability Score
Aggregation Parameters section in the HP EnterpriseView Deployment Guide.
Vulnerability Error Handling
Vulnerability assessment tools generate reports in a variety of formats, such as an XML file or into a
database. The information is converted to CSV format using connectors. The Vulnerability Import
Job retrieves the CSV files, processes the information and writes it to the EnterpriseView
database. For more information on the Vulnerability Import Job, see the About the Vulnerability
Import Job section in the HP EnterpriseView Deployment Guide.
The connectors write the CSV file to the <EnterpriseView Installation
folder>vmimportpending<connector ID> folder. The Vulnerability Import Job processes the
files and does the following:
l Successfully processed files are moved to the <EnterpriseView Installation
folder>vmimportdone<connector ID> folder. When vulnerabilities are not defined in the
vulnerability dictionary, their records might contain data that was not fully imported into
EnterpriseView due to format constraints. In these cases, the data is truncated, and only partial
information is displayed.
For example,the Description field in EnterpriseView can be a maximum of 4000
characters, but the field in the file holds a value of 5000 characters. In this case, only the
first 4000 characters are imported and displayed.
If a record is modified then a notification, indicated by "INFO", is entered into the redcat-
vulnerability-admin.log file that is located in the <EnterpriseView Installation folder>logs
folder.
l Files containing erroneous records are moved to the <EnterpriseView Installation
folder>vmimporterrors<connector ID> folder. If an erroneous record exists, then the
record is skipped and an error message is entered into the redcat-vulnerability-admin.log file that
is located in the <EnterpriseView Installation folder>logs folder.
In either case, vulnerability information is displayed in the Vulnerability Management window. The
Last Imported On field on the toolbar of the Vulnerability Management window displays the date
and time of the most recent import update. If there are any ERROR or INFO messages in the
redcat-vulnerability-admin.log file, an icon informing the user of errors or notifications is displayed
right next to the Last Imported On field.
The redcat-vulnerability-admin.log file is updated with each import. The maximum size of this file is
4MB. When the maximum size is reached, a backup copy of the file is created with the following
suffix:
redcat-vulnerability-admin.log .1
Whenever a new backup file is created, the suffix is incremented by 1. Up to 19 backup files can be
created. After the maximum number of files is reached, the oldest file is deleted.
User Guide
Chapter 5: Vulnerability Management
HP EnterpriseView (2.5) Page 148 of 265
Because the log file generally includes multiple imports, you can use the Job Execution ID to locate
the latest job. Check the Job Management module for the last job executed. For more information,
see the Troubleshoot Batch Jobs section in the HP EnterpriseView Administration Guide.
File Format
Following is the format of a log file record:
<timestamp> ERROR/INFO "The file <file name> for job execution ID <ID> has the following
issues in line number <line number>
<error/info message1>
<error/info message2>"
Example:
2012-01-31 18:07:43,801 ERROR The file '6_error-handling.done.csv' for job e
xecution ID '36' has the following issues in line number 3
The values in the following fields exceed the maximum length:
Description (event.flexString1), maximum length: 4000
These fields were truncated to the maximum length.
The following fields are mandatory and are missing from the record:
Host (event.destinationHostName)
This record was skipped.
Vulnerability Management Window
The Vulnerability Management window enables you to filter the vulnerabilities found in your
organization's network using various criteria, creating views that help you manage the vulnerability
life cycle. The different areas and the functionalities available in each area are described in the
following sections. For information on the EnterpriseView toolbar, see "Toolbar Description" on
page 17.
Toolbar
User Guide
Chapter 5: Vulnerability Management
HP EnterpriseView (2.5) Page 149 of 265
UI Element Description
Vulnerabilities
Affecting Asset
Filter the vulnerabilities in the grid using one of the following options:
l All Vulnerabilities: View all vulnerabilities, both attached to assets
and unattached assets.
l Unattached Vulnerabilities: Select this option to view vulnerabilities
that are not attached to an asset.
l My Organization: Expand the business model and select an asset.
View all vulnerabilities that affect this asset; meaning all
vulnerabilities that are directly attached to this asset or that are
attached to any of its children.
Summary View
This is the default view. For more information, see "Summary View" on
the next page.
Filters are retained when passing from one view to another.
Details View
To open this view, select a vulnerability from the grid, and then select
this view. For more information, see "Details View" on page 152.
Filters are retained when passing from one view to another.
Reports Generate Report
Click this button to generate a report.
Select a report from the list of reports. If you are prompted, select to
always allow pop-ups from the EnterpriseView server. You can save the
report as a PDF.
You can generate a report for an asset or for an asset and its children.
User Guide
Chapter 5: Vulnerability Management
HP EnterpriseView (2.5) Page 150 of 265
UI Element Description
Last Imported On Displays the date of the most recent import update. If any ERROR or
INFO messages are in the redcat-vulnerability-admin.log file, one of the
following icons is displayed:
Errors. Hovering over this icon displays the following message:
"Last update completed with errors."
Notifications (INFO). Hovering over this icon displays the following
message:
"Last update completed with notifications."
For more information or error handling, see "Vulnerability Error Handling"
on page 148.
Aggregate Asset
Vulnerability Score
For <asset>
You can click the score to open the Vulnerability Dashboard page and
view more information about the vulnerabilities attached to the asset. For
more information on how this score is calculated, see "Asset
Vulnerability Score Aggregation Mechanism" on page 147.
Filter Vulnerabilities
Click this button to open the Filter Vulnerabilities dialog box. You can
filter the vulnerabilities in the grid according to the vulnerability properties
that are displayed in the grid, described in "Summary View Grid" on page
140. To remove a filter, you can either open the Filter Vulnerabilities
dialog box and change the filter, or you can close the filter indicators that
display on the toolbar.
Clear Filter
Click this button to clear all the filters that you set.
Summary View
Each record in the summary view grid is an occurrence of a vulnerability in a specific location.
You can filter vulnerabilities using the grid column headers. If the filter string that you enter exceeds
200 characters, only the first 200 characters are used.
The Summary View includes the vulnerability properties describes in "Summary View Grid" on page
140.
User Guide
Chapter 5: Vulnerability Management
HP EnterpriseView (2.5) Page 151 of 265
Details View
The Details View includes the following areas:
Left Pane
This area displays a minimized version of the vulnerabilities grid that is displayed in the Summary
View. It includes the vulnerability ID, Location and Title. Clicking on a vulnerability in this grid
displays its details in the other panes,allowing you to navigate through the vulnerabilities without
changing the view. Vulnerabilities can be filtered using the grid column headers.
Details (middle pane)
This area displays the vulnerability properties described in "Details View" on page 143.
Instances (tab)
This tab displays the vulnerability properties described in "Instances " on page 146.
Status Management
User Guide
Chapter 5: Vulnerability Management
HP EnterpriseView (2.5) Page 152 of 265
UI Element Description
Status Assign a status to the vulnerability (Open or Closed).
Remediation Status Assign a remediation status to the vulnerability. For more information on
the different statuses, see "Remediation Status" on page 142.
Notes Use Notes to communicate with other users that are involved in
remediating the vulnerability and to document anything regarding the
vulnerability. Notes cannot be deleted or edited.
Save Click to save changes.
Cancel Click to clear changes. Reverts any change that you have made to the
statuses.
Vulnerability Assignment Window
The Vulnerability Assignment window enables you to attach vulnerabilities to assets or detach
vulnerabilities from assets. The different areas and the functionalities available in each area are
described in the following sections. For information on the EnterpriseView toolbar, see "Toolbar
Description" on page 17.
Assets
This pane enables you to select the asset to which you want to attach a vulnerability.
UI Element Description
Organization tab Displays the EnterpriseView business model. Expand the business
model to select the asset that you want to display.
Search tab Enables you to search for a name or a partial name of any asset in
EnterpriseView, connected to the business model.
User Guide
Chapter 5: Vulnerability Management
HP EnterpriseView (2.5) Page 153 of 265
Attached Vulnerabilities
This pane displays all the vulnerabilities that are attached to a selected asset. When an asset is
selected, the title of this pane displays the asset name.
UI Element Description
Attach Attach Vulnerabilities to Asset
From the grid, select or multi-select (CTRL+click) the vulnerabilities that
you want to attach to the asset, and then click this button. For more
information, see "Attach a Vulnerability to an Asset" on page 135.
Detach Detach Vulnerabilities from Asset
From the grid, select or multi-select (CTRL+click) the vulnerabilities that
you want to detach from the asset, and then click this button. For more
information, see "To detach a vulnerability from an asset" on page 136.
<Vulnerability
Grid>
A grid with the details of the vulnerabilities that are directly attached to
the asset in the Assets pane.
User Guide
Chapter 5: Vulnerability Management
HP EnterpriseView (2.5) Page 154 of 265
Unattached Vulnerabilities
This pane displays vulnerabilities that are not attached to an asset. It includes the following
methods for filtering unattached vulnerabilities: 
l Quick filters accessible from the screen
l Header filters
l The Filter Vulnerabilities dialog box
UI Element Description
Score Filter according to the vulnerability score severity:
Low
Medium
High
The ranges are determined in the Configure Vulnerability Score Ranges
section in the HP EnterpriseView Deployment Guide.
Status Filter according to Open or Closed.
User Guide
Chapter 5: Vulnerability Management
HP EnterpriseView (2.5) Page 155 of 265
UI Element Description
More Filters Filter Vulnerabilities
Click this button to open the Filter Vulnerabilities dialog box. You can
filter the vulnerabilities in the grid according to the vulnerability properties
that are displayed in the grid, described in "Summary View Grid" on page
140. To remove a filter, click More Filters to open the Filter
Vulnerabilities dialog box and change the filter.
Clear Filter
Click this button to clear all the filters that you set through the Filter
Vulnerabilities dialog box.
<Vulnerability
Grid>
A minimized version of the vulnerabilities grid that is displayed in the
Summary View. It includes the vulnerability ID, Location, Title, and
Score. You can filter vulnerabilities using the grid column headers.
Vulnerability Dictionary
Many information security tools and resources, both commercial and non-commercial, include a
vulnerability database. Each has a different methodology for naming and identifying vulnerabilities.
This means that the same vulnerability can be defined differently in each of these sources.
Because the Vulnerabilities module receives vulnerability information from various sources, the
disparity would make it difficult to identify duplicate reports, provide additional information about the
vulnerabilities, and efficiently associate them with remediation actions.
To solve this problem, EnterpriseView labs created and maintains a comprehensive vulnerability
dictionary that includes all vulnerabilities, regardless of whether they have been recognized by an
industry standard source. EnterpriseView labs compiles, correlates, processes and enriches these
vulnerabilities, and creates a single point of reference for each vulnerability.
The vulnerability dictionary is continually expanded by the labs and can be updated in
EnterpriseView, as described in the Update the Vulnerability Dictionary section in the HP
EnterpriseView Administration Guide . As time goes by, some vulnerability properties can change.
In such cases, these changes are reflected in the dictionary.
EnterpriseView labs sources are varied. Some of the leading industry standard sources from which
information is derived are:
l National Vulnerability Database (NVD), for Common Vulnerabilities and Exposures (CVE) and
Common Configuration Enumeration (CCE)
l Open Source Vulnerability Database (OSVDB)
l BugTraq
You can view the vulnerabilities in the dictionary through the EnterpriseView user interface. To
access the vulnerability dictionary, click Vulnerabilities > Dictionary.
User Guide
Chapter 5: Vulnerability Management
HP EnterpriseView (2.5) Page 156 of 265
The Vulnerability Dictionary window includes two panes:
l Left pane: Displays the vulnerabilities and includes the properties: Vulnerability ID, Title,
Modified Date (either date of creation or the last date it was updated), and score.
l Right pane: Displays the properties of the vulnerability that is selected and Common Platform
Enumerations (CPEs) that are associated with the vulnerability. For more information on CPEs,
see "Common Platform Enumeration" on page 20.
To view the properties of a vulnerability, click the vulnerability record in the left pane. The
Properties tab is displayed. To view CPEs associated with the vulnerability, click the CPEs
tab.
You can search for vulnerabilities using their ID, title, details, or group or partial strings from these
properties.
Note: You can perform wildcard searches. For example, if you type ser*, the results will
contain words beginning with ser (such as server and service). An asterisks cannot be placed
before a string (*ser).
User Guide
Chapter 5: Vulnerability Management
HP EnterpriseView (2.5) Page 157 of 265
Chapter 6: Key Performance Indicators
EnterpriseView includes key performance indicators (KPIs) that are used to measure the
progression of your organization towards its objectives. In EnterpriseView, KPIs are used to
monitor and improve upon the different aspects that comprise risk in your organization.
EnterpriseView includes quantitative KPIs for risk factors, such as modeled risk, vulnerabilities,
policy compliance, and control maturity.
Simple KPIs enable you to define the ranges for the score severity of various risk factors, according
to your business needs. For example, asset vulnerability scores are displayed along with an icon
that represents a low, medium or high score throughout the application. The color indication is also
reflected in the trend charts and heat maps.
More complex KPIs include the percentage of assets with scores that are above or below a certain
threshold. For example, the vulnerability KPI indicates the percentage of assets with an aggregate
vulnerability score that is higher than a certain threshold. The higher the percentage the farther the
organization is from its vulnerability objectives.
EnterpriseView includes out-of-the-box KPIs, as described in "Out-of-the-Box KPIs" on the next
page as well as a corresponding KPI for any external risk factor added to EnterpriseView. In
addition, custom KPIs can be created by an Administrator for any risk factor defined in
EnterpriseView. For more information, see the Create a KPI section in theHP EnterpriseView
Administration Guide.
All KPIs, both custom and out-of-the-box, are configurable. You can change the KPI parameter or
threshold, as described in "Configure KPI Settings" below.
Configure KPI Settings
You can configure KPI settings in order to reflect the tolerance of your organization to the risk
factor. For example, if you lower the High threshold of a KPI, then the KPI will reflect more
tolerance towards the risk factor.
To configure KPI settings
1. Click the Settings button, and then select the module to which the KPI belongs.
2. In the left pane, select the KPI that you want to configure.
3. KPIs can have one or both of the following options. Edit these options as necessary:
n KPI Parameter: enter the threshold that indicates a desirable or an undesirable result.
For example, in a KPI that displays the percentage of assets with an overall score higher
than 20, then “20” is the KPI Parameter. In this case, scores that are higher than 20 are not
desirable.
HP EnterpriseView (2.5) Page 158 of 265
n Thresholds: drag the sliders to define the severity of the percentage ranges, for low,
medium, and high thresholds.
These thresholds are reflected in the gauge that represents the KPI and they define whether
the KPI is acceptable or not.
4. Click Save.
Out-of-the-Box KPIs
EnterpriseView includes out-of-the-box KPIs described in the following table. You can configure the
settings for out-of-the-box KPIs as well as custom KPIs, as described in "Configure KPI Settings"
on the previous page.
Name Description
Overall Score KPI The overall score KPI is used to determine how close or far the
organization is from it's overall risk objectives. The KPI indicates
the percentage of assets, out of both direct and indirect children
including the asset itself, with an overall score that is higher than a
certain threshold (KPI parameter). The higher the percentage the
farther the organization is from its overall risk objectives.
This KPI reflects the tolerance of your organization to its overall
risk. It is configurable and should be derived from your
organization's strategic plans.
The overall score KPI is displayed in the Risk Register page. For
more information, see "Risk Register" on page 178.
Compliance Score KPI The compliance Key Performance Indicator (KPI) is used to
determine how close or far the organization is from it's compliance
objectives. The KPI indicates the percentage of assets, out of
both direct and indirect children including the asset itself, with an
aggregate compliance score that is lower than a certain threshold
(KPI parameter). The higher the percentage the farther the
organization is from its compliance objectives.
This KPI reflects the tolerance of your organization to lack of
compliance. It is configurable and should be derived from your
organization's strategic plans.
The compliance score KPI is displayed in the Risk Register page.
For more information, see "Risk Register" on page 178.
User Guide
Chapter 6: Key Performance Indicators
HP EnterpriseView (2.5) Page 159 of 265
Name Description
Risk Score KPI Indicates the percentage of assets, out of both direct and indirect
children and the asset itself, with an aggregate risk score that is
higher than a certain threshold (KPI parameter). The higher the
percentage the farther the organization is from its risk objectives.
This KPI reflects the tolerance of your organization to risk. It is
configurable and should be derived from your organization's
strategic plans.
The risk score KPI is displayed in the Risk Register page. For
more information, see "Risk Register" on page 178.
Unassessed Risk KPI Indicates the percentage of assets, out of both direct and indirect
children and the asset itself, that have not been assessed. The
higher the percentage the farther the organization is from its risk
assessment objectives.
This KPI reflects your organization's approach to the risk
assessment process. It is configurable and should be derived from
your organization's strategic plans.
The unassessed risk KPI is displayed in the Risk Modeling
Dashboard page. For more information, see "Risk Modeling
Dashboard" on page 187.
Vulnerability Score KPI The vulnerability score KPI is used to determine how close or far
the organization is from it's vulnerability objectives. The
KPI indicates the percentage of assets, out of both direct and
indirect children and the asset itself, with an aggregate
vulnerability score that is higher than a certain threshold
(KPI parameter). The higher the percentage the farther the
organization is from its vulnerability objectives.
This KPI reflects the tolerance of your organization to
vulnerabilities. It is configurable and should be derived from your
organization's strategic plans.
The vulnerability score KPI is displayed in the Risk Register page.
For more information, see "Risk Register" on page 178.
Completed Workflows
KPI
The completed workflows KPI indicates the percentage of
workflows that have been completed by the workflow due date.
This KPI helps you monitor EnterpriseView workflows.
The completed workflows KPI is displayed in the Task
Management Dashboard page. For more information, see "Task
Management Dashboard" on page 197.
User Guide
Chapter 6: Key Performance Indicators
HP EnterpriseView (2.5) Page 160 of 265
Chapter 7: External Risk Factors
The risk posture of the assets in your organization can be affected by various risk factors.
EnterpriseView includes the following inherent risk factors: policy compliance, control maturity,
risk, and vulnerabilities. In addition to the risk factors already included in EnterpriseView, you can
import risk information from external sources for any risk factor that you deem significant and that
impact the overall risk score of your organization. For example, the score of IPS security alerts
resulting from security attacks on a segment of your network. For more information on importing
risk information from external sources, see the Import Risk Information from External Sources
section in the EnterpriseView Administration Guide.
The scores of all risk factors, both internal and external, are consolidated into one score—asset
overall score—that reflects the overall risk posture of the assets in your organization. For more
information on how the overall score is calculated, see "Configure Overall Score Formula Weights"
on page 263.
External risk factors must fulfill the following conditions:
l A risk factor must be associated with an asset defined in EnterpriseView. Information that does
not relate to a particular asset is discarded.
l The information must be numeric. Only numeric information can be aggregated, included in the
overall score, and reflected in trend charts.
External risk factors are centralized in the External Risk Factor Management page. The
management page allows you to do the following:
l See the score of each external risk factor, for each asset, on top of the business model.
l Capture a snapshot in time that reflects the state of your business model—both assets and their
scores. For more information on capturing a snapshot, see "Capture Snapshot" on the next
page.
l Edit score manually, as described in "Edit External Risk Factor Score" on page 163.
l Compare snapshot scores to current scores and analyze score trends.
l Locate high risk assets according to critical external risk factors.
l Filter data using advanced filtering capabilities, for example, according to score ranges.
For more information on the External risk factor Management page, see "External Risk Factor
Management Window" on page 164.
Whenever you add a risk factor to EnterpriseView, a corresponding KPI is created automatically.
KPIs are managed in the KPI Management page. You can configure the external risk factor
KPI settings, as described in "Configure External Risk Factor KPI Settings" on page 164.You can
also configure external risk factor ranges (like you can for all risk factors), as described in
"Configure External Risk Factor Ranges" on page 163.
External risk factors, like internal risk factors, are reflected in:
HP EnterpriseView (2.5) Page 161 of 265
l Risk Register: Aggregate scores for risk factors are displayed in the Asset Summary
component and in the First-Level Children Summary component. For more information, see
"Risk Register" on page 178.
l Risk Indicators: External risk factors are regarded as risk indicators. For more information, see
"Risk Indicators" on page 182.
External risk factors have a dedicated dashboard—External Risk Factor Dashboard—that
displays information on all the external risk factors that are imported into EnterpriseView. For more
information, see "External Risk Factors Dashboard" on page 185. You can also incorporate external
risk factor scores, aggregate scores and any other information into user created reports. For more
information on creating reports, see the Create a Report Using SAP BusinessObjects
WebIntelligence in the HP EnterpriseView Administration Guide.
Capture Snapshot
The External Risk Factor Management page allows you to save a snapshot of external risk factor
scores and aggregate scores for each of the assets in the business model. You can save only one
snapshot at a time. You can recapture a snapshot at any time. Assets that do not have scores are
not saved in the snapshot.
The main purpose of the snapshot is to compare the state of your current business model to the
state of a previous business model (the snapshot). For example, you can use the snapshot as a
baseline that reflects a positive state of your business model. You can see the difference between
the current score and the snapshot score according to the icon displayed next to the asset in the
map.
In the following example, the current score for My organization is lower than the snapshot score.
In this case, the arrow is green, meaning that a lower score is better.
You can use snapshot scores to filter the assets displayed in the map.
To capture a snapshot
1. Click External Risk Factor > Management.
2. From the risk factor selector on the top left side of the page, select the risk factor that you want
to display.
3. Click Capture Snapshot.
The date and time are displayed in the Last Snapshot Updated On field.
User Guide
Chapter 7: External Risk Factors
HP EnterpriseView (2.5) Page 162 of 265
Edit External Risk Factor Score
Typically, external risk factor scores are imported from an external source. However, there might be
cases where a score cannot be imported for a specific asset. In such cases, you can enter the
external risk factor score manually. You can enter a score only for an asset that does not have a
score imported from an external source. If, at some point, the score is imported for that asset, then
you will no longer be able to edit the score.
To edit the score
1. Click External Risk Factor > Management.
2. From the risk factor selector on the top left side of the page, select the risk factor that you want
to display.
3. Click an asset on the map. (You can search for an asset, as described in "Search for an Asset"
on page 29, and then click the Show on Map button.)
4. On the asset card, click the Edit Asset Score button.
5. On the Edit Asset Score dialog box, drag the slider to sent the score, and then click OK.
Configure External Risk Factor Ranges
You can configure the ranges for the score severity indication for any external risk factor defined in
EnterpriseView.
Score ranges and the directionality of the score severity may differ between external risk factors.
These settings are defined during the configuration process of the external risk factor. For more
information, see the Configure the External Risk Factor Normalization Settings in the HP
EnterpriseView Administration Guide.
External risk factor scores are displayed with one of the following icons:
Better score (high or low, depending on the directionality)
Medium score
Worse score (high or low, depending on the directionality)
This configuration is reflected throughout the application, wherever these measurements are
displayed. For example, on the Risk Register page in the Asset Summary component.
To configure external risk factor ranges
1. On the EnterpriseView toolbar, click the Settings button.
User Guide
Chapter 7: External Risk Factors
HP EnterpriseView (2.5) Page 163 of 265
2. On the Settings dialog box, click External Risk Factors.
3. In the left pane, click the risk factor for which you want to configure ranges.
4. Drag the slider to define the ranges.
5. Click Save.
Configure External Risk Factor KPI Settings
You can configure KPI settings in order to reflect the tolerance of your organization to the risk
factor. For example, if you lower the High threshold of a KPI, then the KPI will reflect more
tolerance towards the risk factor.
You can also configure the KPI settings in the KPI Management page, as described in the Edit a
KPI section in the HP EnterpriseView Administration Guide.
To configure KPI settings
1. Click the Settings button, and then, in the Settings dialog box, click External Risk
Factor.
2. In the left pane, select the risk factor that you want to configure.
3. Edit the following options as necessary:
n KPI Parameter: Enter the threshold that indicates a desirable or an undesirable result.
n Thresholds: Drag the sliders to define the severity of the percentage ranges, for low,
medium, and high thresholds.
These thresholds are reflected in the gauge that represents the KPI and they define whether
the KPI is acceptable or not.
4. Click Save.
External Risk Factor Management Window
The External Risk Factor Management window is a centralized area for managing external risk
factors.The different areas and the functionalities available in each area are described in the
following sections. For information on the EnterpriseView toolbar, see "Toolbar Description" on
page 17.
User Guide
Chapter 7: External Risk Factors
HP EnterpriseView (2.5) Page 164 of 265
Map Area
UI Element Description
<Risk Factor
Selector>
Displays information pertaining to a particular external risk factor. You
can work on one external risk factor at a time.
(Layout)
Display the business model in a tree layout
Displays the business model in a tree structured graph.
(Layout)
Display the business model in a circular layout
Displays the business model in an interconnected ring and star topology.
You are Viewing The name of the view that is displayed. If there are multiple views, you
can select a different view from the list.
Views on this page include asset composition, the risk factor, the filter,
and the score type.
User Guide
Chapter 7: External Risk Factors
HP EnterpriseView (2.5) Page 165 of 265
UI Element Description
Save New View Creates a new view based on the current business model view displayed
in the map.
Access this option by clicking the arrow next to the Save button.
After you save the view, when you reopen the External Risk Factor
Management page, the business model displayed in the map area is
resized to the default zoom and to fit to window.
Note: Assets that were disconnected from the business model are
not displayed in the view.
Views are user-specific; you cannot see views that other users created.
For more information, see "Create a Business Model View" on page 24.
Save Saves the changes that you made to the view displayed on the map.
Clear View
Click this button to clear the view (including the risk factor, the filter, and
the score type) and display only the My Organization asset.
Capture Snapshot Click this button to capture a snapshot of external risk factor scores and
aggregate scores for each of the assets in the business model.
For more information, see "Capture Snapshot" on page 162.
Last Snapshot
Update On
The date and time of the last snapshot that you captured.
User Guide
Chapter 7: External Risk Factors
HP EnterpriseView (2.5) Page 166 of 265
UI Element Description
Filter Assets
Click this button to open the Filter Assets dialog box. You can filter the
assets in the map according to different asset properties and scores.
For example, you can set a filter to display only assets that have a good
snapshot score (in the green range) but a bad current score (in the red
range).
There might be situations in which some of the assets displayed do not
fulfill the filter conditions. These assets are displayed because they have
children assets that do fulfill the filter conditions. In the following
diagram, assets A and B do not fulfill the filter conditions, but they must
be displayed so that assets C,D,E, and F, which fulfill the filter
conditions, are displayed in the map.
Clear Filter
Click this button to clear all the filters that you set.
Zoom
Zooms the business model in and out.
User Guide
Chapter 7: External Risk Factors
HP EnterpriseView (2.5) Page 167 of 265
Search Pane
UI Element Description
<Search box> Enables you to search for a name or a partial name of any asset in
EnterpriseView, connected to the business model.
Advanced Enables you to search for an asset according to Type and Category.
Show on Map
Displays the asset in the business model in the map area.
Edit Asset Score
Opens the Edit Asset Score dialog box.
You can edit the score, as described in "Edit External Risk Factor Score"
on page 163.
Generate Report
Click this button to generate a report.
Select a report from the list of reports. If you are prompted, select to
always allow pop-ups from the EnterpriseView server. You can save the
report as a PDF.
The report will include only information for the asset from which you are
generating it, and its children.
User Guide
Chapter 7: External Risk Factors
HP EnterpriseView (2.5) Page 168 of 265
UI Element Description
Collapse
Collapses the left pane.
Expand
Expands the left pane.
Legend
User Guide
Chapter 7: External Risk Factors
HP EnterpriseView (2.5) Page 169 of 265
UI Element Description
Select score to
display
Select one of the following scores to display on the assets on the
business model map:
l Current Aggregate Score
l Current Score
l Snapshot Aggregate Score
l Snapshot Score
<Score severity> Score ranges and the directionality of the score severity may differ
between external risk factors.
External risk factor scores are displayed with one of the following icons:
Better score (High or Low, depending on the directionality)
Medium score
Worse score (High or Low, depending on the directionality)
The ranges for each severity are displayed, as well.
Current score
compared to last
snapshot score
Indicates whether the current score is better or worse or unchanged
since the last snapshot score. The Better and Worse icons depend on
the directionality of the score severity. If a lower score is better, then the
following icons will be displayed in the legend:
l The current score is better than the snapshot score.
l The current score is worse than the snapshot score.
l The current score has not changed since the last snapshot.
The icons change according to the score severity directionality.
Asset Card
You can open the asset card by clicking on the asset in the business model map.
The following is an example of an expanded asset card.
User Guide
Chapter 7: External Risk Factors
HP EnterpriseView (2.5) Page 170 of 265
The asset card includes the asset name, category, type, trend, and score (the score type selected
in the legend). The following table includes the functionality available from the asset card.
UI Element Description
Edit Asset Score
Opens the Edit Asset Score dialog box.
You can edit the score, as described in "Edit External Risk Factor Score"
on page 163.
Generate Report
Click this button to generate a report.
Select a report from the list of reports. If you are prompted, select to
always allow pop-ups from the EnterpriseView server. You can save the
report as a PDF.
The report will include only information for the asset from which you are
generating it, and its children.
User Guide
Chapter 7: External Risk Factors
HP EnterpriseView (2.5) Page 171 of 265
UI Element Description
Expand Displays the direct children of the asset in the business model map.
Click More > Expand.
If the asset has more than 20 children, then the assets are not displayed
automatically in order not to overload the business model. In this case,
the Show Children on Map for Asset dialog box is displayed, enabling
you to select the children you want to display. The number of direct
children that an asset has is displayed in the business model map by the
asset name.
You can also expand by double-clicking the asset.
Note: You cannot expand an asset that has more than 1000 children
in the business model. If you attempt to expand such an asset, you
will receive an error message.
Collapse Hides the direct children of the asset in the business model map.
Click More > Collapse.
You can also collapse by double-clicking the asset.
Show Parents Displays the parent assets of the asset in the business model map.
Click More > Show Parents.
Hide Parents Hides the parent assets of the asset in the business model map.
Click More > Hide Parents.
Display Scores
Displays the following scores:
l Current score
l Snapshot score
l Aggregate current score
l Aggregate snapshot score
User Guide
Chapter 7: External Risk Factors
HP EnterpriseView (2.5) Page 172 of 265
UI Element Description
Hide Scores
Hides the following scores:
l Current score
l Snapshot score
l Aggregate current score
l Aggregate snapshot score
Mini-map
When the business model is expanded to a larger size than the map area, you can navigate it by
clicking and dragging in the mini-map area.
To expand or collapse the mini-map, click the Expand/Collapse button.
Out-of-the-Box Risk Factors
EnterpriseView includes out-of-the-box risk factors that are based on ESM reports. The reports are
imported into ESM during the integration process.
Risk Factor Description Data Source
Antivirus Shows whether the antivirus installed on the asset is
updated or not.
Assets
Brute Force Attempt Shows the brute force attempts events for assets that
have been targeted in the last hour.
Active List
DoS Attacks Shows the denial of service score for assets that have
been targeted in the past day.
Active List
Events Priority Shows the average priority for assets that have been
targeted in the last hour.
Events
Dropped Events by
Firewall
Shows events dropped by the firewall, for assets that
have been targeted in the last hour.
Active List
Failed Login Shows the number of failed login events for assets that
have been targeted in the last hour.
Active List
IP Scanning Shows the IP scanning events for assets that have been
targeted in the last hour.
Active List
Port Scanning Shows the port scanning events for assets that have
been targeted in the last hour.
Active List
User Guide
Chapter 7: External Risk Factors
HP EnterpriseView (2.5) Page 173 of 265
Chapter 8: Dashboards and Reports
EnterpriseView comes with a variety of out-of-the-box dashboards and printable reports, based on
common needs of specific IT and risk management roles, such as system administrators, auditors,
and executives. EnterpriseView administrators can create customized role-based dashboards for
different types of users, as described in the Create a Customized Dashboards Page in the HP
EnterpriseView Administration Guide. The dashboards can be created from predefined reports or
from user-created reports.
There are two types of reports that you can create:
l Printable
These reports are available from any page that is associated with a report. These reports are
generated as print-friendly PDF documents by clicking the Generate Report button. For
more information on the reports included in EnterpriseView, see "Printing Reports" on the next
page.
l Dashboard
These reports are used as data analysis components and can be grouped together with other
components in order to create comprehensive dashboards, such as the Risk Register, for the
various roles. For more information, see "Risk Register" on page 178
You can create reports that belong to both categories. For more information on creating reports, see
the Create a Report Using SAP BusinessObjects WebIntelligence in the HP EnterpriseView
Administration Guide.
HP EnterpriseView (2.5) Page 174 of 265
Printing Reports
Out-of-the-box printable reports are available from the Risk Factor Dashboard, Risk Register, Risk
Assessment and Treatment, Policy Assessment, Statement of Applicability, and Vulnerability
Management pages. Custom reports are available from the page that you associated with them
when you created the report. From each window, only reports that are specific to that module are
available. These reports are generated as print-friendly PDF documents by clicking the Generate
Report button.
In addition to the various reports provided by EnterpriseView, you can create your own customized
reports using BusinessObjects Web Intelligence, as described in Create a Report Using SAP
BusinessObjects WebIntelligence in the HP EnterpriseView Administration Guide.
The following table includes all of the out-of-the-box reports in EnterpriseView.
Page Report Name Description
Risk Register Overall Score
Trend
This report includes overall scores for the asset selected
and its children, for the following times:
l Current date
l The date on which the last score was archived (within
the last week)
l Within the last month
This reports shows a general pattern of change in data
over time.
Risk Factor
Dashboard
Risk Factor
Score Trend
This report includes risk factor scores for the asset
selected and its children, for the following times:
l Current date
l The date on which the last score was archived (within
the last week)
l Within the last month
This reports shows a general pattern of change in data
over time.
User Guide
Chapter 8: Dashboards and Reports
HP EnterpriseView (2.5) Page 175 of 265
Page Report Name Description
Risk Modeling Risk Score
Summary
This report includes the selected asset's risk score and
aggregate risk score, as well as risk information for each
threat imposed on a selected asset.
Risk Score
Details
This report includes risk score information on all actors
and operations that comprise the threats that are posed
on a selected asset, in conjunction with their name and
description.
Statement of
Applicability
Statement of
Applicability
Details
This report includes all the controls from policies that are
applied to a selected asset and their details.
Policy
Assessment
Policy
Compliance
Summary
This report includes compliance scores, control maturity
scores and assessment progress information on controls,
security categories the policy applied to a selected asset.
Policy
Compliance
Details
This report includes compliance scores, control maturity
scores and assessment progress information on all policy
elements (security categories and controls) that are
applied to a selected asset, in conjunction with the policy
content.
Policy Builder Activated
Mapped
Controls
This report includes mappings between a source policy
and a target policy for all controls in policies that are
activated, for a selected policy.
Policy Details This report includes the policy content for a selected
policy.
Vulnerability Open
Vulnerabilities
Summary
This report includes the vulnerability score and the
number of locations that the vulnerability was found for all
open vulnerabilities for a selected asset and all of its
children.
Note: If the vulnerability is attached to more than one
asset, then the score for each vulnerability,
displayed in the Score column, may be different. In
this case, the highest score is displayed.
Product
Vulnerability
Details
This report reflects the degree of vulnerability of products
that are connected to assets in the business model
according to the number of occurrences, the highest
vulnerability score, and the average vulnerability score.
User Guide
Chapter 8: Dashboards and Reports
HP EnterpriseView (2.5) Page 176 of 265
Page Report Name Description
Task
Management
Workflow
Details
This report includes details on workflows and their tasks
(in progress or completed). Information on workflows that
are in progress is displayed separately from completed
workflows.
Workflow
Details - Last 30
Days
This report is the same as Workflow Details report, but
displays completed workflows only from the last 30 days.
Root Cause Analysis
Root cause analysis (RCA) is a structured approach for identifying the underlying causes of
problems or events. RCA is based on the assumption that problems should be solved by
addressing their root causes rather than their obvious symptoms. You can use RCA to mitigate,
eliminate, or prevent risk in your organization.
EnterpriseView dashboards support RCA. The dashboards include a drill-down functionality,
strategically placed links, allowing you to trace root problems by navigating the various dashboards
and EnterpriseView pages. These links are available depending on your role and permissions. In
addition, the EnterpriseView Risk Indicators is an RCA tool that offers you the quickest way to
identify risk sources in your organization's business model. It provides you with graphical risk
indication on top of your business model map.
There are two main approaches for RCA in EnterpriseView:
l Identifying the underlying asset or assets that are responsible for increasing the overall risk in
your organization.
To follow this approach, you can track the source asset by drilling down in the business model.
Example:
a. Start by opening the Risk Register (Executive View > Risk Register) for your root
asset.
b. Identify the asset with the highest risk in the First-Level Children Summary
component, and click its name.
The Risk Register is updated with information on the asset that you selected.
c. Continue drilling down until you identify the underlying problematic asset.
l Identifying the risk element (vulnerability score, risk score, compliance score, and maturity
score) that is responsible for increasing the overall risk in an asset.
To follow this approach, you can track the risk element by investigating it specifically.
User Guide
Chapter 8: Dashboards and Reports
HP EnterpriseView (2.5) Page 177 of 265
Example:
a. Start by opening the Risk Register for your root asset.
b. Identify the risk element that appears to be problematic the in the Asset Summary, and
click its name.
EnterpriseView navigates to the dashboard that corresponds with the risk element that
you chose. For example, if the problematic risk element is the vulnerability score, then
when you click Vulnerability, the Vulnerability Dashboard opens.
c. Continue drilling down until you identify the underlying problematic risk element.
Regardless of the approach you take, after you have identified the problematic asset or risk
element, you can navigate to the relevant EnterpriseView page through which you can mitigate the
problem.
Example:
1. Identify an asset with a high aggregate asset vulnerability score in the Risk Register.
2. Click the Aggregate Asset Vulnerability Score label in the Vulnerability Dashboard.
The Vulnerability Management page opens with information about the specific asset.
3. Continue investigating the vulnerabilities using the tools available in the Vulnerability
Management page. For example, you can filter vulnerabilities according to their score.
4. Handle the vulnerabilities attached to the asset to lower the asset vulnerability score.
Risk Register
The EnterpriseView Risk Register is a comprehensive dashboard that provides you with all the risk-
related information identified by your organization.
To open the Risk Register, click Executive View > Risk Register.
The Risk Register includes the following components:
l Asset Selector
This component enables you to select the asset that you want to display in the Risk Register.
The Organization tab displays the EnterpriseView business model. Expand the business model
to select the asset that you want to display.
User Guide
Chapter 8: Dashboards and Reports
HP EnterpriseView (2.5) Page 178 of 265
The Search tab enables you to search for a name or a partial name of any asset connected to
the business model.
After you have selected the asset, you can collapse the Asset Selector by clicking the
Collapse button. To expand the Asset Selector, click the Expand Asset Selector
button.
The asset that you selected is saved for when you next log on.
l Asset Summary
This component displays the overall asset score. The asset overall score reflects the total risk
of the asset. It is composed of the weighted average of the aggregate scores of all risk factors.
There are five risk factors that are inherent in EnterpriseView, they include: policy compliance,
the control maturity, risk, asset vulnerability, and ESM threat. In addition to these factors, any
external risk factor that has been defined in EnterpriseView is also included in the asset overall
score calculation. The three scores that represent the highest risk are displayed. For more on
external risk factors, see "External Risk Factors" on page 161.
The inherent risk factors are:
n Risk: The aggregate risk score of the asset. For more information on how this score is
calculated, see "Risk Score Aggregation Mechanism" on page 110.
n Compliance: The aggregate compliance score of the asset. For more information on how this
score is calculated, see "Control Scores Aggregation Mechanism" on page 77.
n Maturity: The aggregate control maturity score of the asset. For more information on how this
score is calculated, see "Control Scores Aggregation Mechanism" on page 77.
n Vulnerability: The aggregate asset vulnerability score of the asset. For more information on
how this score is calculated, see "Asset Vulnerability Score Aggregation Mechanism" on
page 147.
The following formula is used for calculating the asset overall score:
normalizedaggregatedriskfactor scores weight
weights
∑( * )
∑
Note: You can edit the weights of these scores in Settings > Executive View > Overall
Score Formula Weights. For more information, see "Configure Overall Score Formula
Weights" on page 263.
To analyze the scores, click on the label of the score that you want to analyze. You will be
redirected to the corresponding page:
User Guide
Chapter 8: Dashboards and Reports
HP EnterpriseView (2.5) Page 179 of 265
n Risk: Risk Modeling Dashboard
n Compliance: Compliance Dashboard
n Maturity: Compliance Dashboard
n Vulnerability: Vulnerability Dashboard
l First-Level Children Summary
This component displays the information provided in the Asset Summary for the highest risk,
first level children of the asset that you selected (up to five are displayed).
To analyze a specific child asset, click the asset in the Asset Name column. The page is
reloaded with information on the asset that you chose.
l Asset Overall Score Over Time
This component displays the asset overall score over time. Asset overall scores are archived on
a weekly basis. These scores, as well as the most updated score, are displayed in a graph in
order to reveal trends in the overall score. If you hover over the round icons in the graph, you can
see the exact score and the date on which it was calculated.
For more information on archiving, see the Archive Trend Data section in the HP EnterpriseView
Administration Guide.
l Risk Score KPI
This component displays a Key Performance Indicator (KPI) that indicates the percentage of
assets, out of both direct and indirect children, with an aggregate risk score that is higher than a
certain threshold (KPI parameter). The higher the percentage the farther the organization is from
its business objectives. You can configure the KPI parameter and thresholds, as described in
"Configure KPI Settings" on page 158.
The KPI score percentage is dynamic and is displayed in the center of the gauge.
l Vulnerability Score KPI
This component displays a KPI that indicates the percentage of assets, out of both direct and
indirect children, with an aggregate vulnerability score that is higher than a certain threshold
(KPI parameter). The higher the percentage the farther the organization is from its business
objectives. You can configure the KPI parameter and thresholds, as described in "Configure
KPI Settings" on page 158.
The KPI score percentage is dynamic and is displayed in the center of the gauge.
l Compliance Score KPI
User Guide
Chapter 8: Dashboards and Reports
HP EnterpriseView (2.5) Page 180 of 265
This component displays a KPI that indicates the percentage of assets, out of both direct and
indirect children, with an aggregate compliance score that is lower than a certain threshold
(KPI parameter). The higher the percentage the farther the organization is from its business
objectives. You can configure the KPI parameter and thresholds, as described in "Configure
KPI Settings" on page 158.
The KPI score percentage is dynamic and is displayed in the center of the gauge.
l Overall Score KPI
This component displays a KPI that indicates the percentage of assets, out of both direct and
indirect children, with an aggregate overall score that is higher than a certain threshold
(KPI parameter). The higher the percentage the farther the organization is from its business
objectives. You can configure the KPI parameter and thresholds, as described in "Configure
KPI Settings" on page 158.
The KPI score percentage is dynamic and is displayed in the center of the gauge.
Overall Score Heat Map
The Overall Score Heat Map enables you to view the overall score of Business and Location assets
according to their criticality level.
To open the Overall Score Heat Map, click Executive View > Overall Score Heat Map.
The colors in the heat map reflect the severity of the scores, as follows:
l Low = green
l Medium = yellow
l High = red
The criticality level ranges are configurable. For more information, see "Configure Criticality Level
Ranges" on page 264.
The overall score is composed of the aggregate scores of all the risk factors. For more information
on the how this score is calculated, see "Configure Overall Score Formula Weights" on page 263.
The assets displayed in the graph are first and second level children of the asset that you select. If
the asset that you select does not contain Business or Location assets, the graph remains empty.
The Overall Score Heat Map includes the following components:
l Asset Selector
The Organization tab displays the EnterpriseView business model. Expand the business model
to select the asset that you want to analyze.
User Guide
Chapter 8: Dashboards and Reports
HP EnterpriseView (2.5) Page 181 of 265
The Search tab enables you to search for a name or a partial name of any asset connected to
the business model.
After you have selected the asset, you can collapse the Asset Selector by clicking the
Collapse button. To expand the Asset Selector, click the Expand Asset Selector
button.
l Overall Score Heat Map
The name of the asset that you selected is displayed above the graph along with its overall asset
score and its criticality level, if it is defined.
Note: Only assets that have been assessed are displayed on the graph.
The assets that are displayed in the legend are sorted alphabetically and are numbered
accordingly. Hover over the asset on the graph to display the name of the asset, the criticality
level and the overall asset score. Click the icon of the asset in the graph to highlight the asset in
the legend and vice versa. If two or more assets have the same criticality level and overall asset
score, then they both appear as a single point on the graph and the icon is displayed with an
ellipsis (...). Hover over the ellipsis icon to display information on all the assets that have the
same overall asset score and criticality level.
Risk Indicators
The Risk Indicators page is a root cause analysis tool that helps you identify risk sources in your
organization's business model. It provides you with graphical risk indication on top of your business
model map.
There are four quantitative factors that are inherent to EnterpriseView. These factors include risk,
policy compliance, control maturity, and vulnerability. In addition to these factors, you can import
risk information from external sources for any risk factor that you deem significant and that impact
the overall risk score of your organization. For more information on external risk factors, see
"External Risk Factors" on page 161. All of these scores are formulated into the overall score of the
asset.These factors, together with the asset overall score, are risk indicators. For more information
on how the asset overall score is calculated, see "Configure Overall Score Formula Weights" on
page 263.
You can select the risk indicator that you want to display on the business model map from the
indicator menu. When you select an indicator from the indicator menu, information is updated in the
business model map, in the asset card, and in the search pane. The name of the indicator that you
selected appears at the top of the indicator menu. For example, if you chose the Overall indicator
then the indicator menu appears as follows:
User Guide
Chapter 8: Dashboards and Reports
HP EnterpriseView (2.5) Page 182 of 265
Every asset in the map has an icon that depicts the severity of the indicator score that you chose to
display. The severity ranges for these scores are defined in Settings. For more information, see
"Settings" on page 261. In the following example My organization has a low severity score.
If you click an asset in the map, the asset card opens displaying information on the asset,including
the scores for all the indicators. For more information, see "Asset Card" below.
The Risk Indicators page includes the following areas:
l Left Pane
n Search. You can search for a name or a partial name of any asset connected to the business
model. You can also search by asset category or type by clicking Advanced. Click the Show
on Map button to display the asset in the business model map.
n Toolbar. The toolbar includes map-related actions that are similar to the Asset Profiling page,
such as changing the map layout. All actions are view-only. For more information on these
actions, see "Map Area" on page 35.
l Map Area
The map area provides a graphical display of the business model. The indicator menu can be
found in the upper right side of the map area. You can select a risk indicator to display in the
business model map.
l Asset Card
You can open the asset card by clicking on the asset in the business model map.
User Guide
Chapter 8: Dashboards and Reports
HP EnterpriseView (2.5) Page 183 of 265
Example:
Note: The My Organization asset does not include the Show Parents and Hide Parents
options because it is the root asset in the business model.
The following table includes the functionality available from the asset card.
UI Element Description
Expand
Show the direct children of the asset in the business model map.
If the asset has more than 20 children, then the assets are not displayed
automatically in order not to overload the business model. In this case, the
Show Children on Map for Asset dialog box is displayed, enabling you to
select the children you want to display. The number of direct children that
an asset has is displayed in the business model map by the asset name.
You can also expand by double-clicking the asset.
Collapse
Hide the direct children of the asset in the business model map.
You can also collapse by double-clicking the asset.
Show Parents Show the parent assets of the asset in the business model map.
Click More > Show Parents.
User Guide
Chapter 8: Dashboards and Reports
HP EnterpriseView (2.5) Page 184 of 265
UI Element Description
Hide Parents Hide the parent assets of the asset in the business model map.
Click More > Hide Parents.
Open Indicator Scores
Click to view all indicator scores.
To analyze the scores, click on the label of the score that you want to
analyze. You will be redirected to the corresponding page:
n Overall Score: Risk Register
n Risk Score: Risk Modeling Dashboard
n Compliance Score: Compliance Dashboard
n Maturity Score: Compliance Dashboard
n Vulnerability Score: Vulnerability Dashboard
Close Indicator Scores
Close indicator scores.
l Mini-Map
When the business model is expanded to a larger size than the map area, you can navigate it by
clicking and dragging in the mini-map area.
To expand or collapse the mini-map, click the Expand/Collapse button.
High-risk assets that are displayed with a red severity indication in the map are also marked in
red in the mini-map.
External Risk Factors Dashboard
The External Risk Factors Dashboard is a comprehensive dashboard that provides you with
information on risk factors that have been imported into EnterpriseView from external sources. For
more information on external risk factors, see "External Risk Factors" on page 161.
To open the External Risk Factors Dashboard, click Executive View > External Risk Factors
Dashboard.
User Guide
Chapter 8: Dashboards and Reports
HP EnterpriseView (2.5) Page 185 of 265
l Risk Factor and Asset Selector
This component enables you to select an asset and an external risk factor and display risk
information on that asset and its children.
You must first select a risk factor from the list.
The Organization tab displays the EnterpriseView business model. Expand the business model
to select the asset that you want to display.
The Search tab enables you to search for a name or a partial name of any asset connected to
the business model.
After you have selected the asset, you can collapse the Risk Factor and Asset Selector by
clicking the Collapse Risk Factor and Asset Selector button. To expand theRisk Factor
and Asset Selector, click the Expand Risk Factor and Asset Selector button.
l Summary
This component displays the score and aggregate score for a specific external risk factor for the
asset that you have selected. For more information on how the aggregate score is calculated,
see "Risk Score Aggregation Mechanism" on page 110.
l First level Children Summary
This component displays the information provided in the Summary component for the highest
risk first-level children of the asset that you selected (up to five are displayed).
l Aggregate Risk Score Over Time
Asset aggregate risk factor scores are archived on a regular basis. The archived scores and the
current score are displayed in a graph in order to reveal trends in risk. Hover over the round icons
in the graph to see the exact risk factor score and the date on which it was calculated.
For more information on archiving, see the Archive Trend Data section in the HP EnterpriseView
Administration Guide.
l Risk Factor KPI
Indicates the percentage of assets, out of both direct and indirect children and the asset itself,
with an aggregate external risk factor score that is higher or lower than a certain threshold
(KPI parameter). The percentage indicates how near or far the organization is from its risk
objectives.
This KPI reflects the tolerance of your organization to risk. It is configurable and should be
derived from your organization's strategic plans.
User Guide
Chapter 8: Dashboards and Reports
HP EnterpriseView (2.5) Page 186 of 265
Risk Modeling Dashboard
The Risk Modeling Dashboard is a comprehensive dashboard that provides you with general
information on modeled risk for a specific asset.
To open the Risk Modeling Dashboard page, click Risk Modeling > Risk Modeling Dashboard.
Risk Modeling Dashboard includes the following components:
l Asset Selector
The Organization tab displays the EnterpriseView business model. Expand the business model
to select the asset that you want to analyze.
The Search tab enables you to search for a name or a partial name of any asset in
EnterpriseView, connected to the business model.
After you have selected the asset, you can collapse the Asset Selector by clicking the
Collapse button. To expand the Asset Selector, click the Expand Asset Selector
button.
l Risk Scores
This component displays the residual risk and aggregate risk scores for the asset that you have
selected. For more information on how these scores are calculated, see "Residual Risk Score
Calculation" on page 112 and "Risk Score Aggregation Mechanism" on page 110.
To analyze the residual risk, click on Residual Risk. The Risk Modeling Assessment page
opens, displaying risk information for the asset that you have chosen.
l First-Level Children Summary
This component displays the information provided in the Risk Scores component for the highest
risk first-level children of the asset that you selected (up to five are displayed).
To analyze a specific child asset, click the asset in the Asset Name column. The page is
reloaded with information on the asset that you chose.
l Children Assessment Breakdown
This component displays the breakdown of risk severity (high, medium, low) of all the children of
the asset that you selected, both direct and indirect. Only children that have a risk assessment
are included in this breakdown.
l Aggregate Risk Score Over Time
Asset aggregate risk scores are archived on a weekly basis. These scores, as well as the most
updated score, are displayed in a graph in order to reveal trends in risk. Hover over the round
icons in the graph to see the exact risk score and the date on which it was calculated.
User Guide
Chapter 8: Dashboards and Reports
HP EnterpriseView (2.5) Page 187 of 265
For more information on archiving, see the Archive Trend Data section in the HP EnterpriseView
Administration Guide.
l Risk Status Breakdown
This component presents a breakdown of risks according to their status. Because risk status is
set manually, then the accuracy of this information depends on how accurately you manage the
risk status.
l Unassessed Risk KPI
A Key Performance Indicator (KPI) that indicates the percentage of business-critical assets
(Business and Location assets), out of both direct and indirect children, that have not been
assessed. The higher the percentage the farther the organization is from its objectives.
For more information. see "Unassessed Risk KPI" on page 160.
User Guide
Chapter 8: Dashboards and Reports
HP EnterpriseView (2.5) Page 188 of 265
Risk Heat Map and Scorecard
The Risk Scorecard and Heat Map includes information on risk assessment that is performed on a
specific asset.
To open the Risk Scorecard and Heat Map page, click Risk Modeling > Risk Scorecard and
Heat Map.
Risk Scorecard and Heat Map includes the following components:
l Asset Selector
The Organization tab displays the EnterpriseView business model. Expand the business model
to select the asset that you want to analyze.
The Search tab enables you to search for a name or a partial name of any asset connected to
the business model.
After you have selected the asset, you can collapse the Asset Selector by clicking the
Collapse button. To expand the Asset Selector, click the Expand Asset Selector
button.
l Risk Heat Map
The Risk Heat Map displays threat scenarios according to their impact scores and probability. If
the asset that you select does not have any threats attached to it, then the graph remains empty.
The colors in the heat map reflect the severity of the scores.
If the risk has been treated, then the impact score that is displayed is the treated impact score
and the probability that is displayed is the treated probability. If the risk has not been treated,
then the impact score that is displayed is the impact score and the probability that were set
during the assessment process. If there are controls mapped to the threat, then the adjusted
probability is displayed.
Hover over the threat on the graph to display the probability, impact score, operation, and actor.
Clicking the icon in the graph selects the threat in the legend and vice versa. If two or more
threats have the same probability and impact score, then they both appear as a single point on
the graph and the icon is displayed with an ellipsis (...). Hover over this icon to display
information on all the threats that have the same probability and impact score.
l Risk Scorecard
The Risk Scorecard table includes detailed risk assessment and treatment information. If the
risk has been treated, then the impact score and the probability that are displayed represent the
treated data. If the risk has not been treated, then the impact score and the probability that are
displayed represent the assessment data.
The name of the asset that you selected is displayed above the table along with its residual risk
score.
User Guide
Chapter 8: Dashboards and Reports
HP EnterpriseView (2.5) Page 189 of 265
User Guide
Chapter 8: Dashboards and Reports
HP EnterpriseView (2.5) Page 190 of 265
Compliance Dashboard
The Compliance Dashboard is a comprehensive dashboard that provides you with general
compliance information identified by your organization for a specific asset. If there is more than one
policy that applies to the asset, then information is displayed for the least compliant policy (based
on the aggregate compliance score on the policy level). For more in-depth information on
compliance of a specific policy, see "Compliance by Policy Dashboard" on the next page.
To open the Compliance Dashboard, click Policy and Compliance >  Compliance Dashboard.
The Compliance Dashboard includes the following components:
l Asset Selector
This component enables you to select an asset and display compliance information on that
asset and its children.
The Organization tab displays the EnterpriseView business model. Expand the business model
to select the asset that you want to display.
The Search tab enables you to search for a name or a partial name of any asset connected to
the business model.
After you have selected the asset, you can collapse the Asset Selector by clicking the
Collapse button. To expand the Asset Selector, click the Expand Asset Selector
button.
l Compliance Summary
This component includes the aggregate compliance score and progress, in addition to the
maturity assessment score and progress for the asset that you have selected. For more
information on the aggregation mechanism, see "Control Scores Aggregation Mechanism" on
page 77.
l First-Level Children Summary
Displays the information provided in the Compliance Summary for the least compliant first
level children of the asset that you selected (up to five are displayed).
To analyze a specific child asset, click the asset in the Asset Name column. The page is
reloaded with information on the asset that you chose.
l Compliance Score Over Time
Asset compliance scores are archived on a weekly basis and when a clear assessment has
been performed. These scores, as well as the most updated score, are displayed in a graph in
order to reveal trends in compliance. If you hover over the round icons in the graph, you can see
User Guide
Chapter 8: Dashboards and Reports
HP EnterpriseView (2.5) Page 191 of 265
the compliance score, the assessment progress, and the date on which it was calculated. If the
scores were archived due to a clear assessment, then the tooltip includes an "Audit
Complete" indication.
For more information on archiving, see the Archive Trend Data section in the HP EnterpriseView
Administration Guide.
l Maturity Score Over Time
Control maturity scores are archived on a weekly basis and when a clear assessment has been
performed. These scores are displayed in a graph in order to reveal trends in compliance. If you
hover over the round icons in the graph, you can see the maturity score, the assessment
progress, and the date on which it was calculated. If the scores were archived due to a clear
assessment, then the tooltip includes an "Audit Complete" indication.
For more information on archiving, see the Archive Trend Data section in the HP EnterpriseView
Administration Guide.
l Policy Compliance
Includes the aggregate score and assessment progress for both asset compliance and control
maturity for each policy that is applied to the asset that you selected.
To analyze a specific policy, click the policy in the Policy Name column. The Compliance by
Policy Dashboard opens and displays information about the policy that you chose.
Compliance by Policy Dashboard
The Compliance by Policy Dashboard is a comprehensive dashboard that provides you with all the
compliance-related information identified by your organization for each policy associated with a
specific asset.
To open the Compliance by Policy Dashboard, click Policy and Compliance >  Compliance by
Policy Dashboard.
The Compliance by Policy Dashboard includes the following components:
l Policy and Asset Selector
This component enables you to select an asset and one of the policies that applies to it and
display compliance information on that asset and its children.
You must first select a policy from the policy list.
The Organization tab displays the EnterpriseView business model. Expand the business model
to select the asset that you want to display.
User Guide
Chapter 8: Dashboards and Reports
HP EnterpriseView (2.5) Page 192 of 265
The Search tab enables you to search for a name or a partial name of any asset connected to
the business model.
After you have selected the asset, you can collapse the Policy and Asset Selector by clicking
the Collapse button. To expand the Policy and Asset Selector, click the Expand Policy
and Asset Selector button.
l Compliance Summary
This component includes the aggregate compliance score and progress,and the maturity
assessment score and progress for the asset that you have selected, in relationship to the policy
that you have selected.
To analyze the policy assessment of specific asset, click Compliance or Maturity. The Policy
Assessment page opens and displays information on the compliance assessment or maturity
assessment of the asset that you selected.
For more information on the aggregation mechanism, see "Control Scores Aggregation
Mechanism" on page 77.
l First-Level Children Summary
Displays the information provided in the Compliance Summary for the least compliant first
level children of the asset that you selected (up to five are displayed).
To analyze a specific child asset, click the asset in the Asset Name column. The page is
reloaded with information on the asset that you chose.
l P5 Score Breakdown
A breakdown of the aggregate score of P5 control maturity factors of the asset and the policy
that you selected.
The graph displays only P5 control maturity factors that have been assessed.
l Maturity Score Over Time
Control maturity scores are archived on a weekly basis and when a clear assessment has been
performed. These scores are displayed in a graph in order to reveal trends in compliance. If you
hover over the round icons in the graph, you can see the exact maturity score, the assessment
progress, and the date on which it was calculated. If the scores were archived due to a clear
assessment, then the tooltip includes an "Audit Complete" indication.
For more information on archiving, see the Archive Trend Data section in the HP EnterpriseView
Administration Guide.
l Compliance Score Over Time
User Guide
Chapter 8: Dashboards and Reports
HP EnterpriseView (2.5) Page 193 of 265
Asset compliance scores are archived on a weekly basis and when a clear assessment has
been performed. These scores, as well as the most updated score, are displayed in a graph in
order to reveal trends in compliance. If you hover over the round icons in the graph, you can see
the exact compliance score, the assessment progress, and the date on which it was calculated.
If the scores were archived due to a clear assessment, then the tooltip includes an "Audit
Complete" indication.
l Score Details
The aggregate maturity and compliance scores on the security category level. For more
information on the aggregation mechanism, see "Control Scores Aggregation Mechanism" on
page 77.
Policy Compliance Map
The Policy Compliance Map enables you to view all of the policies and their security categories that
are applied to a specific asset along with their assessment information, in a graphic view.
To open the Policy Compliance Map, click Policy and Compliance > Compliance Map. The
different areas and the functionalities available in each area are described in the following sections.
For information on the EnterpriseView toolbar, see "Toolbar Description" on page 17.
Left Pane (Asset Selector)
UI Element Description
Organization tab The Organization tab displays the EnterpriseView business model.
Expand the business model and select the asset that you want to view.
Search tab You can search for a name or a partial name of any asset connected to
the business model.
Map Area
The Policy Compliance Map area has two tabs. The Compliance tab displays compliance
assessment information and the Maturity tab displays control maturity information. Select that tab
that has the information you require.
The policy and security categories are displayed according to their hierarchy, in a circular layout,
each represented by an icon. Each icon includes the following information:
l Policy or security category name
l Control maturity/compliance score
l Assessment progress (provides a visual indication of how much the policy element is assessed)
User Guide
Chapter 8: Dashboards and Reports
HP EnterpriseView (2.5) Page 194 of 265
The graph area also includes the following functionality and information.
UI Element Description
Optimize Layout
Refreshes the layout of the business model in the graph.
Fit to Window
Resizes and displays the entire business model in the Graph Area.
Zoom in/zoom out business model.
<Score Range> The score range for a specific policy element:
High score
Medium score
Low score
The ranges are determined in "Configure Compliance and Maturity Score
Ranges" on page 63
Mini-map
When an asset has multiple policies/security categories applied to it and is larger than the map
area, you can navigate it by clicking and dragging in the Mini-map area. To expand or collapse the
mini-map, click the Expand/Collapse button.
Vulnerability Dashboard
The Vulnerability Dashboard provides you with an overview of your organization's vulnerability
state for a specific asset and its children.
To open the Vulnerability Dashboard, click Vulnerabilities > Vulnerability Dashboard.
User Guide
Chapter 8: Dashboards and Reports
HP EnterpriseView (2.5) Page 195 of 265
The Vulnerability Dashboard includes the following components:
l Asset Selector
This component enables you to select the asset that you want to display in the Vulnerability
Dashboard.
The Organization tab displays the EnterpriseView business model. Expand the business model
to select the asset that you want to display.
The Search tab enables you to search for a name or a partial name of any asset in
EnterpriseView, connected to the business model.
After you have selected the asset, you can collapse the Asset Selector by clicking the
Collapse button. To expand the Asset Selector, click the Expand Asset Selector
button.
Vulnerability Summary
This component includes the aggregate asset vulnerability score for the asset that you selected.
For more information on asset vulnerability score aggregation, see "Asset Vulnerability Score
Aggregation Mechanism" on page 147. It also displays the percentage of vulnerabilities that
have not been handled yet out of all the open vulnerabilities that belong to this asset and its
children.
To analyze the aggregate asset vulnerability score, click the score. The Vulnerability
Management page opens, displaying vulnerability information for the asset that you have
chosen.
l First-Level Children Summary
Displays the following information for the most vulnerable first level children of the asset that
you selected (up to five are displayed):
n Aggregate asset vulnerability score.
n The number of open vulnerabilities and the percentage of open vulnerabilities that have not
been handled yet, meaning, with a remediation status of New or Reopened.
To analyze a specific child asset, click the asset in the Asset Name column. The page is
reloaded with information on the asset that you chose.
l Open Vulnerabilities by Type
Displays a breakdown of all the open vulnerabilities that are attached to the asset that you have
selected or to any of its children, according to their type.
User Guide
Chapter 8: Dashboards and Reports
HP EnterpriseView (2.5) Page 196 of 265
l Vulnerabilities with the Highest Scores
Displays the vulnerabilities with the highest scores that affect the asset that you have selected,
meaning that they are either attached directly to the asset or to the asset's children. Each record
represents a vulnerability (ID).
The Assets Impacted column displays the number of assets that this vulnerability (open or
closed) affects, either by being directly attached to the asset or by being attached to a child
asset. The percentage of open vulnerabilities is displayed in parenthesis.
l Aggregate Vulnerability Score Over Time
Aggregate vulnerability scores are archived on a weekly basis. These scores, as well as the
most updated score, are displayed in a graph in order to reveal trends in vulnerability scores. If
you hover over the round icons in the graph, you can see the exact vulnerability score and the
date on which it was calculated.
For more information on archiving, see the Archive Trend Data section in the HP EnterpriseView
Administration Guide.
l Number of Open Vulnerabilities Over Time
The number of open vulnerabilities are archived on a weekly basis. These scores, as well as the
most updated score, are displayed in a graph in order to reveal trends in risk. If you hover over
the round icons in the graph, you can see the exact risk score and the date on which it was
calculated.
For more information on archiving, see the Archive Trend Data section in the HP EnterpriseView
Administration Guide.
Task Management Dashboard
The Task Management Dashboard is a comprehensive dashboard that provides you with
information on the status of the workflows in EnterpriseView. For more information on task
management, see "Task Management" on page 238.
To open the Task Management Dashboard, click Executive View > Task Management
Dashboard.
l Workflows in Progress
This component displays a table of the workflows with the nearest due date. This information
allows you to quickly identify the workflows that require your immediate attention.
l Number of Overdue Completed Workflows by Template
User Guide
Chapter 8: Dashboards and Reports
HP EnterpriseView (2.5) Page 197 of 265
This component displays the number of workflows that have not been completed on time
according to their template. This information enables you to identify problematic processes and
handle them accordingly.
l Task Management KPI
A Key Performance Indicator (KPI) that indicates the percentage of workflows that have been
completed by the workflow due date.
l Due Date Breakdown
A breakdown of all workflows that are in progress according to their due date.
n Overdue:If the due date of the workflow has passed.
n Approaching: If the workflow due date is in seven days or less.
n Future: If the workflow due date is in more than seven days.
User Guide
Chapter 8: Dashboards and Reports
HP EnterpriseView (2.5) Page 198 of 265
EnterpriseView Universe
In BusinessObjects, a universe is an abstraction of a data source that contains data in non-
technical terms with which users can create queries and run them against a database. These
queries are then used to perform data analysis and create reports using entities in the universe
called objects. For more information, see BusinessObjects documentation. The EnterpriseView
system includes an EnterpriseView universe that contains the classes and objects described in the
following tables. You can use these objects to create a customized report, as described in Create a
Report Using SAP BusinessObjects WebIntelligence in the HP EnterpriseView Administration
Guide.
Asset
An asset is an entity that represents a physical or logical resource in the system. For example,
assets can represent hardware, software, services, or business units.
Object Description
Asset ID The unique ID of the asset.
Asset Category The category of the asset. Includes: Organization, Location,
Business, IP, Infrastructure Elements, Running Software. For
more information, see "Manage Asset Types" on page 21.
Asset Name The name of the asset.
Asset Type The asset type is a subset of the asset category.
Asset Description Additional information on the asset.
Business Value A numeric, monetary value.
Criticality Level A numeric index, between 0 and 10, indicating the severity of a
potential catastrophe and the probability of its occurrence.
The default criticality level of all assets is 1.
The criticality level of an asset affects the weight of its scores
when policy assessment aggregation, risk aggregation and
vulnerability score aggregation is done. For more information,
see "Weights and Criticality Level" on page 83.
Latitude Geographical coordinates of the asset's location.
Longitude Geographical coordinates of the asset's location.
Address Street address of the asset.
ZIP Code Asset location ZIP code.
City City of the asset.
User Guide
Chapter 8: Dashboards and Reports
HP EnterpriseView (2.5) Page 199 of 265
Object Description
State State of the asset.
Country Country of the asset.
OS Name The operating system that is installed on the infrastructure
element.
OS Version The version of the operating system that is installed on the
infrastructure element.
Application Name The name of the application.
Application Version The version of the application.
DNS Name The server name as defined in the network DNS.
MAC Address The server MAC address.
IP Address The server IP address.
Role For people or groups, their role in the organization.
Owner The person responsible for the asset and who is contacted in
situations requiring manual intervention. The asset owner is
automatically authorized to work with the asset.
Version For documents, its version.
Purpose The purpose for which the document was created.
Classification The type of document, such as legal or technical.
Release Date The date on which the document was published.
Is Attached Indicates whether the asset is attached to the business model.
Archived Data (subclass of Asset)
This class includes information about scores that are archived in EnterpriseView. A dedicated job is
run periodically to extract and store a snapshot of these scores in the database. This data is used to
create history and trend reports.
Overall Score Archive (subclass of Archived Data)
This class includes archived data about the overall score of the asset.
Object Description
Overall Score The overall score of the asset. For more information on how this
score is calculated, see "Configure Overall Score Formula
Weights" on page 263
Snapshot Time The date and time that the overall score was archived.
User Guide
Chapter 8: Dashboards and Reports
HP EnterpriseView (2.5) Page 200 of 265
Asset Vulnerability Archive (subclass of Archived Data)
This class includes archived data on asset vulnerabilities and aggregate asset vulnerability scores.
Object Description
Aggregated Open
Vulnerability Count
The number of all open vulnerabilities that are attached to an
asset and its direct and indirect children.
Aggregated Asset
Vulnerability Score
See "Aggregate Asset Vulnerability Score" on page 215.
Snapshot Time The date and time that the aggregate asset vulnerability score
was archived.
Risk Assessment Archive (subclass of Archived Data)
This class includes archived data on the risk score of an asset.
Aggregated Score (subclass of Risk Assessment Archive)
This class includes archived data on the aggregate risk score of an asset.
Object Description
Aggregated Asset Risk
Score
See "Aggregate Asset Risk Score" on page 205.
Snapshot Time The date and time that the aggregate risk score was archived.
Asset Risk Score (subclass of Risk Assessment Archive)
This class includes archived data on the residual risk score of an asset.
Object Description
Asset Risk Score The aggregate residual risk score of all of the threats applied to
the asset.
Snapshot Time The date and time that the residual risk score was archived.
Policy Assessment Archive (subclass of Archived Data)
This class includes archived data on the maturity and compliance score of an asset.
Asset Score Archive (subclass of Policy Assessment Archive)
This class includes archived data on the aggregate maturity and compliance score of an asset on
the business model level.
Object Description
Snapshot Time The date and time that the maturity and compliance data were
archived.
User Guide
Chapter 8: Dashboards and Reports
HP EnterpriseView (2.5) Page 201 of 265
Object Description
Compliance Score Indicates how compliant the asset is with the control.
Measured as a percent.
Compliance Score Severity Low, Medium or High, depending on the score range.
Compliance Progress The percentage of overall asset compliance with a policy.
Maturity Score The evolutionary state of a control when it is applied to a specific
asset, comprised by the weighted average of five
factors: People, Procedure, Process, Product, and Proof (also
known in EnterpriseView as P5 maturity factors).
Maturity Score Severity Low, Medium or High, depending on the score range.
Maturity Progress The percentage of the overall control maturity within a policy, for
a specific asset.
Policy Score Archive (subclass of Policy Assessment Archive)
This class includes archived data on the aggregate maturity and compliance score of an asset on
the policy level.
Object Description
Policy ID The unique ID of the policy.
Snapshot Time The date and time that the maturity and compliance data were
archived.
Compliance Score Indicates how compliant the asset is with the control.
Measured as a percent.
Compliance Score Severity Low, Medium or High, depending on the score range.
Compliance Progress The percentage of overall asset compliance with a policy.
Maturity Score The evolutionary state of a control when it is applied to a specific
asset, comprised by the weighted average of five
factors: People, Procedure, Process, Product, and Proof (also
known in EnterpriseView as P5 maturity factors).
Maturity Score Severity Low, Medium or High, depending on the score range.
Maturity Progress The percentage of the overall control maturity within a policy, for
a specific asset.
Policy P5 Score Archive (subclass of Policy Score Archive)
This class includes archived data on P5 maturity scores of an asset on the policy level.
User Guide
Chapter 8: Dashboards and Reports
HP EnterpriseView (2.5) Page 202 of 265
Object Description
People Score Maturity score for People factor.
Procedure Score Maturity score for Procedure factor.
Process Score Maturity score for Process factor.
Product Score Maturity score for Product factor.
Proof Score Maturity score for Proof factor.
External Risk Factor Archive (Subclass of Archived Data)
This class includes archived data on the score and aggregate score for and external risk factor of an
asset.
Aggregated Asset External Risk Factor Archive (subclass of External Risk
Factor Archive)
This class includes archived data on the aggregate score for and external risk factor of an asset.
Object Description
External Risk Factor ID The unique ID of the external risk factor.
Aggregated Asset External
Risk Factor Score
The aggregate score of the external risk factor for a specific
asset.
Snapshot Time If the risk information is from a CSV file, then this is the date and
time from the file. If not, then it is the date of the import.
Asset External Risk Factor Archive (subclass of Archived Data)
This class includes archived data on the score of an external risk factor of an asset.
Object Description
External Risk Factor ID The unique ID of the external risk factor.
Rank Snapshot Time by
Asset and Risk Factor
Use this object to sort combinations of Asset IDs and Risk
Factor IDs according to their snapshot time. The records are
displayed in descending order (from the most recent date to the
oldest date).
Current Score Duration
(Days)
The number of days that an asset has a certain external risk
factor score (without change).
Asset External Risk Factor
Score
The score of the external risk factor for a specific asset.
User Guide
Chapter 8: Dashboards and Reports
HP EnterpriseView (2.5) Page 203 of 265
Object Description
Asset External Risk Factor
Previous Score
The previous score of the external risk factor for a specific asset.
Snapshot Time If the risk information is from a CSV file, then this is the date and
time from the file. If not, then it is the date of the import.
Asset Source (subclass of Asset)
The origin of the asset.
Object Description
Source ID The unique ID of the source.
Source Name l If assets are created in EnterpriseView, then the source name
is empty.
l If assets are imported from an external asset repository, then
the source name is the same as the connector name defined
in the Configuration module.
l For the Organization asset the source name is System.
External ID The ID of the asset in the source (such as UCMDB and ArcSight
ESM).
Overall Asset Score (subclass of Asset)
Object Description
Overall
Asset
Score
The overall asset score is composed of the aggregate scores of all risk factors.
The following formula is used for calculating the overall asset score:
normalized aggregated risk factor scores weight
weights
∑( * )
∑
Risk Assessment (subclass of Asset)
The process of attaching threats to assets, evaluating the likelihood of their occurrence, and
estimating the potential impact.
Object Description
Asset Risk Score The aggregate residual risk score of all of the threats applied to
the asset.
User Guide
Chapter 8: Dashboards and Reports
HP EnterpriseView (2.5) Page 204 of 265
Object Description
Asset Risk Score Severity The severity level of the risk on an asset, expressed as one of
the following values:  Low, Medium, or High. This value depends
on the risk score ranges defined.
Aggregate Asset Risk Score Generally defined as the weighted average of aggregate risk
scores of the children of an asset, but depends on the calculation
method configured. For more information, see "Risk Score
Aggregation Mechanism" on page 110.
Associated Category (subclass of Risk Assessment)
An associated category is a category in a threat that is applied to an asset.
Object Description
Category ID The unique ID of the category.
Category Weight A numeric value between 0 and 100, associated with a specific
asset. Is used when calculating the asset risk score.
Category Risk Score The weighted average of all actor scores.
Actor Score Actor Weight
Actor Weights
∑( * )
∑( )
For more information, see "Residual Risk Score Calculation" on
page 112.
Associated Actor (subclass of Associated Category)
An associated actor is an actor in a threat that is applied to an asset.
An actor is a potential initiator of a violation of the security requirements (confidentiality, integrity,
availability) of an asset in your organization.
Object Description
Actor ID The unique ID of the actor.
Actor Weight A numeric value between 0 and 100, associated with a specific
asset. Is used when calculating the category risk score.
Actor Risk Score The actor receives the score of the threat scenario (impact) with
the highest risk.
For more information, see "Residual Risk Score Calculation" on
page 112.
Impact (subclass of Associated Actor)
The severity of an event, if it occurred.
User Guide
Chapter 8: Dashboards and Reports
HP EnterpriseView (2.5) Page 205 of 265
Object Description
Operation ID The unique ID of the operation.
Impact Description Notes and comments used to document the risk assessment
process.
Risk Status One of the following values:
l Not Assessed
l Assessed
l Treatment in Progress
l Treatment Completed
Risk Tolerance Level The maximum level of risk exposure that you are willing to
accept for an asset in a threat scenario.
Impact Score The impact score is a calculation of all the values of the impact
areas. For information on how this score is calculated, see
"Impact Score Calculation" on page 112.
Inherent Risk Score The risk to an asset, for a specific threat scenario, in the
absence of any actions you might take to alter either the
likelihood or impact. It is calculated as the impact score
multiplied by the probability.
Probability The probability that a threat will occur on a specific asset. A
number between 0 and 1.
Residual Risk Score The risk that remains after you have attempted to mitigate the
Inherent Risk.
Last Updated The last date and time on which the probability values, impact
area values, or both were updated.
Treatment (subclass of Impact)
This class includes risk score after the risk has been treated.
User Guide
Chapter 8: Dashboards and Reports
HP EnterpriseView (2.5) Page 206 of 265
Object Description
Treated Impact Score See "EnterpriseView Universe" on page 199.
Before you begin treatment, the treated impact score is empty.
After you begin treatment, the default score is the same as the
impact score calculated during the assessment process.
After you carry out your treatment plan, and you modify the
impact areas to reflect the reduced risk, then a new impact score
is calculated.
Treated Probability See "EnterpriseView Universe" on page 199.
Before you begin treatment, the treated probability is empty.
After you begin treatment, the default treated probability is the
same as the probability calculated during the assessment
process.
After you carry out your treatment plan, you can manually modify
the probability to reflect the reduced risk.
Adjusted Probability The adjusted probability is the treated probability after it has been
reduced or increased by control compliance scores.
Residual Risk Score The residual risk score is the risk that remains after you have
attempted to mitigate the inherent risk. It is calculated as the
treated impact score multiplied by the adjusted probability
(Residual Score = Treated Impact Score X Adjusted
Probability).
If there is no treatment, it is calculated by the assessment
impact score multiplied by the adjusted probability.
Treatment method (subclass of Treatment)
This class includes information about the methods used to treat the risk.
Object Description
Type The type of method used to handle the risk: Mitigation,
Acceptance, Transference, Deferral, or Avoidance.
Description The description entered for each treatment activity.
Expiration Date/Due Date l Expiration Date: For all other treatment methods, the date on
which the treatment activity is no longer valid and the
treatment plan must be reevaluated.
l Due Date: If the treatment method is mitigation, then the date
on which the mitigation activity must be completed.
User Guide
Chapter 8: Dashboards and Reports
HP EnterpriseView (2.5) Page 207 of 265
Object Description
Reason The reason for choosing the treatment method.
Not applicable to all treatment methods.
Status The status of the treatment activity.
Not applicable to all treatment methods.
Action Plan A step by step description of the actions that should be carried
out for this treatment activity.
Not applicable to all treatment methods.
Resources The resources required for handling the risk.
Not applicable to all treatment methods.
Budget/Cost The budget or the cost of handling the risk.
Not applicable to all treatment methods.
Treatment Impact Area values (subclass of Treatment)
A treatment impact area value can be Low, Medium, or High.
Object Description
Impact Area ID The unique ID of the impact area.
Impact value Low, Medium, or High
Impact Area Value (subclass of Impact)
An impact area value can be Low, Medium, or High.
Object Description
Impact Area ID The unique ID of the impact area.
Impact value Low, Medium, or High
SoA (subclass of Asset)
The Statement of Applicability (SoA) identifies the controls chosen for the assets in the
organization.
Policy - SoA (subclass of SoA)
The policies that include controls are applied to an asset.
Object Description
Policy ID The unique ID of the policy.
User Guide
Chapter 8: Dashboards and Reports
HP EnterpriseView (2.5) Page 208 of 265
Policy Security Category - SoA (subclass of Policy - SoA)
The policy security categories that include controls that are applied to an asset.
Object Description
Policy Security Category ID The unique ID of the policy security category.
Not Applied Controls Count The number of controls for a specific security category that are
not applied to an asset.
Applied Controls Count The number of controls for a specific security category that are
applied to an asset.
Control - SoA (subclass of Policy Security Category - SoA)
The controls that are applied to an asset.
Object Description
Control ID The unique ID of the control.
Is Control Applied Indicates whether the control is applied to an asset.
Assignment Type Indicates one of the following values for a control that is applied
to an asset:
l Inherited: From a parent asset.
l Inheritance Exception: Control applicability has been
overridden.
l Applied Manually: A regular control assignment.
Inherited From Asset (subclass of Control - SoA)
Controls that are inherited from a parent asset.
Object Description
Asset ID The unique ID of the parent asset.
Asset Category The category of the parent asset.
Asset Name The name of the parent asset.
Asset Type The type of the parent asset.
Policy Assessment (subclass of Asset)
The process of assessing policy compliance and control maturity for all assets that comprise your
organization's business model.
User Guide
Chapter 8: Dashboards and Reports
HP EnterpriseView (2.5) Page 209 of 265
Asset Scores (subclass of Policy Assessment)
Scores of assets that have been assessed.
Object Description
Compliance Score Indicates how compliant the asset is with the control.
Measured as a percent.
Compliance Progress The percentage of overall asset compliance with a policy.
Compliance Score Severity Low, Medium or High, depending on the score range, determined
in Settings.
Maturity Score The evolutionary state of a control when it is applied to a specific
asset, comprised by the weighted average of five
factors: People, Procedure, Process, Product, and Proof (also
known in EnterpriseView as P5 maturity factors).
Maturity Progress The percentage of the overall control maturity within a policy, for
a specific asset.
Maturity Score Severity Low, Medium or High, depending on the score range, determined
in Settings.
Policy Scores (subclass of Asset Scores)
Scores of an asset that has been assessed for a specific policy.
Object Description
Policy ID The unique ID of the policy.
Compliance Score Indicates how compliant the asset is with the policy.
Measured as a percent.
Compliance Score Severity Low, Medium or High, depending on the score range, determined
in Settings.
Compliance Progress The percentage of overall asset compliance with a policy.
Maturity Score The evolutionary state of a policy when it is applied to a specific
asset, comprised by the weighted average of five
factors: People, Procedure, Process, Product, and Proof (also
known in EnterpriseView as P5 maturity factors).
Maturity Score Severity Low, Medium or High, depending on the score range, determined
in Settings.
Maturity Progress The percentage of the overall control maturity within a policy, for
a specific asset.
User Guide
Chapter 8: Dashboards and Reports
HP EnterpriseView (2.5) Page 210 of 265
Policy P5 Scores (subclass of Policy Scores)
Assessment scores on specific control maturity factors aggregate to the policy.
Object Description
People Score Maturity score for People factor.
Procedure Score Maturity score for Procedure factor.
Process Score Maturity score for Process factor.
Product Score Maturity score for Product factor.
Proof Score Maturity score for Proof factor.
Policy Security Category Scores (subclass of Policy Scores)
Scores of an asset that has been assessed for a specific security category.
Object Description
Policy Security Category ID The unique ID of the policy security category.
Compliance Score Indicates how compliant the asset is with the security category.
Measured as a percent.
Compliance Progress The percentage of overall asset compliance with a policy.
Maturity Score The evolutionary state of a control when it is applied to a specific
asset, comprised by the weighted average of five
factors: People, Procedure, Process, Product, and Proof (also
known in EnterpriseView as P5 maturity factors).
Maturity Progress The percentage of the overall control maturity within a policy, for
a specific asset.
Policy Security Category P5 Scores (subclass of Policy Security Category
Scores)
Assessment scores on specific control maturity factors aggregate to the security category.
Object Description
People Score Maturity score for People factor.
Procedure Score Maturity score for Procedure factor.
Process Score Maturity score for Process factor.
Product Score Maturity score for Product factor.
Proof Score Maturity score for Proof factor.
User Guide
Chapter 8: Dashboards and Reports
HP EnterpriseView (2.5) Page 211 of 265
Control Audit Data (subclass of Policy Security Category Scores)
Information on a specific assessment.
Object Description
Control ID The unique ID of the control.
Implementation Details Details on how the control was implemented.
Control Notes (subclass of Control Audit Data)
Object Description
Note ID The unique ID of the note.
Note Time The date and time on which the note was created.
Note Text Any type of additional information related to the assessment.
Control Scores (subclass of Control Audit Data)
Assessment scores on a specific control.
Object Description
Compliance Score Indicates how compliant the asset is with the control.
Measured as a percent.
Compliance Score Severity Low, Medium or High, depending on the score range, determined
in Settings.
Compliance Progress The percentage of overall asset compliance with a policy.
Maturity Score The evolutionary state of a control when it is applied to a specific
asset, comprised by the weighted average of five
factors: People, Procedure, Process, Product, and Proof (also
known in EnterpriseView as P5 maturity factors).
Maturity Score Severity Low, Medium or High, depending on the score range, determined
in Settings.
Maturity Progress The percentage of the overall control maturity within a policy, for
a specific asset.
Compliance Applied
Manually
Indicates that a score was applied manually. It is applied only to
the specific scores that have been changed.
Last Updated The last date and time on which the control compliance and/or
maturity score was updated.
Control P5 Scores (subclass of Control Scores)
Assessment scores on specific control maturity factors.
User Guide
Chapter 8: Dashboards and Reports
HP EnterpriseView (2.5) Page 212 of 265
Object Description
People Score Maturity score for People factor.
People Applied Manually Score for People factor applied manually.
Procedure Score Maturity score for Procedure factor.
Procedure Applied Manually Score for Procedure factor applied manually.
Process Score Maturity score for Process factor.
Process Applied Manually Score for Process factor applied manually.
Product Score Maturity score for Product factor.
Product Applied Manually Score for Product factor applied manually.
Proof Score Maturity score for Proof factor.
Proof Applied Manually Score for Proof factor applied manually.
Policy Compliance (subclass of Asset)
This class enables you to create a policy compliance report for assets on a policy that has not been
directly assessed (Compliant Policy), but are mapped in EnterpriseView to a policy that has been
assessed (Assessed Policy). For more information, see "Policy Mapping" on page 59.
Object Description
Assessed Policy ID The unique ID of the assessed policy.
Assessed Policy Name The unique name of the assessed policy.
Compliant Policy ID The unique ID of the compliant policy.
Compliant Policy Name The unique name of the compliant policy.
Mapped Controls (subclass of Policy Compliance)
This class includes information on mapped control parameters.
Object Description
Assessed Control ID The unique ID of the assessed control.
Assessed Policy Security
Category Paragraph Number
An alphanumeric string that indicates the paragraph number.
Assessed Policy Security
Category Title
The title of the policy security category.
Compliant Control ID The unique ID of the compliant control.
User Guide
Chapter 8: Dashboards and Reports
HP EnterpriseView (2.5) Page 213 of 265
Object Description
Compliant Policy Security
Category Title
The title of the policy security category.
Compliant Policy Security
Category Paragraph Number
An alphanumeric string.
Compliant Policy Security
Category Order Key
Used to display the policy security categories according to their
order in the policy.
Mapped Control Scores (subclass of Mapped Controls)
This class includes information on mapped control scores.
Object Description
Compliance Score Indicates how compliant is the asset with the control.
Measured as a percent.
Compliance Progress The percentage of overall asset compliance with a policy.
Maturity Score The evolutionary state of a control when it is applied to a specific
asset, comprised by the weighted average of five
factors: People, Procedure, Process, Product, and Proof (also
known in EnterpriseView as P5 maturity factors).
Maturity Progress The percentage of the overall control maturity within a policy, for
a specific asset.
Mapped Control P5 Scores (subclass of Mapped Control Scores)
Assessment scores on specific control maturity factors that belong to a mapped control.
Object Description
People Score The maturity score for People factor.
Procedure Score The maturity score for Procedure factor.
Process Score The maturity score for Process factor.
Product Score The maturity score for Product factor.
Proof Score The maturity score for Proof factor.
User Guide
Chapter 8: Dashboards and Reports
HP EnterpriseView (2.5) Page 214 of 265
Asset Vulnerability (subclass of Asset)
This class includes different types of asset vulnerability scores.
Object Description
Asset Vulnerability
Score
The highest score out of all the vulnerability scores of open
vulnerabilities that are associated with the asset.
Aggregate Asset
Vulnerability Score
The highest score of the following:
Asset vulnerability score
Or
m
n
*
AggregatedAssetVulnerabilityScore CriticalityLevel of top Children
CriticalityLevel
∑( * )
∑( )
m=Children Multiplier
n=Maximum Children in Calculation. Sorted primarily by aggregate
asset vulnerability score and secondarily by criticality level.
Aggregate Open Vulnerability
Count
The number of open vulnerabilities for an asset and its children.
Top Open Vulnerabilities (subclass of Asset Vulnerability)
Use this class to create a report that displays the vulnerabilities with the highest scores out of the
vulnerabilities with status Open. Up to 100 vulnerabilities can be displayed.
Object Description
Vulnerability ID The unique ID of the vulnerability.
Max Score The highest score out of all vulnerability occurrence scores.
Asset Count The number of assets with this vulnerability.
Vulnerability Count The number of vulnerability instances.
Asset External Risk Factors (subclass of Asset)
Use this class to create reports on external risk factors. For more information on external risk
factors, see "External Risk Factors" on page 161.
Object Description
External Risk Factor ID The unique ID of the external risk factor.
External Risk Factor
Comment
Additional information to the risk factor score imported from the
external risk source.
User Guide
Chapter 8: Dashboards and Reports
HP EnterpriseView (2.5) Page 215 of 265
Object Description
External Risk Factor Score The score for a specific asset for a risk factor imported from an
external source.
Aggregated External Risk
Factor Score
The aggregate score for a specific asset for a risk factor imported
from an external source.
Snapshot (subclass of Asset External Risk Factors)
This class includes information on external risk factor snapshots.
Object Description
External Risk Factor Score The individual external risk factor score of the asset at the time
the snapshot was captured.
Aggregate External Risk
Factor Score
The aggregate external risk factor score of the asset at the time
the snapshot was captured.
Snapshot Time The date and time on which the snapshot was captured.
Current Score Duration
(Days)
The number of days that an asset has a certain external risk
factor score (without change).
Asset CPE (subclass of Asset)
This class includes information on CPEs that are associated with the assets in the business model.
Object Description
CPE ID The unique ID of the CPE.
CPE Name The name of the CPE is composed of the vendor name, the
product name, and the version of the product, in the following
format: vendor:product:version.
Asset Product (subclass of Asset CPE)
This class includes information on products that are included in the CPE definitions, for CPEs that
are associated with assets in the business model.
Object Description
Product ID The unique ID of the product.
Product Name The name of the product as it appears in the CPE.
Asset Vendor (subclass of Asset Product)
This class includes information on vendors that are included in the CPE definitions, for CPEs that
are associated with assets in the business model.
User Guide
Chapter 8: Dashboards and Reports
HP EnterpriseView (2.5) Page 216 of 265
Object Description
Vendor ID The unique ID of the vendor.
Vendor Name The name of the vendor as it appears in the CPE.
Asset Children
Use this class to create reports on an asset's children.
Object Description
Parent Asset ID Parent asset unique ID. This asset is the starting point for the
asset hierarchy.
Children (subclass of Asset Children)
Use this class to create reports on an asset's children.
Object Description
Child Asset ID Child asset unique ID.
Hierarchy Level The position of the asset in the hierarchical tree, in reference to
the parent asset (Parent Asset ID object).
Asset Profiling
This class includes information that is relevant to asset properties.
Criticality Level Ranges (subclass of Asset profiling)
This class includes color indication for the criticality level ranges.
Object Description
Medium Criticality level within a medium range is displayed in yellow.
Score below the medium range is displayed in green.
High Criticality level within the high range is displayed in red.
Policies
This class includes all the information that is relevant to active policies.
General Policy Settings (subclass of Policies)
This class includes information on policy settings that is relevant to all policies.
Maturity Score Range (subclass of General Policy Settings)
This class includes color indication for the maturity score ranges.
User Guide
Chapter 8: Dashboards and Reports
HP EnterpriseView (2.5) Page 217 of 265
Object Description
Medium Scores within a medium range are displayed in yellow. Scores
below the medium range are displayed in green.
High Scores within the high range are displayed in red.
Compliance Score Range (subclass of General Policy Settings)
This class includes color indication for the compliance score ranges.
Object Description
Medium Scores within a medium range are displayed in yellow. Scores
below the medium range are displayed in green.
High Scores within the high range are displayed in red.
Policy (subclass of Policies)
This class includes information that is specific to a policy.
A policy includes legal, statutory, regulatory, and contractual requirements to which the
organization is bound.
Object Description
Policy ID The unique ID of the policy.
Policy Name The name of the policy.
Policy Description A description of the policy.
Policy Security Category (subclass of Policy)
A policy security category is group of controls with common characteristics.
Object Description
Policy Security Category ID The unique ID of the policy security category.
Policy Security Category
Paragraph Number
An alphanumeric string.
Policy Security Category
Title
The title of the policy security category.
Policy Security Category
Text
Any additional text explaining the policy security category.
User Guide
Chapter 8: Dashboards and Reports
HP EnterpriseView (2.5) Page 218 of 265
Object Description
Policy Security Category
Level
Policy security categories can be nested. This object indicates
the level of the policy security category in the policy security
category hierarchy.
Policy Security Category
Order Key
Used to display the policy security categories according to their
order in the policy.
Policy Security Category
Controls Count
The number of controls under a specific policy security category.
Policy Security Category Hierarchy (subclass of Policy Security Category)
This class enables you to create a report for a specific security category and is generally used for
drill-down capability.
Object Description
Policy Security Category
Parent ID
The ID of the security category that contains the policy elements
that you want to display.
Policy Security Category
Grandparent ID
The ID of the security category that contains the security
category that contains the policy elements that you want to
display.
Has Children Indicates whether the policy element is the last level in the policy
hierarchy.
Control (subclass of Policy Security Category)
Controls are the guidelines and rules that form the foundation of a policy.
Object Description
Control ID The unique ID of the control.
Control Text Control text.
Control Additional
Information
Control additional information.
Guideline Introduction Guideline introduction.
Guideline Additional Text Guideline additional text.
Control Type One of the following values: Management, Technical, or
Operations.
Control GRC Designation One of the following values: Regulation, Legal Status,
Standards or Threats.
User Guide
Chapter 8: Dashboards and Reports
HP EnterpriseView (2.5) Page 219 of 265
Object Description
Control Purpose One of the following values: Confidentiality, Integrity,
Availability, Audit, or Privacy.
Control Weight A numeric value between 0 and 100. The control weight affects
the aggregation calculation on the policy level. For more
information, see "Weights and Criticality Level" on page 83.
Control Priority One of the following values: Low, Medium, or High.
People Applicable to Control Indicates whether the People control maturity factor is applicable
to a specific control.
Procedure Applicable to
Control
Indicates whether the Procedure control maturity factor is
applicable to a specific control.
Process Applicable to
Control
Indicates whether the Process control maturity factor is
applicable to a specific control.
Product Applicable to Control Indicates whether the Product control maturity factor is
applicable to a specific control.
Proof Applicable to Control Indicates whether the Proof control maturity factor is applicable
to a specific control.
Control Guidelines (subclass of Control)
Guidelines or rules of the control.
Object Description
Guideline ID The unique ID of the guideline.
Guideline Text Guideline text.
Guideline Order Key Used to display the guidelines according to their order in the
control.
Tag (subclass of Controls Guidelines)
Short descriptive texts that are applied to guidelines.
Object Description
Tag ID The unique ID of the tag.
Tag Name The tag name.
Control Template (subclass of Policy)
This class enables you to create a report that displays only the objects that are in the control
template.
User Guide
Chapter 8: Dashboards and Reports
HP EnterpriseView (2.5) Page 220 of 265
Object Description
Control Text in Template Indicates whether this parameter is in the template.
Control Additional
Information in Template
Indicates whether this parameter is in the template.
Control Guidelines in
Template
Indicates whether this parameter is in the template.
People in Template Indicates whether this parameter is in the template.
Procedure in Template Indicates whether this parameter is in the template.
Product in Template Indicates whether this parameter is in the template.
Process in Template Indicates whether this parameter is in the template.
Proof in template Indicates whether this parameter is in the template.
Guideline Introduction in
Template
Indicates whether this parameter is in the template.
Guideline Additional Text in
Template
Indicates whether this parameter is in the template.
Control Type in Template Indicates whether this parameter is in the template.
Control GRC Designation in
Template
Indicates whether this parameter is in the template.
Control Purpose in Template Indicates whether this parameter is in the template.
Control Weight in Template Indicates whether this parameter is in the template.
Control Priority in Template Indicates whether this parameter is in the template.
People Weight The weight applied to this maturity factor.
Procedure Weight The weight applied to this maturity factor.
Process Weight The weight applied to this maturity factor.
Product Weight The weight applied to this maturity factor.
Proof Weight The weight applied to this maturity factor.
Attachments Attachments related to this control.
Policy Mapping
This class enables you to create a report that displays mappings between policies.
User Guide
Chapter 8: Dashboards and Reports
HP EnterpriseView (2.5) Page 221 of 265
Object Description
Source Policy ID The unique ID of the source policy.
Source Policy Name The name of the source policy.
Target Policy ID The unique ID of the target policy.
Target Policy Name The name of the target policy.
Is Target policy Active Indicates whether the target policy is active in EnterpriseView.
For more information, see "Activate a Policy" on page 47.
Policy Mapped Controls (subclass of Policies)
This class includes information on the mapped source and target controls.
Object Description
Source Control ID The unique ID of the control in the source policy.
Source Policy Security
Category Paragraph Number
The source policy security category paragraph number.
Source Policy Security
Category Title
The source policy security category title.
Target Control ID The unique ID of the control in the target policy.
Target Control Text The control text in the target control.
Target Policy Security
Category Paragraph Number
The target policy security category paragraph number.
Target Policy Security
Category Title
The target policy security category title.
Vulnerability
A vulnerability is a flaw or a weakness in the software (in the network layer or the application layer)
 or a system configuration issue that can be exploited by an attacker and used to gain access to a
system or a network.
Object Description
Count (Distinct Vulnerability
ID)
Counts vulnerability IDs. This means that if two records have the
same vulnerability ID, then they will count as one. This object
only works when you query a table that has an Vulnerability
ID field.
User Guide
Chapter 8: Dashboards and Reports
HP EnterpriseView (2.5) Page 222 of 265
Object Description
Vulnerability ID A common classification ID. This ID can be defined in the
vulnerability dictionary or not.
It can be a CVE, CCE, or identification provided by the scanner.
It is displayed in the User Interface.
Vulnerability Internal ID The unique ID of the vulnerability. It is not displayed in the User
Interface.
Vulnerability Title A descriptive name of the vulnerability.
Vulnerability Type Network, Application, and Configuration
Vulnerability Score The vulnerability score is the severity level of the vulnerability
expressed as a number between 0 and 10. It is calculated by
EnterpriseView labs.
The scoring system varies between the different vulnerability
types:
l Network and Web application vulnerabilities
The score is CVSS version 2.0 compliant. For more
information, see "Common Vulnerability Scoring System" on
page 131. Scores of new vulnerabilities that do not exist in the
dictionary are imported from the scanner and are normalized
to the EnterpriseView scoring system.
l Configuration vulnerabilities
 The score is determined according to the check results:
n Passed (the configuration is correct): the score is 0.
n Failed (the configuration is incorrect): the score is 10.
n Unknown (there is not enough information to determine if
the check failed or passed): the score is 5.
Vulnerability Details A detailed description of the vulnerability.
Vulnerability Status Name Indicates the values Open or Closed.
Vulnerability Remediation
Name
Indicates the values New, Passed, Reopened, Assigned,
Awaiting Remediation, Not an Issue, Awaiting Verification,
Resolved, or Automatically Closed.
User Guide
Chapter 8: Dashboards and Reports
HP EnterpriseView (2.5) Page 223 of 265
Object Description
Vulnerability Last Update On The last time that one of the properties of the vulnerability
occurrence was changed. This property is not updated if a
vulnerability is attached or detached from an asset or if a new
note has been added.
Vulnerability Last Update On
(Days)
The number of days since the vulnerability was last updated.
Vulnerability Last Reported
Status
Relevant only for configuration vulnerabilities. Typically,
scanners provide a status for configuration vulnerability checks.
Common values include: Pass, Fixed, Error, Unknown, Not
Applicable, Not Checked, not Selected, and Warning. If a
scanner provides such a status, then it is displayed as this
property. If the last scan status is Passed or Fixed, then the
remediation status is Passed.
Vulnerability Location The location displayed depends on the type of the vulnerability.
Each type has the following location formats:
l Network and configuration: <Hostname>:<Network Port>.
Hostname and IP address are interchangeable.
l Application: <Normalized URI>:<Vulnerable Parameter>.
The original URI indicating the location of the vulnerability is
normalized by the Vulnerability Import Job. The vulnerable
parameter is isolated from the query string passed in the
original URI.
Vulnerability Number of
Times Reported
The number of times that a specific vulnerability is reported from
various sources.
Vulnerability First Reported
On
The date and time of the first report of the vulnerability, as
recorded by the external source from which the vulnerability was
imported.
Vulnerability Last Reported
On
The date and time of the last report of the vulnerability, as
recorded by the external source from which the vulnerability was
imported.
Archived Vulnerability (subclass of Vulnerability)
This class includes information on archived vulnerabilities. Only network and application
vulnerabilities are archived.
User Guide
Chapter 8: Dashboards and Reports
HP EnterpriseView (2.5) Page 224 of 265
Object Description
Asset ID The ID of the asset that the vulnerability is attached to.
Archived Vulnerability ID A common classification ID. This ID can be defined in the
vulnerability dictionary or not.
It can be a CVE or identification provided by the scanner. It is
displayed in the User Interface.
Archived Vulnerability
Internal ID
The unique ID of the vulnerability. It is not displayed in the User
Interface.
Archived Vulnerability Title A short description of the vulnerability.
Archived Vulnerability Type Network and Application
Archived Vulnerability Details A detailed description of the vulnerability.
Archived Vulnerability Score For network and application vulnerabilities.
The vulnerability score is the severity level of the vulnerability
expressed as a number between 0 and 10. It is calculated by
EnterpriseView labs.
The score is CVSS version 2.0 compliant. For more information,
see "Common Vulnerability Scoring System" on page 131.
Scores of new vulnerabilities that do not exist in the dictionary
are imported from the scanner and are normalized to the
EnterpriseView scoring system.
Archived Vulnerability
Location
The location displayed depends on the type of the vulnerability.
Each type has the following location formats:
l Network and configuration: <Hostname>:<Network Port>.
Hostname and IP address are interchangeable.
l Application: <Normalized URI>:<Vulnerable Parameter>.
The original URI indicating the location of the vulnerability is
normalized by the Vulnerability Import Job. The vulnerable
parameter is isolated from the query string passed in the
original URI.
Archived Vulnerability
Number of Times Reported
The number of times that a specific vulnerability is reported from
various sources.
Archived Vulnerability First
Reported On
The date and time of the first report of the vulnerability, as
recorded by the external source from which the vulnerability was
imported.
User Guide
Chapter 8: Dashboards and Reports
HP EnterpriseView (2.5) Page 225 of 265
Object Description
Archived Vulnerability Last
Reported On
The date and time of the last report of the vulnerability, as
recorded by the external source from which the vulnerability was
imported.
Archived Vulnerability Status
Name
Indicates the values Open or Closed.
Archived Vulnerability
Remediation Name
Indicates the values New, Passed, Reopened, Assigned,
Awaiting Remediation, Not an Issue, Awaiting Verification,
Resolved, or Automatically Closed.
Archived Vulnerability
Snapshot Time
The date and time that the vulnerability was archived.
Archived Vulnerability
Groups
Vulnerabilities are grouped according to different vulnerability
categories. EnterpriseView adopted the Common Weakness
Enumeration (CWE) system for identifying most vulnerability
groups. Other vulnerability groups are internal and can be
identified by an "EVG" prefix.
Archived Vulnerability
Solution
A recommended solution for fixing the vulnerability, as provided
from the vulnerability assessment tool.
Archived Vulnerability
Parameter
Relevant only for application vulnerabilities.
The parameter from the URI that is used to exploit the
vulnerability. For example, User ID can be the vulnerable
parameter in case of an SQL injection vulnerability.
Archived Vulnerability Host The host where the vulnerability was found.
Archived Vulnerability Port The port where the vulnerability was found.
Archived Vulnerability IP Relevant for network vulnerabilities.
IP address where the vulnerability was found.
Archived Vulnerability MAC Relevant for network vulnerabilities.
MAC address where the vulnerability was found.
Archived Vulnerability
Related CVEs
The CVE identifiers of related vulnerabilities. Defined by
EnterpriseView labs.
Archived Vulnerability
References
The identifiers defined by various sources for vulnerabilities that
are similar or related to the vulnerability defined in the
EnterpriseView vulnerability dictionary.
User Guide
Chapter 8: Dashboards and Reports
HP EnterpriseView (2.5) Page 226 of 265
Object Description
Archived Vulnerability Last
Updated On
The last time that one of the properties of the vulnerability
occurrence was changed. This property is not updated if a
vulnerability is attached or detached from an asset or if a new
note has been added.
Archived Vulnerability Note (subclass of Archived Vulnerability)
This class includes information on the notes attached to the vulnerabilities.
Object Description
Vulnerability Note ID The unique ID of the note.
Archived Vulnerability Note
Creation Date
The date and time on which the note was created.
Archived Vulnerability Note
Creator ID
The user ID of the user who added the note.
Archived Vulnerability Note
Creator
The user name of the user who added the note.
Archived Vulnerability Note
Message
The message of the note.
Vulnerability Statuses (subclass of Vulnerability)
This class includes the names and ID of all types of vulnerability statuses.
Vulnerability Status (subclass of Vulnerability Statuses)
This class includes the names and ID for all vulnerability statuses.
Object Description
Vulnerability Status ID The unique ID of the vulnerability status.
Vulnerability Status Name Indicates the values Open or Closed.
Vulnerability Remediation Status (subclass of Vulnerability Statuses)
This class includes the names and ID for all remediation statuses.
Object Description
Vulnerability Remediation
Status ID
The unique ID of the vulnerability remediation status.
Vulnerability Remediation
Status Name
Indicates the values New, Reopened, Assigned, Awaiting
Remediation, Not an Issue, Awaiting Verification,
Resolved, or Automatically Closed.
User Guide
Chapter 8: Dashboards and Reports
HP EnterpriseView (2.5) Page 227 of 265
Vulnerability Score Ranges (subclass of Vulnerability)
This class includes color indication for the vulnerability score ranges.
Object Description
Medium Scores within a medium range are displayed in yellow. Scores
below the medium range are displayed in green.
High Scores within the high range are displayed in red.
Vulnerability Dictionary
This class includes information on vulnerabilities in the vulnerability dictionary.
Object Description
Vulnerability ID The unique ID of the vulnerability.
Vulnerability Type Network, Application, and Configuration
Vulnerability Details A detailed description of the vulnerability.
Vulnerability Title A short description of the vulnerability.
For configuration vulnerabilities, the title and the details are
identical.
Vulnerability Score The vulnerability score is the severity level of the vulnerability
expressed as a number between 0 and 10.
The score of a vulnerability is calculated by EnterpriseView labs.
It is CVSS version 2.0 compliant. For more information, see
"Common Vulnerability Scoring System" on page 131. Scores of
new vulnerabilities that do not exist in the dictionary are imported
from the scanner and are normalized to the EnterpriseView
scoring system.
CPE (subclass of Vulnerability Dictionary)
This class includes information on CPEs that are associated with the vulnerabilities in the
vulnerability dictionary.
Object Description
CPE ID The unique ID of the CPE.
CPE Name The name of the CPE is composed of the vendor name, the
product name, and the version of the product, in the following
format: vendor:product:version.
Product (subclass of CPE)
This class includes information on products that are included in the CPE definitions, for CPEs that
are associated with vulnerabilities in the vulnerability dictionary.
User Guide
Chapter 8: Dashboards and Reports
HP EnterpriseView (2.5) Page 228 of 265
Object Description
Product ID The unique ID of the product.
Product Name The name of the product as it appears in the CPE.
Vendor (subclass of Product)
This class includes information on vendors that are included in the CPE definitions, for CPEs that
are associated with vulnerabilities in the vulnerability dictionary.
Object Description
Vendor ID The unique ID of the vendor.
Vendor Name The name of the vendor as it appears in the CPE.
Threat Library
The threat library includes predefined threats, common to most organizations, in addition to user-
defined threats.
Threat Library Settings (subclass of Threat Library)
This class includes information on threat library settings that are relevant to all threat scenarios.
Probability Ranges (subclass of Threat Library Settings)
This class includes color indication for the probability ranges.
Object Description
Medium Scores within a medium range are displayed in yellow. Scores
below the medium range are displayed in green.
High Scores within the high range are displayed in red.
Risk Score Ranges (subclass of Threat Library Settings)
This class includes color indication for the risk score ranges.
Object Description
Medium Scores within a medium range are displayed in yellow. Scores
below the medium range are displayed in green.
High Scores within the high range are displayed in red.
Impact Area (subclass of Threat Library)
The area or areas in the organization that are affected by a threat on an asset.
User Guide
Chapter 8: Dashboards and Reports
HP EnterpriseView (2.5) Page 229 of 265
Object Description
Impact Area ID The unique ID of the impact area.
Impact Area Name The name of the impact area.
Impact Area Weight A numeric value between 0 and 100.
Category (subclass of Threat Library)
The category of an actor.
Object Description
Category ID The unique ID of the category.
Category Default Weight A numeric value between 0 and 100. The weight of a category
defined on the threat library level.
Category Description Category description.
Category Name Category name.
Actor (subclass of Category)
An actor in the threat library.
An actor is a potential initiator of a violation of the security requirements (confidentiality, integrity,
availability) of an asset in your organization.
Object Description
Actor ID The unique ID of the actor.
Actor Default Weight A numeric value between 0 and 100. The weight of an actor
defined on the threat library level.
Actor Description Actor description.
Actor Name Actor name.
Operation (subclass of Actor)
An operation in the threat library.
An operation is the violation of the security requirements of an asset preformed by an actor.
Object Description
Operation ID The unique ID of the operation.
Operation Description Operation description.
User Guide
Chapter 8: Dashboards and Reports
HP EnterpriseView (2.5) Page 230 of 265
Object Description
Operation Name Operation name.
Operation Information
Security Threat Type
Possible values are Integrity, Confidentiality, or Availability.
Overall Score
This class includes overall score settings.
Overall Score Ranges (subclass of Overall Score)
This class includes color indication for the overall score ranges.
Object Description
Medium Scores within a medium range are displayed in yellow. Scores
below the medium range are displayed in green.
High Scores within the high range are displayed in red.
Overall Score Weights (subclass of Overall Score)
This class includes the weights for all the factors used to calculate the overall asset score. This
value can be edited in Settings > Executive View > Overall Score formula Weights.
Object Description
Risk Weight The weight applied to an asset's aggregate risk score when
calculating the asset's overall score.
Compliance Weight The weight applied to an asset's aggregate compliance score
when calculating the asset's overall score.
Maturity Weight The weight applied to an asset's aggregate control maturity
score when calculating the asset's overall score.
Vulnerability Weight The weight applied to an asset's aggregate vulnerability score
when calculating the asset's overall score.
External Risk Factor Weights (subclass of Overall Score Weights)
This class includes the weights for all the external risk factors used to calculate the overall asset
score . This value can be edited in Settings > Executive View > Overall Score formula Weights
Object Description
External Risk Factor ID The unique ID of the external risk factor.
External Risk Factor Weight The weight applied to an asset's aggregate external risk factor
score when calculating the asset's overall score.
User Guide
Chapter 8: Dashboards and Reports
HP EnterpriseView (2.5) Page 231 of 265
External Risk Factors
General information about the external risk factors and settings.
External Risk Factor (Subclass of External Risk Factors)
Information about an external risk factor.
Object Description
External Risk Factor ID The unique ID of the external risk factor.
External Risk Factor Name The name of the external risk factor as defined in
EnterpriseView.
External Risk Factor
Description
The description of the external risk factor as defined in
EnterpriseView.
External Risk Factor Date The timestamp of the import job.
External Risk Factor KPI ID The unique ID of the KPI of the external risk factor.
External Risk Factor Ranges (Subclass of External Risk Factors)
This class includes external risk factor settings.
Object Description
Medium Scores within a medium range are displayed in yellow. Score
below the medium range are displayed in green or red, depending
on the directionality of the severity.
High Scores within the high range are displayed in red or green,
depending on the directionality of the severity.
Minimum The first number in the score range.
Maximum The last number in the score range.
Precision The number of digits after the decimal point that you want to
display. Limited to five digits.
Lower score is best The directionality of the score severity. For example, a low score
is considered low risk while a high score is considered high risk.
Workflow
This class includes information on workflow templates and tasks.
Object Description
Workflow ID The unique ID of the workflow.
Workflow Name The name of the workflow.
User Guide
Chapter 8: Dashboards and Reports
HP EnterpriseView (2.5) Page 232 of 265
Object Description
Workflow Description The description of the workflow.
Workflow Owner The person responsible for managing the workflow.
Workflow Start Date The date on which the workflow was created. The status of the
workflow is In Progress.
End Date The date on which the workflow is actually completed, meaning
that the last task in the workflow has been completed.
Due Date The expected completion date of the workflow.
Workflow Status Either In Progress or Completed.
Workflow Due Date Status Returns the following values: Overdue, Approaching, Future
Template (Subclass of Workflow)
This class includes information on templates
Object Description
Template ID The unique ID of the template.
Template Name The name of the template.
Task (Subclass of Workflow)
This class includes information on tasks.
Object Description
Task ID The unique ID of the task.
Task Name The name of the task.
Task Description Includes the instructions for carrying out the task.
Task Start Date The date on which the task status is changed from Inactive to In
Progress.
Task Due Date The date on which the task is due and should be completed.
Task End Date The date on which the task is actually completed.
Task Assignee The person responsible for carrying out the task.
Task Group The group of users to which the task belongs.
User Guide
Chapter 8: Dashboards and Reports
HP EnterpriseView (2.5) Page 233 of 265
Object Description
Task Status One of the following values: 
l Inactive: The status of a task that is not active after a
workflow has been created. At this stage, the task is not
available to the assignee. Inactive tasks are accessible only
from the Task Management page, but are not displayed in My
Tasks.
l In Progress: A task receives this status only after its
preceding task is completed. If there is more than one task
before it, then at least one of the preceding tasks must be
completed. Tasks that are in progress are displayed in My
Tasks displayed in the Home page and in the My Tasks
dialog box accessible from the EnterpriseView toolbar. These
tasks need to be carried out by an assignee.
l Completed: The task status is automatically updated to
Completed after the user selects the Complete Task check
box or the Reject or Approve options (for approval tasks) and
clicks Save.
Comments (Subclass of Task)
This class includes information on comments.
Object Description
Comment ID The unique ID of the comment.
Comment Text The comment text.
Comment Author The name of the user who created the comment.
Comment Date The date on which the comment was created.
KPIs
This class includes properties of key performance indicators (KPIs).
Object Description
KPI ID The unique ID of the KPI.
KPI Name The display name of the KPI. This name is displayed as the title
in the KPI component. The KPI name is defined in the
KPI Management page.
User Guide
Chapter 8: Dashboards and Reports
HP EnterpriseView (2.5) Page 234 of 265
Object Description
KPI Description The description of the KPI is displayed in the KPI component.
The KPI parameter can be embedded in the KPI description. The
KPI name is defined in the KPI Management page.
KPI High Threshold A KPI score percentage within the high range is displayed in red.
KPI Medium Threshold A KPI score percentage within a medium range is displayed in
yellow. A KPI score percentage below the medium range is
displayed in green.
KPI Lower is Better The directionality of the score severity. For example, a low score
is considered low risk while a high score is considered high risk.
KPI Parameter The KPI Parameter is a threshold that indicates a desirable or an
undesirable result. For example, in a KPI that displays the
percentage of assets with an overall score higher than 20, then
“20” is the KPI Parameter. In this case, scores that are higher
than 20 are not desirable.
Generic Prompts
This class can be used to easily create a query filter without inputting the prompt value.
Object Description
@KPIPrompt Can be used to create a query filter without the need to input the
value "kpiId".
@CPEPrompt Can be used to create a query filter without the need to input the
value "cpeId".
@AssetPrompt Can be used to create a query filter without the need to input the
value "assetId".
@PolicyPrompt Can be used to create a query filter without the need to input the
value "policyId".
@RiskFactorPrompt Can be used to create a query filter without the need to input the
value "riskFactorId".
Generic Objects
This class includes miscellaneous classes and objects.
Object Description
Current Time The date that the report is generated.
Aggregate Functions (subclass of Generic Objects)
This class includes objects that are used to count entities (such as assets). Using these objects for
User Guide
Chapter 8: Dashboards and Reports
HP EnterpriseView (2.5) Page 235 of 265
counting entities helps reduce performance problems. These objects can be used only within a
query. For example, you can create a query that counts all the assets with asset type IP, but you
cannot use these objects to count all the assets in the system.
Object Description
Count(*) Counts records in a table.
Count(Distinct Asset ID) Counts asset IDs. This means that if two records have the same
asset ID, then they will count as one. This object only works
when you query a table that has an Asset ID field.
Score Severity (subclass of Generic Objects)
This class includes the values for score severity.
Object Description
Score Severity Displays one of the following values: Low, Medium, or High.
Scores Rank (subclass of Generic Objects)
The objects in this class are used to rank asset scores using a weighted average in order to display
"top #" assets in reports. The rank itself is not displayed in the report.
Object Description
Asset Risk Score Rank Used for ranking risk scores.
Aggregated Asset Risk
Score Rank
Used for ranking aggregate risk scores.
Aggregated Asset
Vulnerability Score Rank
Used for ranking aggregate vulnerability scores.
Asset Compliance Score
Rank
Used for ranking compliance scores.
Asset Maturity Score Rank Used for ranking P5 maturity factor scores.
Overall Asset Score Rank Used for ranking the overall asset score.
Asset Vulnerability Score
Rank
Used for ranking the direct asset vulnerability scores.
Vulnerability Score Rank Used for ranking the vulnerability scores.
Aggregated External Risk
Factor Score Rank
Used for ranking the aggregate external risk factor scores.
User Guide
Chapter 8: Dashboards and Reports
HP EnterpriseView (2.5) Page 236 of 265
P5 Names (subclass of Generic Objects)
Use the objects in this class to return the names of the P5 maturity factors to be displayed in a
report.
Object Description
People Indicates that the maturity factor name "People" should be
displayed in the report.
Procedure Indicates that the maturity factor name "Procedure" should be
displayed in the report.
Process Indicates that the maturity factor name "Process" should be
displayed in the report.
Product Indicates that the maturity factor name "Product" should be
displayed in the report.
Proof Indicates that the maturity factor name "Proof" should be
displayed in the report.
Risk Status (subclass of Generic Objects)
This object returns all the risk statuses.
Object Description
Risk Status Returns the following values: Associated to Asset, Assessed,
Treatment in Progress, Treatment Completed.
Workflow Status (subclass of Generic Objects)
This object returns all the workflow due date status.
Object Description
Workflow Due Date Status Returns the following values: Overdue, Approaching, Future.
User Guide
Chapter 8: Dashboards and Reports
HP EnterpriseView (2.5) Page 237 of 265
Chapter 9: Task Management
A workflow is a sequence of connected tasks that produce a final outcome. Tasks are consecutive,
creating a flow in the work process. Each task in the workflow belongs to a group and is assigned to
the individual who is most suitable to perform the task. After a task is complete, the next task
becomes available to the responsible group or individual. For more information on managing tasks,
see "Manage Your Tasks" on page 248.
The Workflow module enables managers to oversee, approve, and follow up on tasks that were not
completed. EnterpriseView provides you with a graphic display of each workflow. The status and
due date of each task are visible on the workflow map. Overdue tasks include an explicit indication.
Example:
Workflows are based on templates. EnterpriseView includes out-of-the-box workflow templates,
such as EnterpriseView Vulnerability Assessment for New Asset. You can create additional
templates that represent the workflows in your organization. For more information on creating
templates, see "Create a Workflow Template" on the next page. You can also edit and delete
workflow templates, as described in "Edit a Workflow Template" on page 243 and "Delete a
Workflow Template from EnterpriseView" on page 244, respectively.
The Workflow module includes filtering capabilities to help you locate your workflows quickly. For
more information on filtering, see "Filter Workflows" on page 255. By default, the list is filtered to
display only workflows that are in progress.
Note: You must be an owner or a stakeholder in order to see a workflow. To edit a workflow
you must have Edit Task Management permissions. Only users with a View All Workflows
permission (such as Workflow Administrator role) can see and edit all the workflows.
Workflows are presented according to the following logic:
l Workflows that are in progress are displayed first and workflows that are completed are
displayed last.
l Out of the workflows that are in progress, the workflows with an earlier due date are displayed
first.
HP EnterpriseView (2.5) Page 238 of 265
l Out of the workflows that are completed, the workflows with the latest end date are displayed
first.
Manage Workflow Templates
EnterpriseView includes out-of-the-box workflow templates, such as EnterpriseView Vulnerability
Assessment for New Asset. You can create additional templates that represent the workflows in
your organization.
Note: Because every task must be assigned to a group, all the tasks in the out-of-the-box
workflow templates are assigned to a group called 'Everyone'. If you are planning to use out-of-
the-box workflow templates, we recommend that you assign the appropriate group to each of
the tasks. For more information on editing a template, see "Edit a Workflow Template" on page
243.
This section includes the following topics:
Create a Workflow Template 239
Upload a Workflow Template to EnterpriseView 243
Edit a Workflow Template 243
Delete a Workflow Template from EnterpriseView 244
Create a Workflow Template
EnterpriseView includes out-of-the-box workflow templates, such as EnterpriseView Vulnerability
Assessment for New Asset. You can create additional templates that represent the workflows in
your organization. You can create workflow templates in Activiti Modeler.
Note: Activiti Modeler works only with Chrome or Firefox browsers; it does not work with
Internet Explorer.
Activiti Modeler includes a set of elements (shapes) that are used to create templates. For more
information, see "Workflow Template Shape Repository" on page 260.
All workflow templates must fulfill the following conditions:
l A template must have a name.
l A template must begin with a start event.
l Each task must have a name.
l All tasks must be of type User.
User Guide
Chapter 9: Task Management
HP EnterpriseView (2.5) Page 239 of 265
l All tasks must be assigned to an EnterpriseView page. When the task is ready to be carried out
by the user, it is displayed on the Home page and on the page assigned to it in the template.
l All tasks must be assigned to a group.
The following diagram is an example of a workflow template.
After you create a template you need to upload it to EnterpriseView in order to use it. For more
information, see "Upload a Workflow Template to EnterpriseView" on page 243.
To create a workflow template
1. Click Task Management > Workflow Management.
2. In the Workflow Management page, click Manage Templates.
3. In the Manage Templates dialog box, click Template Editor.
4. In Activiti Modeler, click New > Business Process Diagram (BPMN 2.0).
5. In the New Process window, expand the Attributes pane.
Note: If required, enable your browser to allow pop-ups.
6. In the Properties pane, under Main Attributes, click in the Name field, and enter a name for
the template.
Note: The template name must be unique. it cannot contain the following characters: - * %
7. In the New Process window, in the Shape Repository, drag the Start Event to the canvas.
8. To create a task, do the following:
User Guide
Chapter 9: Task Management
HP EnterpriseView (2.5) Page 240 of 265
a. From the Shape Repository, drag a Sequence Flow to the canvas and attach it to the
shape before it.
b. From the Shape Repository, drag a User Task to the canvas and attach it to the
Sequence Flow.
c. In the Name field, enter a name. The name of the task should be short and should reflect
the main idea of the task.
d. In the Documentation field, enter a detailed description of the task. This information is
displayed in Description in the task properties.
9. To assign an EnterpriseView page to the task, do the following:
a. Under More Attributes, click in the Properties field, in the Value column.
b. On the Editor for a Complex Type dialog box, click Add.
c. In the Name field, enter page=n, where n is the page ID. For example, if you want to
assign the task to the Vulnerability Management page, enter page=4 (case-sensitive). For
the list of page IDs, see "EnterpriseView Page IDs" on page 259.
d. Click OK.
10. To assign the task to a group, do the following:
a. Under More Attributes, click the Value cell next to Resources, and then click the ellipses
button.
b. On the Editor for a Complex Type dialog box, do the following:
o Click Add.
o In the Type box, select PotentialOwner.
o In the Resource assignment expression box, from the list of groups, select the group
to which you want to assign this task.
o Click OK.
11. Repeat steps 8-11 for each task in the workflow.
12. To create an approval task, follow the instruction in "To create an approval task" on the next
page.
13. Add an end event or end events to your template (optional). The end event indicates that there
are no more tasks. To add an end event, after you have added all the required tasks, click on
the task in the canvas that does not have any tasks after it, and then, from the floating toolbar,
click the End Event button.
User Guide
Chapter 9: Task Management
HP EnterpriseView (2.5) Page 241 of 265
14. To validate the template, click the Check Syntax button. If the template has errors, then a
red cross is displayed next to the problematic area. Hover over the cross icon to see the error
message.
15. Click Save.
16. On the Save dialog box, in the Title box, enter the file name for the template, and then click
Save.
The file name that you enter is the name that will be displayed when you upload the template
into EnterpriseView.
Note: A template name cannot be more than 200 characters and cannot contain any of the
following characters: * _ %
To create an approval task
Note: You can create more than one approval task in a workflow template.
1. Create a user task, as described in the previous procedure, and give it a meaningful name. For
example, "Approve Audit".
2. Click the approval task in the canvas, and then click the Data-based exclusive (XOR)
gateway button.
3. From the gateway, create two outbound sequence flows:
n In case of approval: One leading to the next task in the flow.
n In case of rejection: The second leading to a different task, for example, a task that needs to
be redone.
4. Click the sequence flow that represents the approved flow, and then do the following:
a. In the Properties pane, expand More Attributes.
b. Invent a variable name to use for this specific approval task. The variable must be
alphanumeric. You must use the same variable for the approval flow and for the rejection
flow. The rejection flow variable is precedes by an !.
Note: You cannot use this variable for another approval task; each approval task must
have a unique variable.
c. Click in the Condition expression field, and enter ${<variable>}.
5. Click the sequence flow that represents the rejection flow, and then do the following:
User Guide
Chapter 9: Task Management
HP EnterpriseView (2.5) Page 242 of 265
a. In the Properties pane, expand More Attributes.
b. Click in the Condition expression field, and enter ${!<variable>}.
Upload a Workflow Template to EnterpriseView
You can upload a template created in Activiti Modeler to EnterpriseView.
For more information on creating a template, see "Create a Workflow Template" on page 239.
Note: Before you begin working with a template, you must first validate that it works properly.
After you upload the template, test the template by creating a workflow that is based on it.
Perform all possible workflow scenarios from start to finish in order to verify the template
validity.
To upload a template
1. Click Task Management > Workflow Management.
2. In the Workflow Management window, click Manage Templates.
3. In the Manage Workflow Templates dialog box, click Upload Template.
4. In the Upload Template dialog box, select the file of the template that you want to upload, and
then click Upload.
EnterpriseView validates the template. If the template is not valid, a message is displayed
indicating the problem. To create a valid template, see "Create a Workflow Template" on page
239.
The template is added to the list of templates displayed in the Manage Workflow Templates
dialog box.
5. In the Manage Workflow Templates dialog box, click Close.
Edit a Workflow Template
Editing a workflow template means changing a template in Activiti Modeler, saving it under the
same file name, and reloading it to EnterpriseView.
If you created a workflow and then changed the template, the workflow that is based on the
previous version does not change.
To edit a workflow
1. Click Task Management > Workflow Management.
User Guide
Chapter 9: Task Management
HP EnterpriseView (2.5) Page 243 of 265
2. In the Workflow Management page, click Manage Templates.
3. In the Manage Templates dialog box, click Template Editor.
4. In the Activiti Modeler workspace, click the template that you want to edit.
5. Make the required changes and save the template. For more information on how to edit the
template, see "Create a Workflow Template" on page 239.
Note: EnterpriseView recognizes the template by its name and not by its file name. If you
change the template name, then it will no longer be considered the same template in
EnterpriseView. When you edit a template, we recommend saving it under the same file
name.
6. Upload the updated template to EnterpriseView. For more information, see "Upload a Workflow
Template to EnterpriseView" on the previous page.
Delete a Workflow Template from EnterpriseView
You can delete a template from EnterpriseView as long as there are no workflows based on that
template.
To delete a template
1. Click Task Management > Workflow Management.
2. In the Workflow Management window, click Manage Templates.
3. Select the template from the list, and then click Delete Template.
You can reload the template at any time, as described in "Upload a Workflow Template to
EnterpriseView" on the previous page
Manage Workflows
You can manage workflows in the Workflow Management window.
The workflow life cycle consists of two modes: In Progress and Completed. When they are
created, their status is In Progress and after the last active task in the workflow is completed, their
status changes to Completed.
Each workflow has an owner, but any user with suitable permissions can create, edit, or delete
workflows. For more information on how to create, edit, or delete a workflow, see "Create a New
Workflow" on the next page, "Edit Workflow Properties" on page 247, and "Delete a Workflow" on
page 246, respectively.
User Guide
Chapter 9: Task Management
HP EnterpriseView (2.5) Page 244 of 265
The following figure is an example of a simple workflow created from one of the out-of-the-box
templates (EnterpriseView Policy Review) included in EnterpriseView.
This workflow includes an approval task, meaning that the tasks performed prior to the approval
task, must be approved by a designated user. In this case, the workflow is rejected. This means
that a new Review Policy task is created. The cascading task shape in the workflow map indicates
that there is more than one Review Policy task.
Multiple tasks include the following logic:
l The number at the bottom indicates that one task is in progress. In case of multiple tasks, if
there is at least one task with an in progress status, then the In Progress icon is displayed.
l The due date displayed is the earliest due date of all tasks that are in progress. If all of the tasks
are completed, then the latest due date is displayed.
Create a New Workflow
You can create a workflow based on the templates in EnterpriseView (user-defined or out-of-the-
box). Workflow tasks belong to groups. After a workflow is created, the first task in the workflow
can be assigned to a user or claimed by a user.
To create a workflow
1. Click Task Management > Workflow Management.
2. In the Workflow Management window, click New.
3. In the New Workflow dialog box, select a template from the list.
4. Enter the following information:
User Guide
Chapter 9: Task Management
HP EnterpriseView (2.5) Page 245 of 265
n Name: Enter a meaningful name for the workflow. The name of the workflow must be
unique.
Note: A workflow name cannot contain any of the following characters: * _ %
n Owner: Select an owner for the workflow.
n Due Date: Select the date on which the workflow should be complete.
n Description (optional): Enter additional information.
5. Click Save.
The workflow is created with the status In Progress. It is displayed in the Workflows list in
the left pane of the Workflow Management window and the workflow diagram in the map
area.
The first task or tasks are in status In Progress and all the other tasks are in status Inactive.
The first task or tasks are displayed in My Tasks for all users that belong to the group to which
the task is assigned.
6. In the Properties pane, under Workflow, click the Stakeholders tab, and then do the
following:
a. In the search box, enter the name or a partial name of the user or the group that you want to
add as a stakeholder in this workflow.
b. Click Add.
7. Enter task information (optional). Click the task in the map area, and then, in the Properties
pane, do the following:
a. In the Assigned To box, enter the user name of the person responsible for carrying out the
task.
b. In the Due Date box, enter a due date for the task.
c. In the Description box, if required, edit the description.
d. Click Save.
Repeat this process for each task, as required.
Delete a Workflow
You can delete a workflow that is in progress. When you delete a workflow you delete all of its
related tasks. You cannot delete a workflow that is completed.
User Guide
Chapter 9: Task Management
HP EnterpriseView (2.5) Page 246 of 265
To delete a workflow
1. Click Task Management > Workflow Management.
2. In the Workflow Management window, from the Workflows list in the left pane, click the
workflow that you want to delete.
3. Click the Delete button.
The workflow is removed from the list. All related tasks are deleted.
Edit Workflow Properties
You can edit the workflow properties when the workflow is in progress. After you complete a
workflow, you cannot edit any of its properties or its task properties.
To edit workflow properties
1. Click Task Management > Workflow Management.
2. In the Workflow Management window, from the Workflows list in the left pane, click the
workflow that you want to edit.
3. In the Properties pane, make the necessary changes, and then click Save. For information on
workflow properties, see "Workflow Properties" on page 250.
Change the Task Group
The group to which the task belongs to is defined when the workflow template is created. The task
group can be changed as long as the task is not completed.
To change the task group
1. Click Task Management > Workflow Management.
Note: You can also change the group from My Tasks.
2. In the Workflow Management window, from the Workflows list in the left pane, click the
workflow that you want to modify.
3. In the workflow graph, click the task that you want to modify.
4. In the Properties pane, in the Group box, enter a new group name.
User Guide
Chapter 9: Task Management
HP EnterpriseView (2.5) Page 247 of 265
Note: If there was an assignee for this task, it is deleted.
5. Click Save.
Manage Your Tasks
The Task List pane on the EnterpriseView home page displays the following tasks:
l Tasks that are assigned to you.
l Tasks that are assigned to the group that you belong to but are not assigned to a specific user.
This includes groups that you belong to directly as well as indirectly (a group within a group).
These tasks have the The task belongs to a group icon next to them.
Unless you have suitable permissions, you cannot see tasks that do not belong to your group.
The tasks that are displayed are ready to be carried out, which means that they have the status In
Progress. Inactive tasks are not displayed in the Task List because they are not yet available to
users. After they are activated, meaning that their status is In Progress, they are displayed in the
Task List. Completed tasks can only be viewed from the Workflow Management window. For more
information, see "Workflow Management Window" on page 253.
You can access tasks in one of the following ways:
l You can access the page on which you need to perform a task directly from the Task List pane
on the home page, by clicking the page name link.
To refresh the tasks that are displayed in My Tasks, click the Refresh button.
l You can access your tasks by clicking the My Tasks button on the EnterpriseView toolbar.
Accessing your tasks from the My Tasks button on the toolbar while you are on the home
page, displays the same list of tasks as in the My Tasks pane. If you click the My Tasks
button from the toolbar while any other page is open, then only the tasks that are relevant to that
page are displayed.
A task can be assigned to you in one of the following ways:
l You claim the task.
You can claim a task from the My Tasks dialog box. After you claim a task, the other users in
your group will no longer see it in their task list.
l Another user assigns the task to you.
User Guide
Chapter 9: Task Management
HP EnterpriseView (2.5) Page 248 of 265
A task can be assigned to you by your manager or by the workflow owner. It can also be
reassigned to you by a user that belongs to the same group to which you belong.
If you are assigned a task, then you can see its workflow from My Tasks even if you are not a
workflow owner or stakeholder. You cannot, however, see the workflow of the task in the
Workflow Management page.
You can release a task back to the group's task pool, which means that it is no longer assigned
to you and can be claimed by any other user in your group.
The following procedures describe how to manage your tasks.
To claim a task
1. Click the My Tasks button on the toolbar.
2. In the left pane, from the list of tasks, click the task that you want to claim.
Tasks that have the The task belongs to a group icon next to them are not yet assigned
to you.
3. In the right pane, next to the Assigned To box, click the Claim Task button.
4. In the Add Comment box, enter information pertaining to the task, and then click Save.
To complete a task
1. After you successfully performed your task, click the My Tasks button on the toolbar.
2. In the left pane, from the list of tasks, click the task that you want to complete.
3. To complete the task, do one of the following:
n Select the Complete Task checkbox.
n If this is an approval task, select either Approve or Reject.
4. In the Add Comment box, enter information pertaining to the task, and then click Save.
The task is removed from your task list.
To release a task
1. Click the My Tasks button on the toolbar.
2. In the left pane, from the list of tasks, click the task that you want to release.
User Guide
Chapter 9: Task Management
HP EnterpriseView (2.5) Page 249 of 265
3. In the right pane, next to the Assigned To box, click the Release Task button.
4. In the Add Comment box, enter information pertaining to the task, and then click Save.
To reassign a task
1. Click the My Tasks button on the toolbar.
2. In the left pane, from the list of tasks, click the task that you want to reassign.
3. In the Assigned To box, enter the name of the user to which you want to assign the task.
4. In the Add Comment box, enter information pertaining to the task, and then click Save.
Workflow Properties
The following table describes all the workflow properties.
Property Description
Name The name of the workflow must be unique.
You can change the name of a workflow when it is in progress.
After it is completed, the name cannot be changed.
Template The template on which the workflow is based.
For more information, see "Manage Workflow Templates" on page
239.
You cannot change the template of a workflow.
Owner The person or group responsible for managing the workflow.
The owner of the workflow can be changed as long as the workflow
is not completed.
Due Date The expected completion date of the workflow.
The due date is the date on which the workflow is expected to be
completed. It is configured when you create a workflow.
The due date is displayed for workflows that are in progress.
If the due date of the last task is later than the workflow due date, it
means that the workflow is past its due date. The following
indication is displayed:
Task exceeds workflow due date.
User Guide
Chapter 9: Task Management
HP EnterpriseView (2.5) Page 250 of 265
Property Description
End Date The actual completion date of the workflow.
The date on which the workflow is actually completed, meaning
that the last task in the workflow has been completed.
The end date is displayed for workflows that have a Completed
status.
Last Task Due Date The due date of the last task in the workflow.
This date serves as a threshold indicating whether the workflow
due date is on schedule or at risk of not being met.
Description A general description of the workflow.
Status
l In Progress: The status of a workflow after it is created.
Users have started working on their tasks.
l Completed: The status of a workflow after all its tasks
have been completed.
Task Properties
The following table describes all the task properties.
Note:
l You cannot edit task properties that are defined in the workflow template.
l You cannot edit task properties after the task is completed.
Property Description
Page The page that the task is related to as defined in the template.
When creating a template, the user must assign the task to a
specific page in EnterpriseView. For more information, see "Create
a Workflow Template" on page 239.
ID A task identifier used mainly to distinguish between task
instances.
Name The name of the task as defined in the template.
User Guide
Chapter 9: Task Management
HP EnterpriseView (2.5) Page 251 of 265
Property Description
Description A general description of the task defined in the template. The
description originates from the Documentation field in the Activiti
Modeler. You can edit the description as long as the task is not
completed or belongs to a completed workflow.
Status The status of the task: 
l Inactive : The status of a task that is not active after a
workflow has been created. At this stage, the task is not
available to the assignee. Inactive tasks are accessible only
from the Task Management page, but are not displayed in My
Tasks.
l In Progress : A task receives this status only after its
preceding task is completed. If there is more than one task
before it, then at least one of the preceding tasks must be
complete. Tasks that are in progress are displayed in My Tasks
displayed in the Home page and in the My Tasks dialog box
accessible from the EnterpriseView toolbar. These tasks need
to be carried out by an assignee.
l Completed : The task status is automatically updated to
Completed after the user selects the Complete Task check
box or the Reject or Approve options (for approval tasks) and
clicks Save.
Group The group to which the task is assigned.
Assigned To The user (assignee) to which the task is assigned.
The assignee is responsible for carrying out the task.
The assignee must belong to the group to which the task is
assigned, or to any group within that group.
User Guide
Chapter 9: Task Management
HP EnterpriseView (2.5) Page 252 of 265
Property Description
Due Date The expected completion date of the task.
Tasks in the workflow graph in the Workflow Management window
includes the following indicators:
l Past the due date.
This indicator is displayed after the due date passes, meaning
on the day after the due date.
l Approaching the due date.
This indicator is displayed on the day before the due date and
until the due date is passed.
Reference Enter information pertaining to an external system. For example, a
ticket ID from a ticketing system.
Complete Task Select this check box if you want to mark the task as completed,
and then click Save. The status of the task is changed to
Completed and cannot be changed back to In Progress.
Approve/Reject Displayed for approval tasks.
Select one of the options to approve or reject the tasks in the
workflow, and then click Save. If you approve, then the workflow
proceeds to the following task. If you reject, then the workflow
proceeds to a different task.
Add Comment Comments are shared by all the tasks that are related to a specific
workflow. Both the owner and the various task assignees can
enter a comment. Use comments to communicate with your
colleagues, convey information, and mitigate problems related to
the workflow.
When you enter a comment and click Save, all users related to the
specific workflow can view your comment.
This field is mandatory.
Workflow Management Window
The Workflow Management window enables you manage workflows and workflow templates. For
more information, see "Task Management" on page 238. The different areas and the functionalities
available in each area are described in the following sections. For information on the EnterpriseView
toolbar, see "Toolbar Description" on page 17.
User Guide
Chapter 9: Task Management
HP EnterpriseView (2.5) Page 253 of 265
Toolbar
UI Element Description
Manage Templates Click this button to open the Manage Workflow Templates dialog box.
The Manage Workflow Templates dialog box includes all the actions
that are related to template: 
l Upload template. For more information, see "Upload a Workflow
Template to EnterpriseView" on page 243.
l View template. Click the template name to display the workflow
graph on the map. You can reset the layout, zoom in/out, or navigate
the mini-map to better display the template.
l Delete template. For more information, see "Delete a Workflow
Template from EnterpriseView" on page 244.
Left Pane
The left pane displays all the workflows that are in the system. Completed workflows are displayed
at the bottom of the list. Workflows in progress are sorted by due date; the workflow with the
earliest due date is displayed first.
User Guide
Chapter 9: Task Management
HP EnterpriseView (2.5) Page 254 of 265
UI Element Description
New Create a New Workflow
Click this button to create a new workflow. For more information, see
"Create a New Workflow" on page 245.
Filter Workflows
Click this button to open the Filter Workflows dialog box. You can filter
the workflows that are displayed in the left pane by template name,
workflow name, owner, and status.
To remove a filter, you can either open the Filter Workflows dialog box
and change the filter, or you can click the Clear Filter button.
By default, the list is filtered to display only workflows that are in
progress.
Clear Filter
Click this button to clear all the filters that you set through the Filter
Workflows dialog box.
Delete
Click this button to delete the workflow. All related tasks are deleted
regardless of their status. you cannot delete a workflow that has been
completed. For more information, see "Delete a Workflow" on page 246.
<Status> One of the following values is displayed:
l In Progress : The status of a workflow after it is created. Users
have started working on their tasks.
l Completed : The status of a workflow after all its tasks have
been completed.
Due Date See "Due Date" on page 250.
End Date See "End Date" on page 251.
User Guide
Chapter 9: Task Management
HP EnterpriseView (2.5) Page 255 of 265
Map Area
The map area includes the workflow graph.
UI Element Description
Reset Layout
Optimizes the workflow graph in the map area.
Zoom in/zoom out workflow graph.
User Guide
Chapter 9: Task Management
HP EnterpriseView (2.5) Page 256 of 265
Properties Pane
The Properties pane displays the properties for the workflow that is selected in the workflow list in
the left pane and for the task selected in the map area. The properties are displayed in two sections:
Workflow
To open the workflow properties, click Workflow.
Details Tab
This tab includes the workflow properties. For more information, see "Workflow Properties" on page
250.
Attachments Tab
UI Element Description
Upload Click this button to attach a file to this workflow.
The maximum file size is 5.00 MB.
User Guide
Chapter 9: Task Management
HP EnterpriseView (2.5) Page 257 of 265
UI Element Description
Delete To delete a file from this workflow, click the file that you want to
delete, and then click this button.
Download To download a file to your local computer, click the file that you
want to download, and then click this button.
Stakeholders
This tab includes a list of users and groups that have an interest in the workflow. A stakeholder can
be any person who's role is connected to the workflow, but is not the owner of the workflow.
Stakeholders receive the same email notifications that the workflow owner receives. For more
information on email notifications, see the Email Notifications section in the HP EnterpriseView
Administration Guide. For example, if the workflow owner's manager is a stakeholder, then the
manager will receive a notification when the workflow is overdue or completed.
The list of stakeholders can be edited as long as the workflow is in progress. The tab displays the
number of stakeholders in parenthesis.
To add a stakeholder, enter the name of the user or group in the search box, and then click Add.
To delete a stakeholder, click the stakeholder in the list, and then click the Delete button.
Controls Tab
This tab is displayed only if the workflow was triggered by a control action that was created for
mitigating a risk. For more information on control actions, see "Control Action" on page 93. It
includes the controls that need to be handled in this workflow. These controls need to be applied to
an asset or reassessed.
Task
To open the task properties, click Task. For more information on task properties, see "Task
Properties" on page 251.
In addition to the task properties, this pane included the following functionality.
UI Element Description
Next Task
This button helps you navigate between tasks of the same type. For
example, if a workflow is rejected by the owner, then one or more tasks
need to be repeated. In this case, new, duplicate tasks are created for
each task that was rejected. You can navigate between these tasks by
using this button.
Previous Task
See "Next Task" above.
Save Save the changes that you made to the task properties.
Cancel Cancel the changes that you made to the task properties.
User Guide
Chapter 9: Task Management
HP EnterpriseView (2.5) Page 258 of 265
Mini-map
When the workflow is too large to be entirely displayed in the map area, you can navigate it by
dragging in the mini-map area.
To expand or collapse the mini-map, click the Expand/Collapse button.
EnterpriseView Page IDs
Page IDs are required for creating workflow templates. The following table includes the page IDs for
all EnterpriseView pages.
Page ID Page Display Name
1 Risk Indicators
2 Threat Library Builder
3 Risk Assessment and Treatment
4 Vulnerability Management
5 Vulnerability Assignment
6 Vulnerability Dictionary
7 Policy Builder
8 Policy Mapping
9 Statement of Applicability
10 Policy and Compliance Assessment
11 Vulnerability to Control Mapping
12 Control to Threat Mapping
13 Asset Profiling
14 Workflow Management
15 Configuration
16 User Management
17 Job Management
18 Audit Log
19 Dashboard Builder
20 Threat Assignment
User Guide
Chapter 9: Task Management
HP EnterpriseView (2.5) Page 259 of 265
Page ID Page Display Name
21 External Risk Factor Management
22 KPI Management
Workflow Template Shape Repository
You can create workflow templates in Activiti Modeler. For more information on creating templates,
see "Create a Workflow Template" on page 239.
Activiti Modeler includes a set of elements (shapes) that are used to create templates. The shapes
are described in the following table.
Icon Name Description
Data-based Exclusive
(XOR) Gateway
When splitting, it routes the sequence flow to exactly
one of the outgoing branches, based on conditions.
When merging, it awaits one incoming branch to
complete before triggering the outgoing flow.
Parallel Gateway When used to split the sequence flow, all outgoing
branches are activated simultaneously. When
merging parallel branches, it waits for all incoming
branches to complete before triggering the outgoing
flow.
Start Event Use this shape to start a workflow.
End Event Use this shape to end a workflow.
Sequence Flow Use this shape to define the execution order of
activities.
User Task Use this shape to model work that needs to be done
by a human actor. This included approval tasks.
User Guide
Chapter 9: Task Management
HP EnterpriseView (2.5) Page 260 of 265
Chapter 10: Settings
EnterpriseView includes a centralized settings module, through which you can configure all internal
settings.
To access the settings module, on the EnterpriseView toolbar, click the Settings button. When
the Settings dialog box opens, it displays one of the following:
l Links to every module that has specific settings. This display appears when the EnterpriseView
page that is currently open does not have specific settings. Click the module name in order to
access the configuration options for that module.
Note: You have access only to modules for which you have the required permissions.
l The settings for a specific module. This display appears when the EnterpriseView page that is
currently open has specific settings. For example, if the Vulnerability Management page is open,
when you click the Settings button, then the Settings dialog box opens on the
Vulnerabilities page. To return to the Settings main page, click Settings on the title bar.
After you make a change in settings, you need to refresh the page in order to apply the changes.
The following table includes all the configuration options available through the Settings dialog box,
for each module.
HP EnterpriseView (2.5) Page 261 of 265
Module Setting Page
Executive View Overall Score Formula
For more information, see "Configure Overall Score Formula
Weights" on the next page.
Overall Score Ranges
For more information, see "Configure Asset Overall Score Ranges"
on page 264.
Criticality Level Ranges
For more information, see "Configure Criticality Level Ranges" on
page 264.
Executive View KPI
For more information, see "Overall Score KPI" on page 159.
Vulnerabilities Asset Vulnerability Score Aggregation
For more information, see "Configure Asset Vulnerability Score
Aggregation Parameters" on page 136.
Vulnerability KPI
For more information, see "Vulnerability Score KPI " on page 160.
Vulnerability Ranges
For more information, see "Configure Vulnerability Score Ranges"
on page 137
Policy and Compliance Compliance KPI
For more information, see "Compliance Score KPI" on page 159.
Compliance and Maturity Score Ranges
For more information, see "Configure Compliance and Maturity
Score Ranges" on page 63.
Policy Administration
For more information, see "Activate a Policy" on page 47.
User Guide
Chapter 10: Settings
HP EnterpriseView (2.5) Page 262 of 265
Module Setting Page
Risk Modeling Actor Weights
For more information, see "Configure Risk Assessment Settings" on
page 107.
Impact Area
For more information, see "Configure Risk Assessment Settings" on
page 107.
Risk Score Ranges
For more information, see "Configure Risk Score Ranges" on page
109.
Risk KPIs
For more information, see "Risk Score KPI" on page 160 and
"Unassessed Risk KPI" on page 160.
Task Management Risk Mitigation Template
For more information, see "Configure Risk Mitigation Workflow
Templates" on page 265.
Task Management KPI
For more information, see "Completed Workflows KPI" on page 160.
External Risk Factor <External Risk Factor Name>
For more information, see the Configure External Risk Factor
Ranges section in the HP EnterpriseView Deployment Guide and
"Configure External Risk Factor KPI Settings" on page 164.
Configure Overall Score Formula Weights
The asset overall score reflects the total risk of the asset. It is composed of the weighted average
of the aggregate scores of all risk factors. There are five risk factors that are inherent in
EnterpriseView, they include: policy compliance, the control maturity, risk, and asset vulnerability.
In addition to these factors, any external risk factor that has been defined in EnterpriseView is also
included in the asset overall score calculation. For more on external risk factors, see "External Risk
Factors" on page 161.
Following is the formula for calculating the asset overall score:
normalized aggregated risk factor scores weight
weights
∑( * )
∑
Note: For compliance and control maturity, the complementary number to the normalized
aggregated risk factor score is used.
User Guide
Chapter 10: Settings
HP EnterpriseView (2.5) Page 263 of 265
You can edit the weights of each of the variables in the formula.
To configure the overall score formula weights:
1. On the EnterpriseView toolbar, click the Settings button.
2. In the Settings dialog box, click Executive View > Overall Score Formula Weights.
3. In the Overall Score Formula Weights page, enter the weight for each variable in the
formula.
4. Click Save.
Configure Asset Overall Score Ranges
You can configure the ranges for the score severity indication for asset overall scores.
Asset overall scores are displayed with one of the following icons:
Low score
Medium score
High score
This configuration is reflected throughout the application, wherever these scores are displayed. For
example, on the Risk Register page, in the Asset Summary component and in the Overall Score
Heat Map page.
To configure vulnerability score ranges
1. On the EnterpriseView toolbar, click the Settings button.
2. In the Settings dialog box, click Executive View > Overall Score Ranges.
3. Under Overall Score Ranges, drag the slider to define the score ranges.
4. Click Save.
Configure Criticality Level Ranges
You can configure the ranges for the severity indication for the criticality levels. Severity is
indicated by color:
l Low = green
l Medium = yellow
User Guide
Chapter 10: Settings
HP EnterpriseView (2.5) Page 264 of 265
l High = red
This configuration is reflected in the Overall Score Heat Map.
To configure criticality level ranges
1. On the EnterpriseView toolbar, click the Settings button.
2. In the Settings dialog box, click Executive View > Criticality Level Ranges.
3. Under Criticality Level Ranges, drag the slider to define the ranges.
4. Click Save.
Configure Risk Mitigation Workflow Templates
A mitigation treatment activity can include one or more action plans for reducing risk. You can
create the following types of actions:
l Control action
l Manual action
After you create the action, you can create a workflow for carrying out the action plan.
EnterpriseView includes a default template for creating a workflow for a manual action, but you can
change these settings, as described in the following procedure.
Note: You must select a template in order to create a workflow from the action.
To configure the template for the treatment action workflow
1. On the EnterpriseView toolbar, click Settings.
2. In the Settings dialog box, click Task Management > Risk Mitigation Templates.
3. From the Template for manual action list, select the template that the workflow is based on
when you create a workflow from a manual action.
4. From the Template for control action list, select the template that the workflow is based on
when you create a workflow from a control action.
5. Click Save.
User Guide
Chapter 10: Settings
HP EnterpriseView (2.5) Page 265 of 265

ArcSight EnterpriseView User Guide

  • 1.
    HP EnterpriseView For the WindowsOperating System Software Version: 2.5 User Guide Document Release Date: April 2014 Software Release Date: April 2014
  • 2.
    Legal Notices Warranty The onlywarranties for HP products and services are set forth in the express warranty statements accompanying such products and services. Nothing herein should be construed as constituting an additional warranty. HP shall not be liable for technical or editorial errors or omissions contained herein. The information contained herein is subject to change without notice. The network information used in the examples in this document (including IP addresses and host names) is for illustration purposes only. Restricted Rights Legend Confidential computer software. Valid license from HP required for possession, use or copying. Consistent with FAR 12.211 and 12.212, Commercial Computer Software, Computer Software Documentation, and Technical Data for Commercial Items are licensed to the U.S. Government under vendor's standard commercial license. Copyright Notice © Copyright 2011 - 2014 Hewlett-Packard Development Company, L.P. Follow this link to see a complete statement of copyrights and acknowledgements for all ArcSight products: http://www.arcsight.com/copyrightnotice. Trademark Notices Adobe™ is a trademark of Adobe Systems Incorporated. Microsoft® and Windows® are U.S. registered trademarks of Microsoft Corporation. UNIX® is a registered trademark of The Open Group. This document is confidential. Support Visit the HP Software Support Online web site at: http://www.hp.com/go/hpsoftwaresupport This web site provides contact information and details about the products, services, and support that HP Software offers. User Guide HP EnterpriseView (2.5) Page 2 of 265
  • 3.
    HP Software onlinesupport provides customer self-solve capabilities. It provides a fast and efficient way to access interactive technical support tools needed to manage your business. As a valued support customer, you can benefit by using the support web site to: l Search for knowledge documents of interest l Submit and track support cases and enhancement requests l Download software patches l Manage support contracts l Look up HP support contacts l Review information about available services l Enter into discussions with other software customers l Research and register for software training Most of the support areas require that you register as an HP Passport user and sign in. Many also require a support contract. To register for an HP Passport ID, go to: http://h20229.www2.hp.com/passport-registration.html To find more information about access levels, go to: http://h20230.www2.hp.com/new_access_levels.jsp HP Software Solutions Now accesses the HPSW Solution and Integration Portal Web site. This site enables you to explore HP Product Solutions to meet your business needs, includes a full list of Integrations between HP Products, as well as a listing of ITIL Processes. The URL for this Web site is http://h20230.www2.hp.com/sc/solutions/index.jsp User Guide HP EnterpriseView (2.5) Page 3 of 265
  • 4.
    Contents Chapter 1: Welcometo This Guide 11 About EnterpriseView 11 What's New 12 Navigating the User Interface 13 Chapter 2: Asset Profiling 19 Business Model Authorization 19 Common Platform Enumeration 20 Manage Asset Types 21 How to Build a Business Model 23 Create a Business Model View 24 Create an Asset 25 Authorize a User to Work with an Asset 27 Connect an Asset to the Business Model 28 Search for an Asset 29 Filter Assets by a CPE 29 Disconnect an Asset from the Business Model 30 Delete an Asset 30 Add a CPE to an Asset 31 Asset Properties 32 Asset Profiling Window 35 Chapter 3: Policy and Compliance 42 About Unified Compliance Framework 43 Manage Policies 45 Create a Policy 45 Activate a Policy 47 Import a Policy 47 Delete a Policy 48 Set Statement of Applicability 48 User Guide Contents HP EnterpriseView (2.5) Page 4 of 265
  • 5.
    Audit Assets 50 AssessAsset Compliance 51 Assess Control Maturity 52 Clear Assessment on Assets 54 Control to Vulnerability Mapping 54 Use Configuration Vulnerabilities to Determine Compliance Score 55 Use Network and Application Vulnerabilities to Refine Compliance Score 56 Map Controls to Vulnerabilities 57 Edit Control to Vulnerability Mapping 57 Delete Vulnerability to Control Mapping 58 Policy Mapping 59 About the Policy Mappings Import Job 59 Import UCF Mappings 59 Map Controls 60 Search for Controls 61 Delete Mapping Between Controls 61 Policy Mapping Window 62 Configure Compliance and Maturity Score Ranges 63 Policy Builder Window 64 Policy and Compliance Assessment Window 70 P5 Control Maturity Model Guidelines 76 Control Scores Aggregation Mechanism 77 Aggregation on the Business Model Level 79 Aggregation on Policy Level 81 Weights and Criticality Level 83 Chapter 4: Risk Management 85 Create a Threat Library 86 Create an Actor 87 Create an Operation 88 Connect Actor to Operation 88 Disconnect Actor from Operation 89 User Guide Contents HP EnterpriseView (2.5) Page 5 of 265
  • 6.
    Assign Threats toAssets 89 Assess the Risk on an Asset 92 Risk Treatment 93 About Risk Treatment Methods 93 Mitigate Risk Automatically Using Policy Controls 95 Map Controls to Threats 96 Edit Control to Threat Mapping 97 Delete Control to Threat Mapping 97 Create a Treatment Plan 98 Mitigate Risk 99 Add a Control Action 100 Add a Manual Action 102 Accept Risk 104 Defer Risk 104 Transfer Risk 105 Avoid Risk 106 Risk Settings 106 Configure Risk Score Aggregation Method 107 Configure Risk Assessment Settings 107 Configure Risk Score Ranges 109 Configure Asset Risk Settings 110 Risk Score Aggregation Mechanism 110 Residual Risk Score Calculation 112 Impact Score Calculation 112 Threat Library Builder Window 115 Threat Assignment Window 119 Risk Assessment and Treatment Window 123 Chapter 5: Vulnerability Management 129 Vulnerability Types 130 Web Application 130 Network 130 User Guide Contents HP EnterpriseView (2.5) Page 6 of 265
  • 7.
    Configuration 130 Common VulnerabilityScoring System 131 Configuration Vulnerabilities Scoring Method 131 About the Vulnerability Life Cycle 133 Manage the Vulnerability Life Cycle 135 Attach a Vulnerability to an Asset 135 Vulnerability Settings 136 Configure Asset Vulnerability Score Aggregation Parameters 136 Configure Vulnerability Score Ranges 137 Configure Asset Vulnerability Score Formula 137 Vulnerability Properties 140 Asset Vulnerability Score Aggregation Mechanism 147 Vulnerability Error Handling 148 Vulnerability Management Window 149 Vulnerability Assignment Window 153 Vulnerability Dictionary 156 Chapter 6: Key Performance Indicators 158 Configure KPI Settings 158 Out-of-the-Box KPIs 159 Chapter 7: External Risk Factors 161 Capture Snapshot 162 Edit External Risk Factor Score 163 Configure External Risk Factor Ranges 163 Configure External Risk Factor KPI Settings 164 External Risk Factor Management Window 164 Out-of-the-Box Risk Factors 173 Chapter 8: Dashboards and Reports 174 Printing Reports 175 Root Cause Analysis 177 Risk Register 178 Overall Score Heat Map 181 User Guide Contents HP EnterpriseView (2.5) Page 7 of 265
  • 8.
    Risk Indicators 182 ExternalRisk Factors Dashboard 185 Risk Modeling Dashboard 187 Risk Heat Map and Scorecard 189 Compliance Dashboard 191 Compliance by Policy Dashboard 192 Policy Compliance Map 194 Vulnerability Dashboard 195 Task Management Dashboard 197 EnterpriseView Universe 199 Chapter 9: Task Management 238 Manage Workflow Templates 239 Create a Workflow Template 239 Upload a Workflow Template to EnterpriseView 243 Edit a Workflow Template 243 Delete a Workflow Template from EnterpriseView 244 Manage Workflows 244 Create a New Workflow 245 Delete a Workflow 246 Edit Workflow Properties 247 Change the Task Group 247 Manage Your Tasks 248 Workflow Properties 250 Task Properties 251 Workflow Management Window 253 EnterpriseView Page IDs 259 Workflow Template Shape Repository 260 Chapter 10: Settings 261 Configure Overall Score Formula Weights 263 Configure Asset Overall Score Ranges 264 Configure Criticality Level Ranges 264 User Guide Contents HP EnterpriseView (2.5) Page 8 of 265
  • 9.
    Configure Risk MitigationWorkflow Templates 265 User Guide Contents HP EnterpriseView (2.5) Page 9 of 265
  • 10.
    Page 10 of265HP EnterpriseView (2.5) User Guide Contents
  • 11.
    Chapter 1: Welcometo This Guide Welcome to HP EnterpriseView User Guide. This guide provides you with information about all of the operational aspects of EnterpriseView. This guide is intended for all EnterpriseView users. This guide includes the following chapters: "Asset Profiling" on page 19 "Policy and Compliance" on page 42 "Risk Management" on page 85 "Vulnerability Management" on page 129 "Key Performance Indicators" on page 158 "External Risk Factors" on page 161 "Dashboards and Reports" on page 174 "Task Management" on page 238 "Settings" on page 261 About EnterpriseView EnterpriseView is a framework that enables Chief Information Officers (CIOs) and Chief Information Security Officers (CISOs) to analyze security risk information in a business context and prioritize actions to minimize that risk. By tying IT risk and compliance information to business services it ensures alignment with management objectives. EnterpriseView bridges the gap between IT operations and the security office by interconnecting and consolidating business processes across the organization and establishing a rational basis for decision making. This product incorporates a holistic, enterprise approach, streamlining and integrating risk, compliance, threat and vulnerability information, while providing a business context to executives. It anticipates threats and provides continuous monitoring, by regularly updating and testing security related functions. HP EnterpriseView (2.5) Page 11 of 265
  • 12.
    The main modulesin EnterpriseView are: l Policy and Compliance Management: This module enables you to assess and audit the assets in your organization. Use the policy builder to create customized policies and the Statement of Applicability (SoA) feature to apply controls to assets. EnterpriseView includes out-of-the-box policies, such as Unified Compliance Framework (UCF) enabling "audit once - comply with many" functionality. l Risk Management: This module enables you to manage all aspects of the risk life cycle. Use the flexible and expandable threat library to define the threats that may potentially harm your organization, create threat scenarios by assigning threats to assets, analyze the risk and specify its impact and likelihood, and mitigate the risk by using controls or other effective actions. l Vulnerability Management: This module collects vulnerabilities from vulnerability assessment tools, removes duplicates, assigns them to assets, and prioritizes them accordingly, allowing you to manage the remediation process. l External Risk Factors: This module enables you to import risk factor information from external sources, manage it and display it on top of the business model and in dashboards. l Asset Management: Assets are the building blocks of the business model, which is the foundation for all core EnterpriseView functionality. The business model depicts the entire organization from high-level business assets to low-level IT assets, on which policy, risk, and vulnerability operations are performed. You can create the business model by synchronizing EnterpriseView with an external asset repository or by creating it by using the Assets module. l Dashboards and Reports: This module includes sophisticated executive dashboards, such as Risk Register, and reports, and enables you to create your own customized dashboards and reports. l Task Management: EnterpriseView enables you to create, manage, and monitor workflows. Use workflows to structure and streamline your organization’s processes and assign tasks to the relevant people. What's New This topic describes the new features and enhancements added in this release. Configuration Vulnerabilities EnterpriseView now supports the import of configuration vulnerabilities from scanners, along with network and application vulnerabilities that have been supported until now. For more information on configuration vulnerabilities, see "Vulnerability Types" on page 130. The vulnerability lifecycle has been updated to accommodate configuration vulnerabilities, as well as the control to vulnerability mapping capabilities. Configuration vulnerabilities have a different and stronger affect on controls than network and application vulnerabilities; they can be used to fully determine the compliance of User Guide Chapter 1: Welcome to This Guide HP EnterpriseView (2.5) Page 12 of 265
  • 13.
    an asset witha control and are regarded as an automatic means of assessment. For more information, see "Use Configuration Vulnerabilities to Determine Compliance Score" on page 55. Enhanced External Risk Factor Management Capabilities EnterpriseView now includes an External Risk Factor Management page, allowing you to centrally manage all of your external risk factors on top of your business model. On this page you can compare the state of your risk posture using snapshots, use advanced search and filter capabilities to create different view on your business model, and edit scores manually. For more information, see "External Risk Factors" on page 161. New HP Experience Look and Feel A new clean and crisp look and feel that enhances the user experience across the entire application. New Navigation Panel and Toolbar This version of EnterpriseView includes a new navigation panel and a general toolbar, that appears on all EnterpriseView pages and includes capabilities such as refresh, access to My Tasks, access to Settings, report generation, and context sensitive help, providing a better user experience across the application. For more information, see "Navigating the User Interface " below. Navigating the User Interface You can navigate the EnterpriseView user interface using the navigation bar or by clicking on the module name in the home page. The navigation bar and the home page provide you access to all the modules and pages in EnterpriseView. The module pages to which you have access depend on the following factors: l Your EnterpriseView license. Modules for which you are not licensed are disabled. l Your role. Pages that you do not have permissions for are not displayed. The content to which you have access to depends on your authorization. For more information, see "Business Model Authorization" on page 19. EnterpriseView stores the last asset and policy element that you worked on. When you navigate EnterpriseView, the UI pages appear in the context of that asset or that policy element. For example, you can view statistical information for a specific asset in the different dashboards without having to select the asset in every dashboard. The context is also saved when you log out. The navigation bar To access the navigation bar, click Home. User Guide Chapter 1: Welcome to This Guide HP EnterpriseView (2.5) Page 13 of 265
  • 14.
    Clicking the modulein the navigation bar or on the home page opens a sub menu that includes all the pages that belong to that module. The following table includes information on the navigation bar, assuming you have a license for the complete module set. Module Pages Description None The EnterpriseView home page includes links to all module components. In addition, it displays the tasks assigned to you or to your group in the My Tasks pane. You can click the task name to open the page on which you need to perform the task. For example, in the previous figure , click Statement of Applicability to open the Statement of Applicability page. l Overall Score Heat Map l Risk Register l Risk Indicators Executive dashboards enable CIOs and CISOs to view and analyze security risk information in a business context. Navigation Bar Description User Guide Chapter 1: Welcome to This Guide HP EnterpriseView (2.5) Page 14 of 265
  • 15.
    Module Pages Description lRisk Heat Map and Scorecard l Risk Modeling Dashboard l Threat Library Builder l Threat Assignment l Risk Assessment and Treatment l Control to Threat Mapping Use the flexible and expandable threat library to define threat scenarios for the assets in your organization's business model and specify impact and probability to calculate their risk. l Vulnerability Dashboard l Vulnerability Assignment l Vulnerability Management l Vulnerability Dictionary Manage and remediate the vulnerabilities according to their severity and the criticality level of your assets. l Compliance by Policy Dashboard l Compliance Dashboard l Compliance Map l Policy Builder l Statement of Applicability l Policy and Compliance Assessment l Policy Mapping l Control to Vulnerability Mapping Define policies or use out-of-the-box policies to define a statement of applicability and perform audit. l External Risk Factors Dashboard l External Risk Factors Management View and analyze risk factor information imported into EnterpriseView from external sources. Navigation Bar Description, continued User Guide Chapter 1: Welcome to This Guide HP EnterpriseView (2.5) Page 15 of 265
  • 16.
    Module Pages Description AssetProfiling Create and manage a business model that depicts your organization from high- level business assets to low-level IT assets, on which policy, risk, and vulnerability management is performed. l Task Management Dashboard l Workflow Management Create, manage, and monitor workflows. Use workflows to structure and streamline your organization’s processes and assign tasks to the relevant people. l Audit Log l Configuration l Job Management l User Management l Dashboard Builder l KPI Management Administer EnterpriseView by creating customized dashboards, managing roles and permissions, monitoring batch jobs and managing application settings. Navigation Bar Description, continued The toolbar The EnterpriseView toolbar appears on every page except for the Configuration page. The toolbar appears on the top right side of every page. User Guide Chapter 1: Welcome to This Guide HP EnterpriseView (2.5) Page 16 of 265
  • 17.
    The toolbar includesthe tools described in the following table. Tool Description Generate Report Generate Report Click this button to generate a report. Select a report from the list of reports. If you are prompted, select to always allow pop-ups from the EnterpriseView server. You can save the report as a PDF. This button does not appear on pages that do not have reports. If you create a report for that page and assign it to the category of that page, then the button will appear on the toolbar. My Tasks Click this button to open the My Tasks dialog box. For more information, see "Manage Your Tasks" on page 248. Settings Click this button to open the Settings dialog box. For more information, see "Settings" on page 261. Toolbar Description User Guide Chapter 1: Welcome to This Guide HP EnterpriseView (2.5) Page 17 of 265
  • 18.
    Tool Description Refresh Click thisbutton to refresh the information on this page. Help on this page Click this button to open the help relevant to this page. Toolbar Description, continued The Tasks List For information on the Tasks List, see "Manage Your Tasks" on page 248. User Guide Chapter 1: Welcome to This Guide HP EnterpriseView (2.5) Page 18 of 265
  • 19.
    Chapter 2: AssetProfiling In EnterpriseView, an asset is an entity that represents a physical or logical resource in the system. For example, assets can represent hardware, software, services, people, documents or business units. Assets are the building blocks of the business model. They are organized into a hierarchical format based on the dependencies in your organization’s IT environment.The EnterpriseView business model depicts the entire IT environment, from the highest level of the organization (such as an office location or a line of business) to the lowest level (such as a software application). Each entity in the EnterpriseView business model is an asset. For more information on building a business model, see "How to Build a Business Model" on page 23. The business model is the foundation for all core EnterpriseView functionality. Using a business model, risk and regulation compliance (policies) can be assessed effectively, providing "apply once—affect all" capabilities. Policies can be applied to top level assets and trickled down to all lower level assets that belong to that hierarchy. Conversely, risk assessments and policy audits can be performed on lower level assets and then trickled up and aggregate to top level assets, providing a business centric analysis of security risk and policy compliance. Data analysis, scorecards, and reports can be viewed on all asset levels, providing stakeholders in an organization with access to data that is relevant to their role. An extensive business model provides EnterpriseView users with more accurate information about the organization's overall risk. Assets in the business model are restricted to authorized users, with the exception of the Administrator, who is automatically authorized to work on the entire business model. For more information, see "Business Model Authorization" below. There are many different types of assets, which are divided into categories. For more information,see "Manage Asset Types" on page 21. Business Model Authorization When EnterpriseView is first deployed, there is only one asset defined: My Organization. All other assets must be imported from an external asset repository or created manually. The Administrator (the user defined during installation) is the only user who is automatically authorized to view or edit all assets in EnterpriseView. Users must be authorized to work with at least one asset in order to work on any page in EnterpriseView that is associated with assets (has an asset selector component), primarily, the Asset Profiling page. Therefore, when creating the business model, the Administrator must grant users and groups access rights to work with assets that are relevant to them. This does not mean that the Administrator must create the entire business model. The Administrator can authorize users that have EDIT ASSETS permissions (such as Asset Profilers)  to work on select business model branches. After these users are authorized, they can continue creating the business model and authorizing other EnterpriseView users and groups to work with the assets that are relevant to them. To authorize users to work with an asset, see "Authorize a User to Work with an Asset" on page 27. HP EnterpriseView (2.5) Page 19 of 265
  • 20.
    The access rightsof a user determine the scope of action that the user has in EnterpriseView. For example, a user with a Policy Auditor role with access rights to the Main Office asset, will be able to see the Main Office branch in the business model and perform an audit on that branch. This user will not be able to see any other assets in EnterpriseView. This concept is applied throughout EnterpriseView and includes all the pages, dashboards, and printable reports. Asset access rights are automatically inherited from parent assets, therefore, when a user is authorized to work on an asset, the user can also work on all of the asset's children. Access rights can be granted on any asset, but can be revoked only on the asset on which they were granted; inherited access rights cannot be revoked. Assets that are unattached can be viewed or edited by any user that has EDIT ASSETS permissions. After an asset is attached to the business model, only authorized users can work with the asset. Common Platform Enumeration Common Platform Enumeration (CPE) is a structured naming scheme for describing and identifying classes of applications, operating systems, and hardware devices present among an enterprise’s computing assets. The official version of the CPE Product Dictionary is maintained by National Institute for Standards and Technology (NIST). In EnterpriseView, a CPE is primarily an asset property that helps identify the asset by using this standardized method. But it is also one of the vulnerability properties, for the vulnerabilities defined in the vulnerability dictionary.This means that you can use CPEs as a source of information for identifying potential vulnerabilities on your organizations assets. CPEs are updated along with the vulnerability dictionary. A CPE has the following URI-based format: cpe:/<part>:<vendor>:<product>:<version>:<update>:<edition>:<language> The part field includes one of the following values:  l a for applications l h for hardware platforms l o for operating systems Fields at the end of the URI can be left off. For example: cpe:/a:hp:loadrunner:11.50. This format is based on the CPE 2.2 version, although the CPEs in the dictionary are from version 2.3. User Guide Chapter 2: Asset Profiling HP EnterpriseView (2.5) Page 20 of 265
  • 21.
    When you createassets locally, you can add or removes CPEs to these assets, as required. But when you import assets from an external asset repository, you cannot add or remove their corresponding CPEs. CPEs are supported when you import assets from a CSV file or from ESM; they are not supported if you import assets from UCMDB. Note: If your business model is based on ESM, CPEs are derived from data found in ESM asset categories. This means that your business model must be category-based in order to include CPEs. Manage Asset Types EnterpriseView includes the following asset categories: l Organization: Includes only one asset type—Organization. The Organization is the starting point of the business model. EnterpriseView includes a predefined Organization asset. l Location: Includes types such as Country, City, and Building. l Business: Includes a business reference or a line of business, such as online banking. l IP: Includes only one asset type—IP Address. EnterpriseView supports both IPv4 and IPv6. l Infrastructure Elements: Includes hardware, such as a computer (network entity) or a printer. l Running Software: Includes software applications, such as a mail server or a database. l People: Includes groups and individuals. l Documents: Includes one asset type—Document. Each of these categories includes various predefined asset types. In addition to the asset types that come with EnterpriseView, you can add new asset types to any category, except the Organization category, which includes only one Organization asset. You can also edit or delete an asset type. Note: Deleting or renaming an asset type in the Configuration module only affects new assets; they do not affect existing assets in the business model. Existing assets of the deleted or renamed type are displayed with a question mark icon. To add an asset type 1. Click Administration > Configuration. User Guide Chapter 2: Asset Profiling HP EnterpriseView (2.5) Page 21 of 265
  • 22.
    2. In theConfiguration module, in the left pane, click Asset Management > Asset Type Categories, and then click the asset category to which you want to add an asset type. 3. In the right pane, click the Add configuration to configuration set button, and then do the following: n In the Type box, enter the internal name of the asset type. n In the Label box, enter the display name of the asset type. n From the Icon list, select the image for the asset type icon. 4. Save and apply the configuration changes. For more information, see the Save and Apply Configuration Changes section in the HP EnterpriseView Deployment Guide. To edit an asset type 1. Click Administration > Configuration. 2. In the Configuration module, in the left pane, click Asset Management > Asset Type Categories, and then click the asset category to which the asset type that you want to edit belongs. 3. In the right pane, make the required changes for the asset type that you want to change. 4. Save and apply the configuration changes. For more information, see the Save and Apply Configuration Changes section in the HP EnterpriseView Deployment Guide. To delete an asset type 1. Click Administration > Configuration. 2. In the Configuration module, in the left pane, click Asset Management > Asset Type Categories, and then click the asset category from which you want to delete an asset type. 3. In the right pane, click the asset type that you want to delete, and then click the Remove configuration from the configuration set button. 4. Save and apply the configuration changes. For more information, see the Save and Apply Configuration Changes section in the HP EnterpriseView Deployment Guide. User Guide Chapter 2: Asset Profiling HP EnterpriseView (2.5) Page 22 of 265
  • 23.
    How to Builda Business Model There are two ways to build a business model in EnterpriseView: l Import: you can synchronize EnterpriseView with the external asset repository that is the primary asset management system in your organization. Note: You can add assets that you created in EnterpriseView to an imported business model. l Create locally: you can use EnterpriseView as the primary asset management system of your organization and build a business model within EnterpriseView. The following procedures outline the steps for creating a business model in EnterpriseView. To import a business model 1. Follow the instructions in the Synchronize Assets with External Asset Repository section in the HP EnterpriseView Deployment Guide. 2. During the first import, all imported assets are saved as Unattached. Follow the instructions in "Connect an Asset to the Business Model" on page 28. Repeat this process until all imported assets are connected to the business model. Creating the business model from imported assets is a one-time task. After the business model is created, each subsequent synchronization automatically updates the business model for all existing assets, and only newly introduced assets are saved as unattached. 3. Authorize users to work with assets, as described in "Authorize a User to Work with an Asset" on page 27. To build a local business model 1. Review the predefined asset types. a. Click Administration > Configuration. b. In the Configuration window, click Asset Management > Asset Type Categories. c. Review the asset types for all categories to see whether they reflect the asset types required by your organization's business model. d. If required, add asset types, as described in "Manage Asset Types" on page 21. User Guide Chapter 2: Asset Profiling HP EnterpriseView (2.5) Page 23 of 265
  • 24.
    2. Create thebusiness model. a. Click Assets > Asset Profiling. b. In the Asset Profiling window, click the New tab. The predefined My organization asset icon is displayed in the map area. c. Click the My organization asset. d. In the asset card, click the Edit Asset Properties button, and enter the asset name and any other information that you have on this asset. e. Follow the instructions in "Create an Asset" on the next page to add assets to the business model. f. For each asset that you create, authorize users to work with it, as described in "Authorize a User to Work with an Asset" on page 27 Create a Business Model View A view is a specific business model composition that displays only the assets that you want to see on the map. A view allows you to concentrate on the assets that interest you the most without being distracted by the multitude of assets in your organization. You can create multiple views that allow you to manage different parts of the organization. For example, you can create a view that includes only business assets that belong to a major office, or a view that includes only servers in a specific office building. You can create views in the following pages: l Asset Profiling Views on this page include asset composition. l Risk Indicators Views on this page include asset composition and the risk factor. l External Risk Factor Management Views on this page include asset composition, the risk factor, and the score type. The views are not shared between pages, meaning that you must create separate views for each page. After you save the view, when you reopen the page, the business model displayed in the map area is resized to the default zoom and to fit to window. You can also modify a view. Assets that were disconnected from the business model are not displayed in the view. User Guide Chapter 2: Asset Profiling HP EnterpriseView (2.5) Page 24 of 265
  • 25.
    To create anew view 1. Click Assets > Asset Profiling. Note: n To create a view in the Risk Indicators page, click Executive View > Risk Indicators. n To create a view in the External Risk Factors Management page, click External Risk Factors >Management. 2. In the business model map, expand and collapse assets as needed, to create the map composition that you require. 3. In the toolbar, click the arrow next to the Save button, and then click Save New View. 4. In the Save View dialog box, in the Name box, enter a name for the view, and then click OK. The view that you created is added to the list of views and are available from the You are viewing list. To modify an existing view 1. Click Assets > Asset Profiling. Note: n To modify a view in the Risk Indicators page, click Executive View > Risk Indicators. n To modify a view in the External Risk Factors Management page, click External Risk Factors >Management. 2. From the You are viewing list, select the view that you want to modify. 3. Make the required changes to the view. 4. Click Save. Create an Asset New assets must be connected to the business model. You cannot create an unattached asset, but you can create a new asset and then detach it from the business model. For more information, see "Disconnect an Asset from the Business Model" on page 30. User Guide Chapter 2: Asset Profiling HP EnterpriseView (2.5) Page 25 of 265
  • 26.
    To create anasset 1. Click Assets > Asset Profiling. 2. Search for the source (parent) asset, as described in "Search for an Asset" on page 29, or click the asset in the map. 3. In the asset's asset card, click the Connect to another asset (mark as source asset) button. The connection panel is displayed in the map area. 4. In the left pane, click the New tab. 5. On the New tab, click the asset type that you want to create and connect to the business model. 6. In the left pane, click the Create as target asset button. This asset will be connected to the business model as a child asset. 7. In the connection panel, click Create and Connect. The asset is added to the business model and the Edit Asset Properties dialog box opens. 8. In the Edit Asset Properties dialog box, enter the relevant information, and then click Save. For a detailed description on asset properties, see "Asset Properties" on page 32. 9. To cancel the connection, in the connection panel, click Cancel. You can also drag the asset from the New tab and drop it on the parent asset in the map area. For example, to create a city asset under the My organization asset, drag the City asset from the left pane and drop it on the My organization asset in the map area. The following path is created: User Guide Chapter 2: Asset Profiling HP EnterpriseView (2.5) Page 26 of 265
  • 27.
    Authorize a Userto Work with an Asset By default, the Administrator has access rights to all assets and the asset owner is automatically authorized to work with the asset; all other users must be authorized manually. For detailed information on authorization, see "Business Model Authorization" on page 19. Note: You must have access rights to at least one asset in order to perform this task. To authorize a user to work with an asset 1. Click Assets > Asset Profiling. 2. Search for the asset to which you want to grant access rights, as described in "Search for an Asset" on page 29. 3. Click the asset in the search results, and then click the Edit Asset Properties button. 4. In the Edit Asset Properties dialog box, click the Authorized Users tab. 5. In the Search for Users or Groups box, enter the name or the partial name of the user or group that you want to add to the list of authorized users, and then click Add. 6. Click Save. The user that you added to the list now has access rights to the asset and all of its children. User Guide Chapter 2: Asset Profiling HP EnterpriseView (2.5) Page 27 of 265
  • 28.
    Connect an Assetto the Business Model You can connect unattached assets to the business model or connect assets that are already part of the business model to a different parent asset. There are two scenarios in which assets are saved as unattached in EnterpriseView: l Assets are saved as unattached the first time that they are imported from an external asset repository. After the business model is created, each subsequent synchronization automatically updates the business model for all existing assets, and only newly introduced assets are saved as unattached. l Assets that have been disconnected from the business model are also saved as unattached. To connect an asset to the business model 1. Click Assets > Asset Profiling. 2. In the left pane, click the Unattached tab and find the asset that you want to connect to the business model, or search for the asset, as described in "Search for an Asset" on the next page. 3. Click the Mark as target asset button. This asset will be connected to the business model as a child asset. The connection panel is displayed in the map area. 4. Search for the source (parent) asset, as described in "Search for an Asset" on the next page or click the asset in the map. 5. In the asset card of the source parent, click the Connect to another asset (mark as source asset) button. 6. In the connection panel, click Connect. The asset is added to the business model. 7. To cancel the connection, in the connection panel, click Cancel. Note: You can also drag the asset from the left pane and drop it on the parent asset in the map area. User Guide Chapter 2: Asset Profiling HP EnterpriseView (2.5) Page 28 of 265
  • 29.
    Search for anAsset You can search for a name or a partial name of any asset, either attached to the business model or unattached, in the Search tab. You can also search for an asset according to the user or group that is authorized to work on that asset. To search for an asset 1. Click Assets > Asset Profiling, and then, in the left pane, click the Search tab. 2. In the Search asset name box, enter the asset name or a partial asset name, and then press ENTER. The search results are displayed in the left pane. The two immediate parent assets are displayed next to each asset that is found. 3. Click Advanced to search by asset category or type. Select the category or type from the list, and then click Search. 4. To display the asset in the business model map, click the Show on Map button. To search for an asset by user or group 1. Click Assets > Asset Profiling, and then, in the left pane, click the Authorized User tab. 2. In the Search asset by user or group box, enter the name of the user or group according to which you want to search, and then press ENTER. The search results are displayed in the left pane. Note: Only assets on which the user or group are authorized to work on directly (as opposed to assets that inherited the access rights) are displayed. Filter Assets by a CPE You can filter assets by a CPE in order to create a business model view that is product or vendor specific. For example, you can create a filter that displays a segment of the business model that includes only servers that host an Oracle database. For more information on CPEs, see "Common Platform Enumeration" on page 20. The filter is applied to the entire Asset Profiling page. This means that if you filter the page and search for assets, you will receive search results out of the filtered results. User Guide Chapter 2: Asset Profiling HP EnterpriseView (2.5) Page 29 of 265
  • 30.
    To filter assetsby a CPE 1. Click Assets > Asset Profiling. 2. In the Asset Profiling page, in the Filter by CPEs box, enter the CPE  (vendor:product:version) or a partial CPE (vendor:product). The business model is collapsed. 3. Expand the business model to display the assets that are associated with the CPE. The assets that are displayed in the map in the business model are assets that are directly associated with the CPE and their parent assets. The full hierarchy is displayed. Disconnect an Asset from the Business Model To disconnect an asset from the business model you must delete the relationship between the asset and its parent. You can delete only relationships that you created within EnterpriseView. You cannot delete relationships that you imported from an external asset repository. If the asset has only one parent, then when it is disconnected, it is saved as unattached; the asset itself is not deleted. If the asset has more than one parent, then it remains in the business model. Disconnected assets can be reconnected to the business model at any time. To disconnect an asset from the business model 1. Click Assets > Asset Profiling. 2. Search for the asset that you want to disconnect, as described in "Search for an Asset" on the previous page. 3. In the Search tab, click the asset that you want to disconnect, and then click the Show on Map button. 4. In the map area, click the relationship between the asset that you want to disconnect and its parent asset, and then press DELETE. 5. Click Yes to confirm the action. The disconnected asset can be viewed in the Unattached tab in the left pane. Delete an Asset You can only delete assets created in EnterpriseView. In order to preserve the integrity of the business model, assets imported from an external asset repository cannot be deleted directly from User Guide Chapter 2: Asset Profiling HP EnterpriseView (2.5) Page 30 of 265
  • 31.
    EnterpriseView; they mustbe deleted in the system from which they originated. When the business model is next synchronized, the change will be displayed in EnterpriseView. To delete an asset 1. Click Assets > Asset Profiling. 2. Search for the asset that you want to delete, as described in "Search for an Asset" on page 29. 3. Click the asset that you want to delete and then click the Delete button or select the asset in the map and press DELETE. A confirmation message is displayed. Confirm this action by clicking Yes. Note: If you delete an asset that has children, then the asset is deleted and the children are saved as unattached. Add a CPE to an Asset You can add or remove CPEs that are associated with an asset. You can add CPEs only to asset that belong to the following categories: l Running Software l Infrastructure Element l IP  You can add CPEs only to assets that were created in EnterpriseView. CPEs that were imported from a CSV file or from ArcSight ESM cannot be removed and are read-only. To add a CPE to an asset 1. Click Assets > Asset Profiling. 2. Search for the asset to which you want to add a CPE, as described in "Search for an Asset" on page 29. 3. Click the asset in the search results, and then click the Edit Asset Properties button. 4. In the Edit Asset Properties dialog box, click the CPEs tab. 5. In the search box, enter a CPE (vendor:product:version) or a partial CPE (vendor:product). Note: To optimize your search, enter the full vendor and product name. User Guide Chapter 2: Asset Profiling HP EnterpriseView (2.5) Page 31 of 265
  • 32.
    6. Click Add. 7.Click Save. To remove a CPE from an asset 1. Click Assets > Asset Profiling. 2. Search for the asset from which you want to remove a CPE, as described in "Search for an Asset" on page 29. 3. Click the asset in the search results, and then click the Edit Asset Properties button. 4. In the Edit Asset Properties dialog box, click the CPEs tab. 5. From the list of CPEs, click the CPE that you want to remove, and then click the Remove this CPE from the asset button. 6. Click Save. Asset Properties The asset properties include the following information: l Asset General Properties The following table describes all of the properties for each asset category. l Authorized Users  You can add or remove users and groups that are authorized to work on the asset. For more information, see "Authorize a User to Work with an Asset" on page 27. l CPEs A CPE is an asset identifier. For more information, see "Common Platform Enumeration" on page 20. You can add or remove CPEs that are associated with the asset. CPEs that were imported from a CSV file or from ArcSight ESM cannot be removed and are read-only. You can filter assets according to their CPE, as described in "Filter Assets by a CPE" on page 29. User Guide Chapter 2: Asset Profiling HP EnterpriseView (2.5) Page 32 of 265
  • 33.
    Category Property Description GeneralName The name of the asset. It is displayed in the business model's graphic view along with the asset type icon. This field is mandatory. Description Additional information about the asset. Type The asset type. Source The source name for the Organization asset is System. The source name for assets created in EnterpriseView is empty. For assets imported from an external asset repository, the source name is the same as the connector name defined in the Configuration module. Owner The person responsible for the asset and who is contacted in situations requiring manual intervention. The asset owner is automatically authorized to work with the asset. Location Latitude The geographical coordinates of the asset's location. Longitude The geographical coordinates of the asset's location. Address The street address of the asset. ZIP Code The asset location ZIP code. City The city of the asset. State The state of the asset. Country The country of the asset. Criticality Level A numeric index, between 0 and 10, indicating the severity of a potential catastrophe and the probability of its occurrence. The default criticality level of all assets is 1. The criticality level of an asset affects the weight of its scores when policy assessment aggregation, risk aggregation, and vulnerability score aggregation are done. For more information, see "Weights and Criticality Level" on page 83, "Risk Score Aggregation Mechanism" on page 110, and "Asset Vulnerability Score Aggregation Mechanism" on page 147. Asset General Properties User Guide Chapter 2: Asset Profiling HP EnterpriseView (2.5) Page 33 of 265
  • 34.
    Category Property Description BusinessCriticality Level See above description. Value A numeric, monetary value. Infrastructure Element OS Name The operating system that is installed on the infrastructure element. OS Version The version of the operating system that is installed on the infrastructure element. Running Software Application Name The name of the application. Application Version The version of the application. IP DNS Name The server name as defined in the network DNS. MAC Address The server MAC address. IP Address The server IP address. People Role The role of the person or the group in the organization. Documents Version The version of the document. Purpose The purpose for which the document was created. Classification The type of document, such as legal or technical. Release Date The date on which the document was published. Asset General Properties, continued User Guide Chapter 2: Asset Profiling HP EnterpriseView (2.5) Page 34 of 265
  • 35.
    Asset Profiling Window TheAsset Profiling window enables you to create and maintain your organization's business model.The different areas and the functionalities available in each area are described in the following sections. For information on the EnterpriseView toolbar, see "Toolbar Description" on page 17. Map Area UI Element Description (Layout) Display the business model in a tree layout Displays the business model in a tree structured graph. (Layout) Display the business model in a circular layout Displays the business model in an interconnected ring and star topology. Optimize Layout Refreshes the layout of the business model in the graph. Fit to Window Resizes and displays the entire business model in the map area. You are Viewing The name of the view that is displayed. If there are multiple views, you can select a different view from the list. User Guide Chapter 2: Asset Profiling HP EnterpriseView (2.5) Page 35 of 265
  • 36.
    UI Element Description Save NewView Creates a new view based on the current business model view displayed in the map. Access this option by clicking the arrow next to the Save button. After you save the view, when you reopen the Asset Profiling page, the business model displayed in the map area is resized to the default zoom and to fit to window. Note: Assets that were disconnected from the business model are not displayed in the view. Views are user-specific; you cannot see views that other users created. For more information, see "Create a Business Model View" on page 24. Save Saves the changes that you made to the view displayed on the map. Filter by CPEs Filter the business model by a CPE. For more information, see "Filter Assets by a CPE" on page 29. Zoom Zooms the business model in and out. Refresh Refreshes the data on the page. Left Pane User Guide Chapter 2: Asset Profiling HP EnterpriseView (2.5) Page 36 of 265
  • 37.
    UI Element Description Search tabEnables you to search for a name or a partial name of any asset in EnterpriseView, connected to the business model or unattached. You can also search by asset category or type by clicking Advanced. Unattached tab Includes assets that have either been imported from an external asset repository and have not been connected to the business model or any asset that has been disconnected from the business model. New tab Displays all of the asset types according to categories. When you create a new asset in EnterpriseView you also connect it to the business model. Authorization Enables you to search for assets according to users or groups that are authorized to work with the assets. For more information, see "To search for an asset by user or group" on page 29. Delete Deletes the selected asset. You can delete only assets created in EnterpriseView. In order to preserve the integrity of the business model, assets imported from an external asset repository cannot be deleted directly from EnterpriseView; they must be deleted in the system from which they originated. When the business model is next synchronized, the change will be displayed in EnterpriseView. If you delete an asset that has children, then the asset is deleted and the children are saved as unattached. This button is available in: l Search tab l Unattached tab l Asset Card Show on Map Displays the asset in the business model in the map area. This button is disabled if the asset is unattached. This button is available in the Search tab. User Guide Chapter 2: Asset Profiling HP EnterpriseView (2.5) Page 37 of 265
  • 38.
    UI Element Description Edit AssetProperties Opens the Edit Asset Properties dialog box. For more information on asset properties, see "Asset Properties" on page 32. This button is available in: l Search tab l Unattached tab l Asset Card Connect to another asset (mark as source asset) Marks an asset as the parent asset when you connect an asset to the business model. A source asset must be attached to the business model. This button is available in: l Search tab l Asset Card Mark as target asset Marks an asset as the child asset when you connect it to the business model. A target asset can be unattached or already connected to the business model. This button is available in: l New tab l Unattached tab l Search tab after the source asset has been defined l Asset Card after the source asset has been defined Refresh Refreshes the business model to display any changes that might have occurred, for example, synchronization with an external asset repository. Available in all tabs. Collapse Collapses the left pane. User Guide Chapter 2: Asset Profiling HP EnterpriseView (2.5) Page 38 of 265
  • 39.
    UI Element Description Expand Expands theleft pane. Asset Card You can open the asset card by clicking on the asset in the business model map. The asset card includes the asset name, category and type. The following table includes the functionality available from the asset card. UI Element Description See "Delete" on page 37. See "Connect to another asset (mark as source asset)" on the previous page See "Mark as target asset" on the previous page. See "Edit Asset Properties" on the previous page. User Guide Chapter 2: Asset Profiling HP EnterpriseView (2.5) Page 39 of 265
  • 40.
    UI Element Description Expand Displaysthe direct children of the asset in the business model map. Click More > Expand. If the asset has more than 20 children, then the assets are not displayed automatically in order not to overload the business model. In this case, the Show Children on Map for Asset dialog box is displayed, enabling you to select the children you want to display. The number of direct children that an asset has is displayed in the business model map by the asset name. You can also expand by double-clicking the asset. Note: You cannot expand an asset that has more than 1000 children in the business model. If you attempt to expand such an asset, you will receive an error message. Collapse Hides the direct children of the asset in the business model map. Click More > Collapse. You can also collapse by double-clicking the asset. Show Parents Displays the parent assets of the asset in the business model map. Click More > Show Parents. Hide Parents Hides the parent assets of the asset in the business model map. Click More > Hide Parents. Open Properties Displays properties in read-only mode. For more information on asset properties, see "Asset Properties" on page 32. Close Properties Closes properties view. User Guide Chapter 2: Asset Profiling HP EnterpriseView (2.5) Page 40 of 265
  • 41.
    Mini-Map When the businessmodel is expanded to a larger size than the map area, you can navigate it by clicking and dragging in the mini-map area. To expand or collapse the mini-map, click the Expand/Collapse button. User Guide Chapter 2: Asset Profiling HP EnterpriseView (2.5) Page 41 of 265
  • 42.
    Chapter 3: Policyand Compliance Organizations must fulfill a set of legal, statutory, regulatory, and contractual requirements in order to satisfy their trading partners, contractors, service providers, and socio-cultural environment. These requirements are bound in policies. EnterpriseView provides a set of integrated components that create a complete security policy compliance management framework. The following components comprise the stages of policy management: l Policy creation and library The EnterpriseView policy library includes out-of-the-box policies, such as NIST800-53 (revision 3), PCI DSS v2.0, and HIPAA Security Rule (NIST), and a Unified Compliance Framework (UCF) 2013 Q1 release. UCF contains a comprehensive set of IT regulatory compliance controls compiled from hundreds of industry standard polices such as PCI, HIPAA ,and ISO/IEC 27001, allowing you to assess once and comply with many. For more information, see "About Unified Compliance Framework" on the next page. EnterpriseView Policy Builder includes a highly configurable policy template for defining in- house policies, as described in "Create a Policy" on page 45. The policy template can be easily simplified or enhanced. It can be configured to include basic control definitions, blocks of text for emulating the different parts of traditional industry standard policy books (such as sections and chapters on various levels) or it can be more comprehensive, including parameters such as auditing attributes (for example: priority, GRC designation, type, and purpose). Control maturity and compliance acceptance levels are derived from the maturity and compliance score ranges, defined, and can be edited in the Policy Builder. For more information, see "Configure Compliance and Maturity Score Ranges" on page 63. l Policy Mapping EnterpriseView policy mapping enables you to perform policy compliance assessments on assets for a single policy and create compliance reports for multiple policies, saving you the effort of assessing the compliance for each policy to which your organization is obligated. For more information, see "Policy Mapping" on page 59. l Control to Vulnerability Mapping EnterpriseView enables you to map controls, from any policy, to any vulnerability defined in the vulnerability dictionary in order to refine or determine asset compliance scores. Configuration vulnerabilities can be used to automatically determine compliance, while network and application vulnerabilities can be used to refine a score applied either manually or automatically. For more information, see "Control to Vulnerability Mapping" on page 54. l Setting Statements of Applicability (SoA) The SoA identifies the controls chosen for the assets in the organization. The SoA is derived from the output of the risk assessment and directly relates the selected controls back to the HP EnterpriseView (2.5) Page 42 of 265
  • 43.
    original risks theyare intended to mitigate. Both industry standard and in-house controls can be applied, as described in "Set Statement of Applicability" on page 48. Applied controls are trickled down to lower-level assets and can be viewed at any point on the business model hierarchy, but can also be overridden for specific assets. Controls that are not applicable are also defined, complying with industry best practices. l Auditing EnterpriseView enables you to assess policy compliance and control maturity for all assets that comprise your organization's business model, as described in "Audit Assets" on page 50. EnterpriseView applies a Control Maturity Model, which is aligned primarily with the widely adopted Capability Maturity Model (CMM), in order to benchmark IT processes, performance, and capability, performed through the Policy Assessment module. The Control Maturity Model is implemented by a scoring method that is based on five factors that make up the overall control score. This scoring method results in a higher level of quality in the deployment of a security control on an asset. For more information, see "P5 Control Maturity Model Guidelines" on page 76. The policy assessment module also supports control audit annotation and attachments. About Unified Compliance Framework Unified Compliance Framework (UCF) is an industry-vetted compliance database that includes a comprehensive set of IT regulatory compliance controls from hundreds authority documents, such as PCI, HIPAA,and ISO/IEC 27001. UCF eliminates overlapping controls and bridges the gaps between the different authority documents, providing you with a harmonized list of controls. In EnterpriseView, UCF is portrayed as a single policy, allowing you to assess one policy while complying with the many policies to which your organization is obligated. The structure of the UCF policy in EnterpriseView is a simplified version of the original framework, which includes main security categories containing a flat list of controls. The controls are grouped according to main security categories (known as Impact Zones in UCF) and include their control ID. The following table includes the mapping between EnterpriseView policy elements and their corresponding elements in UCF. User Guide Chapter 3: Policy and Compliance HP EnterpriseView (2.5) Page 43 of 265
  • 44.
    EnterpriseView UCF AdditionalInformation Policy Authority Document In the original framework, every control includes Citations. Each citation includes a reference to an authority document that has this control or a similar, corresponding control. In EnterpriseView, UCF is represented as a policy entity. The various authority documents, such as PCI, HIPAA, and ISO/IEC 27001, are not represented as standalone policies. Instead, they are used to filter controls when creating the Statement of Applicability, as described in "Set Statement of Applicability" on page 48 and for reporting purposes. Main Security Category Impact Zone UCF includes impact zones, such as: l Leadership and High Level objectives l Audit and Risk Management l Product Design and Development l Acquisition of Technology l Operational Management l Human Resources Management l Records Management l Technical Security l Physical Security l Systems Continuity l Monitoring and Reporting l Privacy l System Hardening Through Configuration Management Control Text Control Statement In some cases when a Control Statement does not exist, then the control text reflects the Policy Statement. Title Control Title User Guide Chapter 3: Policy and Compliance HP EnterpriseView (2.5) Page 44 of 265
  • 45.
    Manage Policies This sectionincludes information about how to manage policies. Create a Policy 45 Activate a Policy 47 Import a Policy 47 Delete a Policy 48 Create a Policy EnterpriseView includes the Unified Compliance Framework, as described in "About Unified Compliance Framework" on page 43. You can also create your own policies. When you create a new policy, you can decide on the complexity of its format and you can configure the control template to suit the needs of your organization and the specific policy. Creating the policy is a two-step process: 1. Create the policy and configuring the policy template. We recommend planning the policy template in advance. However, you can modify the template at any time. 2. Add content to the policy. After you have created a new policy, if you want to begin working with the policy, you need to activate it, as described in "Activate a Policy" on page 47. You can fully modify policies that you created in EnterpriseView. For out-of-the-box policies or imported policies, you can modify the control template and add guidelines to controls, but you cannot modify the content of the policy. To create a new policy and configure the policy template 1. Click Policy and Compliance > Policy Builder. 2. On the Policy Builder tab, click Create Policy. 3. In the Template page, do the following, and then click Save or Save and Activate: a. In the Policy Name box, enter a name for the policy. b. In the Policy Description box, enter a description for the policy. c. In the Control Template area, select the attributes relevant for this policy according to the information available in the Template tab, as described in "Policy Builder Window" on page 64. User Guide Chapter 3: Policy and Compliance HP EnterpriseView (2.5) Page 45 of 265
  • 46.
    To add contentto the policy 1. Click Policy and Compliance > Policy Builder. 2. In the Policy Builder page, in the left pane, click the Content tab. In the left pane, from the policy drop-down list, select the policy to which you want to add content. 3. Follow these steps to add a Main Security Category. For more information on policy attributes, see "Policy Builder Window" on page 64. a. In the left pane, click the New Main Security Category button. b. In the right pane, enter the following information, and then click Save: o Paragraph Number: Can be any alphanumeric string, up to 255 characters. o Title: Of the security category. o Text:  Any additional text explaining this security category. 4. Add more security category levels, if required: a. In the left pane, click the security category to which you want to add another level, and then click the New Security Category button. b. In the right pane, enter the paragraph number, title, and text. c. Click Save. 5. Add controls to the security categories, as required: a. In the left pane, click the security category to which you want to add the control, and then click the New Control button. b. In the left pane, enter basic control information, as described in "Policy Builder Window" on page 64. If required, expand Guidelines and Additional Auditing Information to enter additional control information. c. Click Save. 6. Repeat steps 3 through 5 to complete the policy content. User Guide Chapter 3: Policy and Compliance HP EnterpriseView (2.5) Page 46 of 265
  • 47.
    Activate a Policy Youmust activate a policy before you can start working with it. Policies that you do not activate are not displayed in any of the pages that belong to the Policy and Compliance module, except for the Policy Builder. There are two ways to activate a policy:  l Through the policy builder. We recommend this option when you want to create a policy and immediately activate it. l Through the EnterpriseView Settings dialog box. We recommend this option for managing the state of all the policies in EnterpriseView. To activate a policy through the Policy Builder 1. If you have not just created the policy, click Policy and Compliance > Policy Builder and from the top left pane, select the policy that you want to activate. 2. Click the Settings tab, and then select the Activate Policy check box. 3. Click Save. To activate a policy through the EnterpriseView Settings dialog box 1. On the EnterpriseView toolbar, click Settings. 2. In the Settings dialog box, click Policy and Compliance > Policy Administration. 3. In the Policy Administration page, select the check boxes of the policies that you want to work with. 4. If you want to work with UCF authority documents, select the Unified Compliance Framework check box, and then select the authority documents with which you want to work. n You can search for a specific authority documents or sort them by Name or by Selected Items. n You can select the Select All check box to automatically select all the authority documents displayed on the page. If you already filtered the list, then only the filtered results are selected. 5. Click Save. Import a Policy You can import policies in XML format from your local computer into EnterpriseView. The XML file must match the XML Schema Definition (XSD), which you can find in the following location: User Guide Chapter 3: Policy and Compliance HP EnterpriseView (2.5) Page 47 of 265
  • 48.
    <server_URL>/redcat/content/policy.xsd Note: l The paragraphnumbers of all the policy elements in the XML must be unique. l Policy names in EnterpriseView are unique; you cannot import a policy that already exists. To import a policy 1. Click Policy and Compliance > Policy Builder, and then click Import Policy. 2. In the Select file to upload by dialog box, navigate to the location of the file, select the file, and then click Open. 3. After the policy is imported, you are prompted to activate the policy. Delete a Policy Note: You cannot restore a deleted policy. Out-of-the-box policies and policies that are in an assessment process cannot be deleted. If you delete a policy that is mapped to another policy, then these mappings are deleted. To delete a policy 1. Click Policy and Compliance > Policy Builder. 2. In the left pane, from the policy list, select the policy that you want to delete, and then, on the top right-hand side, in the Policy Toolbar, click Delete Policy. 3. A confirmation message is displayed. Click OK to confirm this action. Set Statement of Applicability You can apply controls to assets, which will be assessed during the auditing phase. Once applied, controls are automatically trickled down to all lower-level (children) assets. You can override these settings and reapply controls to the lower-level assets. Note: After an asset has entered the assessment process (at least one control that is applied to the asset is already assessed for a specific policy), then none of the controls that are applied to this asset can be removed. However, controls that are not applied to this asset can be applied at any time. User Guide Chapter 3: Policy and Compliance HP EnterpriseView (2.5) Page 48 of 265
  • 49.
    To comply withindustry best practices, we recommend explicitly identifying controls that are not applicable to the asset. To apply controls to assets 1. Click Policy and Compliance > Statement of Applicability. 2. In the Statement of Applicability page, in the left pane, in the Organization tab, expand the business model tree and locate the asset for which you want to set applicability. You can also search for an asset, as described in "Search for an Asset" on page 29. 3. In the Unassigned Controls pane, from the policy list, select the required policy. All of the controls that belong to this policy but have not yet been assigned to the asset that you have selected are displayed below the policy. The controls are grouped according to their security category. 4. Click next to the security category to expand and display the controls. The number of unassigned controls in the security category is displayed. For example, (12/12) means that 12 out of 12 controls that belong to the security category are not yet assigned to the asset that you have selected. 5. If you select the Unified Compliance Framework policy, then you can filter the results according to a specific authority document or policy in EnterpriseView. For more information, see "About Unified Compliance Framework" on page 43. Enter the name of the authority document in the Filter by authority document box. The results are filtered accordingly. 6. From the list of controls, do the following: a. Drag the controls that you want to apply to the asset to the Applied to Asset area. You can drag an entire security category or a main security category. b. Drag the controls that are not applied to the asset to the Not Applied to Asset area. c. Drag controls or security categories between the Applied to Asset area and the Not Applied to Asset area, as needed. The controls that you applied to the asset are automatically applied to all its child assets. All controls that inherit their applicability from their parent asset are marked with the Inherited from: <asset> icon. If you decide that a policy, a control, or a set of controls are no longer relevant to an asset, then you can return the controls to the Unassigned Controls pane. The controls are removed from all children. You can override these settings and reapply controls to any asset, as described in the following procedure. To override control applicability 1. Click Policy and Compliance > Statement of Applicability. User Guide Chapter 3: Policy and Compliance HP EnterpriseView (2.5) Page 49 of 265
  • 50.
    2. In theStatement of Applicability page, in the left pane, in the Organization tab, expand the business model tree and locate the asset for which you want to override applicability. You can also search for an asset, as described in "Search for an Asset" on page 29. 3. Make the necessary changes by dragging the controls from the Applied to Asset area to the Not Applied to Asset area and vice versa. Controls for which applicability has been overridden are marked with the Inheritance Exception: <asset> icon. Audit Assets EnterpriseView enables you to apply a quantitative assessment to assets on two levels: l Asset Compliance: Helps assess compliance with a policy control. l Control Maturity: Helps identify capability gaps. These gaps can be demonstrated to management, and action plans can then be developed to bring these controls up to the desired capability target level. There are a number of methods to assess asset compliance and control maturity. The following table includes a description of the assessment types. Method Description Manual The score is applied manually. A manual assessment overrides all automatic assessment methods. Automatic External systems (REST API) The score is imported from an external system, such as HP Server Automation (SA). Scores from external systems have precedence over configuration vulnerabilities and aggregation. Configuration vulnerabilities Relevant only for compliance assessment. Under certain circumstances, configuration vulnerabilities determine the compliance score. For more information, see "Control to Vulnerability Mapping" on page 54. Scores from configuration vulnerabilities have precedence over aggregation. Aggregation The default score. The aggregate score of a control is overridden by any other assessment method. For more information, see "Control Scores Aggregation Mechanism" on page 77. Assessment Methods The precedence of the assessment methods is as follows: User Guide Chapter 3: Policy and Compliance HP EnterpriseView (2.5) Page 50 of 265
  • 51.
    If the controlthat you are assessing is mapped to another control and they are both applied to the asset, then an indication that the control is mapped is displayed, and you can access the mapped control details. To assess asset compliance, see "Assess Asset Compliance" below. To assess control maturity, see "Assess Control Maturity" on the next page. Assets are assessed in the Policy Assessment window. For more information, see "Policy and Compliance Assessment Window" on page 70. When assessments are obsolete, you can clear them, as described in "Clear Assessment on Assets" on page 54. Assess Asset Compliance For information on the different assessment methods, see "Assessment Methods" on the previous page. To assess compliance 1. Click Policy and Compliance > Assessment. 2. In the left pane, click Select an Asset, expand the asset tree, and click the asset that you want to assess. Alternatively, search for the asset by entering its name. Click OK. The policies that are relevant to this asset (those that have at least one control assigned to the asset) are displayed in the left pane. 3. From the left pane, select the required policy. Expand the policy, and then click the control that you want to assess. The Assessment tab opens in the right pane. 4. In the right pane, in the Compliance Assessment area, click the Edit Base Compliance Score button. 5. In the Edit Compliance Assessment dialog box, select one of the following options, and then click Save: n Manual: In the box, enter a score between 0-100, or use the slider. n Automatic: The score is provided by the system, depending on the available assessment methods. to learn more, see "Assessment Methods" on the previous page. User Guide Chapter 3: Policy and Compliance HP EnterpriseView (2.5) Page 51 of 265
  • 52.
    6. Select theIgnore Vulnerabilities check box, if you want to disable the affect of vulnerabilities mapped to this control. Network or application vulnerabilities can affect the compliance score only under certain circumstances. For more information, see "Use Network and Application Vulnerabilities to Refine Compliance Score" on page 56. 7. In the Implementation Details box, enter the details of how you implemented this control. 8. Click Save. If there are network and application vulnerabilities mapped to the control, then the compliance score is automatically recalculated (reduced) to include the impact of the vulnerabilities. For more information, see "Control to Vulnerability Mapping" on page 54. The Compliance Score is trickled up and aggregated to higher-level assets for every applied control. The value is displayed in the left pane in the asset tree. For more information, see "Control Scores Aggregation Mechanism" on page 77. The date and time of this assessment is updated in the Last Updated On field. Assess Control Maturity Review the P5 Control Maturity Model Guidelines, as described in "P5 Control Maturity Model Guidelines" on page 76 in order to determine the appropriate control maturity score to apply to each maturity factor. To assess control maturity 1. Click Policy and Compliance > Assessment. 2. In the left pane, click Select an Asset, expand the asset tree, and click the asset that you want to assess. Alternatively, search for the asset by entering its name. Click OK. The policies that are relevant to this asset (those that have at least one control assigned to the asset) are displayed in the left pane. 3. From the left pane, select the required policy. Expand the policy, and then click the control that you want to assess. The Assessment tab opens in the right pane. 4. In the right pane, in the Maturity Assessment area, click the Edit P5 Maturity Factor Scores button. The Maturity Score is a weighted average of all maturity factors. Maturity factor weights are defined in the policy template. For more information, see "P5 Applicability Weights" on page 66. User Guide Chapter 3: Policy and Compliance HP EnterpriseView (2.5) Page 52 of 265
  • 53.
    5. In theEdit Maturity Assessment dialog box, select the maturity factor that you want to assess. In the following example, the People factor is selected. 6. Select one of the following options, and then click Save: n Manual: In the box, enter a score between 0-5, or use the slider. Review the P5 Control Maturity Model Guidelines, as described in "P5 Control Maturity Model Guidelines" on page 76 in order to determine the appropriate control maturity score to apply to each maturity factor. n Automatic: The score is provided by the system, depending on the available assessment methods. To learn more, see "Assessment Methods" on page 50. The maturity score is calculated, in addition to the maturity assessment progress, which reflects how many maturity factors have been assessed. Each maturity factor counts for a percentage of the overall score, depending on the number of maturity factors employed. For example, if all maturity factors are employed, then each factor counts for 20% of the overall score. If two out of the five maturity factors have been assessed, then the maturity assessment progress will be 40%. The scores and progress are displayed in the Control Data area. For more information, see "Policy and Compliance Assessment Window" on page 70. The Maturity Score and the Maturity Progress are trickled up and aggregated to higher- level assets for every applied control. Their values are displayed in the left pane in the asset User Guide Chapter 3: Policy and Compliance HP EnterpriseView (2.5) Page 53 of 265
  • 54.
    tree. For moreinformation, see "Control Scores Aggregation Mechanism" on page 77. The date and time of this assessment is updated in the Last Updated On field. Clear Assessment on Assets You can clear assessments on assets for outdated audits. This action can be performed only by users who have access rights to the Organization asset. This action is performed on the entire business model, meaning that the assessments on all assets are cleared for the policies that you select. This action invokes the Archive Trend Data Job. For more information on this job, see the Archive Trend Data section in the HP EnterpriseView Administration Guide. Note: When you clear assessments, they are deleted permanently. Notes or attachments connected to these assessments are also deleted. This action cannot be reversed. To clear assessments 1. Click Policy and Compliance > Assessment. 2. On the Policy and Compliance Assessment window, click Clear Assessment. 3. On the Clear Assessment dialog box, select the policies for which you want to clear assessments, and then click OK. This action might take a few minutes. Refresh the page to see the changes. Control to Vulnerability Mapping There is an inherent correlation between vulnerabilities and policy controls. Vulnerabilities are a factor throughout the life cycle of a control. A vulnerability may be the primary cause for defining a control, its existence or lack of it may affect the organization's decision of applying a control, and its persistence affects the level of compliance of a control. A vulnerability score can be used to determine the compliance score or to refine it, depending on the vulnerability type: l Determine: Configuration vulnerabilities determine the base compliance score. For more information, see "Use Configuration Vulnerabilities to Determine Compliance Score" on the next page. l Refine: Network and application vulnerabilities refine the compliance scores, Meaning that they alter the base compliance score and are reflected in the final compliance score. For more User Guide Chapter 3: Policy and Compliance HP EnterpriseView (2.5) Page 54 of 265
  • 55.
    information, see "UseNetwork and Application Vulnerabilities to Refine Compliance Score" on the next page. A control can be mapped to more than one vulnerability and more than one vulnerability type. This means that, theoretically, a control's base compliance score can be determined by a configuration vulnerability and then refined by network and application vulnerabilities, resulting in the final compliance score. EnterpriseView includes out-of-the-box mappings between vulnerabilities defined in the vulnerability dictionary and the policies provided with EnterpriseView. These mappings represent the correlation between controls and vulnerabilities. Vulnerabilities automatically affect the compliance score of a control when the following conditions occur: l The vulnerability is mapped to the control l The control is applied to an asset l The vulnerability is attached to the asset Through the Control to Vulnerability mapping page (Policy and Compliance > Control to Vulnerability mapping page, you can search for specific mappings using free text. Note: You can perform wildcard searches. For example, if you type ser*, the results will contain words beginning with ser (such as server and service). An asterisk cannot be placed before a string (*ser). You can add new mappings, edit existing mappings, or delete mappings. For more information, see "Map Controls to Vulnerabilities " on page 57, "Edit Control to Vulnerability Mapping" on page 57, and "Delete Vulnerability to Control Mapping" on page 58 respectively. Use Configuration Vulnerabilities to Determine Compliance Score You can use configuration vulnerabilities to determine compliance scores. Configuration vulnerabilities are considered an automatic scoring method, along with assessments imported from external systems. You can override the score manually. For more information on the different assessment methods, see "Audit Assets" on page 50. There can be more than one configuration vulnerability mapped to a control. Each vulnerability can have a different check result: passed, failed, or unknown. For more information on check results, see "Score" on page 140. The formula that is used to determine the compliance score for an asset for a control is the sum of passed and unknown configuration vulnerabilities divided by the sum of passed, unknown, and failed vulnerabilities multiplied by their weights (1,2, and 4 accordingly). User Guide Chapter 3: Policy and Compliance HP EnterpriseView (2.5) Page 55 of 265
  • 56.
    *100 n n n n*4+ * 1+ * 2 Passed Vul nerabilities nUnknown Vulnerabilities Failed Vul nerabilities Passed Vul nerabilities UnknownVul nerabilities + Examples: l If there is one passed configuration vulnerability, then the score is 100. l If there is one unknown configuration vulnerability, then the score is 50. l If there is one failed configuration vulnerability, then the score is 0. Use Network and Application Vulnerabilities to Refine Compliance Score You can use network and application vulnerabilities to refine compliance scores. The compliance score is affected as follows: l If the control is either manually or automatically assessed, then the vulnerability lowers the control's compliance score. The following indication is displayed on the screen below the compliance score: "Score is affected by <n> vulnerabilities. Reduced by m%." You can click the "n vulnerabilities" link to view the details of the vulnerabilities that are mapped to the control. For more information, see "Score is affected by <n> vulnerabilities " on page 75. l If the control is not assessed, then its compliance score is changed from Not Assessed to "0". Note: This feature can be disabled for each control by selecting the Ignore Vulnerabilities check box in the Policy Assessment window, as described in "Policy and Compliance Assessment Window" on page 70. Most mappings are between a control and a group of vulnerabilities rather than between a control and an individual vulnerability. Vulnerabilities are grouped according to different vulnerability categories. EnterpriseView adopted the Common Weakness Enumeration (CWE) system for identifying most vulnerability groups. Other vulnerability groups are internal and can be identified by an "EVG" prefix. The formula that is used to determine the impact of vulnerabilities on a control's compliance score considers the following variables: l The vulnerability score. For more information on the vulnerability score, see "Vulnerability Properties" on page 140. There is a negative correlation between the vulnerability score and the control's compliance score; the higher the vulnerability score, the lower the compliance score will be. User Guide Chapter 3: Policy and Compliance HP EnterpriseView (2.5) Page 56 of 265
  • 57.
    l The numberof vulnerabilities that are mapped to the control. l The weight of the vulnerability with the highest score. Map Controls to Vulnerabilities You can add new control to vulnerability mappings. To map a control to vulnerabilities 1. Click Policy and Compliance > Control to Vulnerability Mapping. 2. On the Control to Vulnerability Mapping page, click Add Mapping. 3. On the Select a Control page, do the following:  a. From the Policy list, select a policy. b. Expand the policy tree and select the control that you want to map. c. Click Next. 4. On the Select Vulnerabilities page, do the following: a. From the Select vulnerability type list, select either Network and Application or Configuration. b. if you selected Network and Application, then select one of the following options: o Groups: Select groups of vulnerabilities to map to a control. o Vulnerabilities: Select individual vulnerabilities to map to a control. c. From the list, select the group (for network and application only) or vulnerability that you want to map to the control, and then click the Add to Mapping button. To remove groups (for network and application only) or vulnerabilities from the mapping, click the Remove from Mapping button. 5. Click Finish. Edit Control to Vulnerability Mapping You can edit existing control to vulnerabilities mappings. User Guide Chapter 3: Policy and Compliance HP EnterpriseView (2.5) Page 57 of 265
  • 58.
    To edit amapping 1. Click Policy and Compliance > Control to Vulnerability Mapping. 2. On the Control to Vulnerability Mapping page, select the mapping that you want to edit, and then click Edit Mapping. You can search for specific mappings by using free text search. Note: You can perform wildcard searches. For example, if you type ser*, the results will contain words beginning with ser (such as server and service). An asterisks cannot be placed before a string (*ser). 3. To add vulnerabilities, on the Edit Mapping dialog box, do the following: a. From the Select vulnerability type list, select either Network and Application or Configuration. b. If you selected Network and Application, select either Groups or Vulnerabilities. c. From the list of groups (only for network and application) or vulnerabilities, select the group or vulnerability that you want to map to the control, and then click the Add to Mapping button. 4. To remove groups (only for network and application) or vulnerabilities from the mapping, click the Remove from Mapping button. 5. Click Finish. Delete Vulnerability to Control Mapping You can delete both user-created and out-of-the-box mappings. To delete a mapping 1. Click Policy and Compliance > Control to Vulnerability Mapping. 2. On the Control to Vulnerability Mapping page, select the mapping that you want to delete, and then click the Delete Mapping button. You can search for specific mappings using free text. 3. Click Yes to confirm the action. User Guide Chapter 3: Policy and Compliance HP EnterpriseView (2.5) Page 58 of 265
  • 59.
    Policy Mapping EnterpriseView allowsyou to map controls from one policy to another policy. For more information on mapping policy controls, see "Map Controls" on the next page. When assets are being assessed by auditors, if a control is mapped to another control and both controls are applied to the asset, then the auditor can access the details of the mapped control (for both source controls and target controls) from the Policy Assessment window. This capability helps you reduce the effort of assessing the compliance for each and every policy to which your organization is obligated. EnterpriseView includes mappings between controls in the Unified Compliance Framework (UCF)  policy and the controls of the rest of the policies provided with EnterpriseView. You can import mappings between UCF and policies that are not included in your EnterpriseView package, such as ISO/IEC 27001 and ISO/IEC 27002. For more information on obtaining this content, contact your EnterpriseView representative. For more information on importing UCF mappings, see "Import UCF Mappings" below. About the Policy Mappings Import Job The Policy Mappings Import Job imports mappings between UCF controls and controls of other policies into the EnterpriseView database, as follows: Note: The job can import multiple files. Each file is handled separately. As such, it is possible for one file to be imported successfully, while another import fails. To verify the status of each file, refer to the following log: <EnterpriseView Installation Folder>logsredcat.log 1. The process opens the first file from the following location: <EnterpriseView Installation Folder>contentpolicyMapping 2. The process identifies the policy that is mapped to UCF. The name of the policy in the file must match the name of the policy in EnterpriseView. 3. The process copies all the mappings into the EnterpriseView database. The control data in the file must be identical to the control data in EnterpriseView. If it is not identical, the import of the file fails. 4. If there is another mappings file, the process proceeds to the next file. Import UCF Mappings You can import mappings between UCF and policies that are not included in your EnterpriseView package, such as ISO/IEC 27001 and ISO/IEC 27002. For more information on obtaining this content, contact your EnterpriseView representative. User Guide Chapter 3: Policy and Compliance HP EnterpriseView (2.5) Page 59 of 265
  • 60.
    Before you begin,make sure that the policies for which you are importing mappings, are in EnterpriseView. For information on importing policies, see "Import a Policy" on page 47. To import UCF mappings 1. Copy the mapping files to the following location: <EnterpriseView Installation Folder>contentpolicyMapping 2. Run the PolicyMappingsImportJob from the Job Management module, as described in the Launch Batch Jobs Manually section in the HP EnterpriseView Administration Guide. For more information on the Policy Mappings Import Job, see "About the Policy Mappings Import Job" on the previous page. Map Controls Control mapping is a two-way mapping; controls from policy A are mapped to controls from policy B and vice versa. To map controls between policies 1. Click Policy and Compliance > Policy Mapping. 2. In the Policy A pane, from the Select a policy list, select a policy. The security categories of the policies are displayed. Expand the security categories to display their controls. Controls in policy A that are not mapped appear in bold. 3. In the Policy B pane, from the Select a policy list, select a policy. The security categories of the policies are displayed . Expand the security categories to display their controls. 4. From the Policy A pane, from the list of controls, select the control that you want to map, and drag it to the A column in the Mapped Controls table or click Map . The control that you added to the mapping is displayed in a regular font style (not bold) in the policy tree in the Policy A pane. Note: You cannot add controls to the Mapped Controls table until both Policy A and Policy B are selected. 5. From the Policy B pane, from the list of controls, select the control that you want to map, and drag it to the B column in the Mapped Controls table that reads "Drag here", or click Map. The Mapped Controls table displays only the paragraph number of the control; it does not display the control title. User Guide Chapter 3: Policy and Compliance HP EnterpriseView (2.5) Page 60 of 265
  • 61.
    6. Repeat steps4 and 5 until all of the required controls are mapped. A control from policy A is displayed only once in the Mapped Controls table, even if it is mapped to more than one control from policy B. However, if more than one control from policy B is mapped to the same control from policy A, then all of the controls from policy B are displayed in the same table cell. Search for Controls You can search for mapped or unmapped controls. To search for controls 1. Click Policy and Compliance > Policy Mapping. 2. You can search for controls in policy A and in policy B. Do one of the following: a. In the Policy A pane, from the Select a policy list, select a policy. In the Search Controls box, enter the control paragraph number, title or both. You can also enter a partial search string. b. In the Policy B pane, from the Select a policy list, select a policy. In the Search Controls box, enter the control paragraph number, title, or both. You can also enter a partial search string. To search for mapped controls 1. Click Policy and Compliance > Policy Mapping. 2. In the Policy A pane, from the Select a policy drop-down list, select a source policy, and in the Policy B pane, from the Select a policy drop-down list, select a policy. All of the control mappings between the two policies that you selected are displayed. 3. In the Mapped Controls pane, in the Search Controls box, enter the paragraph number of any control from either policies. You can also enter a partial search string. Note: The search field is not case-sensitive. Delete Mapping Between Controls You can delete mappings between the controls of various policies. Note: Changes made to control mapping might be reflected in policy assessment reports. User Guide Chapter 3: Policy and Compliance HP EnterpriseView (2.5) Page 61 of 265
  • 62.
    To delete amapping between controls 1. Click Policy and Compliance > Policy Mapping. 2. In the Mapped Controls table, locate the mapping that you want to delete. You can use the Search Associated Controls box to filter the mappings. For more information, see "Search for Controls" on the previous page. 3. Click the Delete Mapping button. A confirmation message is displayed. Confirm this action. The mapping is deleted from the Mapped Controls table. Policy Mapping Window The Policy Mapping window enables you to map controls between two policies. For more information, see "Policy Mapping" on page 59. The different areas and the functionalities available in each area are described in the following sections. For information on the EnterpriseView toolbar, see "Toolbar Description" on page 17. UI Element Description Click this button to add the selected control to the Associated Control table. This button is enabled only when you have selected both policy A and policy B and when an unmapped control in the policy A is selected. You can also drag and drop controls to the Mapped Controls table. For more information, see "Map Controls" on page 60. Click a control and then click this button to display the control details. <Search Controls> This page provides three different search options: l Search Controls (policy A). Search within the list of controls that belong to policy A, both mapped and not mapped. l Search Controls (policy B). Search within the list of controls that belong to the policy B, both mapped and not mapped. l Search Associated Controls. Search for controls that are already mapped, from the Mapped Controls pane. For more information, see "Search for Controls" on the previous page. User Guide Chapter 3: Policy and Compliance HP EnterpriseView (2.5) Page 62 of 265
  • 63.
    UI Element Description Click thecontrol that you want to delete from the A column in the Mapped Controls pane, and then click this button. For more information, see "Delete Mapping Between Controls" on page 61. <% controls mapped> The percentage of controls from policy B that are mapped to controls in policy A. Displayed on the bottom of the Policy B pane. <Controls not mapped:> The number of controls from policy A that are displayed in the Mapped Controls table, but do not have a control from policy B mapped to them. This indication helps you manage your mappings by filtering controls that are in the process of being mapped and for which mapping has not been completed. To the left, you can also see a list of these controls, by control paragraph number. Click in the list, and then select the control to which you want to navigate to in the Mapped Controls table. Go to previous unassociated control / Go to next unassociated control This button helps you navigate between controls in policy A that are displayed in the Mapped Controls table but that do not have a control from policy B mapped to them. Configure Compliance and Maturity Score Ranges You can configure the ranges for the score severity indication for compliance and maturity scores. Scores are displayed with one of the following icons: High score Medium score Low score This configuration is reflected throughout the application wherever these scores are displayed. For example, in the Policy and Compliance Assessment page. To configure maturity and compliance score ranges 1. On the EnterpriseView toolbar, click the Settings button. 2. In the Settings dialog box, click Policy and Compliance > Compliance and Maturity Score Ranges. User Guide Chapter 3: Policy and Compliance HP EnterpriseView (2.5) Page 63 of 265
  • 64.
    3. In theCompliance and Maturity Score Ranges page, drag the slider to define the ranges for maturity or compliance score, and then click Save. Policy Builder Window The Policy Builder window enables you to define new policies according to a configurable template, edit existing policies, delete policies, import policies, and create reports. The different areas and the functionalities available in each area are described in the following sections. For information on the EnterpriseView toolbar, see "Toolbar Description" on page 17. Policy Builder Toolbar UI Element Description <Policy list> Select a policy from the list. Content tab See "Content Tab" on page 66 Template tab See "Template Tab" below Import Policy Click this button to import a policy. For more information, see "Import a Policy" on page 47. Create Policy Click this button to create a new policy. For more information, see "Create a Policy" on page 45. Delete Policy Click this button to delete a policy. This button is disabled if the assessment process has begun (meaning that at least one control that is applied to an asset is assessed). Note:  If you delete a policy that includes controls that are already assigned to an asset, whether the controls are applied to the asset or not, then the assignment and any related assessment are deleted. Policy Builder Toolbar Template Tab User Guide Chapter 3: Policy and Compliance HP EnterpriseView (2.5) Page 64 of 265
  • 65.
    Use this screento configure the control template for each policy that you create. UI Element Description Control Text Guideline Introduction Guidelines Guideline Additional Text Control Additional Text The Basic attributes include content elements. Selecting an attribute adds a text box to the control in which you can add content. For example, if the control has numerous guidelines, you can select the Guidelines attribute. If you add Guidelines to your template, when you create the content for the policy, you will have the option of adding tags (short, descriptive text) to the guidelines. You can remove a tag by clicking the X on the right side of the tag. Tag names are limited to 64 characters. The Control Text attribute is selected by default. Priority You can prioritize controls by selecting this check box. The following priorities can be applied: l Low l Medium l High GRC Designation You can categorize the controls according to the following criteria: l Regulation l Legal Status l Standards l Threats Type You can further categorize the controls according to the following criteria: l Management l Technical l Operations Template Tab User Guide Chapter 3: Policy and Compliance HP EnterpriseView (2.5) Page 65 of 265
  • 66.
    UI Element Description Purpose Additionalsegmentation according to purpose: l Confidentiality l Integrity l Availability l Audit l Privacy Control Weight You can apply a weight between 0 and 100 to a control. The control weight affects the aggregation calculation when the policy assessment score is trickled up. For more information, see "Weights and Criticality Level" on page 83. If this check box is not selected, then all of the controls will have the same weight. P5 Applicability Weights You can apply different weights to the P5 control maturity factors. For more information on P5 control maturity factors, see "Maturity Score" on page 72. For example, if the organization business strategy is focused on the human factor, give People a higher weight than the other factors. The weights affect the calculation of the P5 maturity score when a control is assessed. By default, all of the P5 control maturity factors are selected. Clearing the check box will remove the specific factor from the control, meaning that the factor is not displayed when the control is assessed. You can narrow down the factors for a specific control further when you add content to the policy. For more information, see "Create a Policy" on page 45. Attachments You can add the ability to upload, download, or delete attachments from a policy. For more information, see "Attachments" on page 69. Template Tab, continued Content Tab Use this screen to add content to a policy that you created. User Guide Chapter 3: Policy and Compliance HP EnterpriseView (2.5) Page 66 of 265
  • 67.
    UI Element Description New MainSecurity Category A Security Category lets you group controls with common characteristics. It is like a heading, but it includes a Text field where you can add a description of the category. Examples of security categories in ISO can be: Asset Management, Risk Assessment and Treatment, and Security Policy. Examples of security categories in COBIT can be: Plan and Organize, Acquire and Implement. A policy can include a hierarchy of security categories. The first level must be a Main Security Category. A main security category can only serve as a first-level category, meaning that you cannot create a main security category under a main security category. Click this button to create a new Main Security Category. In the right pane, enter the security category information. New Security Category After you created a Main Security Category, you can create another level of categories using Security Categories.You can create multiple levels of Security Categories. Click on the parent category (it may be a Main Security Category or a regular Security Category), and then click this button. In the right pane, enter the security category information. New Control Controls are typically used to make sure that risks are reduced to an acceptable level. Controls are guidelines and rules and are the foundation of any policy; you must define controls in order to assess an asset's compliance with your organization's rules and regulations. Click the security category to which the control belongs, and then click this button. In the right pane, enter the control information. Note: A control cannot be created directly under the policy, it must be created under a security category. Delete Deletes a Main Security Category, Security Category, or Control. Left Pane (Content Toolbar) User Guide Chapter 3: Policy and Compliance HP EnterpriseView (2.5) Page 67 of 265
  • 68.
    UI Element Description Move Up/MoveDown Changes the order of any one of the following items in the policy tree: l Main Security Category within a policy l Security Category within a policy or within another security category l Control within a security category. In order to move a control between security categories, you need to drag and drop the control. Left Pane (Content Toolbar), continued UI Element Description Paragraph Number An alphanumeric string, up to 255 characters, that uniquely identifies the security category or the control. Title The title of the security category or the control. Control Text A description of the control. Guidelines Includes the following information, as defined in the policy template: l Guideline Introduction l Guidelines: To add a guideline, click Add Guideline, and then, in the Guideline box, enter the guideline text. To delete a guideline, click the Delete Guideline button next to the guideline that you want to delete. To add a tag to a guideline, enter a tag name and click Add. l Guideline Additional Text l Control Additional Text Right Pane User Guide Chapter 3: Policy and Compliance HP EnterpriseView (2.5) Page 68 of 265
  • 69.
    UI Element Description Additional Auditing Attributes Includes thefollowing information, as defined in the policy template: l Priority: For more information, see "Priority" on page 65. l GRC Designation: For more information, see "GRC Designation" on page 65. l Type: For more information, see "Type" on page 65. l Purpose: For more information, see "Purpose" on page 66. l Control Weight: For more information, see "Control Weight" on page 66. l P5 Applicability Weights: For more information, see "P5 Applicability Weights" on page 66. Right Pane , continued Attachments UI Element Description Upload Click this button to attach a file to this assessment. The maximum file size is 5.00 MB. Delete To delete a file from this control assessment, click the file that you want to delete, and then click this button. Download To download a file to your local computer, click the file that you want to download, and then click this button. User Guide Chapter 3: Policy and Compliance HP EnterpriseView (2.5) Page 69 of 265
  • 70.
    Policy and ComplianceAssessment Window The Policy and Compliance Assessment window enables you to audit assets by assessing the control maturity and asset compliance with a control, for each asset. The different areas and the functionalities available in each area are described in the following sections. For information on the EnterpriseView toolbar, see "Toolbar Description" on page 17. Policy and Compliance Assessment Toolbar UI Element Description <Asset Selector> Select the asset that you want to assess from this list or search for an asset by entering its name. Clear Assessment Click this button to clear assessments on the entire business model. For more information, see "Clear Assessment on Assets" on page 54. Left Pane The left pane includes an hierarchical view of the policy or policies, and assessment information on the policy, security categories, and controls. For detailed information on how the assessment information is calculated, see "Control Scores Aggregation Mechanism" on page 77. UI Element Description Compliance tab Click this tab to display the assessment progress and the compliance score for each policy element (policy, security categories, and controls). User Guide Chapter 3: Policy and Compliance HP EnterpriseView (2.5) Page 70 of 265
  • 71.
    UI Element Description Maturity tabClick this tab to display the assessment progress and the control maturity score for each policy element ((policy, security categories, and controls). Reflects the assessment progress in both Compliance and Maturity tabs. Provides a visual indication of how much each policy element is assessed. For the exact assessment percentage, hover over the relevant icon. For information on how assessment progress is calculated, see "Control Scores Aggregation Mechanism" on page 77. <Score Range> The score range for a specific policy element is indicated by one of the following icons: High score Medium score Low score The ranges are determined in "Configure Compliance and Maturity Score Ranges" on page 63. The actual score is displayed next to this icon. Right Pane (Summary) The summary area in the right pane includes information that is displayed on each of the tabs. UI Element Description Last Updated On The last date and time that the control was assessed for the specific asset. User Guide Chapter 3: Policy and Compliance HP EnterpriseView (2.5) Page 71 of 265
  • 72.
    UI Element Description Maturity ScoreMeasured as a score between 0 and 5. The evolutionary state of a control when it is applied to a specific asset, comprised by the weighted average of five factors: People, Procedure, Process, Product, Proof, also known in EnterpriseView as P5 maturity factors. For example, if the scores are: People=5, Procedure=5, Process=5, Product=3, and Proof=3, then the control maturity score is 4.2. Maturity Progress Measured as a percent. The maturity assessment progress reflects how many maturity factors have been assessed. Each maturity factor counts for a percentage of the overall score, depending on the number of maturity factors employed. For example, if all maturity factors are employed, then each factor counts for 20% of the overall score, so if two out of five maturity factors have been assessed, then the maturity assessment progress will be 40%. Note: If the control employs fewer than five factors, then the percentage distribution changes accordingly. Compliance Score See "Compliance Score" on page 75. Compliance Progress Measured as a percent. The compliance assessment progress reflects the percentage of overall asset compliance with a policy. Control Mappings Indicates whether the control is mapped to other controls. Is displayed under the following conditions: l The assessed control is mapped to another control in a different policy. l The control to which it is mapped is applied to the same asset (SoA). You can click the "n controls" link to see the details of these controls. For more information on mapping controls between polices, see "Policy Mapping" on page 59. User Guide Chapter 3: Policy and Compliance HP EnterpriseView (2.5) Page 72 of 265
  • 73.
    Assessment Tab UI Element Description ComplianceAssessment In this area you assess how compliant the selected asset is with the selected control. User Guide Chapter 3: Policy and Compliance HP EnterpriseView (2.5) Page 73 of 265
  • 74.
    UI Element Description Base ComplianceScore This score is the compliance score before network and application vulnerabilities are considered. If there are no network and application vulnerabilities that affect compliance, then the base compliance score and the final compliance score are identical. To edit this score, click the Edit base Compliance Score button. For more information, see "Assess Asset Compliance" on page 51. An icon representing the assessment method is displayed (see the following four icons). Score applied manually This icon indicates that a score was applied manually. Score imported from external source This icon indicates that a score was applied automatically by importing the assessment from an external system. Aggregate score This icon indicates that a score was aggregated from its lower level assets. For more information, see "Control Scores Aggregation Mechanism" on page 77. Score determined by configuration vulnerabilities This icon indicates that a score was determined by configuration vulnerabilities. For more information, see "Use Configuration Vulnerabilities to Determine Compliance Score" on page 55. Ignore Vulnerabilities Select this check box if you want to disable the affect of vulnerabilities mapped to this control. For information on the correlation between vulnerabilities and controls, see "Use Network and Application Vulnerabilities to Refine Compliance Score" on page 56. User Guide Chapter 3: Policy and Compliance HP EnterpriseView (2.5) Page 74 of 265
  • 75.
    UI Element Description Score isaffected by <n> vulnerabilities This indication is displayed only if the vulnerabilities that are mapped to the control are also attached to the asset that is being assessed. Click the "n vulnerabilities" link to view information about these vulnerabilities. Reduced by m% This indication is displayed only if the assessment on the control was saved. The vulnerabilities reduce the compliance score. The reduction is expressed as a percent and is done automatically when you click Save. To override this effect, select the Ignore Vulnerabilities check box, but note that selecting this check box also ignores imported automatic assessments. For more information on the correlation between vulnerabilities and controls, see "Control to Vulnerability Mapping" on page 54. Compliance Score This number defines how compliant the asset is with the control. It is calculated as: Base Compliance Score - affect of network and application vulnerabilities. Maturity Assessment In this area you assess how mature the control is. Maturity Score The maturity score is the average of all the P5 maturity score factors. To determine the maturity score, click the Edit P5 Maturity Factor Scores button. For more information, see "Assess Control Maturity" on page 52. Implementation Details Record details of how this control has been implemented. Details Tab This tab displays information about the control, such as the control text and guidelines. For more information on control details, see "Content Tab" on page 66. Attachment Tab UI Element Description Upload Click this button to attach a file to this assessment. The maximum file size is 5.00 MB. Delete To delete a file from this control assessment, click the file that you want to delete, and then click this button. User Guide Chapter 3: Policy and Compliance HP EnterpriseView (2.5) Page 75 of 265
  • 76.
    UI Element Description Download Todownload a file to your local computer, click the file that you want to download, and then click this button. Notes Tab You can add comments and notes to the assessment. In the text box, enter the required information, and then click Upload. The information is displayed in a table and includes the creation date and the user name. Click the icon next to the date in order to view the entire note. You cannot delete or edit notes. P5 Control Maturity Model Guidelines The P5 Model states that there are five basic factors to every control that must exist in order for that control to perform properly. The following describes the factors of the P5 Model: l P1: People Assigned staff to oversee and manage controls. l P2: Policy/Procedure Governance documentation used to specify and manage control. l P3: Process Operational sequence of activities designed to reduce risk. l P4: Product Defense-in-depth technologies/solutions to manage/mitigate risk. l P5: Proof Metrics or validation methods used to track control effectiveness. Key Performance Indicators 0 Not Performed 1 Performed Informally 2 Planned and Tracked 3 Well Defined 4 Quantitativel y Controlled 5 Continuousl y Improving P1: People No personnel assigned to control Part-time personnel assigned Full-time personnel assigned Formally trained personnel assigned Certified personnel assigned Back-up personnel assigned P2: Policy & Procedure No policy for control exists Assumed policy, not documented or widely known Formal published policy with acknowledgm ent Policy applied to third parties Policy actively enforced by HR departme nt Policy externally reviewed User Guide Chapter 3: Policy and Compliance HP EnterpriseView (2.5) Page 76 of 265
  • 77.
    Key Performance Indicators 0 Not Performed 1 Performed Informally 2 Planned and Tracked 3 Well Defined 4 Quantitativel yControlled 5 Continuousl y Improving P3: Process No process for control exists Assumed processes, not documented or widely known Task list oriented processes Detailed narrative- based descriptive processes Processes include evidence of change control Processes can be used by external personnel to perform control P4: Product No product for control exists Default, open source or shareware solution deployed Standardized point solution (tool) deployed, results monitored Tool deployed with specific SLA and/or KPI targets tracked Tool deployed with integrated management, logging and reporting Multiple layer tools deployed, providing defense in- depth approach P5: Proof No proof for control exists Subjective verbal attestation only Subjective results; however, regularly reported in written format Results automatically tracked and reviewed by internal audit Results independently reviewed and/or validated by 3rd party Formal independent attestations by TOD/TOE (SAS 70, SysTrust etc.) Control Scores Aggregation Mechanism In EnterpriseView, assessments that are done on lower-level assets, such as servers, are automatically trickled up to higher-level assets, such as a department; this mechanism is called aggregation. Aggregation is performed on two different levels:  1. Aggregation on the business model level Parent assets get the aggregate compliance score, control maturity score, compliance assessment progress and maturity assessment progress from their children, for each control. This is done for the entire business model hierarchy. 2. Aggregation on the policy level After aggregation is done on the business model level, security categories, main security categories and, lastly, the policy inherit the compliance score, control maturity score compliance assessment progress and maturity assessment progress from the controls. This is done separately for each asset in the entire policy hierarchy. If more than one policy is applied to the asset, then the asset receives the lowest compliance and maturity scores. The following table includes a description of all assessment parameters. User Guide Chapter 3: Policy and Compliance HP EnterpriseView (2.5) Page 77 of 265
  • 78.
    Parameter Description Compliance ScoreMeasured as a percent. The compliance of an asset with a specific control. Control Maturity Score Measured as a score between 0-5. The evolutionary state of a control when it is applied to a specific asset, comprised by the weighted average of five factors: People, Procedure, Process, Product, and Proof (also known in EnterpriseView as P5 maturity factors). For example, if the scores are: People=5, Procedure=5, Process=5, Product=3, and Proof=3, then the control maturity score is 4.2. User Guide Chapter 3: Policy and Compliance HP EnterpriseView (2.5) Page 78 of 265
  • 79.
    Parameter Description Maturity AssessmentProgress Measured as a percent. The maturity assessment progress reflects the percentage of the overall control maturity within a policy. Each maturity factor counts for a percentage of the overall score, depending on the number of maturity factors employed. For example, if all maturity factors are employed, then each factor counts for 20% of the overall score, and if out of the five maturity factors two have been assessed, then the maturity assessment progress will be 40%. Note: This parameter is significant only in policy- level aggregation. Compliance Assessment Progress Measured as a percent. The compliance assessment progress reflects the percentage of overall asset compliance with a policy. Note: This parameter is significant only in policy- level aggregation. Note: Assets that have not been assessed for compliance or control maturity do not affect the aggregation calculation. For example, asset A has two children: asset B and asset C. Asset B is assessed and C is not assessed. Asset A will receive the score from asset B. Aggregation on the Business Model Level The following sections describe the aggregation mechanism for each of the parameters. User Guide Chapter 3: Policy and Compliance HP EnterpriseView (2.5) Page 79 of 265
  • 80.
    Note: Scores areaggregate from a child asset to a parent asset only for controls that are applied to both child and parent assets. Compliance Score A parent asset gets the average compliance score of all its children, on a specific control. Total ComplianceScores Number of Children ∑( ) ∑( ) For example: For control X If Compliance score for child asset B= 100% Compliance score for child asset C=0% Then Compliance score for parent asset A=50% Control Maturity Score Aggregation is done in two steps: 1. A parent asset gets the average score for each P5 maturity factor of all its children. 2. The final control maturity score is the weighted average of the P5 maturity factor scores. For example: For control X If Child asset A has the following scores on its P5 maturity factors: People=5, Policy/Procedure=5, Process=5, Product=3, Proof=3 Child asset B has the following scores on its P5 maturity factors: User Guide Chapter 3: Policy and Compliance HP EnterpriseView (2.5) Page 80 of 265
  • 81.
    People=5, Policy/Procedure=4, Process=3,Product=3, Proof=5 Then The parent asset will inherit the following P5 maturity factor scores: People=5, Policy/Procedure=4.5, Process=4, Product=3, Proof=4 and the overall control maturity score will be 4.1 Aggregation on Policy Level The following diagram shows the flow of aggregation between policy elements: Meaning: 1. The assessment parameters of all controls under a specific security category are aggregated to that security category. 2. The assessment parameters of all security categories under a specific main security category are aggregated to that main security category. 3. All assessment parameters for the main security categories are aggregated to the policy. In the following examples, Policy A has the following format: 1 Main Security Category 1.1 Security Category 1.1.1 Control A User Guide Chapter 3: Policy and Compliance HP EnterpriseView (2.5) Page 81 of 265
  • 82.
    1.1.2 Control B ComplianceScore A policy element gets the average compliance score of all its contained elements, for a specific asset. For example: If Compliance score for Control A (1.1.1)= 100 Compliance score for Control B (1.1.2) =0 Then Security Category (1.1), Main Security Category (1) and Policy A inherit the average score of 50. Control Maturity Score Aggregation is done in two steps: 1. A policy element gets the average score for each P5 maturity factor of all its contained policy elements. 2. The final control maturity score is the weighted average of the P5 maturity factor scores. For example: If Control A (1.1.1) has the following scores on its P5 maturity factors: P1=5, P2=5, P3=5, P4=3, P5=3 Control B (1.1.2) has the following scores on its P5 maturity factors: P1=5, P2=4, P3=3, P4=3, P5=5 Then Security Category (1.1), Main Security Category (1) and Policy A inherit a control maturity score of 4.1. Note: Some dashboards display the score on the P5 control maturity factor level. In this example, the following scores will be displayed: P1=5, P2=4.5, P3=4, P4=3, P5=4 Maturity/Compliance Assessment Progress A policy element inherits the average maturity/compliance assessment progress of all its contained policy elements, on a specific asset. User Guide Chapter 3: Policy and Compliance HP EnterpriseView (2.5) Page 82 of 265
  • 83.
    For example:  If Maturity assessmentprogress for Control A (1.1.1) = 100% (fully assessed) Maturity assessment progress for Control B (1.1.2)= 0% (not assessed) Then Security Category (1.1), Main Security Category (1) and Policy A is 50% Weights and Criticality Level Aggregation of assessment scores is affected by the following factors: l Criticality Level. One of the asset properties; it is determined when an asset is created in the business model, but can be modified at any time. For more information, see "Criticality Level" on page 33.The criticality level determines the weight of an asset's scores when it is aggregated on the business model level; it does not affect aggregation on the policy level. For example: If For child asset A: Compliance Score= 100, Criticality Level=1 For child asset B: Compliance Score =10, Criticality Level=2 Then Compliance Score for parent asset=40 Calculation: (100 * 1) + (10 * 2) (1 + 2) l Control Weight. One of the policy properties, configurable through the control template. It is determined when a control is defined in a policy. It can be modified until the assessment process on a policy begins. The control weight determines the weight of a specific control in regard to other controls within a specific policy when it is aggregated on the policy level; it does not affect aggregation on the business model level. For more information, see "Control Weight" on page 66. For example: If User Guide Chapter 3: Policy and Compliance HP EnterpriseView (2.5) Page 83 of 265
  • 84.
    Compliance Score forControl A (1.1.1)= 10, Control Weight=100 Compliance Score for Control B (1.1.2) =100, Control Weight=50 Then Security Category (1.1), Main Security Category (1) and Policy A inherit the weighted average score of 40. Calculation:  (10 * 100) + (100 * 50) (100 + 50) User Guide Chapter 3: Policy and Compliance HP EnterpriseView (2.5) Page 84 of 265
  • 85.
    Chapter 4: RiskManagement Risk management is the continuous process of identifying, assessing, mitigating, and monitoring risk. EnterpriseView supports self-directed information security risk evaluation that enables you to make information protection decisions based on risks to your critical information-technology assets. EnterpriseView offers you the following capabilities for managing risk in your organization: 1. Create a threat library. The Threat Library Builder is the foundation of the Risk Modeling module. The Threat Library Builder offers ready-to-use threats that are common to most organizations. Threats, made up of an initiator (referred to as Actor in EnterpriseView) and the threatening incident (referred to as Operation in EnterpriseView), can be added, modified or deleted, according to the requirements of the organization. An actor can be anything from a hacker to a technical failure and operations may range from natural disasters to malicious actions. EnterpriseView provides simple drag and drop capabilities to create threats, which are displayed as visual threat trees. For more information, see "Create a Threat Library" on the next page. 2. Identify potential risks to your organization. The Risk Modeling module supports scenario-based risk identification. By associating a certain threat with an asset, you create a threat scenario which can later be assessed. For more information, see "Assign Threats to Assets" on page 89. 3. Assess risk on threat scenarios. Risk assessment directly affects the business strategy and the objectives of the organization. EnterpriseView supports risk analysis and evaluation by applying a qualitative value (such as low, medium, or high) to relevant impact areas and defining the likelihood of the threat scenario occurring. The risk scores are calculated from these parameters and are used to prioritize risks for mitigation. Risk acceptance levels are based on the risk tolerance level that you define for each risk individually. For more information, see "Assess the Risk on an Asset" on page 92. 4. Create a risk treatment plan. The treatment plan should coincide with your organization's risk management strategy and the risk tolerance level (the amount of risk that your organization is willing to accept). For more information on creating a treatment plan, see "Create a Treatment Plan" on page 98. Risk can be mitigated, accepted, avoided, deferred, or transferred. For more information on each of these methods, see "About Risk Treatment Methods" on page 93. You can use policy controls to mitigate risk by using EnterpriseView's control to threat mapping capabilities to automatically correlate controls to threats and reduce the risk score. For more information, see "Mitigate Risk Automatically Using Policy Controls" on page 95. 5. Monitor risk. HP EnterpriseView (2.5) Page 85 of 265
  • 86.
    Risk monitoring isa constant process that can be done throughout the risk life cycle. EnterpriseView includes dashboards and printable reports that help you analyze the origin of the risk in your organization. For example, the Risk Register provides an overview of all the status of the risk factors that affect your organization, Risk Indicators helps you quickly locate high risk assets in your organization, and the Risk Modeling Dashboard displays detailed information on modeled risk. Use the drill down functionality to navigate the different dashboards and pages and find the root cause of the risks in your organization. For more information, see "Dashboards and Reports" on page 174 and "Root Cause Analysis" on page 177. In addition, EnterpriseView offers flexible risk score configuration. You can assign weights to the impact areas that comprise the impact score, configure risk score and probability thresholds for defining risk severity, select the risk aggregation method that best reflects your organization's strategy, and determine the thresholds of risk KPIs. For more information, see "Risk Settings" on page 106. Create a Threat Library A threat is a potential cause of an unwanted incident which may result in harm to the organization. For example, someone could initiate a denial-of-service attack against an organization's mail server, or a fire or natural disaster could damage an organization's IT hardware. A threat is created when a threat actor exploits a vulnerability. In EnterpriseView, threats consist of an actor and an operation. Relative weights can be ascribed to the different actors or to actor categories, and to the various factors that are affected by the threat (such as financial, reputation, productivity, fines/legal, and safety and health), known in EnterpriseView as impact areas. For more information, see "Configure Risk Assessment Settings" on page 107. The Threat Library Builder offers ready- to-use threats that are common to most organizations. You can add, modify, or delete threats, operations, and actors according to the requirements of your organization. For more information on maintaining threats, actors and operations, see "Threat Library Builder Window" on page 115. To create a new threat 1. If the actor required for this threat does not exist in the threat library, follow the instructions in "Create an Actor" on the next page. 2. If the operation required for this threat does not exist in the threat library, follow the instructions in "Create an Operation" on page 88. 3. Connect an actor to an operation, as described in "Connect Actor to Operation" on page 88. User Guide Chapter 4: Risk Management HP EnterpriseView (2.5) Page 86 of 265
  • 87.
    Create an Actor Anactor is a potential initiator of a violation of the security requirements (confidentiality, integrity, availability) of an asset in your organization. Actors are divided into categories. EnterpriseView includes the following categories. Category Description End Users This category represents threats to the asset that are caused by users authorized by the organization. Threats in this category require direct action by a person and can be deliberate or accidental in nature. External Users This category represents threats to the asset that result from physical access to the asset. Threats in this category require direct action by a person and can be deliberate or accidental in nature. IT Users This category represents threats to the asset through the organization’s technical infrastructure. Threats in this category require direct action by a person and can be deliberate or accidental in nature. Physical Threats This category includes problems or situations that are outside the control of an organization. This category of threats includes natural disasters (such as floods or earthquakes) and interdependency risks. Interdependency risks include the unavailability of critical infrastructures (such as power supply). Technical Failures This category includes problems with an organization’s information technology and systems. Examples include hardware defects, software defects, malicious code (such as viruses), and other system-related problems. You can create an actor under an existing category or create a new category. To create an actor 1. Click Risk Modeling > Threat Library Builder. 2. On the Actors tab, from the actor tree, click the category to which you want to add a new actor, and then click the New Actor button. 3. On the Actors dialog box, do the following, and then click Save: User Guide Chapter 4: Risk Management HP EnterpriseView (2.5) Page 87 of 265
  • 88.
    a. Name: Entera unique name for the actor. b. Description: Enter a description for the actor, which will appear as a tooltip. The new actor is displayed in the actor tree. To create a new actor category 1. Click Risk Modeling > Threat Library Builder. 2. On the Actors tab, click the New Category button. 3. On the New Category dialog box, do the following, and then click Save: a. Name: Enter a unique name for the category. b. Description: Enter a description for the category, which will appear as a tooltip. The new category is displayed in the actor tree. Create an Operation An operation is the violation of the security requirements of an asset performed by an actor. EnterpriseView includes numerous predefined operations. To create an operation 1. Click Risk Modeling > Threat Library Builder. 2. On the Operations tab, click the New Operation button. 3. On the Operations dialog box,do the following, and then click Save. a. Name: Enter a unique name for the operation. b. Information Security Threat Type: If the threat is an information security threat, then select the type. c. Description: Enter a description. This description will appear as a tooltip for the operation. The new operation is displayed in the operations tree. Operations are sorted alphabetically. Connect Actor to Operation You can create a threat by connecting an actor and an operation. User Guide Chapter 4: Risk Management HP EnterpriseView (2.5) Page 88 of 265
  • 89.
    To connect anactor and an operation 1. Click Risk Modeling > Threat Library Builder. 2. On the Actors tab, from the actors tree, locate the required actor. To expand the actors tree, click next to the category. Drag the actor to which you want to connect an operation to the map area. If the actor already has operations that are connected to it, they are displayed in the map area. 3. Click the Operations tab. From the list of operations, locate the operation that you want to attach to the actor, and drag it onto the actor icon in the map area. The operation is connected to the actor and is displayed in the Operations section in the map area. 4. To disconnect an operation from an actor, click the operation in the graph, and then press DELETE. Disconnect Actor from Operation You can delete a threat by disconnecting an actor from an operation. To disconnect an actor from an operation 1. Click Risk Modeling > Threat Library Builder. 2. On the Actors tab, from the actors tree, locate the required actor. To expand the actors tree, click next to the category. Drag the actor to the map area. 3. Click the operation in the map are, and then press DELETE. Assign Threats to Assets When you assign a threat to an asset you create a Threat Scenario. A threat scenario is a situation in which an asset can be compromised. It generally consists of a threat (an actor and an operation), and an asset. Threat scenarios provide a simple way to determine if a risk exists that could affect your asset. An asset can have many threats associated with it. The following diagram shows an asset that has several threat scenarios. The path marked in red is a single threat scenarion. User Guide Chapter 4: Risk Management HP EnterpriseView (2.5) Page 89 of 265
  • 90.
    To create athreat scenario, connect a threat to an asset. You can connect threats to assets from both the Graph view and the Table view. After you assign threats to assets, you can assess the risk for the assets. For more information, see "Assess the Risk on an Asset" on page 92. To assign a threat to an asset (Graph view) 1. Click Risk Modeling > Threat Assignment. 2. In the Threat Assignment window, from the Asset list, select the asset to which you want to assign threats. 3. Click the Graph button. The left pane is divided into two areas:  n Associated Threats displays all the threats that are already associated with the asset n Unassociated Threats displays all the threats that are not associated with the asset User Guide Chapter 4: Risk Management HP EnterpriseView (2.5) Page 90 of 265
  • 91.
    All threats aregrouped by actor and category. 4. To expand the threats tree, click next to the category/actor. 5. From the Unassociated Threats area, click the threat that you want to assign to the asset, and then click Add or drag the threat to the map area. You can also assign an entire group of threats, either grouped by actor or by category, by clicking the category or actor. To multi- select threats, press CRTL and click the threats you want to assign. The threat is displayed in the Associated Threats area and in the map area. 6. To disconnect a threat from an asset, from the Associated Threats area, click the threat that you want to remove, and then click Remove. Caution: If you disconnect a threat that has risk scores applied, then all the data on this threat is deleted and cannot be restored. The threat is displayed in the Unassociated Threats area and is removed from the map area. You can also drag and drop threats between the Unassociated Threats and Associated Threats areas. To assign a threat to an asset (Table view) 1. Click Risk Modeling > Threat Assignment. 2. In the Threat Assignment window, from the Asset list, select the asset to which you want to assign threats. 3. Click the Table button. 4. From the Show Threats drop-down list, select Unassociated to Asset or All Threats. 5. From the table, select the Associated check box for all the relevant threats, and then click Save. 6. To disconnect a threat from an asset, from the Show Threats drop-down list, select Associated to Asset or All Threats, from the table, clear the Associated check box for all the relevant threats, and then click Save. Caution: If you disconnect a threat that has risk scores applied, then all the data on this threat is deleted and cannot be restored. User Guide Chapter 4: Risk Management HP EnterpriseView (2.5) Page 91 of 265
  • 92.
    Assess the Riskon an Asset After you assign threats to assets, you can assess the risk for the assets. To assess risk on an asset 1. Click Risk Modeling > Risk Assessment and Treatment. 2. In Risk Assessment and Treatment window, from the Asset list, select the asset that you want to assess. All threats assigned to this asset are displayed in the left pane. Note: Make sure that you are in the Assessment and Treatment view by clicking the Assessment and Treatment button on the toolbar. 3. From the list of threats in the left pane, click the threat that you want to assess. To expand the threats tree, click next to the category/actor. 4. In the right pane, in the Assessment section, click the Edit Assessment button. 5. In the Risk Tolerance Level box, enter the maximum level of risk exposure that you are willing to accept for this asset in this threat scenario. 6. In the Impact Areas table, click the Value cell of each impact area and select a value. The values are configurable, as described in "Configure Risk Assessment Settings" on page 107. The impact score is automatically calculated and displayed on the screen. For more information on how the score is calculated, see "Impact Score Calculation" on page 112. 7. In the Probability box, enter a number between 0 and 1, up to two places after the decimal point. For example, 0.5. The Inherent Risk Score is automatically calculated as the Impact Score X Probability. If the inherent risk score exceeds the risk tolerance level, then you receive the warning "Exceeds the tolerance level". 8. Change the Risk Status to Assessed. 9. Click Save. The impact score and the inherent risk score are applied to the operation, actor, and actor category and the inherent risk score is aggregated to the asset, as described in "Residual Risk Score Calculation" on page 112. All scores are copied to the Treatment section. User Guide Chapter 4: Risk Management HP EnterpriseView (2.5) Page 92 of 265
  • 93.
    The date andtime of this assessment is updated in the Last Updated On field. Risk Treatment Risk treatment is the process of selecting and implementing a course of action to reduce risk. After you identify and assess the risk, you need to evaluate which treatment method is most suitable for handling the risk. EnterpriseView supports the following methods for handling risk: mitigation, acceptance, transference, avoidance, and deferral. For more information on these methods, see "About Risk Treatment Methods" below. You can use policy controls to mitigate risk by using EnterpriseView's control to threat mapping capabilities to automatically correlate controls to threats and reduce the risk score. For more information, see "Mitigate Risk Automatically Using Policy Controls" on page 95. After you have decided how to handle the risk, create a treatment plan, as described in "Create a Treatment Plan" on page 98. About Risk Treatment Methods EnterpriseView includes the following methods for handling risk: l Mitigation Also referred to as Risk Reduction. Mitigating risk means that you take action to reduce the impact or the likelihood of a risk. For example, installing fire extinguishers in your office buildings can reduce the impact of a fire, if it occurs. In this example, the impact is reduced while the probability does not change. For more information, see "Mitigate Risk" on page 99. EnterpriseView allows you to mitigate risk in the following ways: n Control Action By using control-based actions. This is the most common methods for reducing risk. Optimally, your Statement of Applicability will always be up-to-date, all controls will be as compliant as they possibly can, and all relevant controls will be mapped to the appropriate threat. In this case, risk will be mitigated automatically, as described in "Mitigate Risk Automatically Using Policy Controls" on page 95. If this is not the case, though, you may need to create a control action in order to either add controls to your Statement of Applicability or to make the controls more compliant (increasing their compliance score). For more information, see "Add a Control Action" on page 100. User Guide Chapter 4: Risk Management HP EnterpriseView (2.5) Page 93 of 265
  • 94.
    n Manual Action Bycreating manual actions when controls are insufficient. For more information, see "Add a Manual Action" on page 102. In any case, both impact score and probability can be reduced manually to create the residual risk score. l Acceptance Also referred to as Risk Retention. Accepting risk means that you acknowledge that the risk can happen without doing anything to prevent it. Typically, this method is used when a risk is low or is less than the risk tolerance level. You may decide that the cost of reducing this risk is too high compared to accepting it. This treatment activity can be limited in time. If it is, then the owner is required to evaluate and address the risk after the expiration date passes. The owner receives an email notification when the expiration date passes. For more information on accepting risk, see "Accept Risk" on page 104. l Transference Also referred to as Risk Sharing. Transferring risk means that you transfer the responsibility of reducing the risk exposure from your organization to a third party. For example, a common third party is an insurance company. If one of the risks in your organization is laptop theft, then insuring all company laptops against theft is a means of transferring the risk to the insurance company. This treatment activity is limited in time and the owner is required to evaluate and address the risk after the expiration date passes. The owner receives an email notification when the expiration date passes. For information on transferring risk, see "Transfer Risk" on page 105. l Avoidance Avoiding risk means that you do not perform a certain activity so that the risk does not occur. For example, if one of the entry doors to your office building is not secure and poses a high risk for unwanted intruders, then you can decommission that entry door, allowing employees entry through other doors. This course of action will help you avoid the risk. This treatment activity is limited in time and the owner is required to evaluate and address the risk after the expiration date passes. The owner receives an email notification when the expiration date passes. For information on avoiding risk, see "Avoid Risk" on page 106 User Guide Chapter 4: Risk Management HP EnterpriseView (2.5) Page 94 of 265
  • 95.
    l Deferral Deferring riskmeans that you decide to postpone handling the risk to a future date, when the risk is less likely to happen. Typically, this method is used when the initial risk is low. This treatment activity can be limited in time. If it is, then the owner is required to evaluate and address the risk after the expiration date passes. The owner receives an email notification when the expiration date passes. For information on deferring risk, see "Defer Risk" on page 104. Mitigate Risk Automatically Using Policy Controls There is an inherent correlation between policy controls and risks; controls are used to mitigate risk in a risk treatment plan, and, in turn, the output of the risk treatment process facilitates in identifying security requirements or controls that need to be added to the statement of applicability. EnterpriseView includes control to threat mapping capabilities that enable you to automatically reduce the risk scores by using the controls that are part of your Statement of Applicability. This capability saves you the trouble of repeatedly calculating the potential affect of a control on a threat every time you conduct a risk audit. A formula is used to calculate the affect of the controls. The output of this formula is an adjusted probability. The adjusted probability is used to calculate the residual risk. EnterpriseView includes out-of-the-box mappings for the threats and controls that are included in EnterpriseView, and enables you to add additional mappings for any new control or threat introduced into the system. For more information, see "Map Controls to Threats" on the next page, "Edit Control to Threat Mapping" on page 97, and "Delete Control to Threat Mapping" on page 97. Controls automatically affect the probability of a threat scenario when the following conditions occur: l The control is mapped to the threat. l The control is applied to an asset and a threat is attached to the same asset. l The control has a compliance score resulting from a manual assessment, an automatic assessment, or affecting vulnerabilities. The compliance score of the control is entered into a formula that recalculates the probability of the risk, creating a new Adjusted Probability. The direction of the relationship (positive/negative) between the compliance score of the control and the probability of the risk depends on whether the compliance score is higher or lower than 85: l If the control's compliance score is higher than the 85, then the compliance score reduces the probability of the risk. l If the control's compliance score is lower than the 85, then the compliance score increases the probability of the risk. User Guide Chapter 4: Risk Management HP EnterpriseView (2.5) Page 95 of 265
  • 96.
    The following formulasare used: If higher than the 85 NewTempProbability TreatedProbability α Tre tedProb bility= − * * ControlScore β β − 100− If lower than the 85 ( )NewTempProbability TreatedProbability α Tre tedProb bility= + * * 1− ControlScore β Note: If the calculation result is higher than 1, then the NewTempProbability will be 1. If there is more than one control mapped to the threat, the probability for each is calculated separately and then averaged to the adjusted probability. The adjusted probability is: AdjustedProbability = NewTempProbability Number of Controls ∑ EnterpriseView includes mappings of controls from the following policies: l Payment Card Industry (PCI) Data Security Standard (DSS) Version 2.0 l HIPAA Security Rule – NIST l NIST Special Publication (SP) 800 53, Revision 3 l ISO 27002:2005 l Unified Compliance Framework (UCF) 2013 Q1 release Map Controls to Threats You can add new control to threat mappings. To map controls to threats 1. Click Risk Modeling > Control to Threat Mapping. 2. On the Control to Threat Mapping page, click Add Mapping. 3. On the Select a Threat page, expand the tree and select an operation. 4. On the Select Controls for Mapping page, from the Policy list, select a policy. 5. From the list of controls, select the controls that you want to map to the threat, and then click the Add to Mapping button. To remove controls from the mapping, click the Remove from Mapping button. User Guide Chapter 4: Risk Management HP EnterpriseView (2.5) Page 96 of 265
  • 97.
    6. Click Finish. EditControl to Threat Mapping You can edit existing control to threat mappings. To edit a mapping 1. Click Risk Modeling > Control to Threat Mapping. 2. On the Control to Threat Mapping page, select the mapping that you want to edit, and then click Edit Mapping. You can search for specific mappings by using free text search. Note: You can perform wildcard searches. For example, if you type ser*, the results will contain words beginning with ser (such as server and service). An asterisks cannot be placed before a string (*ser). 3. To add controls, do the following: a. On the Edit Mapping dialog box, from the policy list, select a policy. b. From the list of controls, select the controls that you want to map to the threat, and then click the Add to Mapping button. 4. To remove controls from the mapping, click the Remove from Mapping button. 5. Click Finish. Delete Control to Threat Mapping You can delete both user-created and out-of-the-box mappings. Note: If you delete a mapping then any affect that control has on a threat scenario is eliminated. To delete a mapping 1. Click Risk Modeling > Control to Threat Mapping. 2. On the Control to Threat Mapping page, select the mapping that you want to delete, and then click the Delete Mapping User Guide Chapter 4: Risk Management HP EnterpriseView (2.5) Page 97 of 265
  • 98.
    button. You can searchfor specific mappings using free text. Note: You can perform wildcard searches. For example, if you type ser*, the results will contain words beginning with ser (such as server and service). An asterisks cannot be placed before a string (*ser). 3. Click Yes to confirm the action. Create a Treatment Plan A risk treatment plan is necessary in order to describe how you respond to potential risk. The treatment plan is comprehensive and provides all the information required about the proposed actions, time plans, resource requirements, and roles and responsibilities. EnterpriseView supports the following methods for handling risk: mitigation, acceptance, transference, avoidance, and deferral. For more information on these methods, see "About Risk Treatment Methods" on page 93. You can incorporate any combination of methods in your treatment plan. For example, you can take action, such as applying controls, to reduce the risk of a threat scenario until it is well below the risk tolerance level and then accept the residual risk. You can create a treatment plan only after you have assessed the risk of a threat scenario. For more information on assessing risk, see "Assess the Risk on an Asset" on page 92. Note: Initially, all risk scores: impact area values, impact score, and probability that are displayed in the Treatment area, are the same as the scores that are displayed in the Assessment area. This is because you did not begin treatment. Until you begin treatment, whenever you change assessment scores, they will be reflected in the Treatment area. But at the moment you begin treatment, if you change the scores in the Assessment area, they are no longer reflected in the Treatment area. To create a treatment plan 1. Click Risk Modeling > Risk Assessment and Treatment. 2. In the Risk Assessment and Treatment window, from the Asset list, select an asset. All threats assigned to this asset are displayed in the left pane. Note: Make sure that you are in Assessment and Treatment view by clicking the Assessment and Treatment button on the toolbar. User Guide Chapter 4: Risk Management HP EnterpriseView (2.5) Page 98 of 265
  • 99.
    3. From thelist of threats in the left pane, click the threat that you want to handle. To expand the threats tree, click next to the category/actor. 4. In the right pane, in the Treatment section, click the Edit Treatment button. 5. From the Select a treatment method list, select the method that you want to use, and then click Add. 6. According to the method that you selected, follow the instructions in one of the following procedures: n Mitigate risk, as described in "Mitigate Risk" below. n Accept risk, as described in "Accept Risk" on page 104. n Transfer risk, as described in "Transfer Risk" on page 105. n Avoid risk, as described in "Avoid Risk" on page 106. n Defer risk, as described in "Defer Risk" on page 104. 7. You can use any number of methods in your treatment plan. 8. To delete a treatment activity, under the treatment activity that you want to delete, click the Delete button. 9. Change the Risk Status to reflect the treatment status. Mitigate Risk When you mitigate risk you take action to reduce the impact or the likelihood of the risk. A mitigation treatment activity can include one or more action plans for reducing risk. You can create the following types of actions: l Control action l Manual action For more information, see "Mitigation" on page 93. To mitigate risk 1. In the Risk Assessment and Treatment window, in the Treatment area, from the Select a treatment method list, select Mitigate, and then click Add. 2. In the Description field, enter necessary information about this treatment activity. User Guide Chapter 4: Risk Management HP EnterpriseView (2.5) Page 99 of 265
  • 100.
    3. In theOwner field, enter the name of the owner of this treatment activity. The owner of this activity is responsible for managing all the actions required to carry out this treatment activity. 4. In the Due Date field, enter the date on which all actions for mitigating the risk should be completed. If this date passes and not all actions are completed, then the owner of this treatment activity receives an email notification that the treatment activity is overdue. 5. Create an action. Select one of the following options: n Create a control action, as described in "Add a Control Action" below. n Create a manual action, as described in "Add a Manual Action" on page 102. 6. Add as many actions as necessary. 7. After you complete an action or at any time during the treatment process, update the impact score and probability according to the treatment that you implemented, as follows: a. In the Treatment section, click the Edit Treatment button. b. If the impact was reduced due to treatment, then update the values in the Impact Areas, as necessary. c. If the probability of this risk was reduced due to treatment, then in the Treated Probability box, enter a new value. The Adjusted Probability is modified according to any control to threat mapping and to the treated probability. For more information on control to threat mapping, see "Mitigate Risk Automatically Using Policy Controls" on page 95. The residual score is calculated as follows: Residual Risk Score = Adjusted/Treated Probability X Impact Score (as defined in the Treatment section). d. In the Treatment section, click Save. e. To delete the mitigation treatment activity, under the actions table, click Delete the mitigation treatment activity button. Add a Control Action You can add one or more control actions to your mitigation treatment activity. After you create the action, you can create a workflow for carrying out the action plan. The workflow that is created is based on the template that is set in Settings. EnterpriseView includes a default template for creating a workflow for a control action, but you can change these settings, as described in "Configure Risk Mitigation Workflow Templates" on page 265. User Guide Chapter 4: Risk Management HP EnterpriseView (2.5) Page 100 of 265
  • 101.
    To add acontrol action 1. In the Risk Assessment and Treatment window, in the Treatment section, click Add Action and select Control. 2. In the New Control Action dialog box, enter the information described in the following table: Property Description Name Enter a short, descriptive name for this action. If you create a workflow from the action, then the workflow name will be: "Action ID + Action Name" Owner Enter the name of the user who is responsible for handling this action. If you create a workflow from this action, then this user will also be the owner of the workflow that is created. The owner of this workflow will be responsible for carrying out the workflow. Due Date Enter the date on which this action should be completed. If you publish this action, then this due date will also be the due date of the workflow that is created. After an action is published, and a workflow is created, then the due date can be changed on the workflow from Task Management > Workflow Management, as described in "Edit Workflow Properties" on page 247. If the workflow is not completed by the due date, then an email notification is sent to the workflow owner who is also the action owner. Status The initial status of the action is New. If you publish this action, then after the workflow is created, the status of the action is automatically updated to In Progress. After the workflow is completed, it is automatically updated to Completed.If you do not publish this action, then you can change the status of this action manually. 3. In the New Control Action dialog box, review the controls in the table. The controls that are displayed in this table are all controls that are mapped to the threat. For more information on control to threat mapping, see "Mitigate Risk Automatically Using Policy Controls" on page 95. Note: Controls can only be selected once in a treatment plan. If you already created a control action and selected controls, they will not be displayed again in a different control action. User Guide Chapter 4: Risk Management HP EnterpriseView (2.5) Page 101 of 265
  • 102.
    The controls areeither already applied to the asset (in your Statement of Applicability) or not yet applied. Select the following controls, and then click OK: n Controls applied to asset: Select controls that are already applied to the asset if you think that their compliance score can be improved (increased). If the compliance scores of these controls are improved, then they will automatically reduce the risk. Selecting these controls means that they will be reassessed. n Controls not applied to asset: Select controls that are not applied to the asset, but that you think should be applied to the asset in order to reduce the risk. Selecting these controls means that they will be added to the statement of applicability and reassessed. If you publish this action, then the list of controls and instructions will be displayed in the Controls tab in the Workflow properties in the Workflow Management window and in the My Tasks dialog box. 4. In the Risk Assessment and Treatment window, click Save. 5. To publish the action, click the Create a workflow from this action button. A workflow is created. The name and due date of the workflow are the same as the action's. 6. To delete an action, click the Delete Action button. 7. To edit the action properties, click the Edit Action button. Add a Manual Action You can add one or more manual actions to your mitigation treatment activity. After you create the action, you can create a workflow for carrying out the action plan. The workflow that is created is based on the template that is set in Settings. EnterpriseView includes a default template for creating a workflow for a manual action, but you can change these settings, as described in "Configure Risk Mitigation Workflow Templates" on page 265. To add a manual action 1. In the Risk Assessment and Treatment window, in the Treatment section, click Add Action and select Manual. 2. In the New Manual Action dialog box, enter the information described in the following table, and then click OK: User Guide Chapter 4: Risk Management HP EnterpriseView (2.5) Page 102 of 265
  • 103.
    Property Description Name Entera short, descriptive name for this action. If you create a workflow from the action, then the workflow name will be:  "Action ID + Action Name" Owner Enter the name of the user who is responsible for handling this action. If you create a workflow from this action, then this user will also be the owner of the workflow that is created. The owner of this workflow will be responsible for carrying out the workflow. Due Date Enter the date on which this action should be completed. If you create a workflow from this action, then this due date will also be the due date of the workflow that is created. After a workflow is created, then the due date can be changed on the workflow from Task Management > Workflow Management, as described in "Edit Workflow Properties" on page 247. If the workflow is not completed by the due date, then an email notification is sent to the workflow owner who is also the action owner. Status The initial status of the action is New. If you publish this action, then after the workflow is created, the status of the action is automatically updated to In Progress. After the workflow is completed, it is automatically updated to Completed.If you do not publish this action, then you can change the status of this action manually, as you see fit. Action Plan Enter a step by step description of how this action should be carried out. If you create a workflow for this action, then this information will be displayed in the workflow Description property. Resources Enter any necessary resources required to carry out the action plan. If you create a workflow for this action, then this information will be displayed in the workflow Description property. Budget/Cost Enter any necessary monetary information. If you create a workflow for this action, then this information will be displayed in the workflow Description property. User Guide Chapter 4: Risk Management HP EnterpriseView (2.5) Page 103 of 265
  • 104.
    3. In theRisk Assessment and Treatment window, click Save. 4. To publish the action, click the Create a workflow from this action button. A workflow is created. The name and due date of the workflow are the same as the action's. 5. To delete an action, click the Delete Action button. 6. To edit the action properties, click the Edit Action button. Accept Risk When you accept risk you acknowledge the risk without doing anything to prevent it. For more information, see "Acceptance" on page 94. To accept a risk 1. In the Risk Assessment and Treatment window, in the Treatment area, from the Select a treatment method list, select Accept, and then click Add. 2. From the Reason list, select the reason for accepting the risk. If the reason is not listed, select Other and enter a detailed description. 3. If you want to reevaluate the risk after a period of time, then select the Accept this risk for a limited time check box. If you selected this check box, then the Description, Owner, and Expiration Date fields are mandatory. 4. In the Description box, enter information necessary for reevaluating this treatment activity. 5. In the Owner box, enter the name of the owner of this treatment activity. The owner of this activity is responsible for reevaluating this treatment activity after the expiration date. On the expiration date, the owner will receive an email notification about this activity. 6. In the Expiration Date box, enter the date after which the Accept treatment activity is no longer valid. 7. Click Save. Defer Risk When you defer a risk you decide that you don't want to handle it in the present and you want to postpone handling it at a later date. For more information, see "Deferral" on page 95. User Guide Chapter 4: Risk Management HP EnterpriseView (2.5) Page 104 of 265
  • 105.
    To defer arisk 1. In the Risk Assessment and Treatment window, in the Treatment area, from the Select a treatment method list, select Defer, and then click Add. 2. From the Reason list, select the reason for deferring the risk. If the reason is not listed, select Other and enter a detailed description. 3. Select the Accept this risk for a limited time check box. 4. In the Description box, enter information necessary for reevaluating this treatment activity. 5. In the Owner box, enter the name of the owner of this treatment activity. The owner of this activity is responsible for handling the risk after the expiration date. On the expiration date, the owner will receive an email notification about this activity. 6. In the Expiration Date box, enter the date to which you want to postpone handling this risk. 7. Click Save. Transfer Risk When you transfer risk, you transfer the responsibility of reducing the risk exposure from your organization to a third party. For more information, see "Transference" on page 94. To transfer a risk 1. In the Risk Assessment and Treatment window, in the Treatment area, from the Select a treatment method list, select Transfer, and then click Add. 2. In the Description box, enter information necessary for reevaluating this treatment activity. 3. In the Owner box, enter the name of the owner of this treatment activity. The owner of this activity is responsible for reevaluating this treatment activity after the expiration date. 4. In the Expiration Date box, enter the date after which the Transfer treatment activity is no longer valid. On the expiration date, if this activity is not completed (status Completed), then the owner will receive an email notification about this activity. 5. From the Status list, select the status for this treatment activity. 6. In the Action Plan box, enter the course of action that you are taking for transferring this risk. 7. In the Resources box, enter the resources required for transferring this risk. For example, details about the third party employed to handle this risk. User Guide Chapter 4: Risk Management HP EnterpriseView (2.5) Page 105 of 265
  • 106.
    8. In theBudget/Cost box, enter monetary information. For example, the price of annual insurance. 9. Click Save. Avoid Risk When you avoid risk you avoid performing a specific activity so that the risk is nullified. For more information, see "Avoidance" on page 94. To avoid risk 1. In the Risk Assessment and Treatment window, in the Treatment area, from the Select a treatment method list, select Avoid, and then click Add. 2. In the Description box, enter information necessary for reevaluating this treatment activity. 3. In the Owner box, enter the name of the owner of this treatment activity. The owner of this activity is responsible for reevaluating this treatment activity after the expiration date. 4. In the Expiration Date box, enter the date after which the avoid treatment activity is no longer valid. On the expiration date, if this activity is not completed (status Completed), then the owner will receive an email notification about this activity. 5. From the Status list, select the status for this treatment activity. 6. In the Action Plan box, enter the course of action that you are taking for avoiding this risk. 7. In the Resources box, enter the resources required for avoiding this risk, if necessary. 8. In the Budget/Cost box, enter monetary information, if necessary. 9. Click Save. Risk Settings You can configure the following risk settings: l Decide how the risk score is aggregated, as described in "Configure Risk Score Aggregation Method" on the next page. l Define impact areas and actor and category weights, as described in "Configure Risk Assessment Settings" on the next page. User Guide Chapter 4: Risk Management HP EnterpriseView (2.5) Page 106 of 265
  • 107.
    l Define thethresholds that indicate the severity of your risk scores, as described in "Configure Risk Score Ranges" on page 109. l Override the general threshold definitions for a specific asset, as described in "Configure Asset Risk Settings" on page 110. Configure Risk Score Aggregation Method Before you can begin working with the Risk Modeling module, you need to select a risk score aggregation method. For more information on the risk score aggregation methods and mechanism, see the Risk Score Aggregation Mechanism section in the HP EnterpriseView User Guide. To configure risk score aggregation method 1. Click Administration > Configuration. 2. In the Configuration module, in the left pane, click the Risk Aggregation Method folder, and then click the Risk Aggregation Method page. 3. In the right pane, from the Risk Aggregation Method list, select an option: n Average (default) n Override Children n Average of Children For more information on the different methods, see "Risk Score Aggregation Mechanism" on page 110. 4. Save and apply the configuration changes. For more information, see the Save and Apply Configuration Changes section in the HP EnterpriseView Deployment Guide. Configure Risk Assessment Settings Risk assessment settings include applying weights to actors and their categories, creating or deleting impacts, and selecting the number of ranks for the impact area values. To apply weights to categories and actors 1. On the EnterpriseView toolbar, click Settings. 2. On the Settings dialog box, click Risk Modeling > Actor Weights. 3. On the Actor Weights page, locate the category/actor for which you want to change the weight. To expand the category and display actors, click next to the category. Click the weight to make it editable. User Guide Chapter 4: Risk Management HP EnterpriseView (2.5) Page 107 of 265
  • 108.
    4. Enter aweight between 0 and 100. 5. Click Save. Note: You can override these settings for a specific asset, as described in "Configure Asset Risk Settings" on page 110. To manage impact area settings 1. On the EnterpriseView toolbar, click Settings. 2. On the Settings dialog box, click Risk Modeling > Impact Area. 3. Do one of the following: n To add an impact area, click the Create new impact area button. In the Name cell, enter a name for the impact area. Click the weight to make it editable and enter a weight between 0 and 100. n To delete an impact area, click the Delete impact area button. Caution: Deleting an impact area results in the reassessment of all assets. n To apply a weight to an impact area, click the weight to make it editable, and enter a weight between 0 and 100. 4. Click Save. To select the number of impact area values Note: You cannot change the number of ranks while there are risk assessments. 1. On the EnterpriseView toolbar, click Settings. 2. On the Settings dialog box, click Risk Modeling > Impact Area Values. 3. Select the number of values for the impact areas. The following table includes the score for each of the values, depending on the number of ranks User Guide Chapter 4: Risk Management HP EnterpriseView (2.5) Page 108 of 265
  • 109.
    you select: Number ofRanks Low Medium High Very High Urgent Three 33 66 100 - - Four 25 50 75 100 - Five 20 40 60 80 100 4. Click Save. Configure Risk Score Ranges You can configure the ranges for the score severity indication for the impact score, risk scores, and threat probability. Risk scores are displayed with one of the following icons: Low score Medium score High score This configuration is reflected throughout the application, wherever these measurements are displayed. For example, on the Risk Modeling Assessment page, wherever an impact score, inherent, or residual risk score is displayed. To configure risk score ranges 1. On the EnterpriseView toolbar, click the Settings button. 2. On the Settings dialog box, click Risk Modeling > Risk Score Ranges. 3. Under Risk Score Ranges, drag the slider to define the impact score, and inherent and residual risk score ranges. 4. Click Save. To define probability ranges 1. On the EnterpriseView toolbar, click Settings. 2. On the Settings dialog box, click Risk Modeling > Risk Score Ranges. 3. Under Probability Ranges, drag the slider to define the probability ranges. 4. Click Save. User Guide Chapter 4: Risk Management HP EnterpriseView (2.5) Page 109 of 265
  • 110.
    Configure Asset RiskSettings You can override the default weights applied to categories and actors for a specific asset. To override default weights for categories and actors 1. Click Risk Modeling > Threat Assignment. 2. On the Threat Assignment window, click the Asset Risk Settings button. 3. On the Asset Risk Settings dialog box, locate the category/actor for which you want to change the weight. To expand the category and display actors, click next to the category. Click the weight to make it editable. 4. Enter a weight between 0 and 100. 5. Click Save. Risk Score Aggregation Mechanism The aggregate risk score is generally defined as the weighted average of aggregate risk scores of the asset's children, but is dependant on the calculation method selected, as described below. This score is applied to an asset automatically. It is not displayed in the Risk Modeling Assessment window, but is one of the parameters in various reports and dashboards, such as the Risk Register. For more information, see "Risk Register" on page 178. There are three methods available for calculating the aggregate risk score: Note: If an asset does not have children, then the risk score is used instead of the aggregate risk score. l Average: The weighted average of aggregate risk scores of an asset's children including the risk score of asset itself. This is the default method. The asset's risk score and the aggregate risk score of its children is taken into account. AggregateRiskScoreChildren CriticalityLevel AssetRiskScore CriticalityLevel CriticalityLevel ∑( * ) + * ∑( ) l Override Children: If the asset already has a risk score, then its aggregate risk score receives the value of the risk score. If the asset does not have a risk score, then its aggregate risk score is calculated according to the Average formula. The asset's risk score takes precedence over its children's aggregate risk score. Asset risk score or AggregateRiskScoreChildren CriticalityLevel CriticalityLevel ∑( * ) ∑( ) User Guide Chapter 4: Risk Management HP EnterpriseView (2.5) Page 110 of 265
  • 111.
    l Average ofChildren: The weighted average of aggregate risk scores of an asset's children, excluding the risk score of the asset itself. The aggregate risk score children takes precedence over the asset's risk score. AggregateRiskScoreChildren CriticalityLevel CriticalityLevel ∑( * ) ∑( ) For instructions on how to configure the risk score aggregation method, see "Configure Risk Score Aggregation Method" on page 107. User Guide Chapter 4: Risk Management HP EnterpriseView (2.5) Page 111 of 265
  • 112.
    Residual Risk ScoreCalculation The residual risk score that is applied to a threat scenario is also calculated and applied separately on the actor, actor category, and asset. The following table describes how the risk scores are calculated for each of these elements. Threat Element Risk score calculation Threat Scenario The residual risk score is calculated as the Treated Impact Score multiplied by the Adjusted Probability or Treated Probability (depending on whether there are control to threat mappings). For detailed information on how the impact score is calculated, see "Impact Score Calculation" below. Actor The actor receives the score of the threat scenario with the highest risk. Actor Category The weighted average of all actor scores. Actor Score Actor Weight Actor Weights ∑( * ) ∑( ) Asset The weighted average of all actor category scores. Category Score Category Weight Category Weights ∑( * ) ∑( ) Impact Score Calculation The impact score of an identified risk is a calculation of the values associated with the impact areas of a specific threat scenario and its weight. Impact areas and their weights are defined on the organization level in Settings. For more information, see "Configure Risk Assessment Settings" on page 107. The following steps outline the formula for calculating the Impact Score: 1. For each impact area, a score is calculated separately: ImpactAreaScore= ImpactAreaValue ImpactAreaWeight* 100 2. Impact Area Scores are aggregated in a way that each additional impact area has relative influence on the final Impact Score. User Guide Chapter 4: Risk Management HP EnterpriseView (2.5) Page 112 of 265
  • 113.
    a. The firstImpact Area Score serves as a base for the Impact Score, which we will call the Temporary Impact Score. b. The second Impact Area Score is multiplied by TemporaryImpactScore100 − 100 and then added to the first Impact Area Score. The resulting score is the new Temporary Impact Score. c. Each of the consecutive Impact Area Scores is multiplied by TemporaryImpactScore100 − 100 creating a new Temporary Impact Score. After all the Impact Area Scores are aggregated, then the Temporary Impact Score = Impact Score. Example: Weight Impact Area Value Impact Area Score 50 Financial High 50 * 100 100 = 50 50 Reputation High 50 * 100 100 = 50 50 Productivity Low 50 * 33 100 = 16.5 50 Fines/Legal Low 50 * 33 100 = 16.5 50 Safety and Health Medium 50 * 66 100 = 33 Financial = 50 Financial + Reputation = 50 + 50* (100 − 50) 100 = 75 Financial + Reputation + Productivity = 50 + 50* (100 − 50) 100 + 16.5* (100 − 75) 100 = 79.125 Financial +Reputation + Productivity + Fines/Legal = 50 + 50* (100 − 50) 100 + 16.5* (100 − 75) 100 + 16.5* (100 − 79.125) 100 = 82.569 Financial +Reputation + Productivity + Fines/Legal + Safety and Health = 50 + 50* (100 − 50) 100 + 16.5* (100 − 75) 100 + 16.5* (100 − 79.125) 100 + 33* (100 − 82.569) 100 = 88.321 3. Because the formula cannot yield a maximum score of 100, the result is normalized to 100, in order to align with impact score ranges (0-100). User Guide Chapter 4: Risk Management HP EnterpriseView (2.5) Page 113 of 265
  • 114.
    In the exampleabove, the result is 88.321 and the highest possible score is 96.875 (for five impact areas, when all impact area values are High). The score, in this case, is (88.321 * 100) 96.875 =91.17. 4. The Impact Area Scores are summed and compared to the result from the formula. The lowest score of the two is the final Impact Score. In the example above, the sum of all Impact Area Scores is 50+50+16.5+16.5+33=166, which means that the final Impact Score is 91.17. This final step is done in order to make sure that the Impact Score distribution is optimal. User Guide Chapter 4: Risk Management HP EnterpriseView (2.5) Page 114 of 265
  • 115.
    Threat Library BuilderWindow The Threat Library Builder enables you to create and manage threats and their building blocks (actors and operations). The different areas and the functionalities available in each area are described in the following sections. For information on the EnterpriseView toolbar, see "Toolbar Description" on page 17. Left Pane UI Element Description <Search box> Search Search for a category, actor, or operation. Enter a name, full or partial. All matches are displayed. Actors tab The Actors tab displays all of the actors that are defined in EnterpriseView in a tree view, grouped by categories. New Category Click this button to create a new actor category. For more information, see "Create an Actor" on page 87. User Guide Chapter 4: Risk Management HP EnterpriseView (2.5) Page 115 of 265
  • 116.
    UI Element Description New Actor Clickthis button to create a new actor. For more information, see "Create an Actor" on page 87. Delete (category or actor) Select the category or actor from the actor tree, and then click this button. Deleting a category automatically deletes all of its actors. Note: Deleting an actor that is associated with a threat, automatically deletes the threat. Moreover, if the threat is already assessed, then the impact is also deleted. Edit (category or actor) Select the category or actor from the actor tree, and then click this button to edit the name and description of a category or an actor. Copy and Paste (actor) You can duplicate actors using the copy/paste functionality. Select an actor from the actor tree, and then click the Copy button. On the actor tree, click the category to which you want to copy the actor, and then click the Paste button. You can copy the actor under the same category. A new actor is created with the following name: Copy of <original actor name> You can rename the actor by clicking the Edit button. If the actor is connected to operations, then associations are also copied. Connect Actor to Operation Select an actor from the actors tree, click an operation on the graph, and then click this button. This button is enabled only when the actor and operation are not yet connected. Operations tab The Operations tab displays a list of all the operations defined in EnterpriseView. User Guide Chapter 4: Risk Management HP EnterpriseView (2.5) Page 116 of 265
  • 117.
    UI Element Description New Operation Clickthis button to create a new operation. For more information, see "Create an Operation" on page 88. Edit Operation Select the operation from the operation list, and then click this button to edit the name and description of the operation. Delete Operation Select the operation from the operation list, and then click this button. Note: Deleting an operation that is associated with a threat, automatically deletes the threat. Moreover, if the threat is already assessed, then the impact is also deleted. Connect Operation to Actor Select an operation or operations (press CTRL to multi-select) from the operations list, click the actor in the graph, and then click this button. The operation/operations that you selected are connected to the actor and displayed in the map area. User Guide Chapter 4: Risk Management HP EnterpriseView (2.5) Page 117 of 265
  • 118.
    Graph Area The grapharea displays a graphic depiction of the threats in the threats library. You can choose to display one threat or multiple threats. l To display threats: On the Actors tab, open the category, select the actors that you want to display, and drag them to the map area. l To display a category’s actors and their connected operations: On the Actors tab, select the categories that you want to display and drag them to the map area. l To disconnect an operation from an actor, in the graph area, click the operation that you want to disconnect, and then press DELETE. Mini-Map When a threat includes multiple operations and is larger than the graph area, you can navigate it by clicking and dragging in the mini-map area. To expand or collapse the mini-map, click the Expand/Collapse button. User Guide Chapter 4: Risk Management HP EnterpriseView (2.5) Page 118 of 265
  • 119.
    Threat Assignment Window TheThreat Assignment window enables you to create threat scenarios by assigning threats to assets. The different areas and the functionalities available in each area are described in the following sections. For information on the EnterpriseView toolbar, see "Toolbar Description" on page 17. Toolbar UI Element Description <Asset Selector> Select the asset for which you want to create threat scenarios. Select an asset from the list or search for an asset by entering its name. Graph (view) In this view the window is divided into the following sections: l Toolbar l Left pane l Map area l Properties pane l Mini-map This is the default view. Table (view) In this view, all threats are displayed in a table. You can associate a threat with an asset or unassociate a threat from an asset. Asset Risk Settings Override the default weights applied to categories and actors for a specific asset. User Guide Chapter 4: Risk Management HP EnterpriseView (2.5) Page 119 of 265
  • 120.
    Left Pane The leftpane is divided into two areas: l Associated Threats: The top area displays all the threats that are associated with the asset. l Unassociated Threats: The bottom area displays all the threats that are not associated with the asset. UI Element Description <Search Threats> Search for threats by operation. Start typing an operation name to filter the list of associated and unassociated threats. <Threats tree> The threats tree displays all of the actors and their associated operations, grouped by category. The category is the first level, the actor is the second level, and its associated operations is the third level, displayed in alphabetical order. User Guide Chapter 4: Risk Management HP EnterpriseView (2.5) Page 120 of 265
  • 121.
    UI Element Description Add Addthreats to asset From the Unassociated Threats area, select the threats that you want to assign to an asset, and then click this button. The threat scenario is displayed in the map area. For more information, see "Assign Threats to Assets" on page 89. Remove Remove the selected threat from the asset From the Associated Threats area, select the threats that you want to remove from the asset, and then click this button. The threat scenario is removed from the graph area. For more information, see "Assign Threats to Assets" on page 89. Graph Area The graph area displays the following information: l Asset name: Appears in the upper left side. l Threat scenario graph: Displays (from top to bottom) the category, actor, and operation. Clicking the graph entity displays its properties in the Properties pane on the right. User Guide Chapter 4: Risk Management HP EnterpriseView (2.5) Page 121 of 265
  • 122.
    Properties Pane UI Element Description CategoryProperties Includes the name and description of the threat category. Actor Properties Includes the name and description of the threat actor. Operation Properties Includes the name and description of the threat operation. Mini-map When a threat includes multiple operations and is larger than the graph area, you can navigate it by clicking and dragging in the Mini-map area. To expand or collapse the mini-map, click the Expand/Collapse button. User Guide Chapter 4: Risk Management HP EnterpriseView (2.5) Page 122 of 265
  • 123.
    Risk Assessment andTreatment Window The Risk Assessment and Treatment window enables you to assess risks on assets and treat them. The different areas and the functionalities available in each area are described in the following sections. For information on the EnterpriseView toolbar, see "Toolbar Description" on page 17. Toolbar UI Element Description <Asset Selector> Select the asset that you want to assess or treat from this list or search for an asset by entering its name. Assessment and Treatment In this view, the window is divided into the following sections: l Toolbar l Asset Summary l Left pane l Assessment Area l Treatment Area This view allows you to both assess and treat risks. It is the default view. Assessment View In this view, the window is divided into the following sections: l Toolbar l Asset Summary l Table This view provides assessment information on each threat scenario. User Guide Chapter 4: Risk Management HP EnterpriseView (2.5) Page 123 of 265
  • 124.
    Asset Summary The assetsummary includes the number of risks that the asset has and the residual risk score of the asset. For information on how the residual risk score of the asset is calculated, see "Residual Risk Score Calculation" on page 112. Left Pane UI Element Description <Search Threats> Search for threats by operation. Start typing an operation name to filter the list of associated and unassociated threats. <Associated Threats> The threats tree displays all of the actors and their associated operations, grouped by category. The category is the first level, the actor is the second level, and its associated operations is the third level, displayed in alphabetical order. These threats are assigned to the asset and need to be assessed and treated. You can select a threat by expanding the tree. User Guide Chapter 4: Risk Management HP EnterpriseView (2.5) Page 124 of 265
  • 125.
    Assessment Area The assessmentarea enables you to assess the risk for a specific threat scenario. When you open this page, then this area is displayed in a summary view. To perform an assessment, click the Edit Assessment button. UI Element Description Risk Status Change the status of the risk in order to reflect the life cycle of the risk. The statuses are: l Not Assessed: This status means that the threat is assigned to the asset, but that it has not been assessed yet. l Assessed: This status means that the risk on the threat scenario has been assessed, but has not been treated. l Treatment in Progress: This status means that you have created a treatment plan, but that it has not yet been carried out fully. l Treatment Completed: This means that the risk has been treated and that the treatment plan and all the action plans derived from the treatment plan have been carried out. User Guide Chapter 4: Risk Management HP EnterpriseView (2.5) Page 125 of 265
  • 126.
    UI Element Description Notes Click thisbutton to add or view notes. To add a note, on the Notes dialog box, enter a note, and then click Add. Attachments Click this button to upload, delete, or download attachments. Impact Areas Impact areas comprise the impact of a risk. You can add, edit, delete impact areas, and change their weights as described in "Configure Risk Assessment Settings" on page 107. To assign an impact area value, click in the Value cell and select the appropriate value. For information on the score behind each value, see "Configure Risk Assessment Settings" on page 107. Risk Tolerance Level The maximum level of risk exposure that you are willing to accept for this asset in this threat scenario. Enter a number between 0 and 100. If the inherent risk score and residual risk score are higher that the risk tolerance level, then a warning is displayed below these scores. Impact Score The impact score is a calculation of all the values of the impact areas. For information on how this score is calculated, see "Impact Score Calculation" on page 112. Probability The probability that this threat will occur. Enter a number between zero and one. Inherent Risk Score The risk to an asset, for a specific threat scenario, in the absence of any actions you might take to alter either the probability or impact. This is the risk before treatment. This score is calculated as the impact score multiplied by the probability (Inherent Risk Score = Impact Score X Probability). User Guide Chapter 4: Risk Management HP EnterpriseView (2.5) Page 126 of 265
  • 127.
    Treatment Area The treatmentarea enables you to handle the risk for a specific threat scenario. When you open this page, then this area is displayed in a summary view. To perform view and edit treated risk score, click the Edit Treatment button. UI Element Description Notes Click this button to add or view notes. To add a note, on the Notes dialog box, enter a note, and then click Add. User Guide Chapter 4: Risk Management HP EnterpriseView (2.5) Page 127 of 265
  • 128.
    UI Element Description Attachments Click thisbutton to upload, delete, or download attachments. Impact Areas See "Impact Areas" on page 126. Before you begin treatment, the values of the impact areas are the same as those presented in the Assessment area. After you carry out your treatment plan, you can manually modify the impact areas to reflect the reduced risk. Treated Impact Score See "Impact Score" on page 126. Before you begin treatment, the treated impact score is the same as the impact score presented in the Assessment area. After you carry out your treatment plan, and you modify the impact areas to reflect the reduced risk, then a new impact score is calculated. Treated Probability See "Probability" on page 126. Before you begin treatment, the treated probability is the same as the probability presented in the Assessment area. After you carry out your treatment plan, you can manually modify the probability to reflect the reduced risk. This threat scenario is affected by <n> controls.The probability is reduced/increased by m%. This indication is displayed only if the controls that are mapped to the threat are also attached to the asset that is being assessed. Click the "n controls" link to view information about these controls. For more information on control to threat mapping, see "Mitigate Risk Automatically Using Policy Controls" on page 95. In this case, control compliance scores can either reduce or increase the treated probability. The result is the Adjusted Probability. Adjusted Probability The adjusted probability is the treated probability after it has been reduced or increased by control compliance scores. See explanation above. Residual Risk Score The residual score is the risk that remains after you have attempted to mitigate the inherent risk. It is calculated as the treated impact score multiplied by the adjusted probability (Residual Score = Treated Impact Score X Adjusted Probability). User Guide Chapter 4: Risk Management HP EnterpriseView (2.5) Page 128 of 265
  • 129.
    Chapter 5: VulnerabilityManagement In EnterpriseView, a vulnerability is a flaw or a weakness in a software application or a system configuration issue that can be exploited by an attacker and used to gain access to a system or a network or impact the confidentiality, integrity, and availability of a system or a network. For example, a user account that does not have a password, or an input validation error, such as SQL injection. EnterpriseView supports three types of vulnerabilities: l Network l Application l Configuration For more information on each type, see "Vulnerability Types" on the next page. The Vulnerabilities module enables you to manage the life cycle of vulnerabilities in your organization including collection, aggregation, prioritization, and remediation. For more information on the vulnerability life cycle, see "About the Vulnerability Life Cycle" on page 133. You can manage the vulnerability's life cycle by applying statuses aiding you in managing remediation, as described in "Manage the Vulnerability Life Cycle" on page 135. The Vulnerabilities module enables you to view vulnerabilities that affect an asset and its children in a summarized view or a detailed view. Both views offer filtering capabilities so that, for example, vulnerabilities can be viewed within a specific score range or a specific location. EnterpriseView assigns vulnerabilities to specific assets in your business model, but you can also attach or remove vulnerabilities to assets manually, as described in "Attach a Vulnerability to an Asset" on page 135. Asset vulnerability scores are derived from vulnerability scores (see "Common Vulnerability Scoring System" on page 131) and the asset's criticality level (see "Criticality Level" on page 33) and are trickled up and aggregated to top-level assets, providing business context to the state of your organization's security. EnterpriseView imports vulnerability information from output generated by the following vulnerability assessment tools: l Tenable Nessus Vulnerability Scanner l McAfee Vulnerability Manager (Foundscan) l Qualys Guard l Rapid7 Nexpose l HP WebInspect The vulnerability information is imported into EnterpriseView using ArcSight SmartConnectors. For information on deploying ArcSight SmartConnectors, see the Import Vulnerabilities From Vulnerability Assessment Tools section in the HP EnterpriseView Deployment Guide. HP EnterpriseView (2.5) Page 129 of 265
  • 130.
    EnterpriseView is CVE(Common Vulnerabilities and Exposures) and CCE (Common Configuration Enumeration) compliant, aligned with most established dictionary of common names for publicly known information security vulnerabilities. However, EnterpriseView also supports management of vulnerabilities from sources that do not have a CVE or a CCE classification. The same vulnerability can be reported numerous times and by numerous vulnerability assessment tools. EnterpriseView aggregates these reports into a single vulnerability, in order to eliminate duplication of data, allowing you to manage the vulnerability only once. You can archive closed application and network vulnerabilities, as described in the Archive Vulnerabilities section in the HP EnterpriseView Administration Guide. Vulnerability Types EnterpriseView distinguishes between three vulnerability types: l Web Application (referred to as "Application" in the user interface) l Network l Configuration Following is a description of each type of vulnerability: Web Application Web application vulnerabilities are vulnerabilities that are found by Web application vulnerability scanners. A Web application vulnerability scanner communicates with a Web application (a 3rd party application or a custom application) through the application's URL in order to identify vulnerabilities in the application and its architecture. The scanner searched for security flaws based on a database of known flaws. Examples of Web application vulnerabilities include: cross-site scripting, SQL injection, and remote file inclusion. Network Network vulnerabilities are vulnerabilities that are found by network vulnerability scanners. A network vulnerability scanner scans all the network elements (such as operating system, ports, services, and firewalls) and runs tests applicable to each host. An example of a network vulnerability is include: TCP/IP stack buffer overflow. Configuration Configuration vulnerabilities are actually misconfigurations in network elements, such as servers, applications, and firewalls. Configuration checks are defined in a configuration file provided in OVAL (Open Vulnerability and Assessment Language) format and are entered into the scanner. Examples of configuration checks include: port numbers that are higher than 2000 must be closed User Guide Chapter 5: Vulnerability Management HP EnterpriseView (2.5) Page 130 of 265
  • 131.
    to communication, andall users defined in an Active Directory must have a password with over X characters and must include special characters. The scanner provides information for both correct configurations and misconfigurations, as opposed to Web application and network vulnerabilities, which only report weaknesses. Most vulnerability properties are shared between the different types, but there are also some differences. For more information on the various vulnerability properties. see "Vulnerability Properties" on page 140. Common Vulnerability Scoring System The Common Vulnerability Scoring System (CVSS) is an industry standard vulnerability scoring system for assessing the severity IT vulnerabilities. It is widely adopted by commercial and open- source products, such as McAfee, National Vulnerability Database, Qualys, and Tenable network Security. EnterpriseView uses CVSS v2 as the scoring system for the network and application vulnerabilities defined in the vulnerability dictionary. For more information on the vulnerability dictionary, see "Vulnerability Dictionary" on page 156. The score defined in the vulnerability dictionary is based on the following metrics: l Base:  Represent the intrinsic qualities of a vulnerability. l Temporal: Represent the characteristics of a vulnerability that change over time but are not related to your organization's environment. Because temporal metrics are dynamic by nature, the vulnerability score is regularly updated by EnterpriseView labs. Every time you update the vulnerability dictionary in EnterpriseView, you receive the most updated vulnerability scores. In addition to the vulnerability score, EnterpriseView displays the scoring vector, providing you a breakdown of the score calculation. For more information on the vulnerability score, see "Vulnerability Properties" on page 140. After a vulnerability is attached to an asset, the vulnerability score on that asset is recalculated to include environmental metrics. Therefore, the vulnerability score defined in the vulnerability dictionary will usually be different than the vulnerability score on a specific asset. Configuration Vulnerabilities Scoring Method Configuration vulnerabilities utilize a different scoring method than network and application vulnerabilities. For more information on the network and application vulnerability scoring method, see "Common Vulnerability Scoring System" above The score of configuration vulnerabilities depends on a combination of the vulnerability status and the configuration check results provided by the scanner. Common check result values include: Pass, Fixed, Error, Failed, Unknown, Not Applicable, Not Checked, not Selected, and Warning. These results can be divided into the following categories: User Guide Chapter 5: Vulnerability Management HP EnterpriseView (2.5) Page 131 of 265
  • 132.
    Category Check Results Referredto in EnterpriseView As Configured correctly Pass and Fixed Passed Misconfigured Failed and Error Failed Correct configuration could not be determined Unknown, Not Applicable, Not Checked, not Selected, and Warning Unknown Check Result Categories Any check result that you receive will fall into one of these three categories, even if it is a different value that the values listed above. When a configuration vulnerability enters EnterpriseView, it automatically receives a score: l Vulnerabilities that are configured correctly are given the status Closed and receive the score 0. l Vulnerabilities that are misconfigured are given the status Open and receive the score 10. l Vulnerabilities for which correct configuration could not be determined are given the status Open and receive the score 5. Because you have the ability to change the vulnerability status manually, there can be other combinations. The following table includes all combinations and their score. Vulnerability Status Category Score Closed All 0 Open Misconfigured 10 Open Correct configuration could not be determined 5 Open Configured correctly 10 Configuration Vulnerabilities Scoring Method User Guide Chapter 5: Vulnerability Management HP EnterpriseView (2.5) Page 132 of 265
  • 133.
    About the VulnerabilityLife Cycle In EnterpriseView, the vulnerability life cycle is managed by using the vulnerability's status (see "Status" on page 143) and the vulnerability's remediation status (see "Remediation Status" on page 142). For more information about managing the vulnerability life cycle, see "Manage the Vulnerability Life Cycle" on page 135. Vulnerability remediation has both manual and automatic aspects. For more information on the automatic aspects, see the About the Vulnerability Import Job section in the EnterpriseView Deployment Guide. The following example outlines how to manage the vulnerability life cycle: 1. When a vulnerability occurrence is first imported into EnterpriseView, it can have one of the following status combinations: n A New remediation status and an Open status. Remediation status Reopened is handled the same as remediation status New. n A Passed remediation status and a Closed status, relevant only for configuration vulnerabilities. Does not require further handling. 2. A user with an appropriate role assigns New and Reopened vulnerabilities to users for handling. Note: Users can use the Notes parameter to communicate information to one another or for any other comments that the user wants to document. 3. The user to whom the vulnerability is assigned must first determine whether the vulnerability is an actual problem. n If the vulnerability is not found to be significant, then the user can close it, and change its remediation status to Not an Issue. Cases in which vulnerabilities are identified as non- issues include vulnerabilities that have very low scores, when the organization uses security tools that provide virtual patching to solve security issues in the network, and any other case in which insignificant reports unnecessarily overload the system. n If the vulnerability is found to be significant, then the user investigates methods for solving the problem. The user can use the Solution parameter (see "Solution" on page 146 to help solve the problem. When the solution is found, the user changes the remediation status to Awaiting Remediation. 4. After the vulnerability is fixed, the user changes the vulnerability's remediation status to Awaiting Verification. 5. The user verifies that the vulnerability is fixed by rescanning the network. 6. If the vulnerability is not reported, then the user changes the vulnerability status to Closed and the remediation status to Resolved. User Guide Chapter 5: Vulnerability Management HP EnterpriseView (2.5) Page 133 of 265
  • 134.
    7. If anew vulnerability instance is reported for a closed and resolved vulnerability, then the vulnerability status is changed to Open and the remediation status is changed to Reopened, automatically. 8. Closed network and application vulnerabilities can be archived if they have not been updated or reported for certain (configurable) amount of time. For more information, see the Archive Vulnerabilities section in the HP EnterpriseView Administration Guide. The following flowchart depicts the process described above. User Guide Chapter 5: Vulnerability Management HP EnterpriseView (2.5) Page 134 of 265
  • 135.
    Manage the VulnerabilityLife Cycle You can change vulnerability statuses, as described in the following procedure. For information on the vulnerability life cycle, see "About the Vulnerability Life Cycle" on page 133. To manage the vulnerability life cycle 1. Click Vulnerabilities > Management. 2. From the grid, select the relevant vulnerability, and then click the Details View button. 3. In the Status Management, perform the following steps, and then click Save: a. If required, change the Status field. b. From the Remediation Status list, select the relevant status. c. If required, use the Notes parameter to communicate information with other users or for any other comments that you want to document. Attach a Vulnerability to an Asset During the Vulnerability Import Job, vulnerabilities are mapped and attached to assets. For more information, see the About the Vulnerability Import Job section in the HP EnterpriseView Deployment Guide. In some cases, vulnerabilities cannot be mapped to assets, which results in unattached vulnerabilities. You can manually attach vulnerabilities to assets through the Vulnerability Assignment window. You can also detach vulnerabilities from one asset and reattach them to a another asset. Users with VIEW VULNERABILITIES permissions can view unattached vulnerabilities, regardless of their asset access rights. After a vulnerability is attached to an asset, only users with access rights to that asset can see the vulnerabilities. Note: In order to put vulnerabilities in a business context, it is important to attach all vulnerabilities to assets. The more vulnerabilities are attached to assets the more accurate the overall asset risk score will be. To attach a vulnerability to an asset 1. Click Vulnerabilities > Assignment. 2. On the Vulnerability Assignment window, in the Assets pane, select the asset to which you want to attach a vulnerability/vulnerabilities using either of the following methods: n In the Organization tab, expand the organization tree. n In the Search tab, enter the asset name or a partial name. User Guide Chapter 5: Vulnerability Management HP EnterpriseView (2.5) Page 135 of 265
  • 136.
    The Unattached Vulnerabilitiespane displays all the vulnerabilities that have been imported into EnterpriseView that are not currently attached to an asset. 3. If necessary, you can filter the vulnerabilities according to the vulnerability score or status, or by clicking More Filters. For more information on the vulnerability properties in the Filter Vulnerabilities dialog box, see "Summary View Grid" on page 140. 4. From the Unattached Vulnerabilities, select the vulnerability that you want to attach to the asset, and then click . You can also select multiple vulnerabilities by pressing CTRL and selecting the vulnerabilities from the list. The vulnerability/vulnerabilities are displayed in the Attached Vulnerabilities pane. To detach a vulnerability from an asset 1. Click Vulnerabilities > Assignment. 2. On the Vulnerability Assignment window, in the Assets pane, select the asset from which you want to detach the vulnerabilities. 3. From the Attached Vulnerabilities pane, select the vulnerability or vulnerabilities that you want to detach from the asset, and then click . The vulnerability/vulnerabilities are displayed in the Unattached Vulnerabilities pane. Vulnerability Settings You can configure the following vulnerability settings: l Decide how the asset vulnerability score should be aggregated, as described in "Configure Asset Vulnerability Score Aggregation Parameters" below l Define the thresholds that indicate the severity of your vulnerability scores, as described in "Configure Vulnerability Score Ranges" on the next page l Decide how to determine the asset vulnerability score, as described in "Configure Asset Vulnerability Score Formula" on the next page Configure Asset Vulnerability Score Aggregation Parameters You can configure the asset vulnerability score aggregation parameters to better suit your business needs and your organization's structure. For more information on these parameters, see "Asset Vulnerability Score Aggregation Mechanism" on page 147. User Guide Chapter 5: Vulnerability Management HP EnterpriseView (2.5) Page 136 of 265
  • 137.
    To configure assetvulnerability score aggregation parameters 1. On the EnterpriseView toolbar, click the Settings button. 2. In the Settings dialog box, click Vulnerabilities > Asset Vulnerability Score Aggregation. 3. In the Asset Vulnerability Score Aggregation page, enter the following information: n Maximum Children in Calculation. Lower the impact of the children severity on the score. n Children Multiplier. Lower the impact of the children on the score. Note: This change recalculates scores for the entire business model, therefore it might take some time until the updated scores are apparent. 4. Click Save. Configure Vulnerability Score Ranges You can configure the ranges for the score severity indication for vulnerability scores. Vulnerability scores are displayed with one of the following icons: Low score Medium score High score This configuration is reflected throughout the application, wherever these scores are displayed. For example, on the Vulnerability Management page, in the Score column in the grid. To configure vulnerability score ranges 1. On the EnterpriseView toolbar, click the Settings button. 2. In the Settings dialog box, click Vulnerabilities > Vulnerability Ranges. 3. Under Vulnerability Score Ranges, drag the slider to define the score ranges. 4. Click Save. Configure Asset Vulnerability Score Formula The asset vulnerability score is affected by all the vulnerabilities that are attached to the asset. You can select one of the following methods for calculating the asset vulnerability score: User Guide Chapter 5: Vulnerability Management HP EnterpriseView (2.5) Page 137 of 265
  • 138.
    l Max score: Theasset vulnerability score is the score of the vulnerability with the highest score out of all the vulnerabilities attached to the asset. With this method, all vulnerability types are equal. For example: An asset has three vulnerabilities attached. The vulnerabilities have the following scores: Vul1=7 Vul2=9 Vul3=4 In this case, the asset vulnerability score is 9. l Weighted average: The asset vulnerability score is the weighted average of the highest vulnerability score out of each vulnerability type. The formula is:  HighestScoreFor VulnerabilityType Weight Weights Σ * Σ . With this method, you can decide whether one vulnerability type is more influential than another type. For example: An asset has four vulnerabilities attached; two configuration vulnerabilities and two network vulnerabilities. The vulnerabilities have the following scores: n Network Vul1=7 Vul2=4 n Configuration Vul3=10 Vul4=0 User Guide Chapter 5: Vulnerability Management HP EnterpriseView (2.5) Page 138 of 265
  • 139.
    Network vulnerabilities havea weight of 100, while configuration vulnerabilities have a weight of 50. Out of the network vulnerabilities , the highest score is 7. Out of the configuration vulnerabilities, the highest score is 10. The calculation is: (100*7+50*10)/(100+50) and the asset vulnerability score is 8. The method that you select for calculating the asset vulnerability score affects the aggregate asset vulnerability score. The aggregation method is also configurable, as described in "Configure Asset Vulnerability Score Aggregation Parameters" on page 136. To configure the asset vulnerability score formula 1. On the EnterpriseView toolbar, click the Settings button. 2. In the Settings dialog box, click Vulnerabilities > Asset Vulnerability Score Formula. 3. Select one of the following options: n The score of the vulnerability with the highest score out of all the vulnerabilities attached to the asset n The weighted average of the highest vulnerability score out of each vulnerability type 4. If you selected The weighted average of the highest vulnerability score out of each vulnerability type, set the weights for each of the vulnerability types by dragging the slider. If you set the weight to zero, then all the vulnerabilities of that type will not affect the vulnerability asset score. 5. Click Save. User Guide Chapter 5: Vulnerability Management HP EnterpriseView (2.5) Page 139 of 265
  • 140.
    Vulnerability Properties The followingtables describe all the vulnerability properties according to where they are displayed in the Vulnerabilities module. Some properties are relevant only to specific vulnerability types. Summary View Grid The Summary View is available from the Vulnerability Management window. Each record in the summary view grid is an occurrence of a vulnerability in a specific location. Property Description ID A common classification ID. This ID can be defined in the vulnerability dictionary or not. It can be a CVE, CCE, or identification provided by the scanner. CVE IDs are linkable to the NVD website. Type See "Vulnerability Types" on page 130. Score The vulnerability score is the severity level of the vulnerability expressed as a number between 0 and 10. It is calculated by EnterpriseView labs. The scoring system varies between the different vulnerability types: l Network and Web application vulnerabilities The score is CVSS version 2.0 compliant. For more information, see "Common Vulnerability Scoring System" on page 131. Scores of new vulnerabilities that do not exist in the dictionary are imported from the scanner and are normalized to the EnterpriseView scoring system. l Configuration vulnerabilities  The score is determined according to the vulnerability status and the check results from the scanner. For more information, see "Configuration Vulnerabilities Scoring Method" on page 131. User Guide Chapter 5: Vulnerability Management HP EnterpriseView (2.5) Page 140 of 265
  • 141.
    Property Description Location Thelocation displayed depends on the type of the vulnerability. Each type has the following location formats: l Network and configuration: <Hostname>:<Network Port>. Hostname and IP address are interchangeable. l Application: <Normalized URI>:<Vulnerable Parameter>. The original URI indicating the location of the vulnerability is normalized by the Vulnerability Import Job. The vulnerable parameter is isolated from the query string passed in the original URI. User Guide Chapter 5: Vulnerability Management HP EnterpriseView (2.5) Page 141 of 265
  • 142.
    Property Description Remediation StatusThe remediation status depends on the vulnerability status, meaning that a vulnerability with status Open has different remediation status options than a vulnerability with status Closed. Some statuses can be applied manually and some are applied automatically by EnterpriseView. The following options are available: l New: The default remediation status for open vulnerabilities. l Passed: Applicable to only for configuration vulnerabilities. The remediation status for vulnerabilities that have passed the configuration check. This remediation status is given automatically by the system, according to the check status reported by the scanner. For more information, see Last Scan Status. Because the configuration is correct, the vulnerability status is Closed. l Reopened: A closed vulnerability can be automatically reopened by EnterpriseView if a new instance of the same vulnerability occurrence is found. l Assigned: An open vulnerability is assigned to a system user. l Awaiting Remediation: Remediation for an open vulnerability was found, but has not been applied. l Not an Issue: A closed vulnerability that was identified as irrelevant to the organization, due to its severity, to the probability of an attack using this vulnerability or for any other reason defined by the organization. A vulnerability with this status will not be reopened. l Awaiting Verification: Remediation was applied to a vulnerability, but was not verified. l Resolved: The vulnerability was fixed. l Automatically Closed: Applicable only for network and application vulnerabilities. This status is assigned automatically when a vulnerability has been open for more than N days and none of its properties have been changed (based on the Last Updated On property). The number of days is configurable in the Configuration module. For more information, see the Schedule and Activate Vulnerabilities Import Job section in the HP EnterpriseView Deployment Guide. User Guide Chapter 5: Vulnerability Management HP EnterpriseView (2.5) Page 142 of 265
  • 143.
    Property Description Status Thefollowing options are available: l Open: The default status of all vulnerabilities that are imported into EnterpriseView. As long as the vulnerability exists, its status is open. A vulnerability can be reopened automatically by EnterpriseView if a new instance of the same vulnerability occurrence is found. l Closed: You can manually change the status to Closed. Open vulnerabilities are automatically closed by EnterpriseView if they have been open for more than N days. The number of days is configurable in the Configuration module.For more information, see the Schedule and Activate Vulnerabilities Import Job section in the HP EnterpriseView Deployment Guide. Closed vulnerabilities do not affect the vulnerability scores of assets in the business model. Attached to Asset The asset name in the EnterpriseView business model to which the vulnerability is attached. Vulnerabilities can be attached automatically to IP assets according to their host, IP address or MAC address. Vulnerabilities can also be attached manually to assets. If a vulnerability is not attached to an asset, then this field is empty. For more information, see "Attach a Vulnerability to an Asset" on page 135. Times Reported The number of instances of a vulnerability occurrence. Imported vulnerabilities can be reported more than once, either by different vulnerability assessment tools or due to multiple scans from the same tool. First Reported On The date that the vulnerability occurrence was first reported, as recorded by the external source from which the vulnerability was imported. Format: Mon Day, Year Example: Jan 16, 1970 Last Reported On The date that the vulnerability occurrence was last reported, as recorded by the external source from which the vulnerability was imported. Title A short description of the vulnerability. Details View The Details View is available from the Vulnerability Management window. The Details View displays information on a single vulnerability occurrence. User Guide Chapter 5: Vulnerability Management HP EnterpriseView (2.5) Page 143 of 265
  • 144.
    Category Property Description GeneralID See "ID" on page 140 Type See "Vulnerability Types" on page 130. Score See "Score" on page 140. Related CVEs Not relevant for configuration vulnerabilities. The CVE identifiers of related vulnerabilities. Defined by EnterpriseView labs. CVE IDs are linkable to the NVD website. References The identifiers defined by various sources for vulnerabilities that are similar or related to the vulnerability defined in the EnterpriseView vulnerability dictionary. CVE IDs are linkable to the NVD website. Groups Vulnerabilities are grouped according to different vulnerability categories. EnterpriseView adopted the Common Weakness Enumeration (CWE) system for identifying most vulnerability groups. Other vulnerability groups are internal and can be identified by an "EVG" prefix. CWE IDs are linkable to the NVD website. Details A detailed description of the vulnerability. Location See "Location" on page 141. Attached to Asset See "Attached to Asset" on the previous page Times Reported See "Times Reported" on the previous page. First Reported On See "First Reported On" on the previous page Last Updated On The last time that one of the properties of the vulnerability occurrence was changed. This property is not updated if a vulnerability is attached or detached from an asset or if a new note has been added. User Guide Chapter 5: Vulnerability Management HP EnterpriseView (2.5) Page 144 of 265
  • 145.
    Category Property Description LastScan Status Relevant only for configuration vulnerabilities. Typically, scanners provide a status for configuration vulnerability checks. Common values include: Pass, Fixed, Error, Unknown, Not Applicable, Not Checked, not Selected, and Warning. If a scanner provides such a status, then it is displayed as this property. If the last scan status is Passed or Fixed, then the remediation status is Passed. For more information, see "Remediation Status" on page 142. Host The host where the vulnerability was found. Port Relevant only for network vulnerabilities. The port where the vulnerability was found. Vulnerable Parameter Relevant only for application vulnerabilities. The parameter from the URI that is used to exploit the vulnerability. For example, User ID can be the vulnerable parameter in case of an SQL injection vulnerability. Platform Relevant only for configuration vulnerabilities. The application or operating system where the vulnerability was found. Associated Technical Mechanism Relevant only for configuration vulnerabilities. The method by which the configuration is implemented. Conceptual Parameters Relevant only for configuration vulnerabilities. A list of valid values of the field or property that needs to be configured. Note: the following properties are relevant only for network and application vulnerabilities; they are not relevant for configuration vulnerabilities. User Guide Chapter 5: Vulnerability Management HP EnterpriseView (2.5) Page 145 of 265
  • 146.
    Category Property Description CVSSBase Score Represents the intrinsic qualities of a vulnerability. This score is static. For more information on CVSS, see "Common Vulnerability Scoring System" on page 131. Temporal Score Represent the characteristics of a vulnerability that change over time but are not related to the organization's environment. This score is updated when the vulnerability dictionary content is updated, as described in the About the Dictionary Information Import Job section in the HP EnterpriseView Administration Guide. For more information on CVSS, see "Common Vulnerability Scoring System" on page 131. Vector The components from which the score was calculated and their values. Both base and temporal metrics. Click the Show link to see how the score was derived. Remediation Solution A recommended solution for fixing the vulnerability, as provided from the vulnerability assessment tool. Filter (TippingPoint) The signature number of the TippingPoint filter. Instances The Instances tab is available from the Details View page. The Instances tab includes all the instances reported for a single vulnerability occurrence. The data displayed is provided by the connectors. Property Description Reported On The date and time that the vulnerability instance was reported by the connector. Source Rule ID The identifier of the rule that corresponds to the vulnerability defined in the vulnerability assessment tool. CVEs A list of CVEs that correspond to the scanner rule, as provided by the connector. Scanner The name of the vulnerability assessment tool. Scanner Type Network or Application. Scanner Version The version of the vulnerability assessment tool. User Guide Chapter 5: Vulnerability Management HP EnterpriseView (2.5) Page 146 of 265
  • 147.
    Property Description Origin Informationon the instance origin. A concatenation of the following parameters separated by a dash: l Source name: Nessus, Qualys, McAfee, or WebInspect. l The output of the scanner, either file name or URL l CSV file name (connector output) l The line number where the vulnerability was reported in the CSV file Example, Nessus-/home/Credit Card Vulns/Visa/nessus_report_ WebTrends.nessus- 2011-09-06-17-42-19.done.csv-555 IP Relevant for network and configuration vulnerabilities. IP address where the vulnerability was found. MAC Relevant for network and configuration vulnerabilities. MAC address where the vulnerability was found. Asset Vulnerability Score Aggregation Mechanism The aggregate asset vulnerability score is calculated as the higher score out of the following: l The direct asset vulnerability score, which is the highest score out of all the vulnerability scores of open vulnerabilities that are associated with the asset. l m n * AggregatedAssetVulnerabilityScore CriticalityLevel of top Children CriticalityLevel ∑( * ) ∑( ) n m=Children Multiplier: This variable is a number between 0 and 1 (inclusive) that is typically used to decrease the impact of the children on the aggregate asset vulnerability score; the lower the number, the smaller the effect. Consider the structure of your business model when configuring this variable. For example, if you have a flat organizational structure, then the children will have a bigger impact then if you have a structure with many levels of hierarchy. n n=Maximum Children in Calculation: Sorted primarily by aggregate asset vulnerability score and secondarily by criticality level. This variable is used to decrease the impact of the children severity on the aggregate asset vulnerability score; the higher the number, the smaller the impact. Consider the structure of your business model when configuring this variable. For example, if assets in your business model have a maximum of five children each, then it would be meaningless if this variable is configured to six. User Guide Chapter 5: Vulnerability Management HP EnterpriseView (2.5) Page 147 of 265
  • 148.
    For more informationon configuring these variables, see the Configure Vulnerability Score Aggregation Parameters section in the HP EnterpriseView Deployment Guide. Vulnerability Error Handling Vulnerability assessment tools generate reports in a variety of formats, such as an XML file or into a database. The information is converted to CSV format using connectors. The Vulnerability Import Job retrieves the CSV files, processes the information and writes it to the EnterpriseView database. For more information on the Vulnerability Import Job, see the About the Vulnerability Import Job section in the HP EnterpriseView Deployment Guide. The connectors write the CSV file to the <EnterpriseView Installation folder>vmimportpending<connector ID> folder. The Vulnerability Import Job processes the files and does the following: l Successfully processed files are moved to the <EnterpriseView Installation folder>vmimportdone<connector ID> folder. When vulnerabilities are not defined in the vulnerability dictionary, their records might contain data that was not fully imported into EnterpriseView due to format constraints. In these cases, the data is truncated, and only partial information is displayed. For example,the Description field in EnterpriseView can be a maximum of 4000 characters, but the field in the file holds a value of 5000 characters. In this case, only the first 4000 characters are imported and displayed. If a record is modified then a notification, indicated by "INFO", is entered into the redcat- vulnerability-admin.log file that is located in the <EnterpriseView Installation folder>logs folder. l Files containing erroneous records are moved to the <EnterpriseView Installation folder>vmimporterrors<connector ID> folder. If an erroneous record exists, then the record is skipped and an error message is entered into the redcat-vulnerability-admin.log file that is located in the <EnterpriseView Installation folder>logs folder. In either case, vulnerability information is displayed in the Vulnerability Management window. The Last Imported On field on the toolbar of the Vulnerability Management window displays the date and time of the most recent import update. If there are any ERROR or INFO messages in the redcat-vulnerability-admin.log file, an icon informing the user of errors or notifications is displayed right next to the Last Imported On field. The redcat-vulnerability-admin.log file is updated with each import. The maximum size of this file is 4MB. When the maximum size is reached, a backup copy of the file is created with the following suffix: redcat-vulnerability-admin.log .1 Whenever a new backup file is created, the suffix is incremented by 1. Up to 19 backup files can be created. After the maximum number of files is reached, the oldest file is deleted. User Guide Chapter 5: Vulnerability Management HP EnterpriseView (2.5) Page 148 of 265
  • 149.
    Because the logfile generally includes multiple imports, you can use the Job Execution ID to locate the latest job. Check the Job Management module for the last job executed. For more information, see the Troubleshoot Batch Jobs section in the HP EnterpriseView Administration Guide. File Format Following is the format of a log file record: <timestamp> ERROR/INFO "The file <file name> for job execution ID <ID> has the following issues in line number <line number> <error/info message1> <error/info message2>" Example: 2012-01-31 18:07:43,801 ERROR The file '6_error-handling.done.csv' for job e xecution ID '36' has the following issues in line number 3 The values in the following fields exceed the maximum length: Description (event.flexString1), maximum length: 4000 These fields were truncated to the maximum length. The following fields are mandatory and are missing from the record: Host (event.destinationHostName) This record was skipped. Vulnerability Management Window The Vulnerability Management window enables you to filter the vulnerabilities found in your organization's network using various criteria, creating views that help you manage the vulnerability life cycle. The different areas and the functionalities available in each area are described in the following sections. For information on the EnterpriseView toolbar, see "Toolbar Description" on page 17. Toolbar User Guide Chapter 5: Vulnerability Management HP EnterpriseView (2.5) Page 149 of 265
  • 150.
    UI Element Description Vulnerabilities Affecting Asset Filterthe vulnerabilities in the grid using one of the following options: l All Vulnerabilities: View all vulnerabilities, both attached to assets and unattached assets. l Unattached Vulnerabilities: Select this option to view vulnerabilities that are not attached to an asset. l My Organization: Expand the business model and select an asset. View all vulnerabilities that affect this asset; meaning all vulnerabilities that are directly attached to this asset or that are attached to any of its children. Summary View This is the default view. For more information, see "Summary View" on the next page. Filters are retained when passing from one view to another. Details View To open this view, select a vulnerability from the grid, and then select this view. For more information, see "Details View" on page 152. Filters are retained when passing from one view to another. Reports Generate Report Click this button to generate a report. Select a report from the list of reports. If you are prompted, select to always allow pop-ups from the EnterpriseView server. You can save the report as a PDF. You can generate a report for an asset or for an asset and its children. User Guide Chapter 5: Vulnerability Management HP EnterpriseView (2.5) Page 150 of 265
  • 151.
    UI Element Description Last ImportedOn Displays the date of the most recent import update. If any ERROR or INFO messages are in the redcat-vulnerability-admin.log file, one of the following icons is displayed: Errors. Hovering over this icon displays the following message: "Last update completed with errors." Notifications (INFO). Hovering over this icon displays the following message: "Last update completed with notifications." For more information or error handling, see "Vulnerability Error Handling" on page 148. Aggregate Asset Vulnerability Score For <asset> You can click the score to open the Vulnerability Dashboard page and view more information about the vulnerabilities attached to the asset. For more information on how this score is calculated, see "Asset Vulnerability Score Aggregation Mechanism" on page 147. Filter Vulnerabilities Click this button to open the Filter Vulnerabilities dialog box. You can filter the vulnerabilities in the grid according to the vulnerability properties that are displayed in the grid, described in "Summary View Grid" on page 140. To remove a filter, you can either open the Filter Vulnerabilities dialog box and change the filter, or you can close the filter indicators that display on the toolbar. Clear Filter Click this button to clear all the filters that you set. Summary View Each record in the summary view grid is an occurrence of a vulnerability in a specific location. You can filter vulnerabilities using the grid column headers. If the filter string that you enter exceeds 200 characters, only the first 200 characters are used. The Summary View includes the vulnerability properties describes in "Summary View Grid" on page 140. User Guide Chapter 5: Vulnerability Management HP EnterpriseView (2.5) Page 151 of 265
  • 152.
    Details View The DetailsView includes the following areas: Left Pane This area displays a minimized version of the vulnerabilities grid that is displayed in the Summary View. It includes the vulnerability ID, Location and Title. Clicking on a vulnerability in this grid displays its details in the other panes,allowing you to navigate through the vulnerabilities without changing the view. Vulnerabilities can be filtered using the grid column headers. Details (middle pane) This area displays the vulnerability properties described in "Details View" on page 143. Instances (tab) This tab displays the vulnerability properties described in "Instances " on page 146. Status Management User Guide Chapter 5: Vulnerability Management HP EnterpriseView (2.5) Page 152 of 265
  • 153.
    UI Element Description Status Assigna status to the vulnerability (Open or Closed). Remediation Status Assign a remediation status to the vulnerability. For more information on the different statuses, see "Remediation Status" on page 142. Notes Use Notes to communicate with other users that are involved in remediating the vulnerability and to document anything regarding the vulnerability. Notes cannot be deleted or edited. Save Click to save changes. Cancel Click to clear changes. Reverts any change that you have made to the statuses. Vulnerability Assignment Window The Vulnerability Assignment window enables you to attach vulnerabilities to assets or detach vulnerabilities from assets. The different areas and the functionalities available in each area are described in the following sections. For information on the EnterpriseView toolbar, see "Toolbar Description" on page 17. Assets This pane enables you to select the asset to which you want to attach a vulnerability. UI Element Description Organization tab Displays the EnterpriseView business model. Expand the business model to select the asset that you want to display. Search tab Enables you to search for a name or a partial name of any asset in EnterpriseView, connected to the business model. User Guide Chapter 5: Vulnerability Management HP EnterpriseView (2.5) Page 153 of 265
  • 154.
    Attached Vulnerabilities This panedisplays all the vulnerabilities that are attached to a selected asset. When an asset is selected, the title of this pane displays the asset name. UI Element Description Attach Attach Vulnerabilities to Asset From the grid, select or multi-select (CTRL+click) the vulnerabilities that you want to attach to the asset, and then click this button. For more information, see "Attach a Vulnerability to an Asset" on page 135. Detach Detach Vulnerabilities from Asset From the grid, select or multi-select (CTRL+click) the vulnerabilities that you want to detach from the asset, and then click this button. For more information, see "To detach a vulnerability from an asset" on page 136. <Vulnerability Grid> A grid with the details of the vulnerabilities that are directly attached to the asset in the Assets pane. User Guide Chapter 5: Vulnerability Management HP EnterpriseView (2.5) Page 154 of 265
  • 155.
    Unattached Vulnerabilities This panedisplays vulnerabilities that are not attached to an asset. It includes the following methods for filtering unattached vulnerabilities:  l Quick filters accessible from the screen l Header filters l The Filter Vulnerabilities dialog box UI Element Description Score Filter according to the vulnerability score severity: Low Medium High The ranges are determined in the Configure Vulnerability Score Ranges section in the HP EnterpriseView Deployment Guide. Status Filter according to Open or Closed. User Guide Chapter 5: Vulnerability Management HP EnterpriseView (2.5) Page 155 of 265
  • 156.
    UI Element Description More FiltersFilter Vulnerabilities Click this button to open the Filter Vulnerabilities dialog box. You can filter the vulnerabilities in the grid according to the vulnerability properties that are displayed in the grid, described in "Summary View Grid" on page 140. To remove a filter, click More Filters to open the Filter Vulnerabilities dialog box and change the filter. Clear Filter Click this button to clear all the filters that you set through the Filter Vulnerabilities dialog box. <Vulnerability Grid> A minimized version of the vulnerabilities grid that is displayed in the Summary View. It includes the vulnerability ID, Location, Title, and Score. You can filter vulnerabilities using the grid column headers. Vulnerability Dictionary Many information security tools and resources, both commercial and non-commercial, include a vulnerability database. Each has a different methodology for naming and identifying vulnerabilities. This means that the same vulnerability can be defined differently in each of these sources. Because the Vulnerabilities module receives vulnerability information from various sources, the disparity would make it difficult to identify duplicate reports, provide additional information about the vulnerabilities, and efficiently associate them with remediation actions. To solve this problem, EnterpriseView labs created and maintains a comprehensive vulnerability dictionary that includes all vulnerabilities, regardless of whether they have been recognized by an industry standard source. EnterpriseView labs compiles, correlates, processes and enriches these vulnerabilities, and creates a single point of reference for each vulnerability. The vulnerability dictionary is continually expanded by the labs and can be updated in EnterpriseView, as described in the Update the Vulnerability Dictionary section in the HP EnterpriseView Administration Guide . As time goes by, some vulnerability properties can change. In such cases, these changes are reflected in the dictionary. EnterpriseView labs sources are varied. Some of the leading industry standard sources from which information is derived are: l National Vulnerability Database (NVD), for Common Vulnerabilities and Exposures (CVE) and Common Configuration Enumeration (CCE) l Open Source Vulnerability Database (OSVDB) l BugTraq You can view the vulnerabilities in the dictionary through the EnterpriseView user interface. To access the vulnerability dictionary, click Vulnerabilities > Dictionary. User Guide Chapter 5: Vulnerability Management HP EnterpriseView (2.5) Page 156 of 265
  • 157.
    The Vulnerability Dictionarywindow includes two panes: l Left pane: Displays the vulnerabilities and includes the properties: Vulnerability ID, Title, Modified Date (either date of creation or the last date it was updated), and score. l Right pane: Displays the properties of the vulnerability that is selected and Common Platform Enumerations (CPEs) that are associated with the vulnerability. For more information on CPEs, see "Common Platform Enumeration" on page 20. To view the properties of a vulnerability, click the vulnerability record in the left pane. The Properties tab is displayed. To view CPEs associated with the vulnerability, click the CPEs tab. You can search for vulnerabilities using their ID, title, details, or group or partial strings from these properties. Note: You can perform wildcard searches. For example, if you type ser*, the results will contain words beginning with ser (such as server and service). An asterisks cannot be placed before a string (*ser). User Guide Chapter 5: Vulnerability Management HP EnterpriseView (2.5) Page 157 of 265
  • 158.
    Chapter 6: KeyPerformance Indicators EnterpriseView includes key performance indicators (KPIs) that are used to measure the progression of your organization towards its objectives. In EnterpriseView, KPIs are used to monitor and improve upon the different aspects that comprise risk in your organization. EnterpriseView includes quantitative KPIs for risk factors, such as modeled risk, vulnerabilities, policy compliance, and control maturity. Simple KPIs enable you to define the ranges for the score severity of various risk factors, according to your business needs. For example, asset vulnerability scores are displayed along with an icon that represents a low, medium or high score throughout the application. The color indication is also reflected in the trend charts and heat maps. More complex KPIs include the percentage of assets with scores that are above or below a certain threshold. For example, the vulnerability KPI indicates the percentage of assets with an aggregate vulnerability score that is higher than a certain threshold. The higher the percentage the farther the organization is from its vulnerability objectives. EnterpriseView includes out-of-the-box KPIs, as described in "Out-of-the-Box KPIs" on the next page as well as a corresponding KPI for any external risk factor added to EnterpriseView. In addition, custom KPIs can be created by an Administrator for any risk factor defined in EnterpriseView. For more information, see the Create a KPI section in theHP EnterpriseView Administration Guide. All KPIs, both custom and out-of-the-box, are configurable. You can change the KPI parameter or threshold, as described in "Configure KPI Settings" below. Configure KPI Settings You can configure KPI settings in order to reflect the tolerance of your organization to the risk factor. For example, if you lower the High threshold of a KPI, then the KPI will reflect more tolerance towards the risk factor. To configure KPI settings 1. Click the Settings button, and then select the module to which the KPI belongs. 2. In the left pane, select the KPI that you want to configure. 3. KPIs can have one or both of the following options. Edit these options as necessary: n KPI Parameter: enter the threshold that indicates a desirable or an undesirable result. For example, in a KPI that displays the percentage of assets with an overall score higher than 20, then “20” is the KPI Parameter. In this case, scores that are higher than 20 are not desirable. HP EnterpriseView (2.5) Page 158 of 265
  • 159.
    n Thresholds: dragthe sliders to define the severity of the percentage ranges, for low, medium, and high thresholds. These thresholds are reflected in the gauge that represents the KPI and they define whether the KPI is acceptable or not. 4. Click Save. Out-of-the-Box KPIs EnterpriseView includes out-of-the-box KPIs described in the following table. You can configure the settings for out-of-the-box KPIs as well as custom KPIs, as described in "Configure KPI Settings" on the previous page. Name Description Overall Score KPI The overall score KPI is used to determine how close or far the organization is from it's overall risk objectives. The KPI indicates the percentage of assets, out of both direct and indirect children including the asset itself, with an overall score that is higher than a certain threshold (KPI parameter). The higher the percentage the farther the organization is from its overall risk objectives. This KPI reflects the tolerance of your organization to its overall risk. It is configurable and should be derived from your organization's strategic plans. The overall score KPI is displayed in the Risk Register page. For more information, see "Risk Register" on page 178. Compliance Score KPI The compliance Key Performance Indicator (KPI) is used to determine how close or far the organization is from it's compliance objectives. The KPI indicates the percentage of assets, out of both direct and indirect children including the asset itself, with an aggregate compliance score that is lower than a certain threshold (KPI parameter). The higher the percentage the farther the organization is from its compliance objectives. This KPI reflects the tolerance of your organization to lack of compliance. It is configurable and should be derived from your organization's strategic plans. The compliance score KPI is displayed in the Risk Register page. For more information, see "Risk Register" on page 178. User Guide Chapter 6: Key Performance Indicators HP EnterpriseView (2.5) Page 159 of 265
  • 160.
    Name Description Risk ScoreKPI Indicates the percentage of assets, out of both direct and indirect children and the asset itself, with an aggregate risk score that is higher than a certain threshold (KPI parameter). The higher the percentage the farther the organization is from its risk objectives. This KPI reflects the tolerance of your organization to risk. It is configurable and should be derived from your organization's strategic plans. The risk score KPI is displayed in the Risk Register page. For more information, see "Risk Register" on page 178. Unassessed Risk KPI Indicates the percentage of assets, out of both direct and indirect children and the asset itself, that have not been assessed. The higher the percentage the farther the organization is from its risk assessment objectives. This KPI reflects your organization's approach to the risk assessment process. It is configurable and should be derived from your organization's strategic plans. The unassessed risk KPI is displayed in the Risk Modeling Dashboard page. For more information, see "Risk Modeling Dashboard" on page 187. Vulnerability Score KPI The vulnerability score KPI is used to determine how close or far the organization is from it's vulnerability objectives. The KPI indicates the percentage of assets, out of both direct and indirect children and the asset itself, with an aggregate vulnerability score that is higher than a certain threshold (KPI parameter). The higher the percentage the farther the organization is from its vulnerability objectives. This KPI reflects the tolerance of your organization to vulnerabilities. It is configurable and should be derived from your organization's strategic plans. The vulnerability score KPI is displayed in the Risk Register page. For more information, see "Risk Register" on page 178. Completed Workflows KPI The completed workflows KPI indicates the percentage of workflows that have been completed by the workflow due date. This KPI helps you monitor EnterpriseView workflows. The completed workflows KPI is displayed in the Task Management Dashboard page. For more information, see "Task Management Dashboard" on page 197. User Guide Chapter 6: Key Performance Indicators HP EnterpriseView (2.5) Page 160 of 265
  • 161.
    Chapter 7: ExternalRisk Factors The risk posture of the assets in your organization can be affected by various risk factors. EnterpriseView includes the following inherent risk factors: policy compliance, control maturity, risk, and vulnerabilities. In addition to the risk factors already included in EnterpriseView, you can import risk information from external sources for any risk factor that you deem significant and that impact the overall risk score of your organization. For example, the score of IPS security alerts resulting from security attacks on a segment of your network. For more information on importing risk information from external sources, see the Import Risk Information from External Sources section in the EnterpriseView Administration Guide. The scores of all risk factors, both internal and external, are consolidated into one score—asset overall score—that reflects the overall risk posture of the assets in your organization. For more information on how the overall score is calculated, see "Configure Overall Score Formula Weights" on page 263. External risk factors must fulfill the following conditions: l A risk factor must be associated with an asset defined in EnterpriseView. Information that does not relate to a particular asset is discarded. l The information must be numeric. Only numeric information can be aggregated, included in the overall score, and reflected in trend charts. External risk factors are centralized in the External Risk Factor Management page. The management page allows you to do the following: l See the score of each external risk factor, for each asset, on top of the business model. l Capture a snapshot in time that reflects the state of your business model—both assets and their scores. For more information on capturing a snapshot, see "Capture Snapshot" on the next page. l Edit score manually, as described in "Edit External Risk Factor Score" on page 163. l Compare snapshot scores to current scores and analyze score trends. l Locate high risk assets according to critical external risk factors. l Filter data using advanced filtering capabilities, for example, according to score ranges. For more information on the External risk factor Management page, see "External Risk Factor Management Window" on page 164. Whenever you add a risk factor to EnterpriseView, a corresponding KPI is created automatically. KPIs are managed in the KPI Management page. You can configure the external risk factor KPI settings, as described in "Configure External Risk Factor KPI Settings" on page 164.You can also configure external risk factor ranges (like you can for all risk factors), as described in "Configure External Risk Factor Ranges" on page 163. External risk factors, like internal risk factors, are reflected in: HP EnterpriseView (2.5) Page 161 of 265
  • 162.
    l Risk Register: Aggregatescores for risk factors are displayed in the Asset Summary component and in the First-Level Children Summary component. For more information, see "Risk Register" on page 178. l Risk Indicators: External risk factors are regarded as risk indicators. For more information, see "Risk Indicators" on page 182. External risk factors have a dedicated dashboard—External Risk Factor Dashboard—that displays information on all the external risk factors that are imported into EnterpriseView. For more information, see "External Risk Factors Dashboard" on page 185. You can also incorporate external risk factor scores, aggregate scores and any other information into user created reports. For more information on creating reports, see the Create a Report Using SAP BusinessObjects WebIntelligence in the HP EnterpriseView Administration Guide. Capture Snapshot The External Risk Factor Management page allows you to save a snapshot of external risk factor scores and aggregate scores for each of the assets in the business model. You can save only one snapshot at a time. You can recapture a snapshot at any time. Assets that do not have scores are not saved in the snapshot. The main purpose of the snapshot is to compare the state of your current business model to the state of a previous business model (the snapshot). For example, you can use the snapshot as a baseline that reflects a positive state of your business model. You can see the difference between the current score and the snapshot score according to the icon displayed next to the asset in the map. In the following example, the current score for My organization is lower than the snapshot score. In this case, the arrow is green, meaning that a lower score is better. You can use snapshot scores to filter the assets displayed in the map. To capture a snapshot 1. Click External Risk Factor > Management. 2. From the risk factor selector on the top left side of the page, select the risk factor that you want to display. 3. Click Capture Snapshot. The date and time are displayed in the Last Snapshot Updated On field. User Guide Chapter 7: External Risk Factors HP EnterpriseView (2.5) Page 162 of 265
  • 163.
    Edit External RiskFactor Score Typically, external risk factor scores are imported from an external source. However, there might be cases where a score cannot be imported for a specific asset. In such cases, you can enter the external risk factor score manually. You can enter a score only for an asset that does not have a score imported from an external source. If, at some point, the score is imported for that asset, then you will no longer be able to edit the score. To edit the score 1. Click External Risk Factor > Management. 2. From the risk factor selector on the top left side of the page, select the risk factor that you want to display. 3. Click an asset on the map. (You can search for an asset, as described in "Search for an Asset" on page 29, and then click the Show on Map button.) 4. On the asset card, click the Edit Asset Score button. 5. On the Edit Asset Score dialog box, drag the slider to sent the score, and then click OK. Configure External Risk Factor Ranges You can configure the ranges for the score severity indication for any external risk factor defined in EnterpriseView. Score ranges and the directionality of the score severity may differ between external risk factors. These settings are defined during the configuration process of the external risk factor. For more information, see the Configure the External Risk Factor Normalization Settings in the HP EnterpriseView Administration Guide. External risk factor scores are displayed with one of the following icons: Better score (high or low, depending on the directionality) Medium score Worse score (high or low, depending on the directionality) This configuration is reflected throughout the application, wherever these measurements are displayed. For example, on the Risk Register page in the Asset Summary component. To configure external risk factor ranges 1. On the EnterpriseView toolbar, click the Settings button. User Guide Chapter 7: External Risk Factors HP EnterpriseView (2.5) Page 163 of 265
  • 164.
    2. On theSettings dialog box, click External Risk Factors. 3. In the left pane, click the risk factor for which you want to configure ranges. 4. Drag the slider to define the ranges. 5. Click Save. Configure External Risk Factor KPI Settings You can configure KPI settings in order to reflect the tolerance of your organization to the risk factor. For example, if you lower the High threshold of a KPI, then the KPI will reflect more tolerance towards the risk factor. You can also configure the KPI settings in the KPI Management page, as described in the Edit a KPI section in the HP EnterpriseView Administration Guide. To configure KPI settings 1. Click the Settings button, and then, in the Settings dialog box, click External Risk Factor. 2. In the left pane, select the risk factor that you want to configure. 3. Edit the following options as necessary: n KPI Parameter: Enter the threshold that indicates a desirable or an undesirable result. n Thresholds: Drag the sliders to define the severity of the percentage ranges, for low, medium, and high thresholds. These thresholds are reflected in the gauge that represents the KPI and they define whether the KPI is acceptable or not. 4. Click Save. External Risk Factor Management Window The External Risk Factor Management window is a centralized area for managing external risk factors.The different areas and the functionalities available in each area are described in the following sections. For information on the EnterpriseView toolbar, see "Toolbar Description" on page 17. User Guide Chapter 7: External Risk Factors HP EnterpriseView (2.5) Page 164 of 265
  • 165.
    Map Area UI Element Description <RiskFactor Selector> Displays information pertaining to a particular external risk factor. You can work on one external risk factor at a time. (Layout) Display the business model in a tree layout Displays the business model in a tree structured graph. (Layout) Display the business model in a circular layout Displays the business model in an interconnected ring and star topology. You are Viewing The name of the view that is displayed. If there are multiple views, you can select a different view from the list. Views on this page include asset composition, the risk factor, the filter, and the score type. User Guide Chapter 7: External Risk Factors HP EnterpriseView (2.5) Page 165 of 265
  • 166.
    UI Element Description Save NewView Creates a new view based on the current business model view displayed in the map. Access this option by clicking the arrow next to the Save button. After you save the view, when you reopen the External Risk Factor Management page, the business model displayed in the map area is resized to the default zoom and to fit to window. Note: Assets that were disconnected from the business model are not displayed in the view. Views are user-specific; you cannot see views that other users created. For more information, see "Create a Business Model View" on page 24. Save Saves the changes that you made to the view displayed on the map. Clear View Click this button to clear the view (including the risk factor, the filter, and the score type) and display only the My Organization asset. Capture Snapshot Click this button to capture a snapshot of external risk factor scores and aggregate scores for each of the assets in the business model. For more information, see "Capture Snapshot" on page 162. Last Snapshot Update On The date and time of the last snapshot that you captured. User Guide Chapter 7: External Risk Factors HP EnterpriseView (2.5) Page 166 of 265
  • 167.
    UI Element Description Filter Assets Clickthis button to open the Filter Assets dialog box. You can filter the assets in the map according to different asset properties and scores. For example, you can set a filter to display only assets that have a good snapshot score (in the green range) but a bad current score (in the red range). There might be situations in which some of the assets displayed do not fulfill the filter conditions. These assets are displayed because they have children assets that do fulfill the filter conditions. In the following diagram, assets A and B do not fulfill the filter conditions, but they must be displayed so that assets C,D,E, and F, which fulfill the filter conditions, are displayed in the map. Clear Filter Click this button to clear all the filters that you set. Zoom Zooms the business model in and out. User Guide Chapter 7: External Risk Factors HP EnterpriseView (2.5) Page 167 of 265
  • 168.
    Search Pane UI Element Description <Searchbox> Enables you to search for a name or a partial name of any asset in EnterpriseView, connected to the business model. Advanced Enables you to search for an asset according to Type and Category. Show on Map Displays the asset in the business model in the map area. Edit Asset Score Opens the Edit Asset Score dialog box. You can edit the score, as described in "Edit External Risk Factor Score" on page 163. Generate Report Click this button to generate a report. Select a report from the list of reports. If you are prompted, select to always allow pop-ups from the EnterpriseView server. You can save the report as a PDF. The report will include only information for the asset from which you are generating it, and its children. User Guide Chapter 7: External Risk Factors HP EnterpriseView (2.5) Page 168 of 265
  • 169.
    UI Element Description Collapse Collapses theleft pane. Expand Expands the left pane. Legend User Guide Chapter 7: External Risk Factors HP EnterpriseView (2.5) Page 169 of 265
  • 170.
    UI Element Description Select scoreto display Select one of the following scores to display on the assets on the business model map: l Current Aggregate Score l Current Score l Snapshot Aggregate Score l Snapshot Score <Score severity> Score ranges and the directionality of the score severity may differ between external risk factors. External risk factor scores are displayed with one of the following icons: Better score (High or Low, depending on the directionality) Medium score Worse score (High or Low, depending on the directionality) The ranges for each severity are displayed, as well. Current score compared to last snapshot score Indicates whether the current score is better or worse or unchanged since the last snapshot score. The Better and Worse icons depend on the directionality of the score severity. If a lower score is better, then the following icons will be displayed in the legend: l The current score is better than the snapshot score. l The current score is worse than the snapshot score. l The current score has not changed since the last snapshot. The icons change according to the score severity directionality. Asset Card You can open the asset card by clicking on the asset in the business model map. The following is an example of an expanded asset card. User Guide Chapter 7: External Risk Factors HP EnterpriseView (2.5) Page 170 of 265
  • 171.
    The asset cardincludes the asset name, category, type, trend, and score (the score type selected in the legend). The following table includes the functionality available from the asset card. UI Element Description Edit Asset Score Opens the Edit Asset Score dialog box. You can edit the score, as described in "Edit External Risk Factor Score" on page 163. Generate Report Click this button to generate a report. Select a report from the list of reports. If you are prompted, select to always allow pop-ups from the EnterpriseView server. You can save the report as a PDF. The report will include only information for the asset from which you are generating it, and its children. User Guide Chapter 7: External Risk Factors HP EnterpriseView (2.5) Page 171 of 265
  • 172.
    UI Element Description Expand Displaysthe direct children of the asset in the business model map. Click More > Expand. If the asset has more than 20 children, then the assets are not displayed automatically in order not to overload the business model. In this case, the Show Children on Map for Asset dialog box is displayed, enabling you to select the children you want to display. The number of direct children that an asset has is displayed in the business model map by the asset name. You can also expand by double-clicking the asset. Note: You cannot expand an asset that has more than 1000 children in the business model. If you attempt to expand such an asset, you will receive an error message. Collapse Hides the direct children of the asset in the business model map. Click More > Collapse. You can also collapse by double-clicking the asset. Show Parents Displays the parent assets of the asset in the business model map. Click More > Show Parents. Hide Parents Hides the parent assets of the asset in the business model map. Click More > Hide Parents. Display Scores Displays the following scores: l Current score l Snapshot score l Aggregate current score l Aggregate snapshot score User Guide Chapter 7: External Risk Factors HP EnterpriseView (2.5) Page 172 of 265
  • 173.
    UI Element Description Hide Scores Hidesthe following scores: l Current score l Snapshot score l Aggregate current score l Aggregate snapshot score Mini-map When the business model is expanded to a larger size than the map area, you can navigate it by clicking and dragging in the mini-map area. To expand or collapse the mini-map, click the Expand/Collapse button. Out-of-the-Box Risk Factors EnterpriseView includes out-of-the-box risk factors that are based on ESM reports. The reports are imported into ESM during the integration process. Risk Factor Description Data Source Antivirus Shows whether the antivirus installed on the asset is updated or not. Assets Brute Force Attempt Shows the brute force attempts events for assets that have been targeted in the last hour. Active List DoS Attacks Shows the denial of service score for assets that have been targeted in the past day. Active List Events Priority Shows the average priority for assets that have been targeted in the last hour. Events Dropped Events by Firewall Shows events dropped by the firewall, for assets that have been targeted in the last hour. Active List Failed Login Shows the number of failed login events for assets that have been targeted in the last hour. Active List IP Scanning Shows the IP scanning events for assets that have been targeted in the last hour. Active List Port Scanning Shows the port scanning events for assets that have been targeted in the last hour. Active List User Guide Chapter 7: External Risk Factors HP EnterpriseView (2.5) Page 173 of 265
  • 174.
    Chapter 8: Dashboardsand Reports EnterpriseView comes with a variety of out-of-the-box dashboards and printable reports, based on common needs of specific IT and risk management roles, such as system administrators, auditors, and executives. EnterpriseView administrators can create customized role-based dashboards for different types of users, as described in the Create a Customized Dashboards Page in the HP EnterpriseView Administration Guide. The dashboards can be created from predefined reports or from user-created reports. There are two types of reports that you can create: l Printable These reports are available from any page that is associated with a report. These reports are generated as print-friendly PDF documents by clicking the Generate Report button. For more information on the reports included in EnterpriseView, see "Printing Reports" on the next page. l Dashboard These reports are used as data analysis components and can be grouped together with other components in order to create comprehensive dashboards, such as the Risk Register, for the various roles. For more information, see "Risk Register" on page 178 You can create reports that belong to both categories. For more information on creating reports, see the Create a Report Using SAP BusinessObjects WebIntelligence in the HP EnterpriseView Administration Guide. HP EnterpriseView (2.5) Page 174 of 265
  • 175.
    Printing Reports Out-of-the-box printablereports are available from the Risk Factor Dashboard, Risk Register, Risk Assessment and Treatment, Policy Assessment, Statement of Applicability, and Vulnerability Management pages. Custom reports are available from the page that you associated with them when you created the report. From each window, only reports that are specific to that module are available. These reports are generated as print-friendly PDF documents by clicking the Generate Report button. In addition to the various reports provided by EnterpriseView, you can create your own customized reports using BusinessObjects Web Intelligence, as described in Create a Report Using SAP BusinessObjects WebIntelligence in the HP EnterpriseView Administration Guide. The following table includes all of the out-of-the-box reports in EnterpriseView. Page Report Name Description Risk Register Overall Score Trend This report includes overall scores for the asset selected and its children, for the following times: l Current date l The date on which the last score was archived (within the last week) l Within the last month This reports shows a general pattern of change in data over time. Risk Factor Dashboard Risk Factor Score Trend This report includes risk factor scores for the asset selected and its children, for the following times: l Current date l The date on which the last score was archived (within the last week) l Within the last month This reports shows a general pattern of change in data over time. User Guide Chapter 8: Dashboards and Reports HP EnterpriseView (2.5) Page 175 of 265
  • 176.
    Page Report NameDescription Risk Modeling Risk Score Summary This report includes the selected asset's risk score and aggregate risk score, as well as risk information for each threat imposed on a selected asset. Risk Score Details This report includes risk score information on all actors and operations that comprise the threats that are posed on a selected asset, in conjunction with their name and description. Statement of Applicability Statement of Applicability Details This report includes all the controls from policies that are applied to a selected asset and their details. Policy Assessment Policy Compliance Summary This report includes compliance scores, control maturity scores and assessment progress information on controls, security categories the policy applied to a selected asset. Policy Compliance Details This report includes compliance scores, control maturity scores and assessment progress information on all policy elements (security categories and controls) that are applied to a selected asset, in conjunction with the policy content. Policy Builder Activated Mapped Controls This report includes mappings between a source policy and a target policy for all controls in policies that are activated, for a selected policy. Policy Details This report includes the policy content for a selected policy. Vulnerability Open Vulnerabilities Summary This report includes the vulnerability score and the number of locations that the vulnerability was found for all open vulnerabilities for a selected asset and all of its children. Note: If the vulnerability is attached to more than one asset, then the score for each vulnerability, displayed in the Score column, may be different. In this case, the highest score is displayed. Product Vulnerability Details This report reflects the degree of vulnerability of products that are connected to assets in the business model according to the number of occurrences, the highest vulnerability score, and the average vulnerability score. User Guide Chapter 8: Dashboards and Reports HP EnterpriseView (2.5) Page 176 of 265
  • 177.
    Page Report NameDescription Task Management Workflow Details This report includes details on workflows and their tasks (in progress or completed). Information on workflows that are in progress is displayed separately from completed workflows. Workflow Details - Last 30 Days This report is the same as Workflow Details report, but displays completed workflows only from the last 30 days. Root Cause Analysis Root cause analysis (RCA) is a structured approach for identifying the underlying causes of problems or events. RCA is based on the assumption that problems should be solved by addressing their root causes rather than their obvious symptoms. You can use RCA to mitigate, eliminate, or prevent risk in your organization. EnterpriseView dashboards support RCA. The dashboards include a drill-down functionality, strategically placed links, allowing you to trace root problems by navigating the various dashboards and EnterpriseView pages. These links are available depending on your role and permissions. In addition, the EnterpriseView Risk Indicators is an RCA tool that offers you the quickest way to identify risk sources in your organization's business model. It provides you with graphical risk indication on top of your business model map. There are two main approaches for RCA in EnterpriseView: l Identifying the underlying asset or assets that are responsible for increasing the overall risk in your organization. To follow this approach, you can track the source asset by drilling down in the business model. Example: a. Start by opening the Risk Register (Executive View > Risk Register) for your root asset. b. Identify the asset with the highest risk in the First-Level Children Summary component, and click its name. The Risk Register is updated with information on the asset that you selected. c. Continue drilling down until you identify the underlying problematic asset. l Identifying the risk element (vulnerability score, risk score, compliance score, and maturity score) that is responsible for increasing the overall risk in an asset. To follow this approach, you can track the risk element by investigating it specifically. User Guide Chapter 8: Dashboards and Reports HP EnterpriseView (2.5) Page 177 of 265
  • 178.
    Example: a. Start byopening the Risk Register for your root asset. b. Identify the risk element that appears to be problematic the in the Asset Summary, and click its name. EnterpriseView navigates to the dashboard that corresponds with the risk element that you chose. For example, if the problematic risk element is the vulnerability score, then when you click Vulnerability, the Vulnerability Dashboard opens. c. Continue drilling down until you identify the underlying problematic risk element. Regardless of the approach you take, after you have identified the problematic asset or risk element, you can navigate to the relevant EnterpriseView page through which you can mitigate the problem. Example: 1. Identify an asset with a high aggregate asset vulnerability score in the Risk Register. 2. Click the Aggregate Asset Vulnerability Score label in the Vulnerability Dashboard. The Vulnerability Management page opens with information about the specific asset. 3. Continue investigating the vulnerabilities using the tools available in the Vulnerability Management page. For example, you can filter vulnerabilities according to their score. 4. Handle the vulnerabilities attached to the asset to lower the asset vulnerability score. Risk Register The EnterpriseView Risk Register is a comprehensive dashboard that provides you with all the risk- related information identified by your organization. To open the Risk Register, click Executive View > Risk Register. The Risk Register includes the following components: l Asset Selector This component enables you to select the asset that you want to display in the Risk Register. The Organization tab displays the EnterpriseView business model. Expand the business model to select the asset that you want to display. User Guide Chapter 8: Dashboards and Reports HP EnterpriseView (2.5) Page 178 of 265
  • 179.
    The Search tabenables you to search for a name or a partial name of any asset connected to the business model. After you have selected the asset, you can collapse the Asset Selector by clicking the Collapse button. To expand the Asset Selector, click the Expand Asset Selector button. The asset that you selected is saved for when you next log on. l Asset Summary This component displays the overall asset score. The asset overall score reflects the total risk of the asset. It is composed of the weighted average of the aggregate scores of all risk factors. There are five risk factors that are inherent in EnterpriseView, they include: policy compliance, the control maturity, risk, asset vulnerability, and ESM threat. In addition to these factors, any external risk factor that has been defined in EnterpriseView is also included in the asset overall score calculation. The three scores that represent the highest risk are displayed. For more on external risk factors, see "External Risk Factors" on page 161. The inherent risk factors are: n Risk: The aggregate risk score of the asset. For more information on how this score is calculated, see "Risk Score Aggregation Mechanism" on page 110. n Compliance: The aggregate compliance score of the asset. For more information on how this score is calculated, see "Control Scores Aggregation Mechanism" on page 77. n Maturity: The aggregate control maturity score of the asset. For more information on how this score is calculated, see "Control Scores Aggregation Mechanism" on page 77. n Vulnerability: The aggregate asset vulnerability score of the asset. For more information on how this score is calculated, see "Asset Vulnerability Score Aggregation Mechanism" on page 147. The following formula is used for calculating the asset overall score: normalizedaggregatedriskfactor scores weight weights ∑( * ) ∑ Note: You can edit the weights of these scores in Settings > Executive View > Overall Score Formula Weights. For more information, see "Configure Overall Score Formula Weights" on page 263. To analyze the scores, click on the label of the score that you want to analyze. You will be redirected to the corresponding page: User Guide Chapter 8: Dashboards and Reports HP EnterpriseView (2.5) Page 179 of 265
  • 180.
    n Risk: Risk ModelingDashboard n Compliance: Compliance Dashboard n Maturity: Compliance Dashboard n Vulnerability: Vulnerability Dashboard l First-Level Children Summary This component displays the information provided in the Asset Summary for the highest risk, first level children of the asset that you selected (up to five are displayed). To analyze a specific child asset, click the asset in the Asset Name column. The page is reloaded with information on the asset that you chose. l Asset Overall Score Over Time This component displays the asset overall score over time. Asset overall scores are archived on a weekly basis. These scores, as well as the most updated score, are displayed in a graph in order to reveal trends in the overall score. If you hover over the round icons in the graph, you can see the exact score and the date on which it was calculated. For more information on archiving, see the Archive Trend Data section in the HP EnterpriseView Administration Guide. l Risk Score KPI This component displays a Key Performance Indicator (KPI) that indicates the percentage of assets, out of both direct and indirect children, with an aggregate risk score that is higher than a certain threshold (KPI parameter). The higher the percentage the farther the organization is from its business objectives. You can configure the KPI parameter and thresholds, as described in "Configure KPI Settings" on page 158. The KPI score percentage is dynamic and is displayed in the center of the gauge. l Vulnerability Score KPI This component displays a KPI that indicates the percentage of assets, out of both direct and indirect children, with an aggregate vulnerability score that is higher than a certain threshold (KPI parameter). The higher the percentage the farther the organization is from its business objectives. You can configure the KPI parameter and thresholds, as described in "Configure KPI Settings" on page 158. The KPI score percentage is dynamic and is displayed in the center of the gauge. l Compliance Score KPI User Guide Chapter 8: Dashboards and Reports HP EnterpriseView (2.5) Page 180 of 265
  • 181.
    This component displaysa KPI that indicates the percentage of assets, out of both direct and indirect children, with an aggregate compliance score that is lower than a certain threshold (KPI parameter). The higher the percentage the farther the organization is from its business objectives. You can configure the KPI parameter and thresholds, as described in "Configure KPI Settings" on page 158. The KPI score percentage is dynamic and is displayed in the center of the gauge. l Overall Score KPI This component displays a KPI that indicates the percentage of assets, out of both direct and indirect children, with an aggregate overall score that is higher than a certain threshold (KPI parameter). The higher the percentage the farther the organization is from its business objectives. You can configure the KPI parameter and thresholds, as described in "Configure KPI Settings" on page 158. The KPI score percentage is dynamic and is displayed in the center of the gauge. Overall Score Heat Map The Overall Score Heat Map enables you to view the overall score of Business and Location assets according to their criticality level. To open the Overall Score Heat Map, click Executive View > Overall Score Heat Map. The colors in the heat map reflect the severity of the scores, as follows: l Low = green l Medium = yellow l High = red The criticality level ranges are configurable. For more information, see "Configure Criticality Level Ranges" on page 264. The overall score is composed of the aggregate scores of all the risk factors. For more information on the how this score is calculated, see "Configure Overall Score Formula Weights" on page 263. The assets displayed in the graph are first and second level children of the asset that you select. If the asset that you select does not contain Business or Location assets, the graph remains empty. The Overall Score Heat Map includes the following components: l Asset Selector The Organization tab displays the EnterpriseView business model. Expand the business model to select the asset that you want to analyze. User Guide Chapter 8: Dashboards and Reports HP EnterpriseView (2.5) Page 181 of 265
  • 182.
    The Search tabenables you to search for a name or a partial name of any asset connected to the business model. After you have selected the asset, you can collapse the Asset Selector by clicking the Collapse button. To expand the Asset Selector, click the Expand Asset Selector button. l Overall Score Heat Map The name of the asset that you selected is displayed above the graph along with its overall asset score and its criticality level, if it is defined. Note: Only assets that have been assessed are displayed on the graph. The assets that are displayed in the legend are sorted alphabetically and are numbered accordingly. Hover over the asset on the graph to display the name of the asset, the criticality level and the overall asset score. Click the icon of the asset in the graph to highlight the asset in the legend and vice versa. If two or more assets have the same criticality level and overall asset score, then they both appear as a single point on the graph and the icon is displayed with an ellipsis (...). Hover over the ellipsis icon to display information on all the assets that have the same overall asset score and criticality level. Risk Indicators The Risk Indicators page is a root cause analysis tool that helps you identify risk sources in your organization's business model. It provides you with graphical risk indication on top of your business model map. There are four quantitative factors that are inherent to EnterpriseView. These factors include risk, policy compliance, control maturity, and vulnerability. In addition to these factors, you can import risk information from external sources for any risk factor that you deem significant and that impact the overall risk score of your organization. For more information on external risk factors, see "External Risk Factors" on page 161. All of these scores are formulated into the overall score of the asset.These factors, together with the asset overall score, are risk indicators. For more information on how the asset overall score is calculated, see "Configure Overall Score Formula Weights" on page 263. You can select the risk indicator that you want to display on the business model map from the indicator menu. When you select an indicator from the indicator menu, information is updated in the business model map, in the asset card, and in the search pane. The name of the indicator that you selected appears at the top of the indicator menu. For example, if you chose the Overall indicator then the indicator menu appears as follows: User Guide Chapter 8: Dashboards and Reports HP EnterpriseView (2.5) Page 182 of 265
  • 183.
    Every asset inthe map has an icon that depicts the severity of the indicator score that you chose to display. The severity ranges for these scores are defined in Settings. For more information, see "Settings" on page 261. In the following example My organization has a low severity score. If you click an asset in the map, the asset card opens displaying information on the asset,including the scores for all the indicators. For more information, see "Asset Card" below. The Risk Indicators page includes the following areas: l Left Pane n Search. You can search for a name or a partial name of any asset connected to the business model. You can also search by asset category or type by clicking Advanced. Click the Show on Map button to display the asset in the business model map. n Toolbar. The toolbar includes map-related actions that are similar to the Asset Profiling page, such as changing the map layout. All actions are view-only. For more information on these actions, see "Map Area" on page 35. l Map Area The map area provides a graphical display of the business model. The indicator menu can be found in the upper right side of the map area. You can select a risk indicator to display in the business model map. l Asset Card You can open the asset card by clicking on the asset in the business model map. User Guide Chapter 8: Dashboards and Reports HP EnterpriseView (2.5) Page 183 of 265
  • 184.
    Example: Note: The MyOrganization asset does not include the Show Parents and Hide Parents options because it is the root asset in the business model. The following table includes the functionality available from the asset card. UI Element Description Expand Show the direct children of the asset in the business model map. If the asset has more than 20 children, then the assets are not displayed automatically in order not to overload the business model. In this case, the Show Children on Map for Asset dialog box is displayed, enabling you to select the children you want to display. The number of direct children that an asset has is displayed in the business model map by the asset name. You can also expand by double-clicking the asset. Collapse Hide the direct children of the asset in the business model map. You can also collapse by double-clicking the asset. Show Parents Show the parent assets of the asset in the business model map. Click More > Show Parents. User Guide Chapter 8: Dashboards and Reports HP EnterpriseView (2.5) Page 184 of 265
  • 185.
    UI Element Description Hide ParentsHide the parent assets of the asset in the business model map. Click More > Hide Parents. Open Indicator Scores Click to view all indicator scores. To analyze the scores, click on the label of the score that you want to analyze. You will be redirected to the corresponding page: n Overall Score: Risk Register n Risk Score: Risk Modeling Dashboard n Compliance Score: Compliance Dashboard n Maturity Score: Compliance Dashboard n Vulnerability Score: Vulnerability Dashboard Close Indicator Scores Close indicator scores. l Mini-Map When the business model is expanded to a larger size than the map area, you can navigate it by clicking and dragging in the mini-map area. To expand or collapse the mini-map, click the Expand/Collapse button. High-risk assets that are displayed with a red severity indication in the map are also marked in red in the mini-map. External Risk Factors Dashboard The External Risk Factors Dashboard is a comprehensive dashboard that provides you with information on risk factors that have been imported into EnterpriseView from external sources. For more information on external risk factors, see "External Risk Factors" on page 161. To open the External Risk Factors Dashboard, click Executive View > External Risk Factors Dashboard. User Guide Chapter 8: Dashboards and Reports HP EnterpriseView (2.5) Page 185 of 265
  • 186.
    l Risk Factorand Asset Selector This component enables you to select an asset and an external risk factor and display risk information on that asset and its children. You must first select a risk factor from the list. The Organization tab displays the EnterpriseView business model. Expand the business model to select the asset that you want to display. The Search tab enables you to search for a name or a partial name of any asset connected to the business model. After you have selected the asset, you can collapse the Risk Factor and Asset Selector by clicking the Collapse Risk Factor and Asset Selector button. To expand theRisk Factor and Asset Selector, click the Expand Risk Factor and Asset Selector button. l Summary This component displays the score and aggregate score for a specific external risk factor for the asset that you have selected. For more information on how the aggregate score is calculated, see "Risk Score Aggregation Mechanism" on page 110. l First level Children Summary This component displays the information provided in the Summary component for the highest risk first-level children of the asset that you selected (up to five are displayed). l Aggregate Risk Score Over Time Asset aggregate risk factor scores are archived on a regular basis. The archived scores and the current score are displayed in a graph in order to reveal trends in risk. Hover over the round icons in the graph to see the exact risk factor score and the date on which it was calculated. For more information on archiving, see the Archive Trend Data section in the HP EnterpriseView Administration Guide. l Risk Factor KPI Indicates the percentage of assets, out of both direct and indirect children and the asset itself, with an aggregate external risk factor score that is higher or lower than a certain threshold (KPI parameter). The percentage indicates how near or far the organization is from its risk objectives. This KPI reflects the tolerance of your organization to risk. It is configurable and should be derived from your organization's strategic plans. User Guide Chapter 8: Dashboards and Reports HP EnterpriseView (2.5) Page 186 of 265
  • 187.
    Risk Modeling Dashboard TheRisk Modeling Dashboard is a comprehensive dashboard that provides you with general information on modeled risk for a specific asset. To open the Risk Modeling Dashboard page, click Risk Modeling > Risk Modeling Dashboard. Risk Modeling Dashboard includes the following components: l Asset Selector The Organization tab displays the EnterpriseView business model. Expand the business model to select the asset that you want to analyze. The Search tab enables you to search for a name or a partial name of any asset in EnterpriseView, connected to the business model. After you have selected the asset, you can collapse the Asset Selector by clicking the Collapse button. To expand the Asset Selector, click the Expand Asset Selector button. l Risk Scores This component displays the residual risk and aggregate risk scores for the asset that you have selected. For more information on how these scores are calculated, see "Residual Risk Score Calculation" on page 112 and "Risk Score Aggregation Mechanism" on page 110. To analyze the residual risk, click on Residual Risk. The Risk Modeling Assessment page opens, displaying risk information for the asset that you have chosen. l First-Level Children Summary This component displays the information provided in the Risk Scores component for the highest risk first-level children of the asset that you selected (up to five are displayed). To analyze a specific child asset, click the asset in the Asset Name column. The page is reloaded with information on the asset that you chose. l Children Assessment Breakdown This component displays the breakdown of risk severity (high, medium, low) of all the children of the asset that you selected, both direct and indirect. Only children that have a risk assessment are included in this breakdown. l Aggregate Risk Score Over Time Asset aggregate risk scores are archived on a weekly basis. These scores, as well as the most updated score, are displayed in a graph in order to reveal trends in risk. Hover over the round icons in the graph to see the exact risk score and the date on which it was calculated. User Guide Chapter 8: Dashboards and Reports HP EnterpriseView (2.5) Page 187 of 265
  • 188.
    For more informationon archiving, see the Archive Trend Data section in the HP EnterpriseView Administration Guide. l Risk Status Breakdown This component presents a breakdown of risks according to their status. Because risk status is set manually, then the accuracy of this information depends on how accurately you manage the risk status. l Unassessed Risk KPI A Key Performance Indicator (KPI) that indicates the percentage of business-critical assets (Business and Location assets), out of both direct and indirect children, that have not been assessed. The higher the percentage the farther the organization is from its objectives. For more information. see "Unassessed Risk KPI" on page 160. User Guide Chapter 8: Dashboards and Reports HP EnterpriseView (2.5) Page 188 of 265
  • 189.
    Risk Heat Mapand Scorecard The Risk Scorecard and Heat Map includes information on risk assessment that is performed on a specific asset. To open the Risk Scorecard and Heat Map page, click Risk Modeling > Risk Scorecard and Heat Map. Risk Scorecard and Heat Map includes the following components: l Asset Selector The Organization tab displays the EnterpriseView business model. Expand the business model to select the asset that you want to analyze. The Search tab enables you to search for a name or a partial name of any asset connected to the business model. After you have selected the asset, you can collapse the Asset Selector by clicking the Collapse button. To expand the Asset Selector, click the Expand Asset Selector button. l Risk Heat Map The Risk Heat Map displays threat scenarios according to their impact scores and probability. If the asset that you select does not have any threats attached to it, then the graph remains empty. The colors in the heat map reflect the severity of the scores. If the risk has been treated, then the impact score that is displayed is the treated impact score and the probability that is displayed is the treated probability. If the risk has not been treated, then the impact score that is displayed is the impact score and the probability that were set during the assessment process. If there are controls mapped to the threat, then the adjusted probability is displayed. Hover over the threat on the graph to display the probability, impact score, operation, and actor. Clicking the icon in the graph selects the threat in the legend and vice versa. If two or more threats have the same probability and impact score, then they both appear as a single point on the graph and the icon is displayed with an ellipsis (...). Hover over this icon to display information on all the threats that have the same probability and impact score. l Risk Scorecard The Risk Scorecard table includes detailed risk assessment and treatment information. If the risk has been treated, then the impact score and the probability that are displayed represent the treated data. If the risk has not been treated, then the impact score and the probability that are displayed represent the assessment data. The name of the asset that you selected is displayed above the table along with its residual risk score. User Guide Chapter 8: Dashboards and Reports HP EnterpriseView (2.5) Page 189 of 265
  • 190.
    User Guide Chapter 8:Dashboards and Reports HP EnterpriseView (2.5) Page 190 of 265
  • 191.
    Compliance Dashboard The ComplianceDashboard is a comprehensive dashboard that provides you with general compliance information identified by your organization for a specific asset. If there is more than one policy that applies to the asset, then information is displayed for the least compliant policy (based on the aggregate compliance score on the policy level). For more in-depth information on compliance of a specific policy, see "Compliance by Policy Dashboard" on the next page. To open the Compliance Dashboard, click Policy and Compliance >  Compliance Dashboard. The Compliance Dashboard includes the following components: l Asset Selector This component enables you to select an asset and display compliance information on that asset and its children. The Organization tab displays the EnterpriseView business model. Expand the business model to select the asset that you want to display. The Search tab enables you to search for a name or a partial name of any asset connected to the business model. After you have selected the asset, you can collapse the Asset Selector by clicking the Collapse button. To expand the Asset Selector, click the Expand Asset Selector button. l Compliance Summary This component includes the aggregate compliance score and progress, in addition to the maturity assessment score and progress for the asset that you have selected. For more information on the aggregation mechanism, see "Control Scores Aggregation Mechanism" on page 77. l First-Level Children Summary Displays the information provided in the Compliance Summary for the least compliant first level children of the asset that you selected (up to five are displayed). To analyze a specific child asset, click the asset in the Asset Name column. The page is reloaded with information on the asset that you chose. l Compliance Score Over Time Asset compliance scores are archived on a weekly basis and when a clear assessment has been performed. These scores, as well as the most updated score, are displayed in a graph in order to reveal trends in compliance. If you hover over the round icons in the graph, you can see User Guide Chapter 8: Dashboards and Reports HP EnterpriseView (2.5) Page 191 of 265
  • 192.
    the compliance score,the assessment progress, and the date on which it was calculated. If the scores were archived due to a clear assessment, then the tooltip includes an "Audit Complete" indication. For more information on archiving, see the Archive Trend Data section in the HP EnterpriseView Administration Guide. l Maturity Score Over Time Control maturity scores are archived on a weekly basis and when a clear assessment has been performed. These scores are displayed in a graph in order to reveal trends in compliance. If you hover over the round icons in the graph, you can see the maturity score, the assessment progress, and the date on which it was calculated. If the scores were archived due to a clear assessment, then the tooltip includes an "Audit Complete" indication. For more information on archiving, see the Archive Trend Data section in the HP EnterpriseView Administration Guide. l Policy Compliance Includes the aggregate score and assessment progress for both asset compliance and control maturity for each policy that is applied to the asset that you selected. To analyze a specific policy, click the policy in the Policy Name column. The Compliance by Policy Dashboard opens and displays information about the policy that you chose. Compliance by Policy Dashboard The Compliance by Policy Dashboard is a comprehensive dashboard that provides you with all the compliance-related information identified by your organization for each policy associated with a specific asset. To open the Compliance by Policy Dashboard, click Policy and Compliance >  Compliance by Policy Dashboard. The Compliance by Policy Dashboard includes the following components: l Policy and Asset Selector This component enables you to select an asset and one of the policies that applies to it and display compliance information on that asset and its children. You must first select a policy from the policy list. The Organization tab displays the EnterpriseView business model. Expand the business model to select the asset that you want to display. User Guide Chapter 8: Dashboards and Reports HP EnterpriseView (2.5) Page 192 of 265
  • 193.
    The Search tabenables you to search for a name or a partial name of any asset connected to the business model. After you have selected the asset, you can collapse the Policy and Asset Selector by clicking the Collapse button. To expand the Policy and Asset Selector, click the Expand Policy and Asset Selector button. l Compliance Summary This component includes the aggregate compliance score and progress,and the maturity assessment score and progress for the asset that you have selected, in relationship to the policy that you have selected. To analyze the policy assessment of specific asset, click Compliance or Maturity. The Policy Assessment page opens and displays information on the compliance assessment or maturity assessment of the asset that you selected. For more information on the aggregation mechanism, see "Control Scores Aggregation Mechanism" on page 77. l First-Level Children Summary Displays the information provided in the Compliance Summary for the least compliant first level children of the asset that you selected (up to five are displayed). To analyze a specific child asset, click the asset in the Asset Name column. The page is reloaded with information on the asset that you chose. l P5 Score Breakdown A breakdown of the aggregate score of P5 control maturity factors of the asset and the policy that you selected. The graph displays only P5 control maturity factors that have been assessed. l Maturity Score Over Time Control maturity scores are archived on a weekly basis and when a clear assessment has been performed. These scores are displayed in a graph in order to reveal trends in compliance. If you hover over the round icons in the graph, you can see the exact maturity score, the assessment progress, and the date on which it was calculated. If the scores were archived due to a clear assessment, then the tooltip includes an "Audit Complete" indication. For more information on archiving, see the Archive Trend Data section in the HP EnterpriseView Administration Guide. l Compliance Score Over Time User Guide Chapter 8: Dashboards and Reports HP EnterpriseView (2.5) Page 193 of 265
  • 194.
    Asset compliance scoresare archived on a weekly basis and when a clear assessment has been performed. These scores, as well as the most updated score, are displayed in a graph in order to reveal trends in compliance. If you hover over the round icons in the graph, you can see the exact compliance score, the assessment progress, and the date on which it was calculated. If the scores were archived due to a clear assessment, then the tooltip includes an "Audit Complete" indication. l Score Details The aggregate maturity and compliance scores on the security category level. For more information on the aggregation mechanism, see "Control Scores Aggregation Mechanism" on page 77. Policy Compliance Map The Policy Compliance Map enables you to view all of the policies and their security categories that are applied to a specific asset along with their assessment information, in a graphic view. To open the Policy Compliance Map, click Policy and Compliance > Compliance Map. The different areas and the functionalities available in each area are described in the following sections. For information on the EnterpriseView toolbar, see "Toolbar Description" on page 17. Left Pane (Asset Selector) UI Element Description Organization tab The Organization tab displays the EnterpriseView business model. Expand the business model and select the asset that you want to view. Search tab You can search for a name or a partial name of any asset connected to the business model. Map Area The Policy Compliance Map area has two tabs. The Compliance tab displays compliance assessment information and the Maturity tab displays control maturity information. Select that tab that has the information you require. The policy and security categories are displayed according to their hierarchy, in a circular layout, each represented by an icon. Each icon includes the following information: l Policy or security category name l Control maturity/compliance score l Assessment progress (provides a visual indication of how much the policy element is assessed) User Guide Chapter 8: Dashboards and Reports HP EnterpriseView (2.5) Page 194 of 265
  • 195.
    The graph areaalso includes the following functionality and information. UI Element Description Optimize Layout Refreshes the layout of the business model in the graph. Fit to Window Resizes and displays the entire business model in the Graph Area. Zoom in/zoom out business model. <Score Range> The score range for a specific policy element: High score Medium score Low score The ranges are determined in "Configure Compliance and Maturity Score Ranges" on page 63 Mini-map When an asset has multiple policies/security categories applied to it and is larger than the map area, you can navigate it by clicking and dragging in the Mini-map area. To expand or collapse the mini-map, click the Expand/Collapse button. Vulnerability Dashboard The Vulnerability Dashboard provides you with an overview of your organization's vulnerability state for a specific asset and its children. To open the Vulnerability Dashboard, click Vulnerabilities > Vulnerability Dashboard. User Guide Chapter 8: Dashboards and Reports HP EnterpriseView (2.5) Page 195 of 265
  • 196.
    The Vulnerability Dashboardincludes the following components: l Asset Selector This component enables you to select the asset that you want to display in the Vulnerability Dashboard. The Organization tab displays the EnterpriseView business model. Expand the business model to select the asset that you want to display. The Search tab enables you to search for a name or a partial name of any asset in EnterpriseView, connected to the business model. After you have selected the asset, you can collapse the Asset Selector by clicking the Collapse button. To expand the Asset Selector, click the Expand Asset Selector button. Vulnerability Summary This component includes the aggregate asset vulnerability score for the asset that you selected. For more information on asset vulnerability score aggregation, see "Asset Vulnerability Score Aggregation Mechanism" on page 147. It also displays the percentage of vulnerabilities that have not been handled yet out of all the open vulnerabilities that belong to this asset and its children. To analyze the aggregate asset vulnerability score, click the score. The Vulnerability Management page opens, displaying vulnerability information for the asset that you have chosen. l First-Level Children Summary Displays the following information for the most vulnerable first level children of the asset that you selected (up to five are displayed): n Aggregate asset vulnerability score. n The number of open vulnerabilities and the percentage of open vulnerabilities that have not been handled yet, meaning, with a remediation status of New or Reopened. To analyze a specific child asset, click the asset in the Asset Name column. The page is reloaded with information on the asset that you chose. l Open Vulnerabilities by Type Displays a breakdown of all the open vulnerabilities that are attached to the asset that you have selected or to any of its children, according to their type. User Guide Chapter 8: Dashboards and Reports HP EnterpriseView (2.5) Page 196 of 265
  • 197.
    l Vulnerabilities withthe Highest Scores Displays the vulnerabilities with the highest scores that affect the asset that you have selected, meaning that they are either attached directly to the asset or to the asset's children. Each record represents a vulnerability (ID). The Assets Impacted column displays the number of assets that this vulnerability (open or closed) affects, either by being directly attached to the asset or by being attached to a child asset. The percentage of open vulnerabilities is displayed in parenthesis. l Aggregate Vulnerability Score Over Time Aggregate vulnerability scores are archived on a weekly basis. These scores, as well as the most updated score, are displayed in a graph in order to reveal trends in vulnerability scores. If you hover over the round icons in the graph, you can see the exact vulnerability score and the date on which it was calculated. For more information on archiving, see the Archive Trend Data section in the HP EnterpriseView Administration Guide. l Number of Open Vulnerabilities Over Time The number of open vulnerabilities are archived on a weekly basis. These scores, as well as the most updated score, are displayed in a graph in order to reveal trends in risk. If you hover over the round icons in the graph, you can see the exact risk score and the date on which it was calculated. For more information on archiving, see the Archive Trend Data section in the HP EnterpriseView Administration Guide. Task Management Dashboard The Task Management Dashboard is a comprehensive dashboard that provides you with information on the status of the workflows in EnterpriseView. For more information on task management, see "Task Management" on page 238. To open the Task Management Dashboard, click Executive View > Task Management Dashboard. l Workflows in Progress This component displays a table of the workflows with the nearest due date. This information allows you to quickly identify the workflows that require your immediate attention. l Number of Overdue Completed Workflows by Template User Guide Chapter 8: Dashboards and Reports HP EnterpriseView (2.5) Page 197 of 265
  • 198.
    This component displaysthe number of workflows that have not been completed on time according to their template. This information enables you to identify problematic processes and handle them accordingly. l Task Management KPI A Key Performance Indicator (KPI) that indicates the percentage of workflows that have been completed by the workflow due date. l Due Date Breakdown A breakdown of all workflows that are in progress according to their due date. n Overdue:If the due date of the workflow has passed. n Approaching: If the workflow due date is in seven days or less. n Future: If the workflow due date is in more than seven days. User Guide Chapter 8: Dashboards and Reports HP EnterpriseView (2.5) Page 198 of 265
  • 199.
    EnterpriseView Universe In BusinessObjects,a universe is an abstraction of a data source that contains data in non- technical terms with which users can create queries and run them against a database. These queries are then used to perform data analysis and create reports using entities in the universe called objects. For more information, see BusinessObjects documentation. The EnterpriseView system includes an EnterpriseView universe that contains the classes and objects described in the following tables. You can use these objects to create a customized report, as described in Create a Report Using SAP BusinessObjects WebIntelligence in the HP EnterpriseView Administration Guide. Asset An asset is an entity that represents a physical or logical resource in the system. For example, assets can represent hardware, software, services, or business units. Object Description Asset ID The unique ID of the asset. Asset Category The category of the asset. Includes: Organization, Location, Business, IP, Infrastructure Elements, Running Software. For more information, see "Manage Asset Types" on page 21. Asset Name The name of the asset. Asset Type The asset type is a subset of the asset category. Asset Description Additional information on the asset. Business Value A numeric, monetary value. Criticality Level A numeric index, between 0 and 10, indicating the severity of a potential catastrophe and the probability of its occurrence. The default criticality level of all assets is 1. The criticality level of an asset affects the weight of its scores when policy assessment aggregation, risk aggregation and vulnerability score aggregation is done. For more information, see "Weights and Criticality Level" on page 83. Latitude Geographical coordinates of the asset's location. Longitude Geographical coordinates of the asset's location. Address Street address of the asset. ZIP Code Asset location ZIP code. City City of the asset. User Guide Chapter 8: Dashboards and Reports HP EnterpriseView (2.5) Page 199 of 265
  • 200.
    Object Description State Stateof the asset. Country Country of the asset. OS Name The operating system that is installed on the infrastructure element. OS Version The version of the operating system that is installed on the infrastructure element. Application Name The name of the application. Application Version The version of the application. DNS Name The server name as defined in the network DNS. MAC Address The server MAC address. IP Address The server IP address. Role For people or groups, their role in the organization. Owner The person responsible for the asset and who is contacted in situations requiring manual intervention. The asset owner is automatically authorized to work with the asset. Version For documents, its version. Purpose The purpose for which the document was created. Classification The type of document, such as legal or technical. Release Date The date on which the document was published. Is Attached Indicates whether the asset is attached to the business model. Archived Data (subclass of Asset) This class includes information about scores that are archived in EnterpriseView. A dedicated job is run periodically to extract and store a snapshot of these scores in the database. This data is used to create history and trend reports. Overall Score Archive (subclass of Archived Data) This class includes archived data about the overall score of the asset. Object Description Overall Score The overall score of the asset. For more information on how this score is calculated, see "Configure Overall Score Formula Weights" on page 263 Snapshot Time The date and time that the overall score was archived. User Guide Chapter 8: Dashboards and Reports HP EnterpriseView (2.5) Page 200 of 265
  • 201.
    Asset Vulnerability Archive(subclass of Archived Data) This class includes archived data on asset vulnerabilities and aggregate asset vulnerability scores. Object Description Aggregated Open Vulnerability Count The number of all open vulnerabilities that are attached to an asset and its direct and indirect children. Aggregated Asset Vulnerability Score See "Aggregate Asset Vulnerability Score" on page 215. Snapshot Time The date and time that the aggregate asset vulnerability score was archived. Risk Assessment Archive (subclass of Archived Data) This class includes archived data on the risk score of an asset. Aggregated Score (subclass of Risk Assessment Archive) This class includes archived data on the aggregate risk score of an asset. Object Description Aggregated Asset Risk Score See "Aggregate Asset Risk Score" on page 205. Snapshot Time The date and time that the aggregate risk score was archived. Asset Risk Score (subclass of Risk Assessment Archive) This class includes archived data on the residual risk score of an asset. Object Description Asset Risk Score The aggregate residual risk score of all of the threats applied to the asset. Snapshot Time The date and time that the residual risk score was archived. Policy Assessment Archive (subclass of Archived Data) This class includes archived data on the maturity and compliance score of an asset. Asset Score Archive (subclass of Policy Assessment Archive) This class includes archived data on the aggregate maturity and compliance score of an asset on the business model level. Object Description Snapshot Time The date and time that the maturity and compliance data were archived. User Guide Chapter 8: Dashboards and Reports HP EnterpriseView (2.5) Page 201 of 265
  • 202.
    Object Description Compliance ScoreIndicates how compliant the asset is with the control. Measured as a percent. Compliance Score Severity Low, Medium or High, depending on the score range. Compliance Progress The percentage of overall asset compliance with a policy. Maturity Score The evolutionary state of a control when it is applied to a specific asset, comprised by the weighted average of five factors: People, Procedure, Process, Product, and Proof (also known in EnterpriseView as P5 maturity factors). Maturity Score Severity Low, Medium or High, depending on the score range. Maturity Progress The percentage of the overall control maturity within a policy, for a specific asset. Policy Score Archive (subclass of Policy Assessment Archive) This class includes archived data on the aggregate maturity and compliance score of an asset on the policy level. Object Description Policy ID The unique ID of the policy. Snapshot Time The date and time that the maturity and compliance data were archived. Compliance Score Indicates how compliant the asset is with the control. Measured as a percent. Compliance Score Severity Low, Medium or High, depending on the score range. Compliance Progress The percentage of overall asset compliance with a policy. Maturity Score The evolutionary state of a control when it is applied to a specific asset, comprised by the weighted average of five factors: People, Procedure, Process, Product, and Proof (also known in EnterpriseView as P5 maturity factors). Maturity Score Severity Low, Medium or High, depending on the score range. Maturity Progress The percentage of the overall control maturity within a policy, for a specific asset. Policy P5 Score Archive (subclass of Policy Score Archive) This class includes archived data on P5 maturity scores of an asset on the policy level. User Guide Chapter 8: Dashboards and Reports HP EnterpriseView (2.5) Page 202 of 265
  • 203.
    Object Description People ScoreMaturity score for People factor. Procedure Score Maturity score for Procedure factor. Process Score Maturity score for Process factor. Product Score Maturity score for Product factor. Proof Score Maturity score for Proof factor. External Risk Factor Archive (Subclass of Archived Data) This class includes archived data on the score and aggregate score for and external risk factor of an asset. Aggregated Asset External Risk Factor Archive (subclass of External Risk Factor Archive) This class includes archived data on the aggregate score for and external risk factor of an asset. Object Description External Risk Factor ID The unique ID of the external risk factor. Aggregated Asset External Risk Factor Score The aggregate score of the external risk factor for a specific asset. Snapshot Time If the risk information is from a CSV file, then this is the date and time from the file. If not, then it is the date of the import. Asset External Risk Factor Archive (subclass of Archived Data) This class includes archived data on the score of an external risk factor of an asset. Object Description External Risk Factor ID The unique ID of the external risk factor. Rank Snapshot Time by Asset and Risk Factor Use this object to sort combinations of Asset IDs and Risk Factor IDs according to their snapshot time. The records are displayed in descending order (from the most recent date to the oldest date). Current Score Duration (Days) The number of days that an asset has a certain external risk factor score (without change). Asset External Risk Factor Score The score of the external risk factor for a specific asset. User Guide Chapter 8: Dashboards and Reports HP EnterpriseView (2.5) Page 203 of 265
  • 204.
    Object Description Asset ExternalRisk Factor Previous Score The previous score of the external risk factor for a specific asset. Snapshot Time If the risk information is from a CSV file, then this is the date and time from the file. If not, then it is the date of the import. Asset Source (subclass of Asset) The origin of the asset. Object Description Source ID The unique ID of the source. Source Name l If assets are created in EnterpriseView, then the source name is empty. l If assets are imported from an external asset repository, then the source name is the same as the connector name defined in the Configuration module. l For the Organization asset the source name is System. External ID The ID of the asset in the source (such as UCMDB and ArcSight ESM). Overall Asset Score (subclass of Asset) Object Description Overall Asset Score The overall asset score is composed of the aggregate scores of all risk factors. The following formula is used for calculating the overall asset score: normalized aggregated risk factor scores weight weights ∑( * ) ∑ Risk Assessment (subclass of Asset) The process of attaching threats to assets, evaluating the likelihood of their occurrence, and estimating the potential impact. Object Description Asset Risk Score The aggregate residual risk score of all of the threats applied to the asset. User Guide Chapter 8: Dashboards and Reports HP EnterpriseView (2.5) Page 204 of 265
  • 205.
    Object Description Asset RiskScore Severity The severity level of the risk on an asset, expressed as one of the following values:  Low, Medium, or High. This value depends on the risk score ranges defined. Aggregate Asset Risk Score Generally defined as the weighted average of aggregate risk scores of the children of an asset, but depends on the calculation method configured. For more information, see "Risk Score Aggregation Mechanism" on page 110. Associated Category (subclass of Risk Assessment) An associated category is a category in a threat that is applied to an asset. Object Description Category ID The unique ID of the category. Category Weight A numeric value between 0 and 100, associated with a specific asset. Is used when calculating the asset risk score. Category Risk Score The weighted average of all actor scores. Actor Score Actor Weight Actor Weights ∑( * ) ∑( ) For more information, see "Residual Risk Score Calculation" on page 112. Associated Actor (subclass of Associated Category) An associated actor is an actor in a threat that is applied to an asset. An actor is a potential initiator of a violation of the security requirements (confidentiality, integrity, availability) of an asset in your organization. Object Description Actor ID The unique ID of the actor. Actor Weight A numeric value between 0 and 100, associated with a specific asset. Is used when calculating the category risk score. Actor Risk Score The actor receives the score of the threat scenario (impact) with the highest risk. For more information, see "Residual Risk Score Calculation" on page 112. Impact (subclass of Associated Actor) The severity of an event, if it occurred. User Guide Chapter 8: Dashboards and Reports HP EnterpriseView (2.5) Page 205 of 265
  • 206.
    Object Description Operation IDThe unique ID of the operation. Impact Description Notes and comments used to document the risk assessment process. Risk Status One of the following values: l Not Assessed l Assessed l Treatment in Progress l Treatment Completed Risk Tolerance Level The maximum level of risk exposure that you are willing to accept for an asset in a threat scenario. Impact Score The impact score is a calculation of all the values of the impact areas. For information on how this score is calculated, see "Impact Score Calculation" on page 112. Inherent Risk Score The risk to an asset, for a specific threat scenario, in the absence of any actions you might take to alter either the likelihood or impact. It is calculated as the impact score multiplied by the probability. Probability The probability that a threat will occur on a specific asset. A number between 0 and 1. Residual Risk Score The risk that remains after you have attempted to mitigate the Inherent Risk. Last Updated The last date and time on which the probability values, impact area values, or both were updated. Treatment (subclass of Impact) This class includes risk score after the risk has been treated. User Guide Chapter 8: Dashboards and Reports HP EnterpriseView (2.5) Page 206 of 265
  • 207.
    Object Description Treated ImpactScore See "EnterpriseView Universe" on page 199. Before you begin treatment, the treated impact score is empty. After you begin treatment, the default score is the same as the impact score calculated during the assessment process. After you carry out your treatment plan, and you modify the impact areas to reflect the reduced risk, then a new impact score is calculated. Treated Probability See "EnterpriseView Universe" on page 199. Before you begin treatment, the treated probability is empty. After you begin treatment, the default treated probability is the same as the probability calculated during the assessment process. After you carry out your treatment plan, you can manually modify the probability to reflect the reduced risk. Adjusted Probability The adjusted probability is the treated probability after it has been reduced or increased by control compliance scores. Residual Risk Score The residual risk score is the risk that remains after you have attempted to mitigate the inherent risk. It is calculated as the treated impact score multiplied by the adjusted probability (Residual Score = Treated Impact Score X Adjusted Probability). If there is no treatment, it is calculated by the assessment impact score multiplied by the adjusted probability. Treatment method (subclass of Treatment) This class includes information about the methods used to treat the risk. Object Description Type The type of method used to handle the risk: Mitigation, Acceptance, Transference, Deferral, or Avoidance. Description The description entered for each treatment activity. Expiration Date/Due Date l Expiration Date: For all other treatment methods, the date on which the treatment activity is no longer valid and the treatment plan must be reevaluated. l Due Date: If the treatment method is mitigation, then the date on which the mitigation activity must be completed. User Guide Chapter 8: Dashboards and Reports HP EnterpriseView (2.5) Page 207 of 265
  • 208.
    Object Description Reason Thereason for choosing the treatment method. Not applicable to all treatment methods. Status The status of the treatment activity. Not applicable to all treatment methods. Action Plan A step by step description of the actions that should be carried out for this treatment activity. Not applicable to all treatment methods. Resources The resources required for handling the risk. Not applicable to all treatment methods. Budget/Cost The budget or the cost of handling the risk. Not applicable to all treatment methods. Treatment Impact Area values (subclass of Treatment) A treatment impact area value can be Low, Medium, or High. Object Description Impact Area ID The unique ID of the impact area. Impact value Low, Medium, or High Impact Area Value (subclass of Impact) An impact area value can be Low, Medium, or High. Object Description Impact Area ID The unique ID of the impact area. Impact value Low, Medium, or High SoA (subclass of Asset) The Statement of Applicability (SoA) identifies the controls chosen for the assets in the organization. Policy - SoA (subclass of SoA) The policies that include controls are applied to an asset. Object Description Policy ID The unique ID of the policy. User Guide Chapter 8: Dashboards and Reports HP EnterpriseView (2.5) Page 208 of 265
  • 209.
    Policy Security Category- SoA (subclass of Policy - SoA) The policy security categories that include controls that are applied to an asset. Object Description Policy Security Category ID The unique ID of the policy security category. Not Applied Controls Count The number of controls for a specific security category that are not applied to an asset. Applied Controls Count The number of controls for a specific security category that are applied to an asset. Control - SoA (subclass of Policy Security Category - SoA) The controls that are applied to an asset. Object Description Control ID The unique ID of the control. Is Control Applied Indicates whether the control is applied to an asset. Assignment Type Indicates one of the following values for a control that is applied to an asset: l Inherited: From a parent asset. l Inheritance Exception: Control applicability has been overridden. l Applied Manually: A regular control assignment. Inherited From Asset (subclass of Control - SoA) Controls that are inherited from a parent asset. Object Description Asset ID The unique ID of the parent asset. Asset Category The category of the parent asset. Asset Name The name of the parent asset. Asset Type The type of the parent asset. Policy Assessment (subclass of Asset) The process of assessing policy compliance and control maturity for all assets that comprise your organization's business model. User Guide Chapter 8: Dashboards and Reports HP EnterpriseView (2.5) Page 209 of 265
  • 210.
    Asset Scores (subclassof Policy Assessment) Scores of assets that have been assessed. Object Description Compliance Score Indicates how compliant the asset is with the control. Measured as a percent. Compliance Progress The percentage of overall asset compliance with a policy. Compliance Score Severity Low, Medium or High, depending on the score range, determined in Settings. Maturity Score The evolutionary state of a control when it is applied to a specific asset, comprised by the weighted average of five factors: People, Procedure, Process, Product, and Proof (also known in EnterpriseView as P5 maturity factors). Maturity Progress The percentage of the overall control maturity within a policy, for a specific asset. Maturity Score Severity Low, Medium or High, depending on the score range, determined in Settings. Policy Scores (subclass of Asset Scores) Scores of an asset that has been assessed for a specific policy. Object Description Policy ID The unique ID of the policy. Compliance Score Indicates how compliant the asset is with the policy. Measured as a percent. Compliance Score Severity Low, Medium or High, depending on the score range, determined in Settings. Compliance Progress The percentage of overall asset compliance with a policy. Maturity Score The evolutionary state of a policy when it is applied to a specific asset, comprised by the weighted average of five factors: People, Procedure, Process, Product, and Proof (also known in EnterpriseView as P5 maturity factors). Maturity Score Severity Low, Medium or High, depending on the score range, determined in Settings. Maturity Progress The percentage of the overall control maturity within a policy, for a specific asset. User Guide Chapter 8: Dashboards and Reports HP EnterpriseView (2.5) Page 210 of 265
  • 211.
    Policy P5 Scores (subclassof Policy Scores) Assessment scores on specific control maturity factors aggregate to the policy. Object Description People Score Maturity score for People factor. Procedure Score Maturity score for Procedure factor. Process Score Maturity score for Process factor. Product Score Maturity score for Product factor. Proof Score Maturity score for Proof factor. Policy Security Category Scores (subclass of Policy Scores) Scores of an asset that has been assessed for a specific security category. Object Description Policy Security Category ID The unique ID of the policy security category. Compliance Score Indicates how compliant the asset is with the security category. Measured as a percent. Compliance Progress The percentage of overall asset compliance with a policy. Maturity Score The evolutionary state of a control when it is applied to a specific asset, comprised by the weighted average of five factors: People, Procedure, Process, Product, and Proof (also known in EnterpriseView as P5 maturity factors). Maturity Progress The percentage of the overall control maturity within a policy, for a specific asset. Policy Security Category P5 Scores (subclass of Policy Security Category Scores) Assessment scores on specific control maturity factors aggregate to the security category. Object Description People Score Maturity score for People factor. Procedure Score Maturity score for Procedure factor. Process Score Maturity score for Process factor. Product Score Maturity score for Product factor. Proof Score Maturity score for Proof factor. User Guide Chapter 8: Dashboards and Reports HP EnterpriseView (2.5) Page 211 of 265
  • 212.
    Control Audit Data(subclass of Policy Security Category Scores) Information on a specific assessment. Object Description Control ID The unique ID of the control. Implementation Details Details on how the control was implemented. Control Notes (subclass of Control Audit Data) Object Description Note ID The unique ID of the note. Note Time The date and time on which the note was created. Note Text Any type of additional information related to the assessment. Control Scores (subclass of Control Audit Data) Assessment scores on a specific control. Object Description Compliance Score Indicates how compliant the asset is with the control. Measured as a percent. Compliance Score Severity Low, Medium or High, depending on the score range, determined in Settings. Compliance Progress The percentage of overall asset compliance with a policy. Maturity Score The evolutionary state of a control when it is applied to a specific asset, comprised by the weighted average of five factors: People, Procedure, Process, Product, and Proof (also known in EnterpriseView as P5 maturity factors). Maturity Score Severity Low, Medium or High, depending on the score range, determined in Settings. Maturity Progress The percentage of the overall control maturity within a policy, for a specific asset. Compliance Applied Manually Indicates that a score was applied manually. It is applied only to the specific scores that have been changed. Last Updated The last date and time on which the control compliance and/or maturity score was updated. Control P5 Scores (subclass of Control Scores) Assessment scores on specific control maturity factors. User Guide Chapter 8: Dashboards and Reports HP EnterpriseView (2.5) Page 212 of 265
  • 213.
    Object Description People ScoreMaturity score for People factor. People Applied Manually Score for People factor applied manually. Procedure Score Maturity score for Procedure factor. Procedure Applied Manually Score for Procedure factor applied manually. Process Score Maturity score for Process factor. Process Applied Manually Score for Process factor applied manually. Product Score Maturity score for Product factor. Product Applied Manually Score for Product factor applied manually. Proof Score Maturity score for Proof factor. Proof Applied Manually Score for Proof factor applied manually. Policy Compliance (subclass of Asset) This class enables you to create a policy compliance report for assets on a policy that has not been directly assessed (Compliant Policy), but are mapped in EnterpriseView to a policy that has been assessed (Assessed Policy). For more information, see "Policy Mapping" on page 59. Object Description Assessed Policy ID The unique ID of the assessed policy. Assessed Policy Name The unique name of the assessed policy. Compliant Policy ID The unique ID of the compliant policy. Compliant Policy Name The unique name of the compliant policy. Mapped Controls (subclass of Policy Compliance) This class includes information on mapped control parameters. Object Description Assessed Control ID The unique ID of the assessed control. Assessed Policy Security Category Paragraph Number An alphanumeric string that indicates the paragraph number. Assessed Policy Security Category Title The title of the policy security category. Compliant Control ID The unique ID of the compliant control. User Guide Chapter 8: Dashboards and Reports HP EnterpriseView (2.5) Page 213 of 265
  • 214.
    Object Description Compliant PolicySecurity Category Title The title of the policy security category. Compliant Policy Security Category Paragraph Number An alphanumeric string. Compliant Policy Security Category Order Key Used to display the policy security categories according to their order in the policy. Mapped Control Scores (subclass of Mapped Controls) This class includes information on mapped control scores. Object Description Compliance Score Indicates how compliant is the asset with the control. Measured as a percent. Compliance Progress The percentage of overall asset compliance with a policy. Maturity Score The evolutionary state of a control when it is applied to a specific asset, comprised by the weighted average of five factors: People, Procedure, Process, Product, and Proof (also known in EnterpriseView as P5 maturity factors). Maturity Progress The percentage of the overall control maturity within a policy, for a specific asset. Mapped Control P5 Scores (subclass of Mapped Control Scores) Assessment scores on specific control maturity factors that belong to a mapped control. Object Description People Score The maturity score for People factor. Procedure Score The maturity score for Procedure factor. Process Score The maturity score for Process factor. Product Score The maturity score for Product factor. Proof Score The maturity score for Proof factor. User Guide Chapter 8: Dashboards and Reports HP EnterpriseView (2.5) Page 214 of 265
  • 215.
    Asset Vulnerability (subclassof Asset) This class includes different types of asset vulnerability scores. Object Description Asset Vulnerability Score The highest score out of all the vulnerability scores of open vulnerabilities that are associated with the asset. Aggregate Asset Vulnerability Score The highest score of the following: Asset vulnerability score Or m n * AggregatedAssetVulnerabilityScore CriticalityLevel of top Children CriticalityLevel ∑( * ) ∑( ) m=Children Multiplier n=Maximum Children in Calculation. Sorted primarily by aggregate asset vulnerability score and secondarily by criticality level. Aggregate Open Vulnerability Count The number of open vulnerabilities for an asset and its children. Top Open Vulnerabilities (subclass of Asset Vulnerability) Use this class to create a report that displays the vulnerabilities with the highest scores out of the vulnerabilities with status Open. Up to 100 vulnerabilities can be displayed. Object Description Vulnerability ID The unique ID of the vulnerability. Max Score The highest score out of all vulnerability occurrence scores. Asset Count The number of assets with this vulnerability. Vulnerability Count The number of vulnerability instances. Asset External Risk Factors (subclass of Asset) Use this class to create reports on external risk factors. For more information on external risk factors, see "External Risk Factors" on page 161. Object Description External Risk Factor ID The unique ID of the external risk factor. External Risk Factor Comment Additional information to the risk factor score imported from the external risk source. User Guide Chapter 8: Dashboards and Reports HP EnterpriseView (2.5) Page 215 of 265
  • 216.
    Object Description External RiskFactor Score The score for a specific asset for a risk factor imported from an external source. Aggregated External Risk Factor Score The aggregate score for a specific asset for a risk factor imported from an external source. Snapshot (subclass of Asset External Risk Factors) This class includes information on external risk factor snapshots. Object Description External Risk Factor Score The individual external risk factor score of the asset at the time the snapshot was captured. Aggregate External Risk Factor Score The aggregate external risk factor score of the asset at the time the snapshot was captured. Snapshot Time The date and time on which the snapshot was captured. Current Score Duration (Days) The number of days that an asset has a certain external risk factor score (without change). Asset CPE (subclass of Asset) This class includes information on CPEs that are associated with the assets in the business model. Object Description CPE ID The unique ID of the CPE. CPE Name The name of the CPE is composed of the vendor name, the product name, and the version of the product, in the following format: vendor:product:version. Asset Product (subclass of Asset CPE) This class includes information on products that are included in the CPE definitions, for CPEs that are associated with assets in the business model. Object Description Product ID The unique ID of the product. Product Name The name of the product as it appears in the CPE. Asset Vendor (subclass of Asset Product) This class includes information on vendors that are included in the CPE definitions, for CPEs that are associated with assets in the business model. User Guide Chapter 8: Dashboards and Reports HP EnterpriseView (2.5) Page 216 of 265
  • 217.
    Object Description Vendor IDThe unique ID of the vendor. Vendor Name The name of the vendor as it appears in the CPE. Asset Children Use this class to create reports on an asset's children. Object Description Parent Asset ID Parent asset unique ID. This asset is the starting point for the asset hierarchy. Children (subclass of Asset Children) Use this class to create reports on an asset's children. Object Description Child Asset ID Child asset unique ID. Hierarchy Level The position of the asset in the hierarchical tree, in reference to the parent asset (Parent Asset ID object). Asset Profiling This class includes information that is relevant to asset properties. Criticality Level Ranges (subclass of Asset profiling) This class includes color indication for the criticality level ranges. Object Description Medium Criticality level within a medium range is displayed in yellow. Score below the medium range is displayed in green. High Criticality level within the high range is displayed in red. Policies This class includes all the information that is relevant to active policies. General Policy Settings (subclass of Policies) This class includes information on policy settings that is relevant to all policies. Maturity Score Range (subclass of General Policy Settings) This class includes color indication for the maturity score ranges. User Guide Chapter 8: Dashboards and Reports HP EnterpriseView (2.5) Page 217 of 265
  • 218.
    Object Description Medium Scoreswithin a medium range are displayed in yellow. Scores below the medium range are displayed in green. High Scores within the high range are displayed in red. Compliance Score Range (subclass of General Policy Settings) This class includes color indication for the compliance score ranges. Object Description Medium Scores within a medium range are displayed in yellow. Scores below the medium range are displayed in green. High Scores within the high range are displayed in red. Policy (subclass of Policies) This class includes information that is specific to a policy. A policy includes legal, statutory, regulatory, and contractual requirements to which the organization is bound. Object Description Policy ID The unique ID of the policy. Policy Name The name of the policy. Policy Description A description of the policy. Policy Security Category (subclass of Policy) A policy security category is group of controls with common characteristics. Object Description Policy Security Category ID The unique ID of the policy security category. Policy Security Category Paragraph Number An alphanumeric string. Policy Security Category Title The title of the policy security category. Policy Security Category Text Any additional text explaining the policy security category. User Guide Chapter 8: Dashboards and Reports HP EnterpriseView (2.5) Page 218 of 265
  • 219.
    Object Description Policy SecurityCategory Level Policy security categories can be nested. This object indicates the level of the policy security category in the policy security category hierarchy. Policy Security Category Order Key Used to display the policy security categories according to their order in the policy. Policy Security Category Controls Count The number of controls under a specific policy security category. Policy Security Category Hierarchy (subclass of Policy Security Category) This class enables you to create a report for a specific security category and is generally used for drill-down capability. Object Description Policy Security Category Parent ID The ID of the security category that contains the policy elements that you want to display. Policy Security Category Grandparent ID The ID of the security category that contains the security category that contains the policy elements that you want to display. Has Children Indicates whether the policy element is the last level in the policy hierarchy. Control (subclass of Policy Security Category) Controls are the guidelines and rules that form the foundation of a policy. Object Description Control ID The unique ID of the control. Control Text Control text. Control Additional Information Control additional information. Guideline Introduction Guideline introduction. Guideline Additional Text Guideline additional text. Control Type One of the following values: Management, Technical, or Operations. Control GRC Designation One of the following values: Regulation, Legal Status, Standards or Threats. User Guide Chapter 8: Dashboards and Reports HP EnterpriseView (2.5) Page 219 of 265
  • 220.
    Object Description Control PurposeOne of the following values: Confidentiality, Integrity, Availability, Audit, or Privacy. Control Weight A numeric value between 0 and 100. The control weight affects the aggregation calculation on the policy level. For more information, see "Weights and Criticality Level" on page 83. Control Priority One of the following values: Low, Medium, or High. People Applicable to Control Indicates whether the People control maturity factor is applicable to a specific control. Procedure Applicable to Control Indicates whether the Procedure control maturity factor is applicable to a specific control. Process Applicable to Control Indicates whether the Process control maturity factor is applicable to a specific control. Product Applicable to Control Indicates whether the Product control maturity factor is applicable to a specific control. Proof Applicable to Control Indicates whether the Proof control maturity factor is applicable to a specific control. Control Guidelines (subclass of Control) Guidelines or rules of the control. Object Description Guideline ID The unique ID of the guideline. Guideline Text Guideline text. Guideline Order Key Used to display the guidelines according to their order in the control. Tag (subclass of Controls Guidelines) Short descriptive texts that are applied to guidelines. Object Description Tag ID The unique ID of the tag. Tag Name The tag name. Control Template (subclass of Policy) This class enables you to create a report that displays only the objects that are in the control template. User Guide Chapter 8: Dashboards and Reports HP EnterpriseView (2.5) Page 220 of 265
  • 221.
    Object Description Control Textin Template Indicates whether this parameter is in the template. Control Additional Information in Template Indicates whether this parameter is in the template. Control Guidelines in Template Indicates whether this parameter is in the template. People in Template Indicates whether this parameter is in the template. Procedure in Template Indicates whether this parameter is in the template. Product in Template Indicates whether this parameter is in the template. Process in Template Indicates whether this parameter is in the template. Proof in template Indicates whether this parameter is in the template. Guideline Introduction in Template Indicates whether this parameter is in the template. Guideline Additional Text in Template Indicates whether this parameter is in the template. Control Type in Template Indicates whether this parameter is in the template. Control GRC Designation in Template Indicates whether this parameter is in the template. Control Purpose in Template Indicates whether this parameter is in the template. Control Weight in Template Indicates whether this parameter is in the template. Control Priority in Template Indicates whether this parameter is in the template. People Weight The weight applied to this maturity factor. Procedure Weight The weight applied to this maturity factor. Process Weight The weight applied to this maturity factor. Product Weight The weight applied to this maturity factor. Proof Weight The weight applied to this maturity factor. Attachments Attachments related to this control. Policy Mapping This class enables you to create a report that displays mappings between policies. User Guide Chapter 8: Dashboards and Reports HP EnterpriseView (2.5) Page 221 of 265
  • 222.
    Object Description Source PolicyID The unique ID of the source policy. Source Policy Name The name of the source policy. Target Policy ID The unique ID of the target policy. Target Policy Name The name of the target policy. Is Target policy Active Indicates whether the target policy is active in EnterpriseView. For more information, see "Activate a Policy" on page 47. Policy Mapped Controls (subclass of Policies) This class includes information on the mapped source and target controls. Object Description Source Control ID The unique ID of the control in the source policy. Source Policy Security Category Paragraph Number The source policy security category paragraph number. Source Policy Security Category Title The source policy security category title. Target Control ID The unique ID of the control in the target policy. Target Control Text The control text in the target control. Target Policy Security Category Paragraph Number The target policy security category paragraph number. Target Policy Security Category Title The target policy security category title. Vulnerability A vulnerability is a flaw or a weakness in the software (in the network layer or the application layer)  or a system configuration issue that can be exploited by an attacker and used to gain access to a system or a network. Object Description Count (Distinct Vulnerability ID) Counts vulnerability IDs. This means that if two records have the same vulnerability ID, then they will count as one. This object only works when you query a table that has an Vulnerability ID field. User Guide Chapter 8: Dashboards and Reports HP EnterpriseView (2.5) Page 222 of 265
  • 223.
    Object Description Vulnerability IDA common classification ID. This ID can be defined in the vulnerability dictionary or not. It can be a CVE, CCE, or identification provided by the scanner. It is displayed in the User Interface. Vulnerability Internal ID The unique ID of the vulnerability. It is not displayed in the User Interface. Vulnerability Title A descriptive name of the vulnerability. Vulnerability Type Network, Application, and Configuration Vulnerability Score The vulnerability score is the severity level of the vulnerability expressed as a number between 0 and 10. It is calculated by EnterpriseView labs. The scoring system varies between the different vulnerability types: l Network and Web application vulnerabilities The score is CVSS version 2.0 compliant. For more information, see "Common Vulnerability Scoring System" on page 131. Scores of new vulnerabilities that do not exist in the dictionary are imported from the scanner and are normalized to the EnterpriseView scoring system. l Configuration vulnerabilities  The score is determined according to the check results: n Passed (the configuration is correct): the score is 0. n Failed (the configuration is incorrect): the score is 10. n Unknown (there is not enough information to determine if the check failed or passed): the score is 5. Vulnerability Details A detailed description of the vulnerability. Vulnerability Status Name Indicates the values Open or Closed. Vulnerability Remediation Name Indicates the values New, Passed, Reopened, Assigned, Awaiting Remediation, Not an Issue, Awaiting Verification, Resolved, or Automatically Closed. User Guide Chapter 8: Dashboards and Reports HP EnterpriseView (2.5) Page 223 of 265
  • 224.
    Object Description Vulnerability LastUpdate On The last time that one of the properties of the vulnerability occurrence was changed. This property is not updated if a vulnerability is attached or detached from an asset or if a new note has been added. Vulnerability Last Update On (Days) The number of days since the vulnerability was last updated. Vulnerability Last Reported Status Relevant only for configuration vulnerabilities. Typically, scanners provide a status for configuration vulnerability checks. Common values include: Pass, Fixed, Error, Unknown, Not Applicable, Not Checked, not Selected, and Warning. If a scanner provides such a status, then it is displayed as this property. If the last scan status is Passed or Fixed, then the remediation status is Passed. Vulnerability Location The location displayed depends on the type of the vulnerability. Each type has the following location formats: l Network and configuration: <Hostname>:<Network Port>. Hostname and IP address are interchangeable. l Application: <Normalized URI>:<Vulnerable Parameter>. The original URI indicating the location of the vulnerability is normalized by the Vulnerability Import Job. The vulnerable parameter is isolated from the query string passed in the original URI. Vulnerability Number of Times Reported The number of times that a specific vulnerability is reported from various sources. Vulnerability First Reported On The date and time of the first report of the vulnerability, as recorded by the external source from which the vulnerability was imported. Vulnerability Last Reported On The date and time of the last report of the vulnerability, as recorded by the external source from which the vulnerability was imported. Archived Vulnerability (subclass of Vulnerability) This class includes information on archived vulnerabilities. Only network and application vulnerabilities are archived. User Guide Chapter 8: Dashboards and Reports HP EnterpriseView (2.5) Page 224 of 265
  • 225.
    Object Description Asset IDThe ID of the asset that the vulnerability is attached to. Archived Vulnerability ID A common classification ID. This ID can be defined in the vulnerability dictionary or not. It can be a CVE or identification provided by the scanner. It is displayed in the User Interface. Archived Vulnerability Internal ID The unique ID of the vulnerability. It is not displayed in the User Interface. Archived Vulnerability Title A short description of the vulnerability. Archived Vulnerability Type Network and Application Archived Vulnerability Details A detailed description of the vulnerability. Archived Vulnerability Score For network and application vulnerabilities. The vulnerability score is the severity level of the vulnerability expressed as a number between 0 and 10. It is calculated by EnterpriseView labs. The score is CVSS version 2.0 compliant. For more information, see "Common Vulnerability Scoring System" on page 131. Scores of new vulnerabilities that do not exist in the dictionary are imported from the scanner and are normalized to the EnterpriseView scoring system. Archived Vulnerability Location The location displayed depends on the type of the vulnerability. Each type has the following location formats: l Network and configuration: <Hostname>:<Network Port>. Hostname and IP address are interchangeable. l Application: <Normalized URI>:<Vulnerable Parameter>. The original URI indicating the location of the vulnerability is normalized by the Vulnerability Import Job. The vulnerable parameter is isolated from the query string passed in the original URI. Archived Vulnerability Number of Times Reported The number of times that a specific vulnerability is reported from various sources. Archived Vulnerability First Reported On The date and time of the first report of the vulnerability, as recorded by the external source from which the vulnerability was imported. User Guide Chapter 8: Dashboards and Reports HP EnterpriseView (2.5) Page 225 of 265
  • 226.
    Object Description Archived VulnerabilityLast Reported On The date and time of the last report of the vulnerability, as recorded by the external source from which the vulnerability was imported. Archived Vulnerability Status Name Indicates the values Open or Closed. Archived Vulnerability Remediation Name Indicates the values New, Passed, Reopened, Assigned, Awaiting Remediation, Not an Issue, Awaiting Verification, Resolved, or Automatically Closed. Archived Vulnerability Snapshot Time The date and time that the vulnerability was archived. Archived Vulnerability Groups Vulnerabilities are grouped according to different vulnerability categories. EnterpriseView adopted the Common Weakness Enumeration (CWE) system for identifying most vulnerability groups. Other vulnerability groups are internal and can be identified by an "EVG" prefix. Archived Vulnerability Solution A recommended solution for fixing the vulnerability, as provided from the vulnerability assessment tool. Archived Vulnerability Parameter Relevant only for application vulnerabilities. The parameter from the URI that is used to exploit the vulnerability. For example, User ID can be the vulnerable parameter in case of an SQL injection vulnerability. Archived Vulnerability Host The host where the vulnerability was found. Archived Vulnerability Port The port where the vulnerability was found. Archived Vulnerability IP Relevant for network vulnerabilities. IP address where the vulnerability was found. Archived Vulnerability MAC Relevant for network vulnerabilities. MAC address where the vulnerability was found. Archived Vulnerability Related CVEs The CVE identifiers of related vulnerabilities. Defined by EnterpriseView labs. Archived Vulnerability References The identifiers defined by various sources for vulnerabilities that are similar or related to the vulnerability defined in the EnterpriseView vulnerability dictionary. User Guide Chapter 8: Dashboards and Reports HP EnterpriseView (2.5) Page 226 of 265
  • 227.
    Object Description Archived VulnerabilityLast Updated On The last time that one of the properties of the vulnerability occurrence was changed. This property is not updated if a vulnerability is attached or detached from an asset or if a new note has been added. Archived Vulnerability Note (subclass of Archived Vulnerability) This class includes information on the notes attached to the vulnerabilities. Object Description Vulnerability Note ID The unique ID of the note. Archived Vulnerability Note Creation Date The date and time on which the note was created. Archived Vulnerability Note Creator ID The user ID of the user who added the note. Archived Vulnerability Note Creator The user name of the user who added the note. Archived Vulnerability Note Message The message of the note. Vulnerability Statuses (subclass of Vulnerability) This class includes the names and ID of all types of vulnerability statuses. Vulnerability Status (subclass of Vulnerability Statuses) This class includes the names and ID for all vulnerability statuses. Object Description Vulnerability Status ID The unique ID of the vulnerability status. Vulnerability Status Name Indicates the values Open or Closed. Vulnerability Remediation Status (subclass of Vulnerability Statuses) This class includes the names and ID for all remediation statuses. Object Description Vulnerability Remediation Status ID The unique ID of the vulnerability remediation status. Vulnerability Remediation Status Name Indicates the values New, Reopened, Assigned, Awaiting Remediation, Not an Issue, Awaiting Verification, Resolved, or Automatically Closed. User Guide Chapter 8: Dashboards and Reports HP EnterpriseView (2.5) Page 227 of 265
  • 228.
    Vulnerability Score Ranges(subclass of Vulnerability) This class includes color indication for the vulnerability score ranges. Object Description Medium Scores within a medium range are displayed in yellow. Scores below the medium range are displayed in green. High Scores within the high range are displayed in red. Vulnerability Dictionary This class includes information on vulnerabilities in the vulnerability dictionary. Object Description Vulnerability ID The unique ID of the vulnerability. Vulnerability Type Network, Application, and Configuration Vulnerability Details A detailed description of the vulnerability. Vulnerability Title A short description of the vulnerability. For configuration vulnerabilities, the title and the details are identical. Vulnerability Score The vulnerability score is the severity level of the vulnerability expressed as a number between 0 and 10. The score of a vulnerability is calculated by EnterpriseView labs. It is CVSS version 2.0 compliant. For more information, see "Common Vulnerability Scoring System" on page 131. Scores of new vulnerabilities that do not exist in the dictionary are imported from the scanner and are normalized to the EnterpriseView scoring system. CPE (subclass of Vulnerability Dictionary) This class includes information on CPEs that are associated with the vulnerabilities in the vulnerability dictionary. Object Description CPE ID The unique ID of the CPE. CPE Name The name of the CPE is composed of the vendor name, the product name, and the version of the product, in the following format: vendor:product:version. Product (subclass of CPE) This class includes information on products that are included in the CPE definitions, for CPEs that are associated with vulnerabilities in the vulnerability dictionary. User Guide Chapter 8: Dashboards and Reports HP EnterpriseView (2.5) Page 228 of 265
  • 229.
    Object Description Product IDThe unique ID of the product. Product Name The name of the product as it appears in the CPE. Vendor (subclass of Product) This class includes information on vendors that are included in the CPE definitions, for CPEs that are associated with vulnerabilities in the vulnerability dictionary. Object Description Vendor ID The unique ID of the vendor. Vendor Name The name of the vendor as it appears in the CPE. Threat Library The threat library includes predefined threats, common to most organizations, in addition to user- defined threats. Threat Library Settings (subclass of Threat Library) This class includes information on threat library settings that are relevant to all threat scenarios. Probability Ranges (subclass of Threat Library Settings) This class includes color indication for the probability ranges. Object Description Medium Scores within a medium range are displayed in yellow. Scores below the medium range are displayed in green. High Scores within the high range are displayed in red. Risk Score Ranges (subclass of Threat Library Settings) This class includes color indication for the risk score ranges. Object Description Medium Scores within a medium range are displayed in yellow. Scores below the medium range are displayed in green. High Scores within the high range are displayed in red. Impact Area (subclass of Threat Library) The area or areas in the organization that are affected by a threat on an asset. User Guide Chapter 8: Dashboards and Reports HP EnterpriseView (2.5) Page 229 of 265
  • 230.
    Object Description Impact AreaID The unique ID of the impact area. Impact Area Name The name of the impact area. Impact Area Weight A numeric value between 0 and 100. Category (subclass of Threat Library) The category of an actor. Object Description Category ID The unique ID of the category. Category Default Weight A numeric value between 0 and 100. The weight of a category defined on the threat library level. Category Description Category description. Category Name Category name. Actor (subclass of Category) An actor in the threat library. An actor is a potential initiator of a violation of the security requirements (confidentiality, integrity, availability) of an asset in your organization. Object Description Actor ID The unique ID of the actor. Actor Default Weight A numeric value between 0 and 100. The weight of an actor defined on the threat library level. Actor Description Actor description. Actor Name Actor name. Operation (subclass of Actor) An operation in the threat library. An operation is the violation of the security requirements of an asset preformed by an actor. Object Description Operation ID The unique ID of the operation. Operation Description Operation description. User Guide Chapter 8: Dashboards and Reports HP EnterpriseView (2.5) Page 230 of 265
  • 231.
    Object Description Operation NameOperation name. Operation Information Security Threat Type Possible values are Integrity, Confidentiality, or Availability. Overall Score This class includes overall score settings. Overall Score Ranges (subclass of Overall Score) This class includes color indication for the overall score ranges. Object Description Medium Scores within a medium range are displayed in yellow. Scores below the medium range are displayed in green. High Scores within the high range are displayed in red. Overall Score Weights (subclass of Overall Score) This class includes the weights for all the factors used to calculate the overall asset score. This value can be edited in Settings > Executive View > Overall Score formula Weights. Object Description Risk Weight The weight applied to an asset's aggregate risk score when calculating the asset's overall score. Compliance Weight The weight applied to an asset's aggregate compliance score when calculating the asset's overall score. Maturity Weight The weight applied to an asset's aggregate control maturity score when calculating the asset's overall score. Vulnerability Weight The weight applied to an asset's aggregate vulnerability score when calculating the asset's overall score. External Risk Factor Weights (subclass of Overall Score Weights) This class includes the weights for all the external risk factors used to calculate the overall asset score . This value can be edited in Settings > Executive View > Overall Score formula Weights Object Description External Risk Factor ID The unique ID of the external risk factor. External Risk Factor Weight The weight applied to an asset's aggregate external risk factor score when calculating the asset's overall score. User Guide Chapter 8: Dashboards and Reports HP EnterpriseView (2.5) Page 231 of 265
  • 232.
    External Risk Factors Generalinformation about the external risk factors and settings. External Risk Factor (Subclass of External Risk Factors) Information about an external risk factor. Object Description External Risk Factor ID The unique ID of the external risk factor. External Risk Factor Name The name of the external risk factor as defined in EnterpriseView. External Risk Factor Description The description of the external risk factor as defined in EnterpriseView. External Risk Factor Date The timestamp of the import job. External Risk Factor KPI ID The unique ID of the KPI of the external risk factor. External Risk Factor Ranges (Subclass of External Risk Factors) This class includes external risk factor settings. Object Description Medium Scores within a medium range are displayed in yellow. Score below the medium range are displayed in green or red, depending on the directionality of the severity. High Scores within the high range are displayed in red or green, depending on the directionality of the severity. Minimum The first number in the score range. Maximum The last number in the score range. Precision The number of digits after the decimal point that you want to display. Limited to five digits. Lower score is best The directionality of the score severity. For example, a low score is considered low risk while a high score is considered high risk. Workflow This class includes information on workflow templates and tasks. Object Description Workflow ID The unique ID of the workflow. Workflow Name The name of the workflow. User Guide Chapter 8: Dashboards and Reports HP EnterpriseView (2.5) Page 232 of 265
  • 233.
    Object Description Workflow DescriptionThe description of the workflow. Workflow Owner The person responsible for managing the workflow. Workflow Start Date The date on which the workflow was created. The status of the workflow is In Progress. End Date The date on which the workflow is actually completed, meaning that the last task in the workflow has been completed. Due Date The expected completion date of the workflow. Workflow Status Either In Progress or Completed. Workflow Due Date Status Returns the following values: Overdue, Approaching, Future Template (Subclass of Workflow) This class includes information on templates Object Description Template ID The unique ID of the template. Template Name The name of the template. Task (Subclass of Workflow) This class includes information on tasks. Object Description Task ID The unique ID of the task. Task Name The name of the task. Task Description Includes the instructions for carrying out the task. Task Start Date The date on which the task status is changed from Inactive to In Progress. Task Due Date The date on which the task is due and should be completed. Task End Date The date on which the task is actually completed. Task Assignee The person responsible for carrying out the task. Task Group The group of users to which the task belongs. User Guide Chapter 8: Dashboards and Reports HP EnterpriseView (2.5) Page 233 of 265
  • 234.
    Object Description Task StatusOne of the following values:  l Inactive: The status of a task that is not active after a workflow has been created. At this stage, the task is not available to the assignee. Inactive tasks are accessible only from the Task Management page, but are not displayed in My Tasks. l In Progress: A task receives this status only after its preceding task is completed. If there is more than one task before it, then at least one of the preceding tasks must be completed. Tasks that are in progress are displayed in My Tasks displayed in the Home page and in the My Tasks dialog box accessible from the EnterpriseView toolbar. These tasks need to be carried out by an assignee. l Completed: The task status is automatically updated to Completed after the user selects the Complete Task check box or the Reject or Approve options (for approval tasks) and clicks Save. Comments (Subclass of Task) This class includes information on comments. Object Description Comment ID The unique ID of the comment. Comment Text The comment text. Comment Author The name of the user who created the comment. Comment Date The date on which the comment was created. KPIs This class includes properties of key performance indicators (KPIs). Object Description KPI ID The unique ID of the KPI. KPI Name The display name of the KPI. This name is displayed as the title in the KPI component. The KPI name is defined in the KPI Management page. User Guide Chapter 8: Dashboards and Reports HP EnterpriseView (2.5) Page 234 of 265
  • 235.
    Object Description KPI Description Thedescription of the KPI is displayed in the KPI component. The KPI parameter can be embedded in the KPI description. The KPI name is defined in the KPI Management page. KPI High Threshold A KPI score percentage within the high range is displayed in red. KPI Medium Threshold A KPI score percentage within a medium range is displayed in yellow. A KPI score percentage below the medium range is displayed in green. KPI Lower is Better The directionality of the score severity. For example, a low score is considered low risk while a high score is considered high risk. KPI Parameter The KPI Parameter is a threshold that indicates a desirable or an undesirable result. For example, in a KPI that displays the percentage of assets with an overall score higher than 20, then “20” is the KPI Parameter. In this case, scores that are higher than 20 are not desirable. Generic Prompts This class can be used to easily create a query filter without inputting the prompt value. Object Description @KPIPrompt Can be used to create a query filter without the need to input the value "kpiId". @CPEPrompt Can be used to create a query filter without the need to input the value "cpeId". @AssetPrompt Can be used to create a query filter without the need to input the value "assetId". @PolicyPrompt Can be used to create a query filter without the need to input the value "policyId". @RiskFactorPrompt Can be used to create a query filter without the need to input the value "riskFactorId". Generic Objects This class includes miscellaneous classes and objects. Object Description Current Time The date that the report is generated. Aggregate Functions (subclass of Generic Objects) This class includes objects that are used to count entities (such as assets). Using these objects for User Guide Chapter 8: Dashboards and Reports HP EnterpriseView (2.5) Page 235 of 265
  • 236.
    counting entities helpsreduce performance problems. These objects can be used only within a query. For example, you can create a query that counts all the assets with asset type IP, but you cannot use these objects to count all the assets in the system. Object Description Count(*) Counts records in a table. Count(Distinct Asset ID) Counts asset IDs. This means that if two records have the same asset ID, then they will count as one. This object only works when you query a table that has an Asset ID field. Score Severity (subclass of Generic Objects) This class includes the values for score severity. Object Description Score Severity Displays one of the following values: Low, Medium, or High. Scores Rank (subclass of Generic Objects) The objects in this class are used to rank asset scores using a weighted average in order to display "top #" assets in reports. The rank itself is not displayed in the report. Object Description Asset Risk Score Rank Used for ranking risk scores. Aggregated Asset Risk Score Rank Used for ranking aggregate risk scores. Aggregated Asset Vulnerability Score Rank Used for ranking aggregate vulnerability scores. Asset Compliance Score Rank Used for ranking compliance scores. Asset Maturity Score Rank Used for ranking P5 maturity factor scores. Overall Asset Score Rank Used for ranking the overall asset score. Asset Vulnerability Score Rank Used for ranking the direct asset vulnerability scores. Vulnerability Score Rank Used for ranking the vulnerability scores. Aggregated External Risk Factor Score Rank Used for ranking the aggregate external risk factor scores. User Guide Chapter 8: Dashboards and Reports HP EnterpriseView (2.5) Page 236 of 265
  • 237.
    P5 Names (subclassof Generic Objects) Use the objects in this class to return the names of the P5 maturity factors to be displayed in a report. Object Description People Indicates that the maturity factor name "People" should be displayed in the report. Procedure Indicates that the maturity factor name "Procedure" should be displayed in the report. Process Indicates that the maturity factor name "Process" should be displayed in the report. Product Indicates that the maturity factor name "Product" should be displayed in the report. Proof Indicates that the maturity factor name "Proof" should be displayed in the report. Risk Status (subclass of Generic Objects) This object returns all the risk statuses. Object Description Risk Status Returns the following values: Associated to Asset, Assessed, Treatment in Progress, Treatment Completed. Workflow Status (subclass of Generic Objects) This object returns all the workflow due date status. Object Description Workflow Due Date Status Returns the following values: Overdue, Approaching, Future. User Guide Chapter 8: Dashboards and Reports HP EnterpriseView (2.5) Page 237 of 265
  • 238.
    Chapter 9: TaskManagement A workflow is a sequence of connected tasks that produce a final outcome. Tasks are consecutive, creating a flow in the work process. Each task in the workflow belongs to a group and is assigned to the individual who is most suitable to perform the task. After a task is complete, the next task becomes available to the responsible group or individual. For more information on managing tasks, see "Manage Your Tasks" on page 248. The Workflow module enables managers to oversee, approve, and follow up on tasks that were not completed. EnterpriseView provides you with a graphic display of each workflow. The status and due date of each task are visible on the workflow map. Overdue tasks include an explicit indication. Example: Workflows are based on templates. EnterpriseView includes out-of-the-box workflow templates, such as EnterpriseView Vulnerability Assessment for New Asset. You can create additional templates that represent the workflows in your organization. For more information on creating templates, see "Create a Workflow Template" on the next page. You can also edit and delete workflow templates, as described in "Edit a Workflow Template" on page 243 and "Delete a Workflow Template from EnterpriseView" on page 244, respectively. The Workflow module includes filtering capabilities to help you locate your workflows quickly. For more information on filtering, see "Filter Workflows" on page 255. By default, the list is filtered to display only workflows that are in progress. Note: You must be an owner or a stakeholder in order to see a workflow. To edit a workflow you must have Edit Task Management permissions. Only users with a View All Workflows permission (such as Workflow Administrator role) can see and edit all the workflows. Workflows are presented according to the following logic: l Workflows that are in progress are displayed first and workflows that are completed are displayed last. l Out of the workflows that are in progress, the workflows with an earlier due date are displayed first. HP EnterpriseView (2.5) Page 238 of 265
  • 239.
    l Out ofthe workflows that are completed, the workflows with the latest end date are displayed first. Manage Workflow Templates EnterpriseView includes out-of-the-box workflow templates, such as EnterpriseView Vulnerability Assessment for New Asset. You can create additional templates that represent the workflows in your organization. Note: Because every task must be assigned to a group, all the tasks in the out-of-the-box workflow templates are assigned to a group called 'Everyone'. If you are planning to use out-of- the-box workflow templates, we recommend that you assign the appropriate group to each of the tasks. For more information on editing a template, see "Edit a Workflow Template" on page 243. This section includes the following topics: Create a Workflow Template 239 Upload a Workflow Template to EnterpriseView 243 Edit a Workflow Template 243 Delete a Workflow Template from EnterpriseView 244 Create a Workflow Template EnterpriseView includes out-of-the-box workflow templates, such as EnterpriseView Vulnerability Assessment for New Asset. You can create additional templates that represent the workflows in your organization. You can create workflow templates in Activiti Modeler. Note: Activiti Modeler works only with Chrome or Firefox browsers; it does not work with Internet Explorer. Activiti Modeler includes a set of elements (shapes) that are used to create templates. For more information, see "Workflow Template Shape Repository" on page 260. All workflow templates must fulfill the following conditions: l A template must have a name. l A template must begin with a start event. l Each task must have a name. l All tasks must be of type User. User Guide Chapter 9: Task Management HP EnterpriseView (2.5) Page 239 of 265
  • 240.
    l All tasksmust be assigned to an EnterpriseView page. When the task is ready to be carried out by the user, it is displayed on the Home page and on the page assigned to it in the template. l All tasks must be assigned to a group. The following diagram is an example of a workflow template. After you create a template you need to upload it to EnterpriseView in order to use it. For more information, see "Upload a Workflow Template to EnterpriseView" on page 243. To create a workflow template 1. Click Task Management > Workflow Management. 2. In the Workflow Management page, click Manage Templates. 3. In the Manage Templates dialog box, click Template Editor. 4. In Activiti Modeler, click New > Business Process Diagram (BPMN 2.0). 5. In the New Process window, expand the Attributes pane. Note: If required, enable your browser to allow pop-ups. 6. In the Properties pane, under Main Attributes, click in the Name field, and enter a name for the template. Note: The template name must be unique. it cannot contain the following characters: - * % 7. In the New Process window, in the Shape Repository, drag the Start Event to the canvas. 8. To create a task, do the following: User Guide Chapter 9: Task Management HP EnterpriseView (2.5) Page 240 of 265
  • 241.
    a. From theShape Repository, drag a Sequence Flow to the canvas and attach it to the shape before it. b. From the Shape Repository, drag a User Task to the canvas and attach it to the Sequence Flow. c. In the Name field, enter a name. The name of the task should be short and should reflect the main idea of the task. d. In the Documentation field, enter a detailed description of the task. This information is displayed in Description in the task properties. 9. To assign an EnterpriseView page to the task, do the following: a. Under More Attributes, click in the Properties field, in the Value column. b. On the Editor for a Complex Type dialog box, click Add. c. In the Name field, enter page=n, where n is the page ID. For example, if you want to assign the task to the Vulnerability Management page, enter page=4 (case-sensitive). For the list of page IDs, see "EnterpriseView Page IDs" on page 259. d. Click OK. 10. To assign the task to a group, do the following: a. Under More Attributes, click the Value cell next to Resources, and then click the ellipses button. b. On the Editor for a Complex Type dialog box, do the following: o Click Add. o In the Type box, select PotentialOwner. o In the Resource assignment expression box, from the list of groups, select the group to which you want to assign this task. o Click OK. 11. Repeat steps 8-11 for each task in the workflow. 12. To create an approval task, follow the instruction in "To create an approval task" on the next page. 13. Add an end event or end events to your template (optional). The end event indicates that there are no more tasks. To add an end event, after you have added all the required tasks, click on the task in the canvas that does not have any tasks after it, and then, from the floating toolbar, click the End Event button. User Guide Chapter 9: Task Management HP EnterpriseView (2.5) Page 241 of 265
  • 242.
    14. To validatethe template, click the Check Syntax button. If the template has errors, then a red cross is displayed next to the problematic area. Hover over the cross icon to see the error message. 15. Click Save. 16. On the Save dialog box, in the Title box, enter the file name for the template, and then click Save. The file name that you enter is the name that will be displayed when you upload the template into EnterpriseView. Note: A template name cannot be more than 200 characters and cannot contain any of the following characters: * _ % To create an approval task Note: You can create more than one approval task in a workflow template. 1. Create a user task, as described in the previous procedure, and give it a meaningful name. For example, "Approve Audit". 2. Click the approval task in the canvas, and then click the Data-based exclusive (XOR) gateway button. 3. From the gateway, create two outbound sequence flows: n In case of approval: One leading to the next task in the flow. n In case of rejection: The second leading to a different task, for example, a task that needs to be redone. 4. Click the sequence flow that represents the approved flow, and then do the following: a. In the Properties pane, expand More Attributes. b. Invent a variable name to use for this specific approval task. The variable must be alphanumeric. You must use the same variable for the approval flow and for the rejection flow. The rejection flow variable is precedes by an !. Note: You cannot use this variable for another approval task; each approval task must have a unique variable. c. Click in the Condition expression field, and enter ${<variable>}. 5. Click the sequence flow that represents the rejection flow, and then do the following: User Guide Chapter 9: Task Management HP EnterpriseView (2.5) Page 242 of 265
  • 243.
    a. In theProperties pane, expand More Attributes. b. Click in the Condition expression field, and enter ${!<variable>}. Upload a Workflow Template to EnterpriseView You can upload a template created in Activiti Modeler to EnterpriseView. For more information on creating a template, see "Create a Workflow Template" on page 239. Note: Before you begin working with a template, you must first validate that it works properly. After you upload the template, test the template by creating a workflow that is based on it. Perform all possible workflow scenarios from start to finish in order to verify the template validity. To upload a template 1. Click Task Management > Workflow Management. 2. In the Workflow Management window, click Manage Templates. 3. In the Manage Workflow Templates dialog box, click Upload Template. 4. In the Upload Template dialog box, select the file of the template that you want to upload, and then click Upload. EnterpriseView validates the template. If the template is not valid, a message is displayed indicating the problem. To create a valid template, see "Create a Workflow Template" on page 239. The template is added to the list of templates displayed in the Manage Workflow Templates dialog box. 5. In the Manage Workflow Templates dialog box, click Close. Edit a Workflow Template Editing a workflow template means changing a template in Activiti Modeler, saving it under the same file name, and reloading it to EnterpriseView. If you created a workflow and then changed the template, the workflow that is based on the previous version does not change. To edit a workflow 1. Click Task Management > Workflow Management. User Guide Chapter 9: Task Management HP EnterpriseView (2.5) Page 243 of 265
  • 244.
    2. In theWorkflow Management page, click Manage Templates. 3. In the Manage Templates dialog box, click Template Editor. 4. In the Activiti Modeler workspace, click the template that you want to edit. 5. Make the required changes and save the template. For more information on how to edit the template, see "Create a Workflow Template" on page 239. Note: EnterpriseView recognizes the template by its name and not by its file name. If you change the template name, then it will no longer be considered the same template in EnterpriseView. When you edit a template, we recommend saving it under the same file name. 6. Upload the updated template to EnterpriseView. For more information, see "Upload a Workflow Template to EnterpriseView" on the previous page. Delete a Workflow Template from EnterpriseView You can delete a template from EnterpriseView as long as there are no workflows based on that template. To delete a template 1. Click Task Management > Workflow Management. 2. In the Workflow Management window, click Manage Templates. 3. Select the template from the list, and then click Delete Template. You can reload the template at any time, as described in "Upload a Workflow Template to EnterpriseView" on the previous page Manage Workflows You can manage workflows in the Workflow Management window. The workflow life cycle consists of two modes: In Progress and Completed. When they are created, their status is In Progress and after the last active task in the workflow is completed, their status changes to Completed. Each workflow has an owner, but any user with suitable permissions can create, edit, or delete workflows. For more information on how to create, edit, or delete a workflow, see "Create a New Workflow" on the next page, "Edit Workflow Properties" on page 247, and "Delete a Workflow" on page 246, respectively. User Guide Chapter 9: Task Management HP EnterpriseView (2.5) Page 244 of 265
  • 245.
    The following figureis an example of a simple workflow created from one of the out-of-the-box templates (EnterpriseView Policy Review) included in EnterpriseView. This workflow includes an approval task, meaning that the tasks performed prior to the approval task, must be approved by a designated user. In this case, the workflow is rejected. This means that a new Review Policy task is created. The cascading task shape in the workflow map indicates that there is more than one Review Policy task. Multiple tasks include the following logic: l The number at the bottom indicates that one task is in progress. In case of multiple tasks, if there is at least one task with an in progress status, then the In Progress icon is displayed. l The due date displayed is the earliest due date of all tasks that are in progress. If all of the tasks are completed, then the latest due date is displayed. Create a New Workflow You can create a workflow based on the templates in EnterpriseView (user-defined or out-of-the- box). Workflow tasks belong to groups. After a workflow is created, the first task in the workflow can be assigned to a user or claimed by a user. To create a workflow 1. Click Task Management > Workflow Management. 2. In the Workflow Management window, click New. 3. In the New Workflow dialog box, select a template from the list. 4. Enter the following information: User Guide Chapter 9: Task Management HP EnterpriseView (2.5) Page 245 of 265
  • 246.
    n Name: Entera meaningful name for the workflow. The name of the workflow must be unique. Note: A workflow name cannot contain any of the following characters: * _ % n Owner: Select an owner for the workflow. n Due Date: Select the date on which the workflow should be complete. n Description (optional): Enter additional information. 5. Click Save. The workflow is created with the status In Progress. It is displayed in the Workflows list in the left pane of the Workflow Management window and the workflow diagram in the map area. The first task or tasks are in status In Progress and all the other tasks are in status Inactive. The first task or tasks are displayed in My Tasks for all users that belong to the group to which the task is assigned. 6. In the Properties pane, under Workflow, click the Stakeholders tab, and then do the following: a. In the search box, enter the name or a partial name of the user or the group that you want to add as a stakeholder in this workflow. b. Click Add. 7. Enter task information (optional). Click the task in the map area, and then, in the Properties pane, do the following: a. In the Assigned To box, enter the user name of the person responsible for carrying out the task. b. In the Due Date box, enter a due date for the task. c. In the Description box, if required, edit the description. d. Click Save. Repeat this process for each task, as required. Delete a Workflow You can delete a workflow that is in progress. When you delete a workflow you delete all of its related tasks. You cannot delete a workflow that is completed. User Guide Chapter 9: Task Management HP EnterpriseView (2.5) Page 246 of 265
  • 247.
    To delete aworkflow 1. Click Task Management > Workflow Management. 2. In the Workflow Management window, from the Workflows list in the left pane, click the workflow that you want to delete. 3. Click the Delete button. The workflow is removed from the list. All related tasks are deleted. Edit Workflow Properties You can edit the workflow properties when the workflow is in progress. After you complete a workflow, you cannot edit any of its properties or its task properties. To edit workflow properties 1. Click Task Management > Workflow Management. 2. In the Workflow Management window, from the Workflows list in the left pane, click the workflow that you want to edit. 3. In the Properties pane, make the necessary changes, and then click Save. For information on workflow properties, see "Workflow Properties" on page 250. Change the Task Group The group to which the task belongs to is defined when the workflow template is created. The task group can be changed as long as the task is not completed. To change the task group 1. Click Task Management > Workflow Management. Note: You can also change the group from My Tasks. 2. In the Workflow Management window, from the Workflows list in the left pane, click the workflow that you want to modify. 3. In the workflow graph, click the task that you want to modify. 4. In the Properties pane, in the Group box, enter a new group name. User Guide Chapter 9: Task Management HP EnterpriseView (2.5) Page 247 of 265
  • 248.
    Note: If therewas an assignee for this task, it is deleted. 5. Click Save. Manage Your Tasks The Task List pane on the EnterpriseView home page displays the following tasks: l Tasks that are assigned to you. l Tasks that are assigned to the group that you belong to but are not assigned to a specific user. This includes groups that you belong to directly as well as indirectly (a group within a group). These tasks have the The task belongs to a group icon next to them. Unless you have suitable permissions, you cannot see tasks that do not belong to your group. The tasks that are displayed are ready to be carried out, which means that they have the status In Progress. Inactive tasks are not displayed in the Task List because they are not yet available to users. After they are activated, meaning that their status is In Progress, they are displayed in the Task List. Completed tasks can only be viewed from the Workflow Management window. For more information, see "Workflow Management Window" on page 253. You can access tasks in one of the following ways: l You can access the page on which you need to perform a task directly from the Task List pane on the home page, by clicking the page name link. To refresh the tasks that are displayed in My Tasks, click the Refresh button. l You can access your tasks by clicking the My Tasks button on the EnterpriseView toolbar. Accessing your tasks from the My Tasks button on the toolbar while you are on the home page, displays the same list of tasks as in the My Tasks pane. If you click the My Tasks button from the toolbar while any other page is open, then only the tasks that are relevant to that page are displayed. A task can be assigned to you in one of the following ways: l You claim the task. You can claim a task from the My Tasks dialog box. After you claim a task, the other users in your group will no longer see it in their task list. l Another user assigns the task to you. User Guide Chapter 9: Task Management HP EnterpriseView (2.5) Page 248 of 265
  • 249.
    A task canbe assigned to you by your manager or by the workflow owner. It can also be reassigned to you by a user that belongs to the same group to which you belong. If you are assigned a task, then you can see its workflow from My Tasks even if you are not a workflow owner or stakeholder. You cannot, however, see the workflow of the task in the Workflow Management page. You can release a task back to the group's task pool, which means that it is no longer assigned to you and can be claimed by any other user in your group. The following procedures describe how to manage your tasks. To claim a task 1. Click the My Tasks button on the toolbar. 2. In the left pane, from the list of tasks, click the task that you want to claim. Tasks that have the The task belongs to a group icon next to them are not yet assigned to you. 3. In the right pane, next to the Assigned To box, click the Claim Task button. 4. In the Add Comment box, enter information pertaining to the task, and then click Save. To complete a task 1. After you successfully performed your task, click the My Tasks button on the toolbar. 2. In the left pane, from the list of tasks, click the task that you want to complete. 3. To complete the task, do one of the following: n Select the Complete Task checkbox. n If this is an approval task, select either Approve or Reject. 4. In the Add Comment box, enter information pertaining to the task, and then click Save. The task is removed from your task list. To release a task 1. Click the My Tasks button on the toolbar. 2. In the left pane, from the list of tasks, click the task that you want to release. User Guide Chapter 9: Task Management HP EnterpriseView (2.5) Page 249 of 265
  • 250.
    3. In theright pane, next to the Assigned To box, click the Release Task button. 4. In the Add Comment box, enter information pertaining to the task, and then click Save. To reassign a task 1. Click the My Tasks button on the toolbar. 2. In the left pane, from the list of tasks, click the task that you want to reassign. 3. In the Assigned To box, enter the name of the user to which you want to assign the task. 4. In the Add Comment box, enter information pertaining to the task, and then click Save. Workflow Properties The following table describes all the workflow properties. Property Description Name The name of the workflow must be unique. You can change the name of a workflow when it is in progress. After it is completed, the name cannot be changed. Template The template on which the workflow is based. For more information, see "Manage Workflow Templates" on page 239. You cannot change the template of a workflow. Owner The person or group responsible for managing the workflow. The owner of the workflow can be changed as long as the workflow is not completed. Due Date The expected completion date of the workflow. The due date is the date on which the workflow is expected to be completed. It is configured when you create a workflow. The due date is displayed for workflows that are in progress. If the due date of the last task is later than the workflow due date, it means that the workflow is past its due date. The following indication is displayed: Task exceeds workflow due date. User Guide Chapter 9: Task Management HP EnterpriseView (2.5) Page 250 of 265
  • 251.
    Property Description End DateThe actual completion date of the workflow. The date on which the workflow is actually completed, meaning that the last task in the workflow has been completed. The end date is displayed for workflows that have a Completed status. Last Task Due Date The due date of the last task in the workflow. This date serves as a threshold indicating whether the workflow due date is on schedule or at risk of not being met. Description A general description of the workflow. Status l In Progress: The status of a workflow after it is created. Users have started working on their tasks. l Completed: The status of a workflow after all its tasks have been completed. Task Properties The following table describes all the task properties. Note: l You cannot edit task properties that are defined in the workflow template. l You cannot edit task properties after the task is completed. Property Description Page The page that the task is related to as defined in the template. When creating a template, the user must assign the task to a specific page in EnterpriseView. For more information, see "Create a Workflow Template" on page 239. ID A task identifier used mainly to distinguish between task instances. Name The name of the task as defined in the template. User Guide Chapter 9: Task Management HP EnterpriseView (2.5) Page 251 of 265
  • 252.
    Property Description Description Ageneral description of the task defined in the template. The description originates from the Documentation field in the Activiti Modeler. You can edit the description as long as the task is not completed or belongs to a completed workflow. Status The status of the task:  l Inactive : The status of a task that is not active after a workflow has been created. At this stage, the task is not available to the assignee. Inactive tasks are accessible only from the Task Management page, but are not displayed in My Tasks. l In Progress : A task receives this status only after its preceding task is completed. If there is more than one task before it, then at least one of the preceding tasks must be complete. Tasks that are in progress are displayed in My Tasks displayed in the Home page and in the My Tasks dialog box accessible from the EnterpriseView toolbar. These tasks need to be carried out by an assignee. l Completed : The task status is automatically updated to Completed after the user selects the Complete Task check box or the Reject or Approve options (for approval tasks) and clicks Save. Group The group to which the task is assigned. Assigned To The user (assignee) to which the task is assigned. The assignee is responsible for carrying out the task. The assignee must belong to the group to which the task is assigned, or to any group within that group. User Guide Chapter 9: Task Management HP EnterpriseView (2.5) Page 252 of 265
  • 253.
    Property Description Due DateThe expected completion date of the task. Tasks in the workflow graph in the Workflow Management window includes the following indicators: l Past the due date. This indicator is displayed after the due date passes, meaning on the day after the due date. l Approaching the due date. This indicator is displayed on the day before the due date and until the due date is passed. Reference Enter information pertaining to an external system. For example, a ticket ID from a ticketing system. Complete Task Select this check box if you want to mark the task as completed, and then click Save. The status of the task is changed to Completed and cannot be changed back to In Progress. Approve/Reject Displayed for approval tasks. Select one of the options to approve or reject the tasks in the workflow, and then click Save. If you approve, then the workflow proceeds to the following task. If you reject, then the workflow proceeds to a different task. Add Comment Comments are shared by all the tasks that are related to a specific workflow. Both the owner and the various task assignees can enter a comment. Use comments to communicate with your colleagues, convey information, and mitigate problems related to the workflow. When you enter a comment and click Save, all users related to the specific workflow can view your comment. This field is mandatory. Workflow Management Window The Workflow Management window enables you manage workflows and workflow templates. For more information, see "Task Management" on page 238. The different areas and the functionalities available in each area are described in the following sections. For information on the EnterpriseView toolbar, see "Toolbar Description" on page 17. User Guide Chapter 9: Task Management HP EnterpriseView (2.5) Page 253 of 265
  • 254.
    Toolbar UI Element Description Manage TemplatesClick this button to open the Manage Workflow Templates dialog box. The Manage Workflow Templates dialog box includes all the actions that are related to template:  l Upload template. For more information, see "Upload a Workflow Template to EnterpriseView" on page 243. l View template. Click the template name to display the workflow graph on the map. You can reset the layout, zoom in/out, or navigate the mini-map to better display the template. l Delete template. For more information, see "Delete a Workflow Template from EnterpriseView" on page 244. Left Pane The left pane displays all the workflows that are in the system. Completed workflows are displayed at the bottom of the list. Workflows in progress are sorted by due date; the workflow with the earliest due date is displayed first. User Guide Chapter 9: Task Management HP EnterpriseView (2.5) Page 254 of 265
  • 255.
    UI Element Description New Createa New Workflow Click this button to create a new workflow. For more information, see "Create a New Workflow" on page 245. Filter Workflows Click this button to open the Filter Workflows dialog box. You can filter the workflows that are displayed in the left pane by template name, workflow name, owner, and status. To remove a filter, you can either open the Filter Workflows dialog box and change the filter, or you can click the Clear Filter button. By default, the list is filtered to display only workflows that are in progress. Clear Filter Click this button to clear all the filters that you set through the Filter Workflows dialog box. Delete Click this button to delete the workflow. All related tasks are deleted regardless of their status. you cannot delete a workflow that has been completed. For more information, see "Delete a Workflow" on page 246. <Status> One of the following values is displayed: l In Progress : The status of a workflow after it is created. Users have started working on their tasks. l Completed : The status of a workflow after all its tasks have been completed. Due Date See "Due Date" on page 250. End Date See "End Date" on page 251. User Guide Chapter 9: Task Management HP EnterpriseView (2.5) Page 255 of 265
  • 256.
    Map Area The maparea includes the workflow graph. UI Element Description Reset Layout Optimizes the workflow graph in the map area. Zoom in/zoom out workflow graph. User Guide Chapter 9: Task Management HP EnterpriseView (2.5) Page 256 of 265
  • 257.
    Properties Pane The Propertiespane displays the properties for the workflow that is selected in the workflow list in the left pane and for the task selected in the map area. The properties are displayed in two sections: Workflow To open the workflow properties, click Workflow. Details Tab This tab includes the workflow properties. For more information, see "Workflow Properties" on page 250. Attachments Tab UI Element Description Upload Click this button to attach a file to this workflow. The maximum file size is 5.00 MB. User Guide Chapter 9: Task Management HP EnterpriseView (2.5) Page 257 of 265
  • 258.
    UI Element Description Delete Todelete a file from this workflow, click the file that you want to delete, and then click this button. Download To download a file to your local computer, click the file that you want to download, and then click this button. Stakeholders This tab includes a list of users and groups that have an interest in the workflow. A stakeholder can be any person who's role is connected to the workflow, but is not the owner of the workflow. Stakeholders receive the same email notifications that the workflow owner receives. For more information on email notifications, see the Email Notifications section in the HP EnterpriseView Administration Guide. For example, if the workflow owner's manager is a stakeholder, then the manager will receive a notification when the workflow is overdue or completed. The list of stakeholders can be edited as long as the workflow is in progress. The tab displays the number of stakeholders in parenthesis. To add a stakeholder, enter the name of the user or group in the search box, and then click Add. To delete a stakeholder, click the stakeholder in the list, and then click the Delete button. Controls Tab This tab is displayed only if the workflow was triggered by a control action that was created for mitigating a risk. For more information on control actions, see "Control Action" on page 93. It includes the controls that need to be handled in this workflow. These controls need to be applied to an asset or reassessed. Task To open the task properties, click Task. For more information on task properties, see "Task Properties" on page 251. In addition to the task properties, this pane included the following functionality. UI Element Description Next Task This button helps you navigate between tasks of the same type. For example, if a workflow is rejected by the owner, then one or more tasks need to be repeated. In this case, new, duplicate tasks are created for each task that was rejected. You can navigate between these tasks by using this button. Previous Task See "Next Task" above. Save Save the changes that you made to the task properties. Cancel Cancel the changes that you made to the task properties. User Guide Chapter 9: Task Management HP EnterpriseView (2.5) Page 258 of 265
  • 259.
    Mini-map When the workflowis too large to be entirely displayed in the map area, you can navigate it by dragging in the mini-map area. To expand or collapse the mini-map, click the Expand/Collapse button. EnterpriseView Page IDs Page IDs are required for creating workflow templates. The following table includes the page IDs for all EnterpriseView pages. Page ID Page Display Name 1 Risk Indicators 2 Threat Library Builder 3 Risk Assessment and Treatment 4 Vulnerability Management 5 Vulnerability Assignment 6 Vulnerability Dictionary 7 Policy Builder 8 Policy Mapping 9 Statement of Applicability 10 Policy and Compliance Assessment 11 Vulnerability to Control Mapping 12 Control to Threat Mapping 13 Asset Profiling 14 Workflow Management 15 Configuration 16 User Management 17 Job Management 18 Audit Log 19 Dashboard Builder 20 Threat Assignment User Guide Chapter 9: Task Management HP EnterpriseView (2.5) Page 259 of 265
  • 260.
    Page ID PageDisplay Name 21 External Risk Factor Management 22 KPI Management Workflow Template Shape Repository You can create workflow templates in Activiti Modeler. For more information on creating templates, see "Create a Workflow Template" on page 239. Activiti Modeler includes a set of elements (shapes) that are used to create templates. The shapes are described in the following table. Icon Name Description Data-based Exclusive (XOR) Gateway When splitting, it routes the sequence flow to exactly one of the outgoing branches, based on conditions. When merging, it awaits one incoming branch to complete before triggering the outgoing flow. Parallel Gateway When used to split the sequence flow, all outgoing branches are activated simultaneously. When merging parallel branches, it waits for all incoming branches to complete before triggering the outgoing flow. Start Event Use this shape to start a workflow. End Event Use this shape to end a workflow. Sequence Flow Use this shape to define the execution order of activities. User Task Use this shape to model work that needs to be done by a human actor. This included approval tasks. User Guide Chapter 9: Task Management HP EnterpriseView (2.5) Page 260 of 265
  • 261.
    Chapter 10: Settings EnterpriseViewincludes a centralized settings module, through which you can configure all internal settings. To access the settings module, on the EnterpriseView toolbar, click the Settings button. When the Settings dialog box opens, it displays one of the following: l Links to every module that has specific settings. This display appears when the EnterpriseView page that is currently open does not have specific settings. Click the module name in order to access the configuration options for that module. Note: You have access only to modules for which you have the required permissions. l The settings for a specific module. This display appears when the EnterpriseView page that is currently open has specific settings. For example, if the Vulnerability Management page is open, when you click the Settings button, then the Settings dialog box opens on the Vulnerabilities page. To return to the Settings main page, click Settings on the title bar. After you make a change in settings, you need to refresh the page in order to apply the changes. The following table includes all the configuration options available through the Settings dialog box, for each module. HP EnterpriseView (2.5) Page 261 of 265
  • 262.
    Module Setting Page ExecutiveView Overall Score Formula For more information, see "Configure Overall Score Formula Weights" on the next page. Overall Score Ranges For more information, see "Configure Asset Overall Score Ranges" on page 264. Criticality Level Ranges For more information, see "Configure Criticality Level Ranges" on page 264. Executive View KPI For more information, see "Overall Score KPI" on page 159. Vulnerabilities Asset Vulnerability Score Aggregation For more information, see "Configure Asset Vulnerability Score Aggregation Parameters" on page 136. Vulnerability KPI For more information, see "Vulnerability Score KPI " on page 160. Vulnerability Ranges For more information, see "Configure Vulnerability Score Ranges" on page 137 Policy and Compliance Compliance KPI For more information, see "Compliance Score KPI" on page 159. Compliance and Maturity Score Ranges For more information, see "Configure Compliance and Maturity Score Ranges" on page 63. Policy Administration For more information, see "Activate a Policy" on page 47. User Guide Chapter 10: Settings HP EnterpriseView (2.5) Page 262 of 265
  • 263.
    Module Setting Page RiskModeling Actor Weights For more information, see "Configure Risk Assessment Settings" on page 107. Impact Area For more information, see "Configure Risk Assessment Settings" on page 107. Risk Score Ranges For more information, see "Configure Risk Score Ranges" on page 109. Risk KPIs For more information, see "Risk Score KPI" on page 160 and "Unassessed Risk KPI" on page 160. Task Management Risk Mitigation Template For more information, see "Configure Risk Mitigation Workflow Templates" on page 265. Task Management KPI For more information, see "Completed Workflows KPI" on page 160. External Risk Factor <External Risk Factor Name> For more information, see the Configure External Risk Factor Ranges section in the HP EnterpriseView Deployment Guide and "Configure External Risk Factor KPI Settings" on page 164. Configure Overall Score Formula Weights The asset overall score reflects the total risk of the asset. It is composed of the weighted average of the aggregate scores of all risk factors. There are five risk factors that are inherent in EnterpriseView, they include: policy compliance, the control maturity, risk, and asset vulnerability. In addition to these factors, any external risk factor that has been defined in EnterpriseView is also included in the asset overall score calculation. For more on external risk factors, see "External Risk Factors" on page 161. Following is the formula for calculating the asset overall score: normalized aggregated risk factor scores weight weights ∑( * ) ∑ Note: For compliance and control maturity, the complementary number to the normalized aggregated risk factor score is used. User Guide Chapter 10: Settings HP EnterpriseView (2.5) Page 263 of 265
  • 264.
    You can editthe weights of each of the variables in the formula. To configure the overall score formula weights: 1. On the EnterpriseView toolbar, click the Settings button. 2. In the Settings dialog box, click Executive View > Overall Score Formula Weights. 3. In the Overall Score Formula Weights page, enter the weight for each variable in the formula. 4. Click Save. Configure Asset Overall Score Ranges You can configure the ranges for the score severity indication for asset overall scores. Asset overall scores are displayed with one of the following icons: Low score Medium score High score This configuration is reflected throughout the application, wherever these scores are displayed. For example, on the Risk Register page, in the Asset Summary component and in the Overall Score Heat Map page. To configure vulnerability score ranges 1. On the EnterpriseView toolbar, click the Settings button. 2. In the Settings dialog box, click Executive View > Overall Score Ranges. 3. Under Overall Score Ranges, drag the slider to define the score ranges. 4. Click Save. Configure Criticality Level Ranges You can configure the ranges for the severity indication for the criticality levels. Severity is indicated by color: l Low = green l Medium = yellow User Guide Chapter 10: Settings HP EnterpriseView (2.5) Page 264 of 265
  • 265.
    l High =red This configuration is reflected in the Overall Score Heat Map. To configure criticality level ranges 1. On the EnterpriseView toolbar, click the Settings button. 2. In the Settings dialog box, click Executive View > Criticality Level Ranges. 3. Under Criticality Level Ranges, drag the slider to define the ranges. 4. Click Save. Configure Risk Mitigation Workflow Templates A mitigation treatment activity can include one or more action plans for reducing risk. You can create the following types of actions: l Control action l Manual action After you create the action, you can create a workflow for carrying out the action plan. EnterpriseView includes a default template for creating a workflow for a manual action, but you can change these settings, as described in the following procedure. Note: You must select a template in order to create a workflow from the action. To configure the template for the treatment action workflow 1. On the EnterpriseView toolbar, click Settings. 2. In the Settings dialog box, click Task Management > Risk Mitigation Templates. 3. From the Template for manual action list, select the template that the workflow is based on when you create a workflow from a manual action. 4. From the Template for control action list, select the template that the workflow is based on when you create a workflow from a control action. 5. Click Save. User Guide Chapter 10: Settings HP EnterpriseView (2.5) Page 265 of 265