Erosion-induced soil toxicity undermined maize-bean responses to sustainable land management practices on Mount Wanale in eastern Uganda
•
0 likes•81 views

Mr Giregon Olupot, School of Agricultural Sciences Makerere University, Uganda. Global Symposium on Soil Erosion (GSER19), 15 - 17 May 2019 at FAO HQ.
Recommended

Recommended
More Related Content
What's hot
What's hot (10)
Similar to Erosion-induced soil toxicity undermined maize-bean responses to sustainable land management practices on Mount Wanale in eastern Uganda
Similar to Erosion-induced soil toxicity undermined maize-bean responses to sustainable land management practices on Mount Wanale in eastern Uganda (20)
More from ExternalEvents
More from ExternalEvents (20)
Recently uploaded
Recently uploaded (20)
Erosion-induced soil toxicity undermined maize-bean responses to sustainable land management practices on Mount Wanale in eastern Uganda
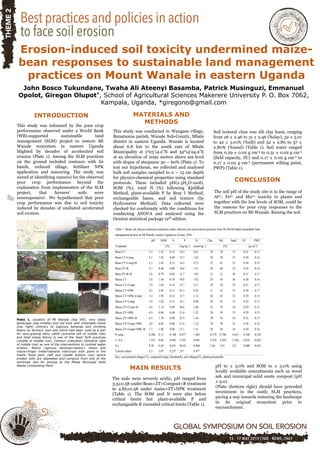
- 1. Erosion-induced soil toxicity undermined maize- bean responses to sustainable land management practices on Mount Wanale in eastern Uganda John Bosco Tukundane, Twaha Ali Ateenyi Basamba, Patrick Musinguzi, Emmanuel Opolot, Giregon Olupot*, School of Agricultural Sciences Makerere University P. O. Box 7062, Kampala, Uganda, *giregono@gmail.com This study was informed by the poor crop performance observed under a World Bank (WB)-supported sustainable land management (SLM) project to restore Mt Wanale ecosystem in eastern Uganda blighted by decades of accelerated soil erosion (Plate 1). Among the SLM practices on the ground included contours with tie bands, reduced tillage, fertiliser NPK application and manuring. The study was aimed at identifying cause(s) for the observed poor crop performance beyond the explanation from implementers of the SLM project, that farmers’ soils were nonresponsive’. We hypothesized that poor crop performance was due to soil toxicity induced by decades of unabated accelerated soil erosion. This study was conducted in Wangasa village, Bunatsoma parish, Wanale Sub-County, Mbale district in eastern Uganda. Wanale is located about 6.8 km to the south east of Mbale Municipality at 1003’14.2”N and 34014’24.9”E at an elevation of 2092 meters above sea level with slopes of steepness 30 – 60% (Plate 1). To test our hypothesis, we collected and analysed bulk soil samples sampled to 0 – 15 cm depth for physico-chemical properties using standard protocols. These included pH(2.5H2O:1soil), SOM (%), total N (%) following Kjeldhal Method, plant-available P by Bray I Method, exchangeable bases, and soil texture (by Hydrometer Method). Data collected were checked for conformity with the conditions for conducting ANOVA and analysed using the Genstat statistical package 12th edition. INTRODUCTION MATERIALS AND METHODS The soil pH of the study site is in the range of Al3+, Fe3+ and Mn2+ toxicity to plants and together with the low levels of SOM, could be the reasons for poor crop responses to the SLM practices on Mt Wanale. Raising the soil CONCLUSION Soil textural class was silt clay loam, ranging from 26 ± 2.46 to 31 ± 2.46 (%clay), 32 ± 5.01 to 42 ± 5.01% (%silt) and 32 ± 2.80 to 37 ± 2.80% (%sand) (Table 1). Soil water ranged from 0.29 ± 0.02 g cm-3 to 0.31 ± 0.02 g cm-3 (field capacity, FC) and 0.17 ± 0.02 g cm-3 to 0.17 ± 0.02 g cm-3 (permanent wilting point, PWP) (Table 1). Plate 1. Location of Mt Wanale (top left), very steep landscape (top middle) and red soils with miserable maize (top right) contrary to vigorous bananas and climbing beans on farmers’ own plot which had been used as a pen for zero-grazing dairy cattle (extreme left of middle row) and total maize failure in one of the ‘best’ SLM practices (middle of middle row). Contour cultivation (extreme right of middle row) as one of the interventions to combat water erosion. Notice vigorous bananas+beans+ maize and maize+finger millet+banana intercrops with yams in the Dokho flood plain (left and middle bottom row) where eroded soils are deposited and compost from one of the windrows due for sieving at the Mbale Municipal Solid Waste Composting Plant. Table 1. Mean soil physico-chemical properties under selected soil conservation practices from the World Bank sustainable land management project on Mt Wanale, eastern Uganda as of June, 2016. pH SOM N P K Clay Silt Sand FC PWP Treatment (%) (mg kg-1 ) (cmol kg-1 ) (%) (g cm-3 ) Bean CT 3.5 1.52 0.12 14.2 0.61 28 39 33 0.31 0.17 Bean CT+Comp 4.1 1.42 0.08 14.7 1.65 29 38 33 0.30 0.16 Bean CT+Comp+R 3.3 1.85 0.13 14.2 0.75 27 41 32 0.30 0.15 Bean ZT+R 3.7 0.40 0.08 18.6 1.51 28 40 32 0.30 0.16 Bean ZT+R+B 3.6 0.79 0.02 12.7 1.05 31 33 36 0.31 0.17 Maize CT 3.8 1.44 0.10 59.8 1.02 29 36 36 0.30 0.16 Maize CT+Comp 3.9 1.69 0.10 13.7 2.11 29 38 33 0.31 0.17 Maize CT+NPK 4.2 2.05 0.11 42.1 0.92 31 32 37 0.30 0.17 Maize CT+NPK+Comp 3.4 1.98 0.14 12.7 1.12 26 41 33 0.29 0.15 Maize ZT+Comp 3.6 1.62 0.13 18.1 0.96 26 42 32 0.29 0.15 Maize ZT+Comp+B 4.6 1.12 0.09 20.6 1.86 27 39 34 0.29 0.15 Maize ZT+NPK 4.9 0.86 0.08 21.6 1.32 28 39 33 0.29 0.15 Maize ZT+NPK+B 4.3 1.78 0.08 25.5 1.44 30 36 34 0.31 0.17 Maize ZT+Comp+NPK 4.9 0.86 0.08 21.6 1.32 28 39 33 0.30 0.16 Maize ZT+Comp+NPK+B 3.7 1.06 0.06 21.1 1.51 28 38 34 0.30 0.16 P-value 0.206 0.51 0.100 0.977 <.001 0.279 0.746 0.815 0.598 0.354 L. S.d 1.197 0.68 0.063 75.05 0.963 5.074 4.929 5.764 0.018 0.025 S.e 0.58 0.69 0.031 36.43 0.468 2.46 5.01 2.8 0.009 0.012 Critical values 5.5 3.0* 0.25* 15* 0.4** Key: conventional tillage(CT), compost(Comp), rhizobia(R), zero tillage(ZT), planting basins(B) The soils were severely acidic, pH ranged from 3.3±0.58 under Bean+ZT+Compost+R treatment to 4.85±0.58 under maize+ZT+NPK treatment (Table 1). The SOM and N were also below critical limits but plant-available P and exchangeable K exceeded critical limits (Table 1). MAIN RESULTS pH to ≥ 5.0% and SOM to ≥ 3.0% using locally available amendments such as wood ash and municipal solid waste compost (pH ≥ 9.0) (Plate 1bottom right) should have preceded investment in the costly SLM practices, paving a way towards restoring the landscape to its original ecosystem prior to encroachment.