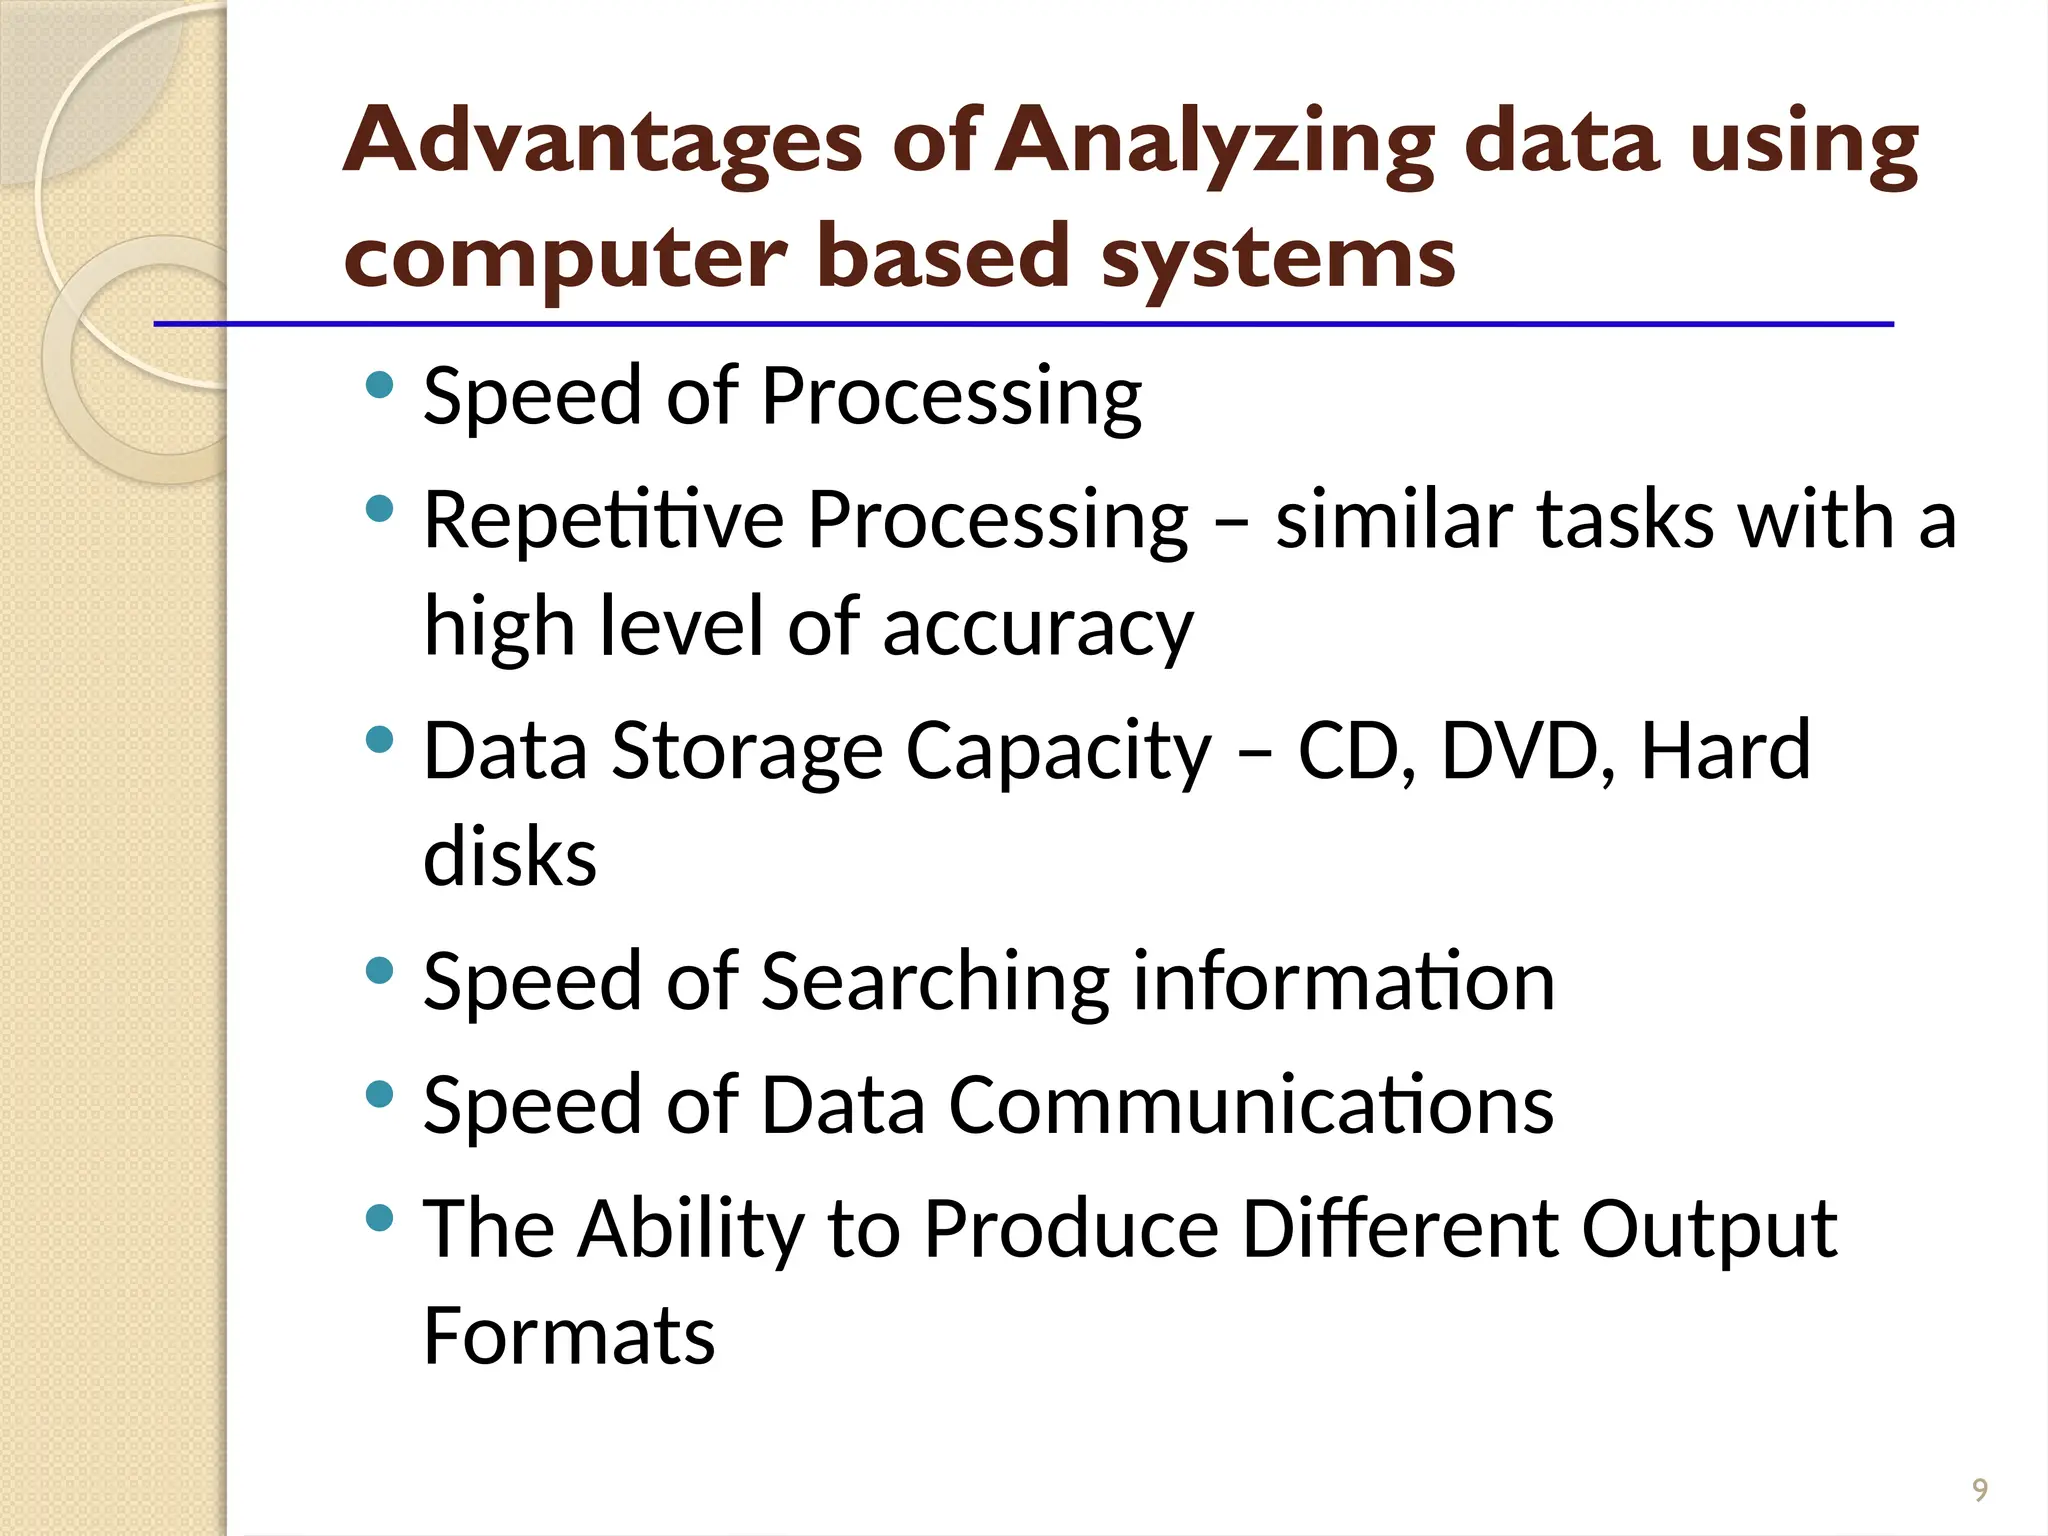
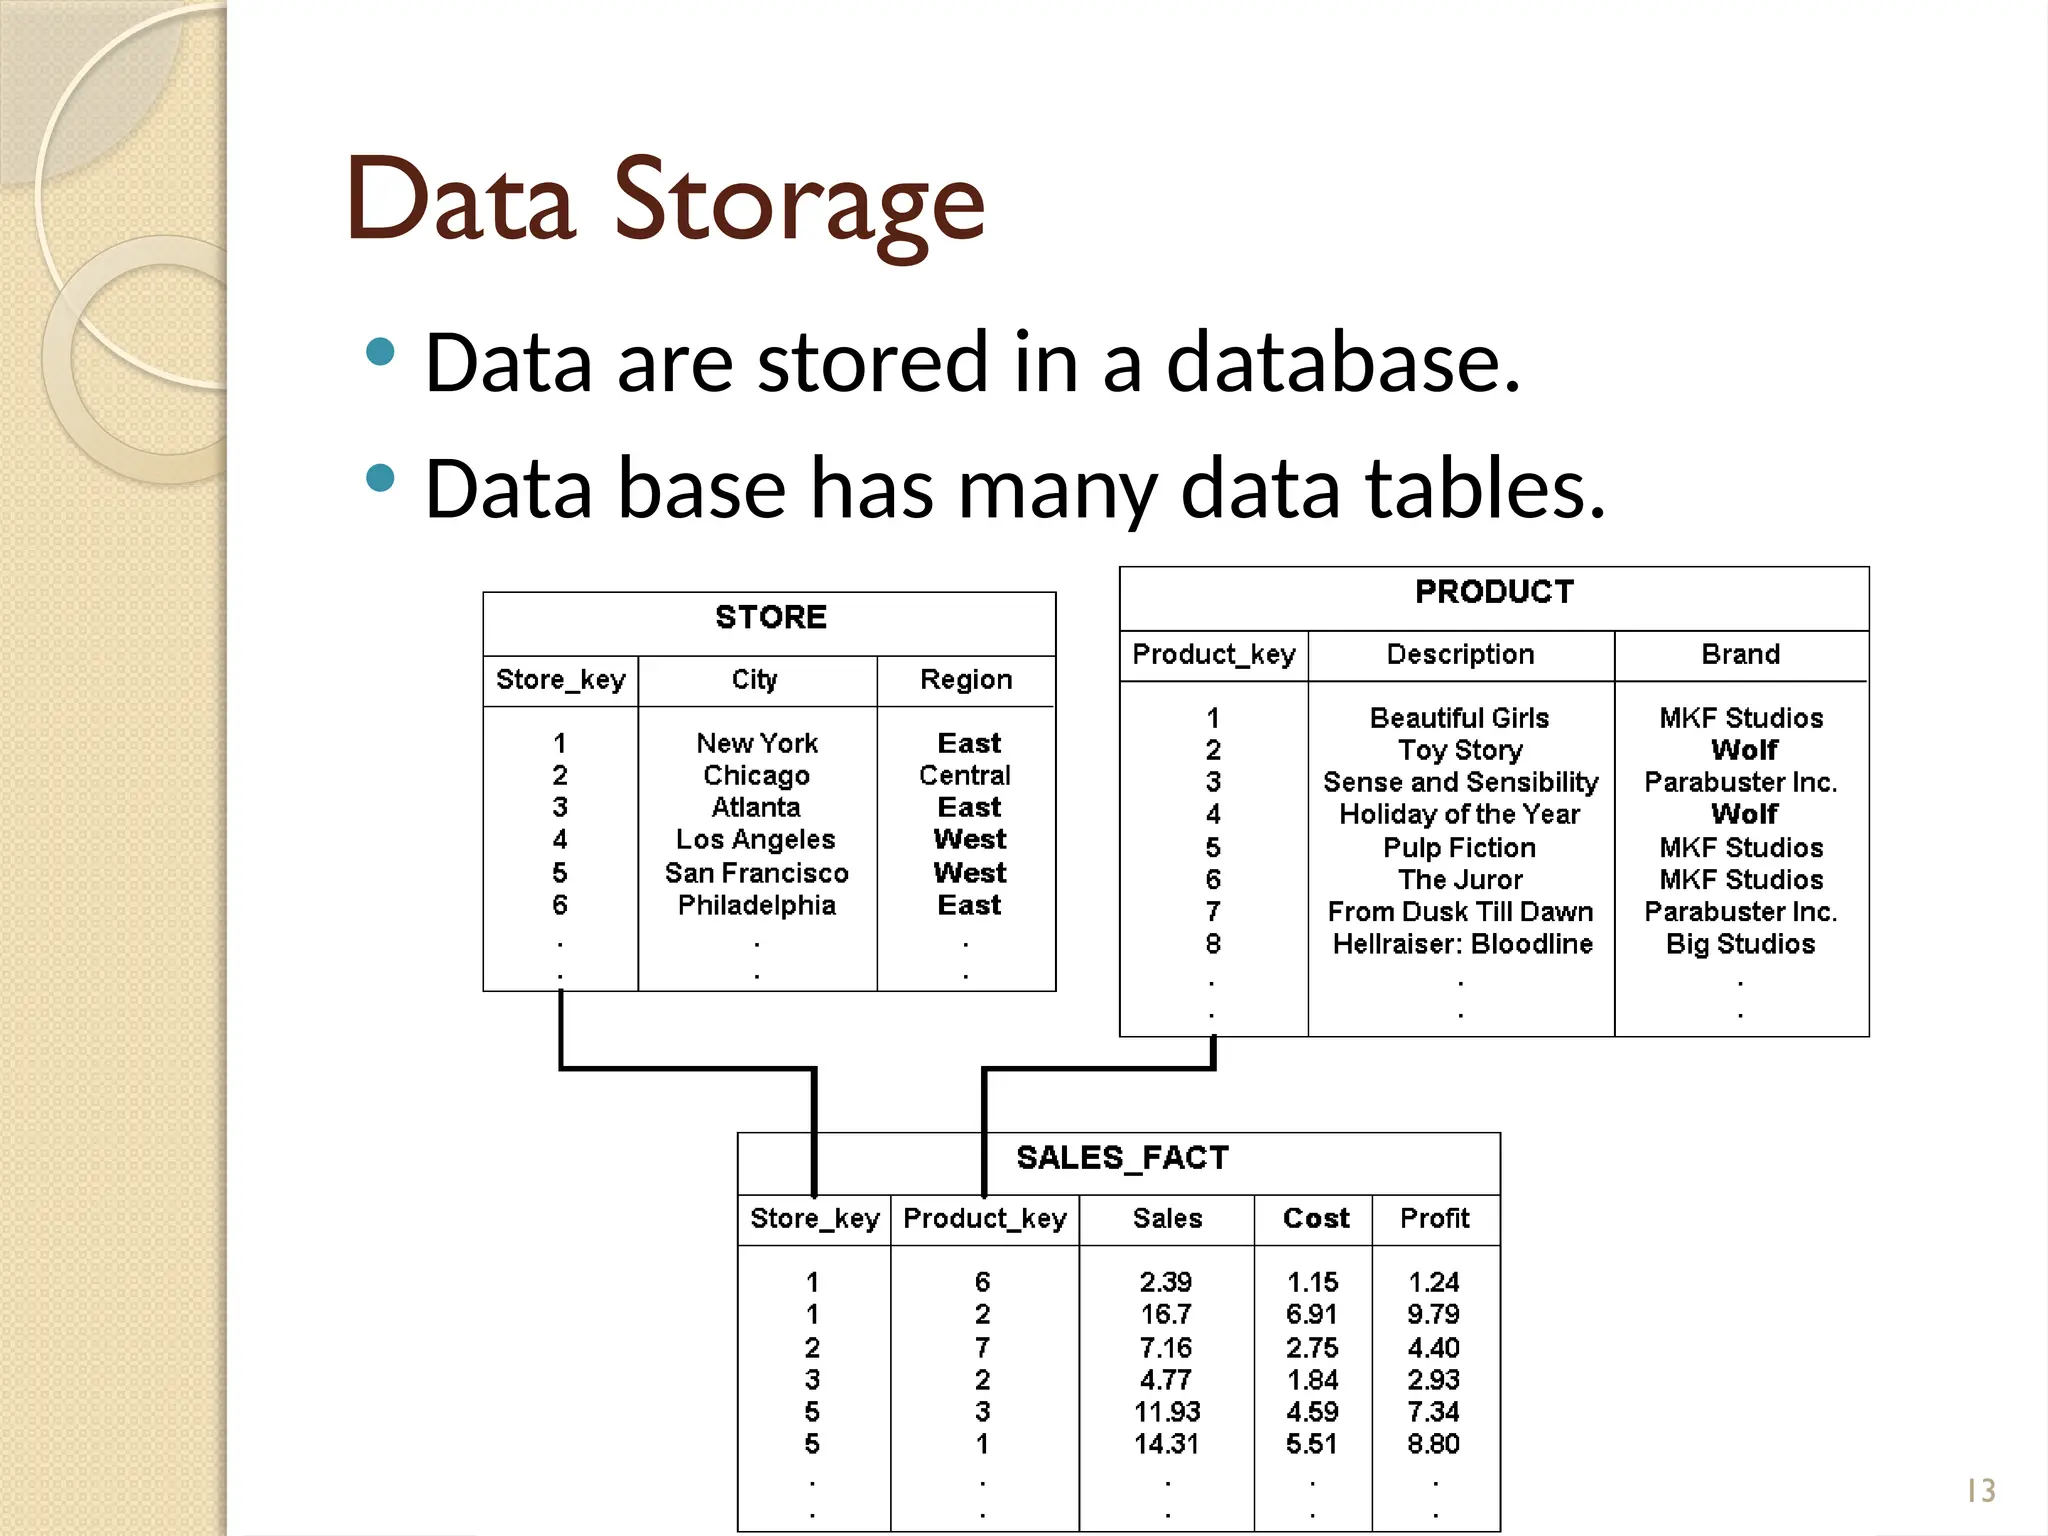
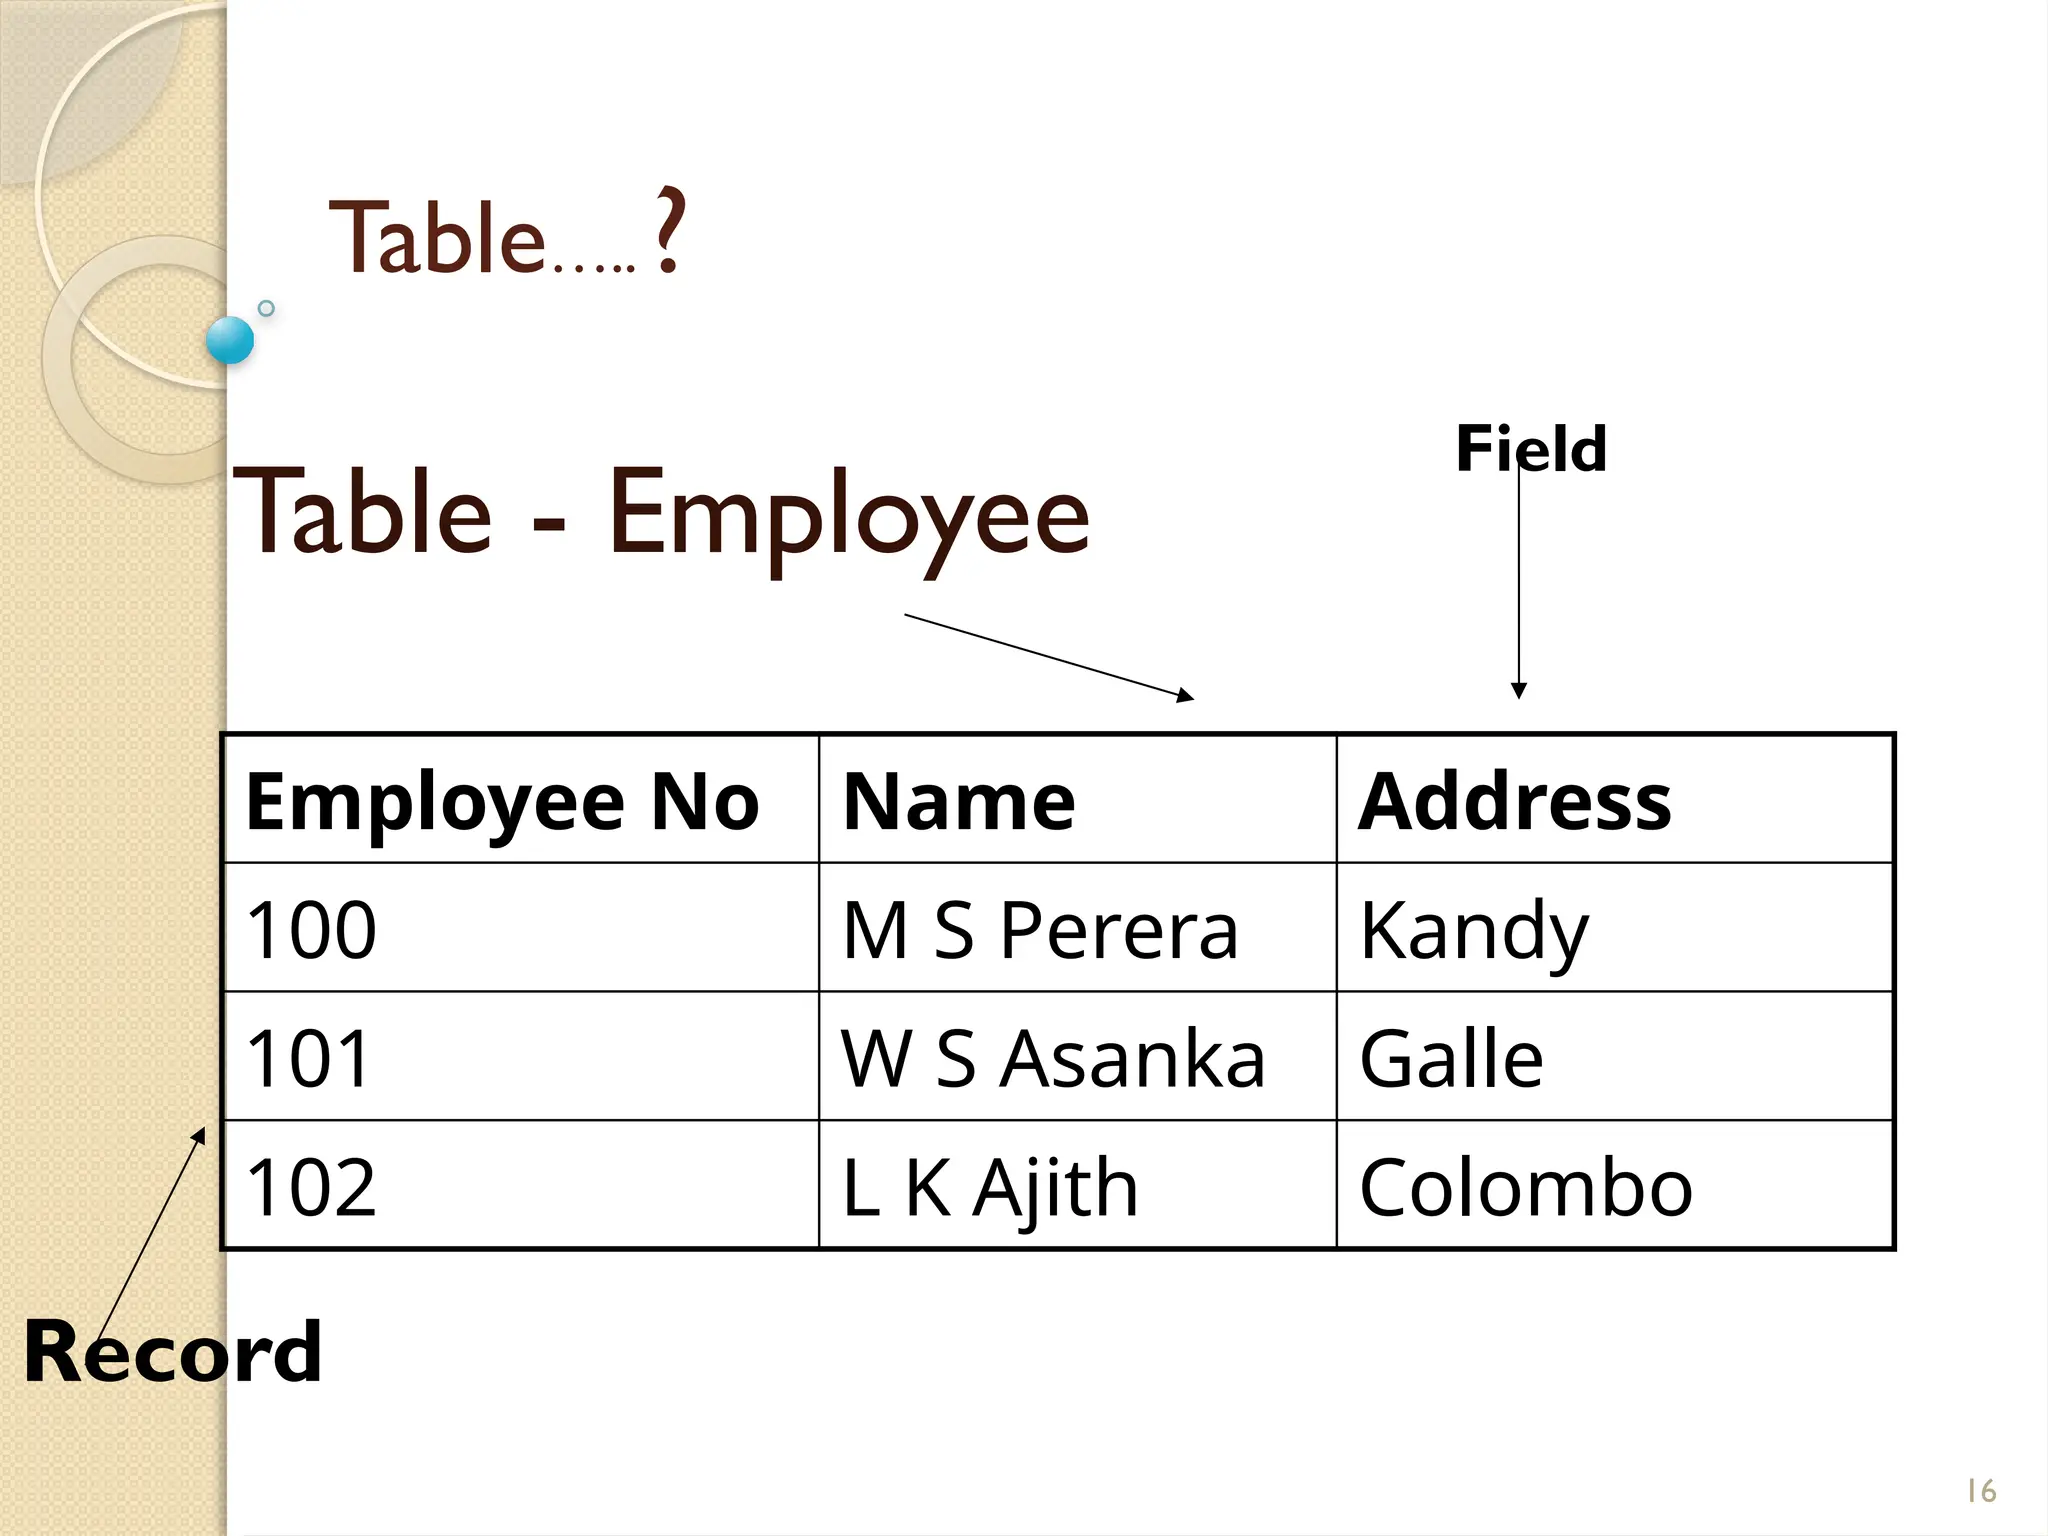
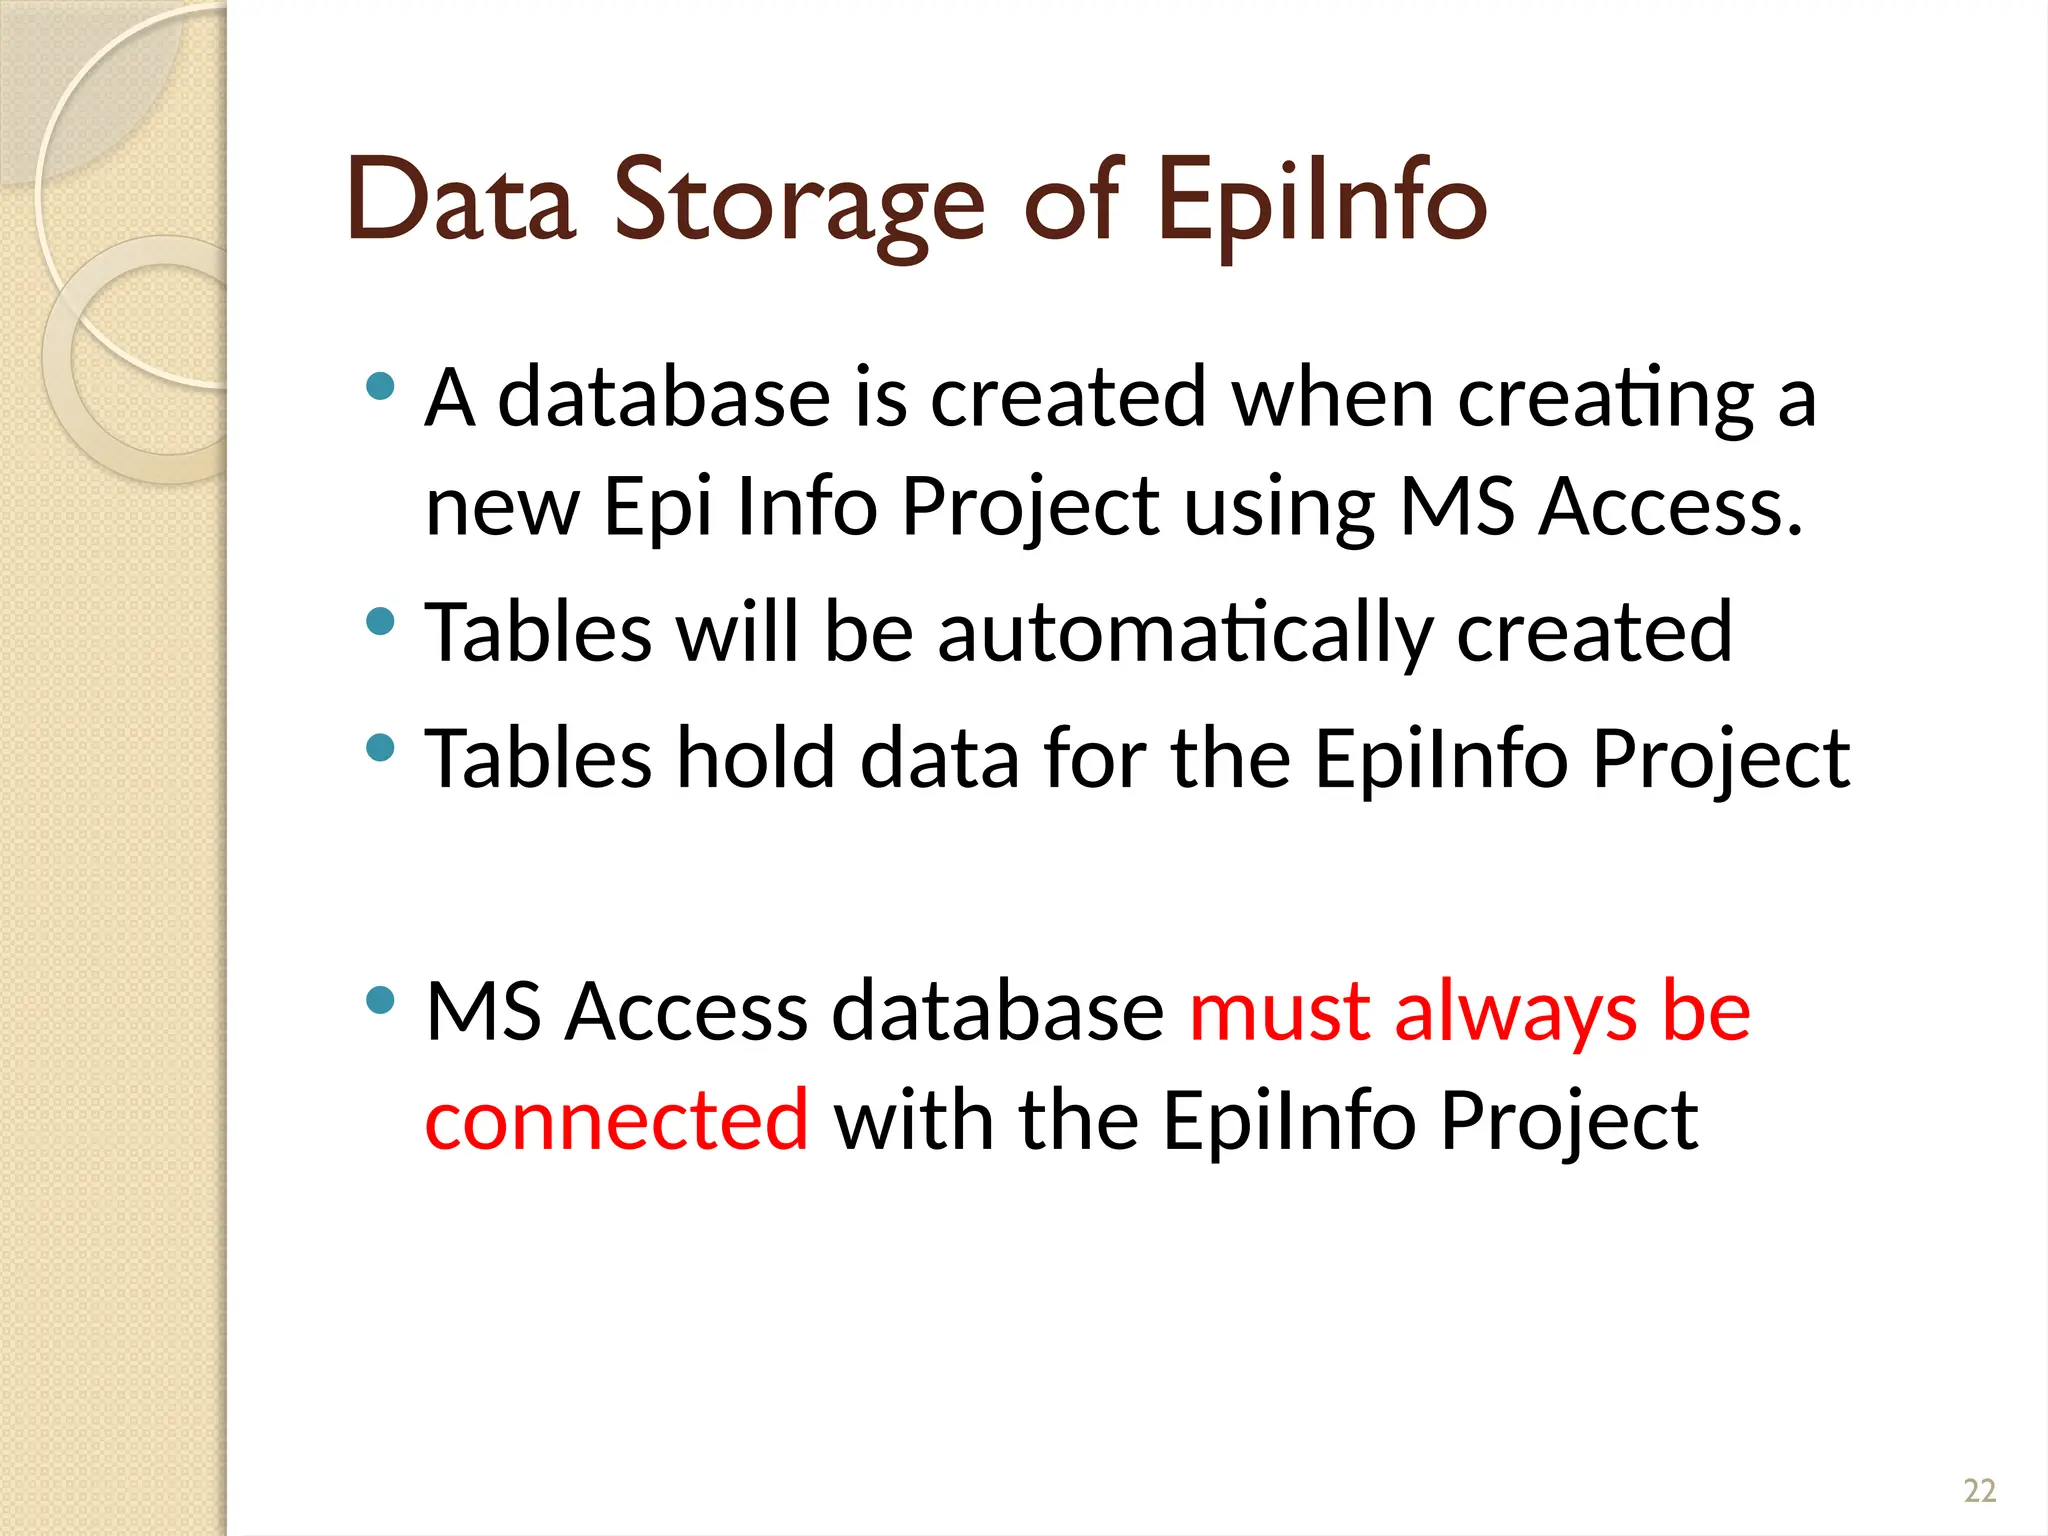
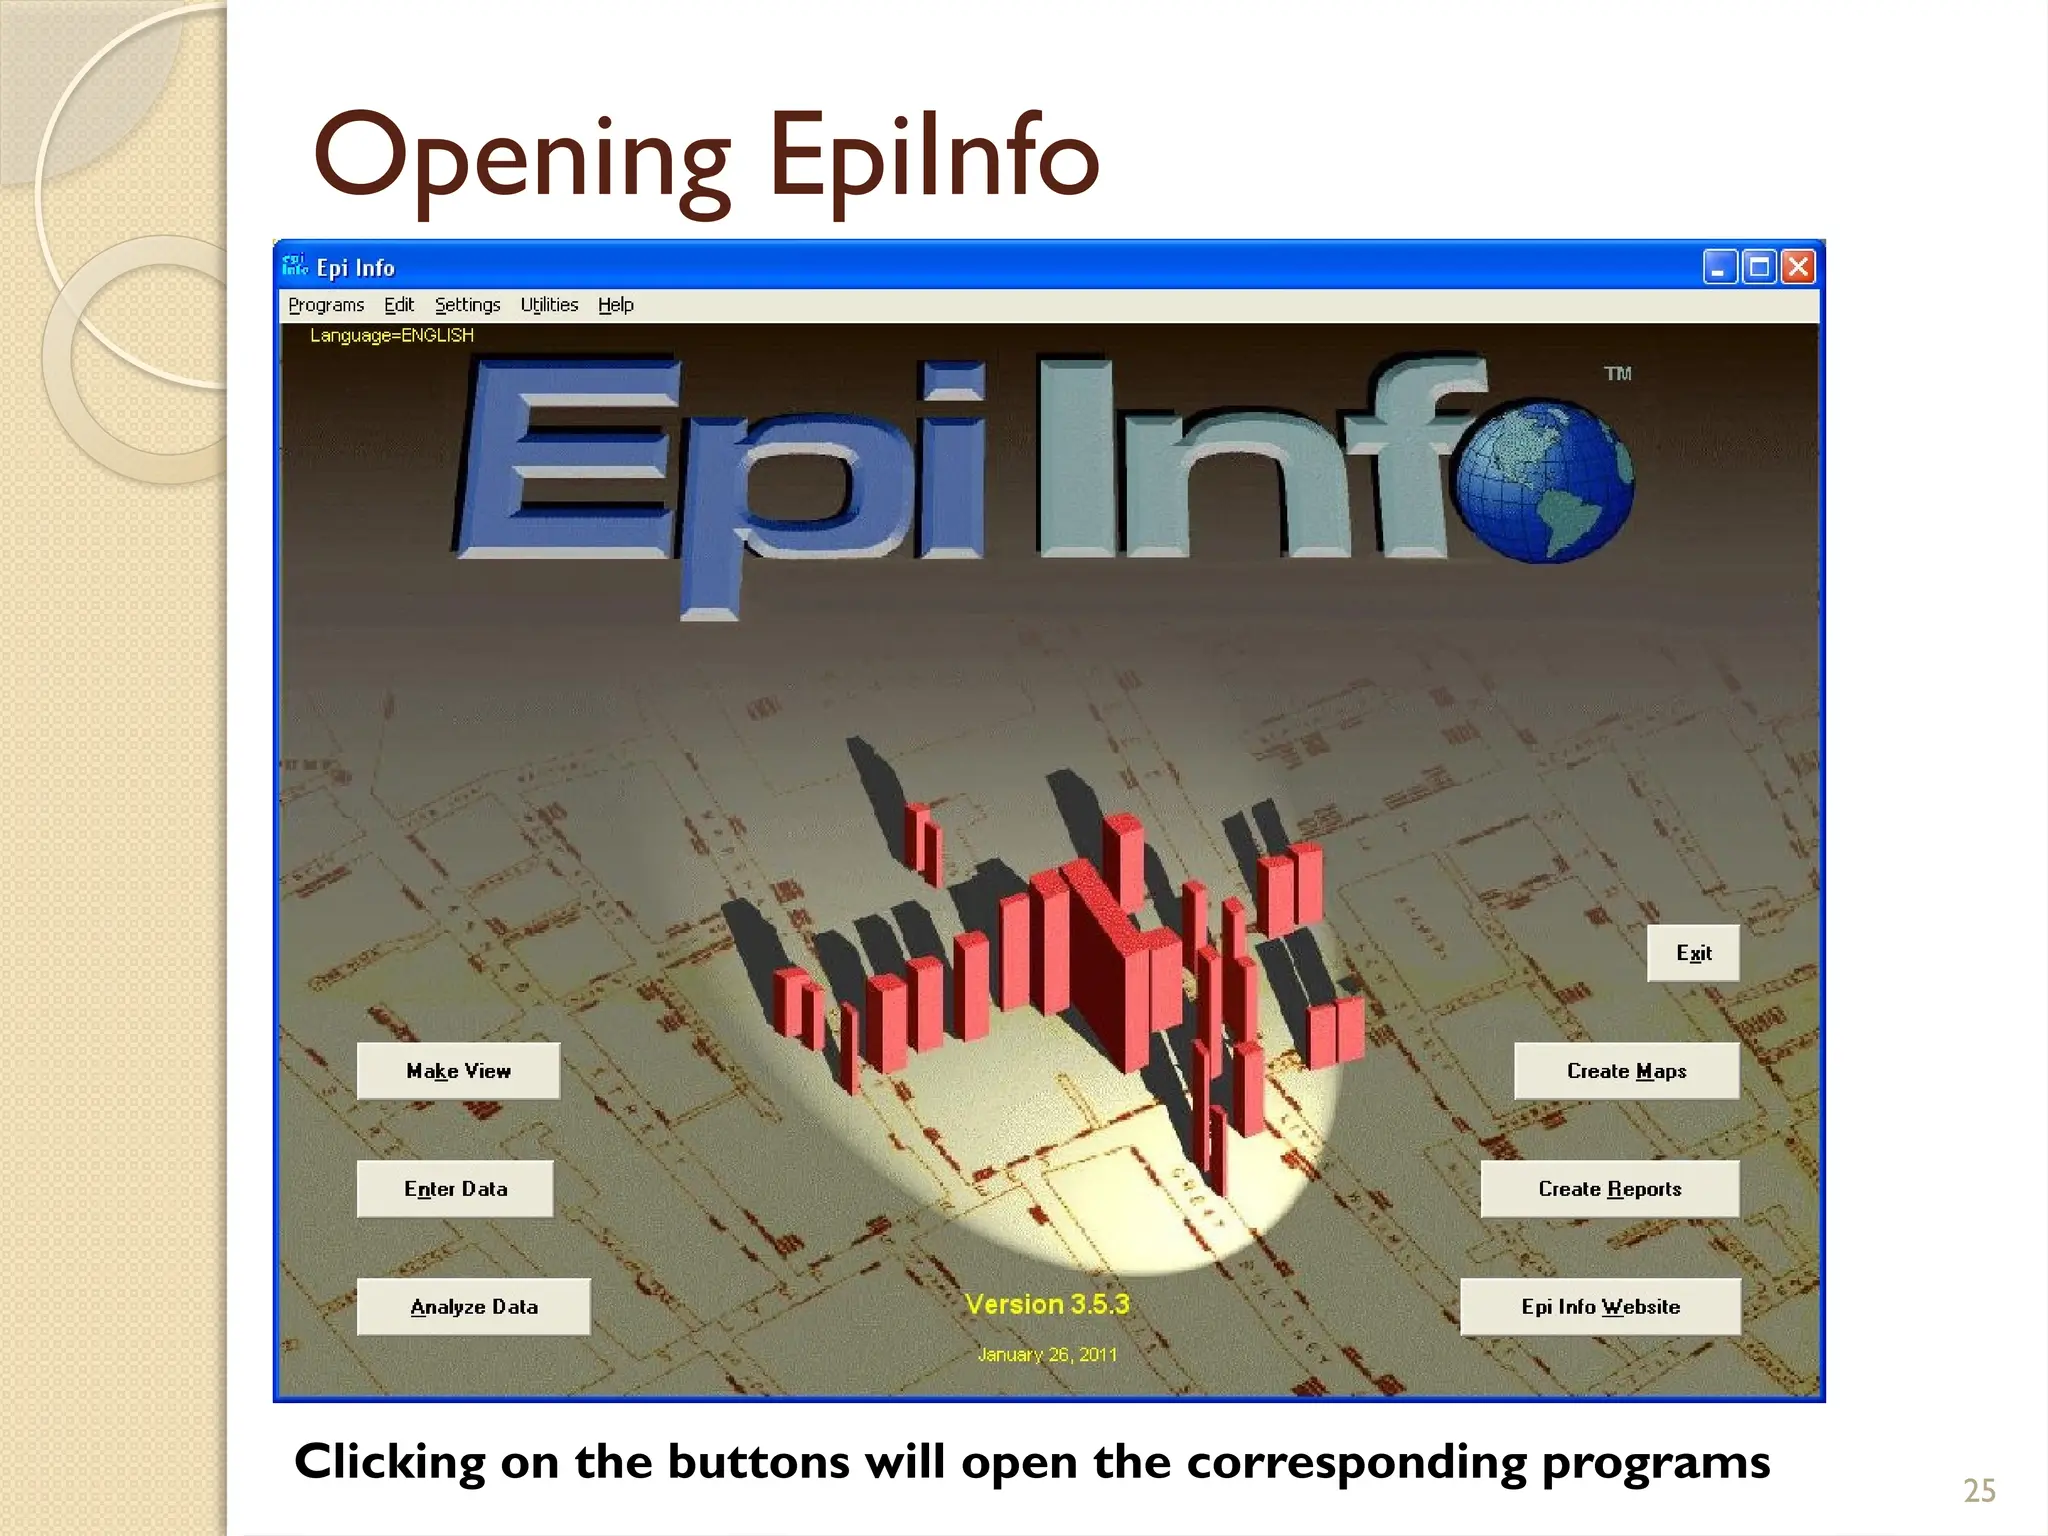
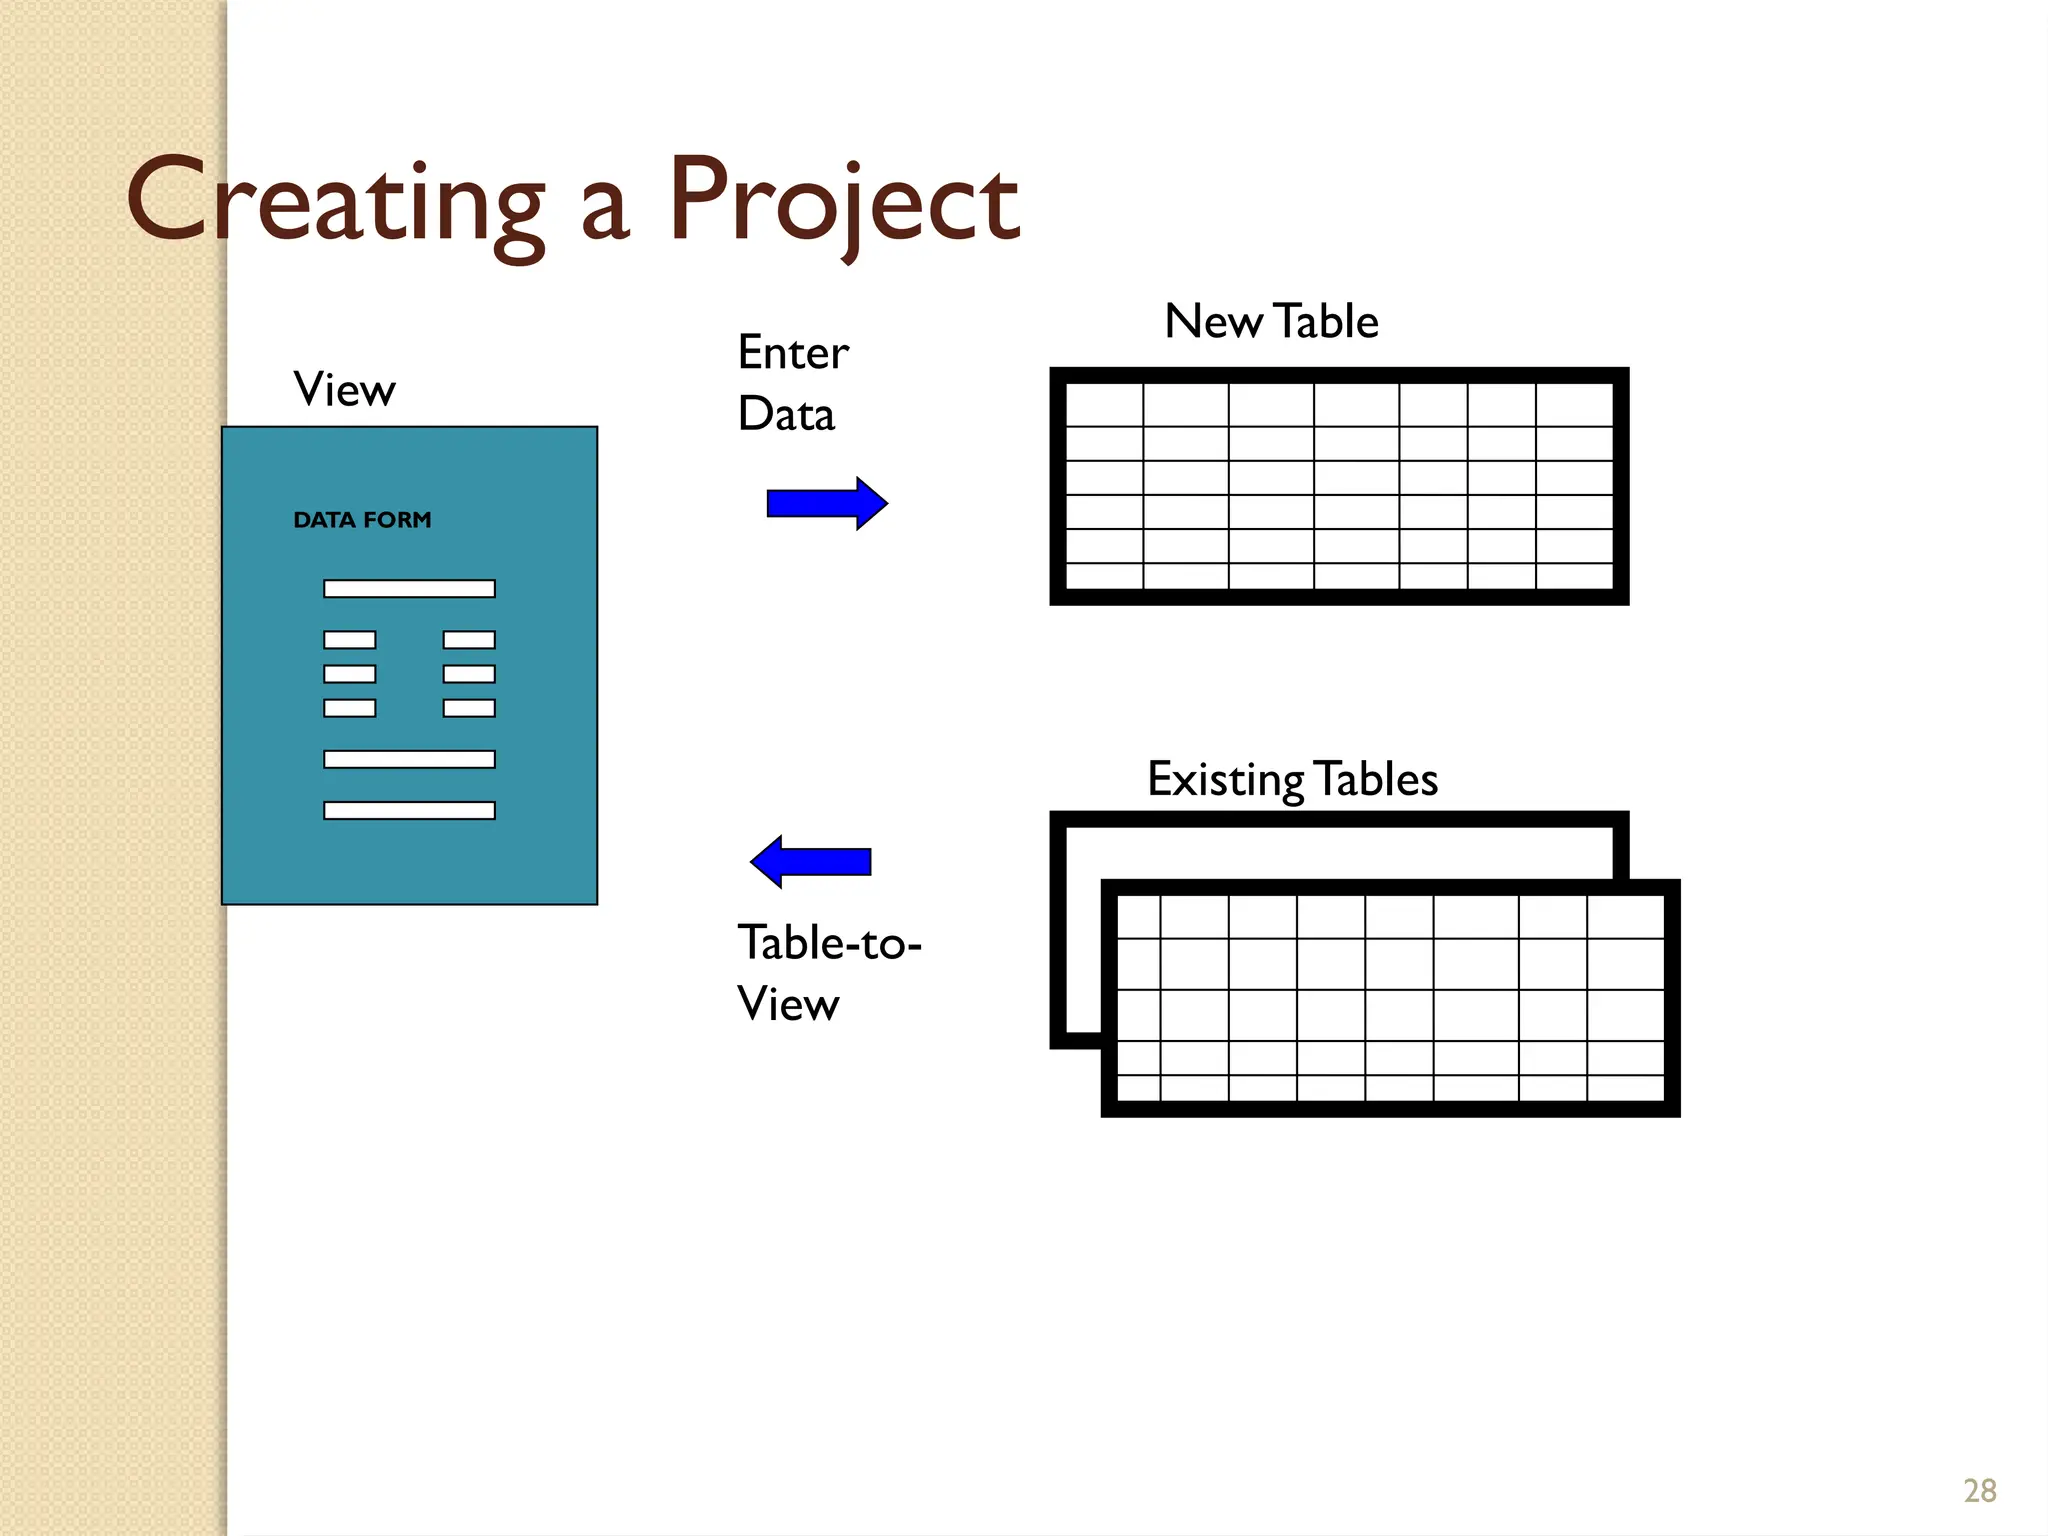
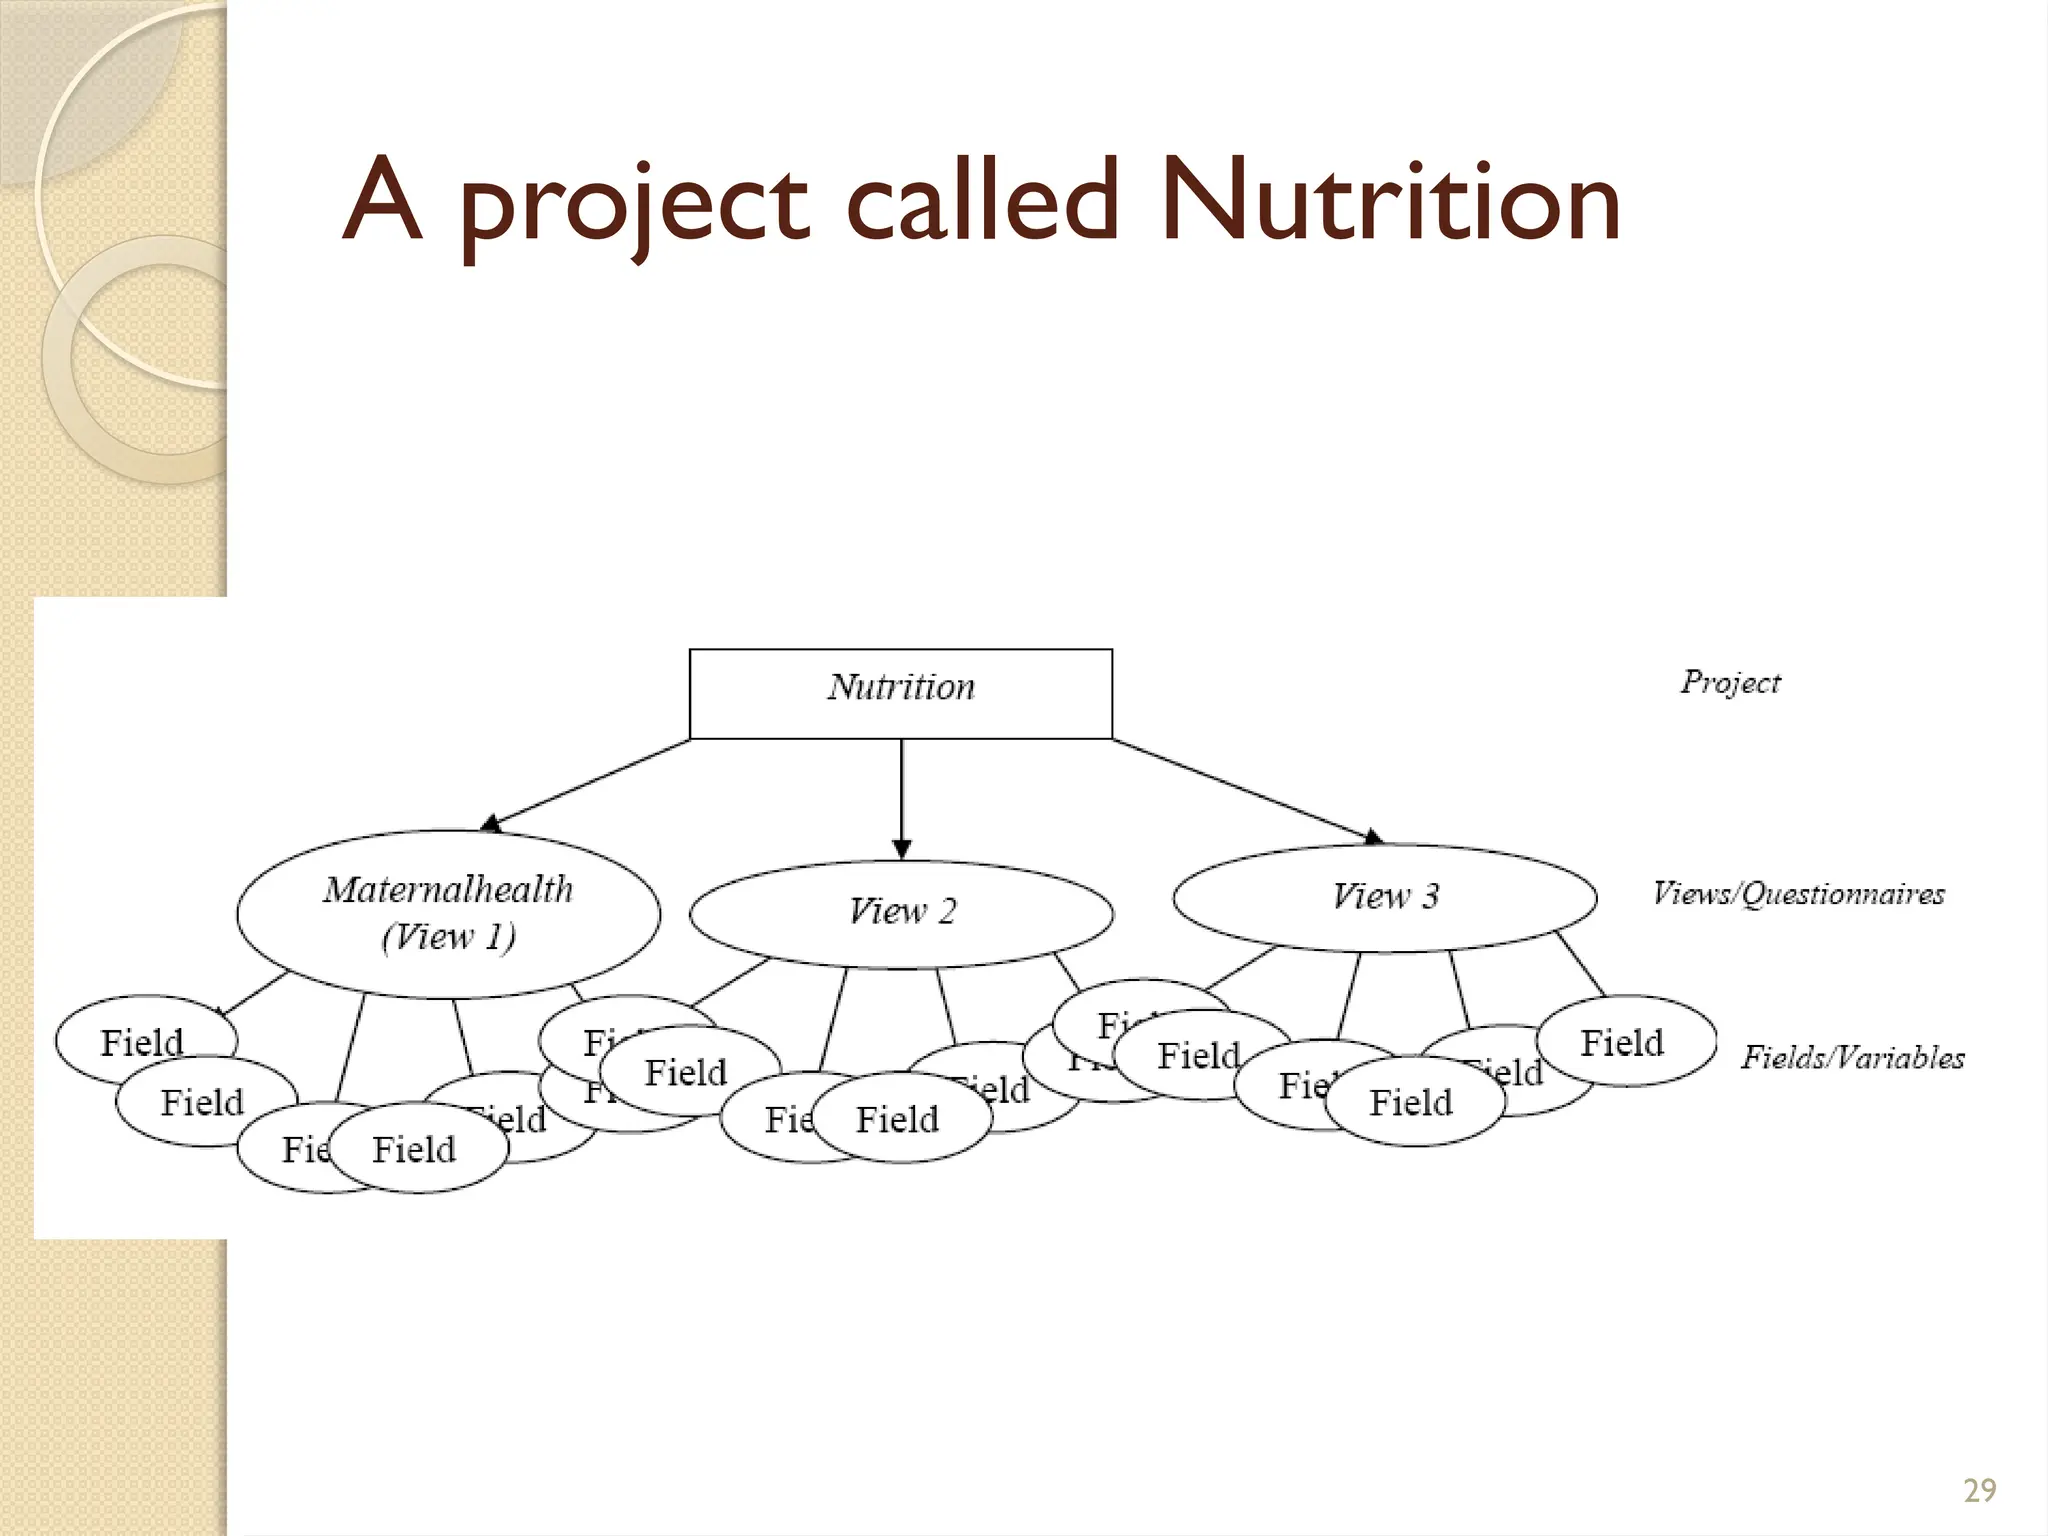
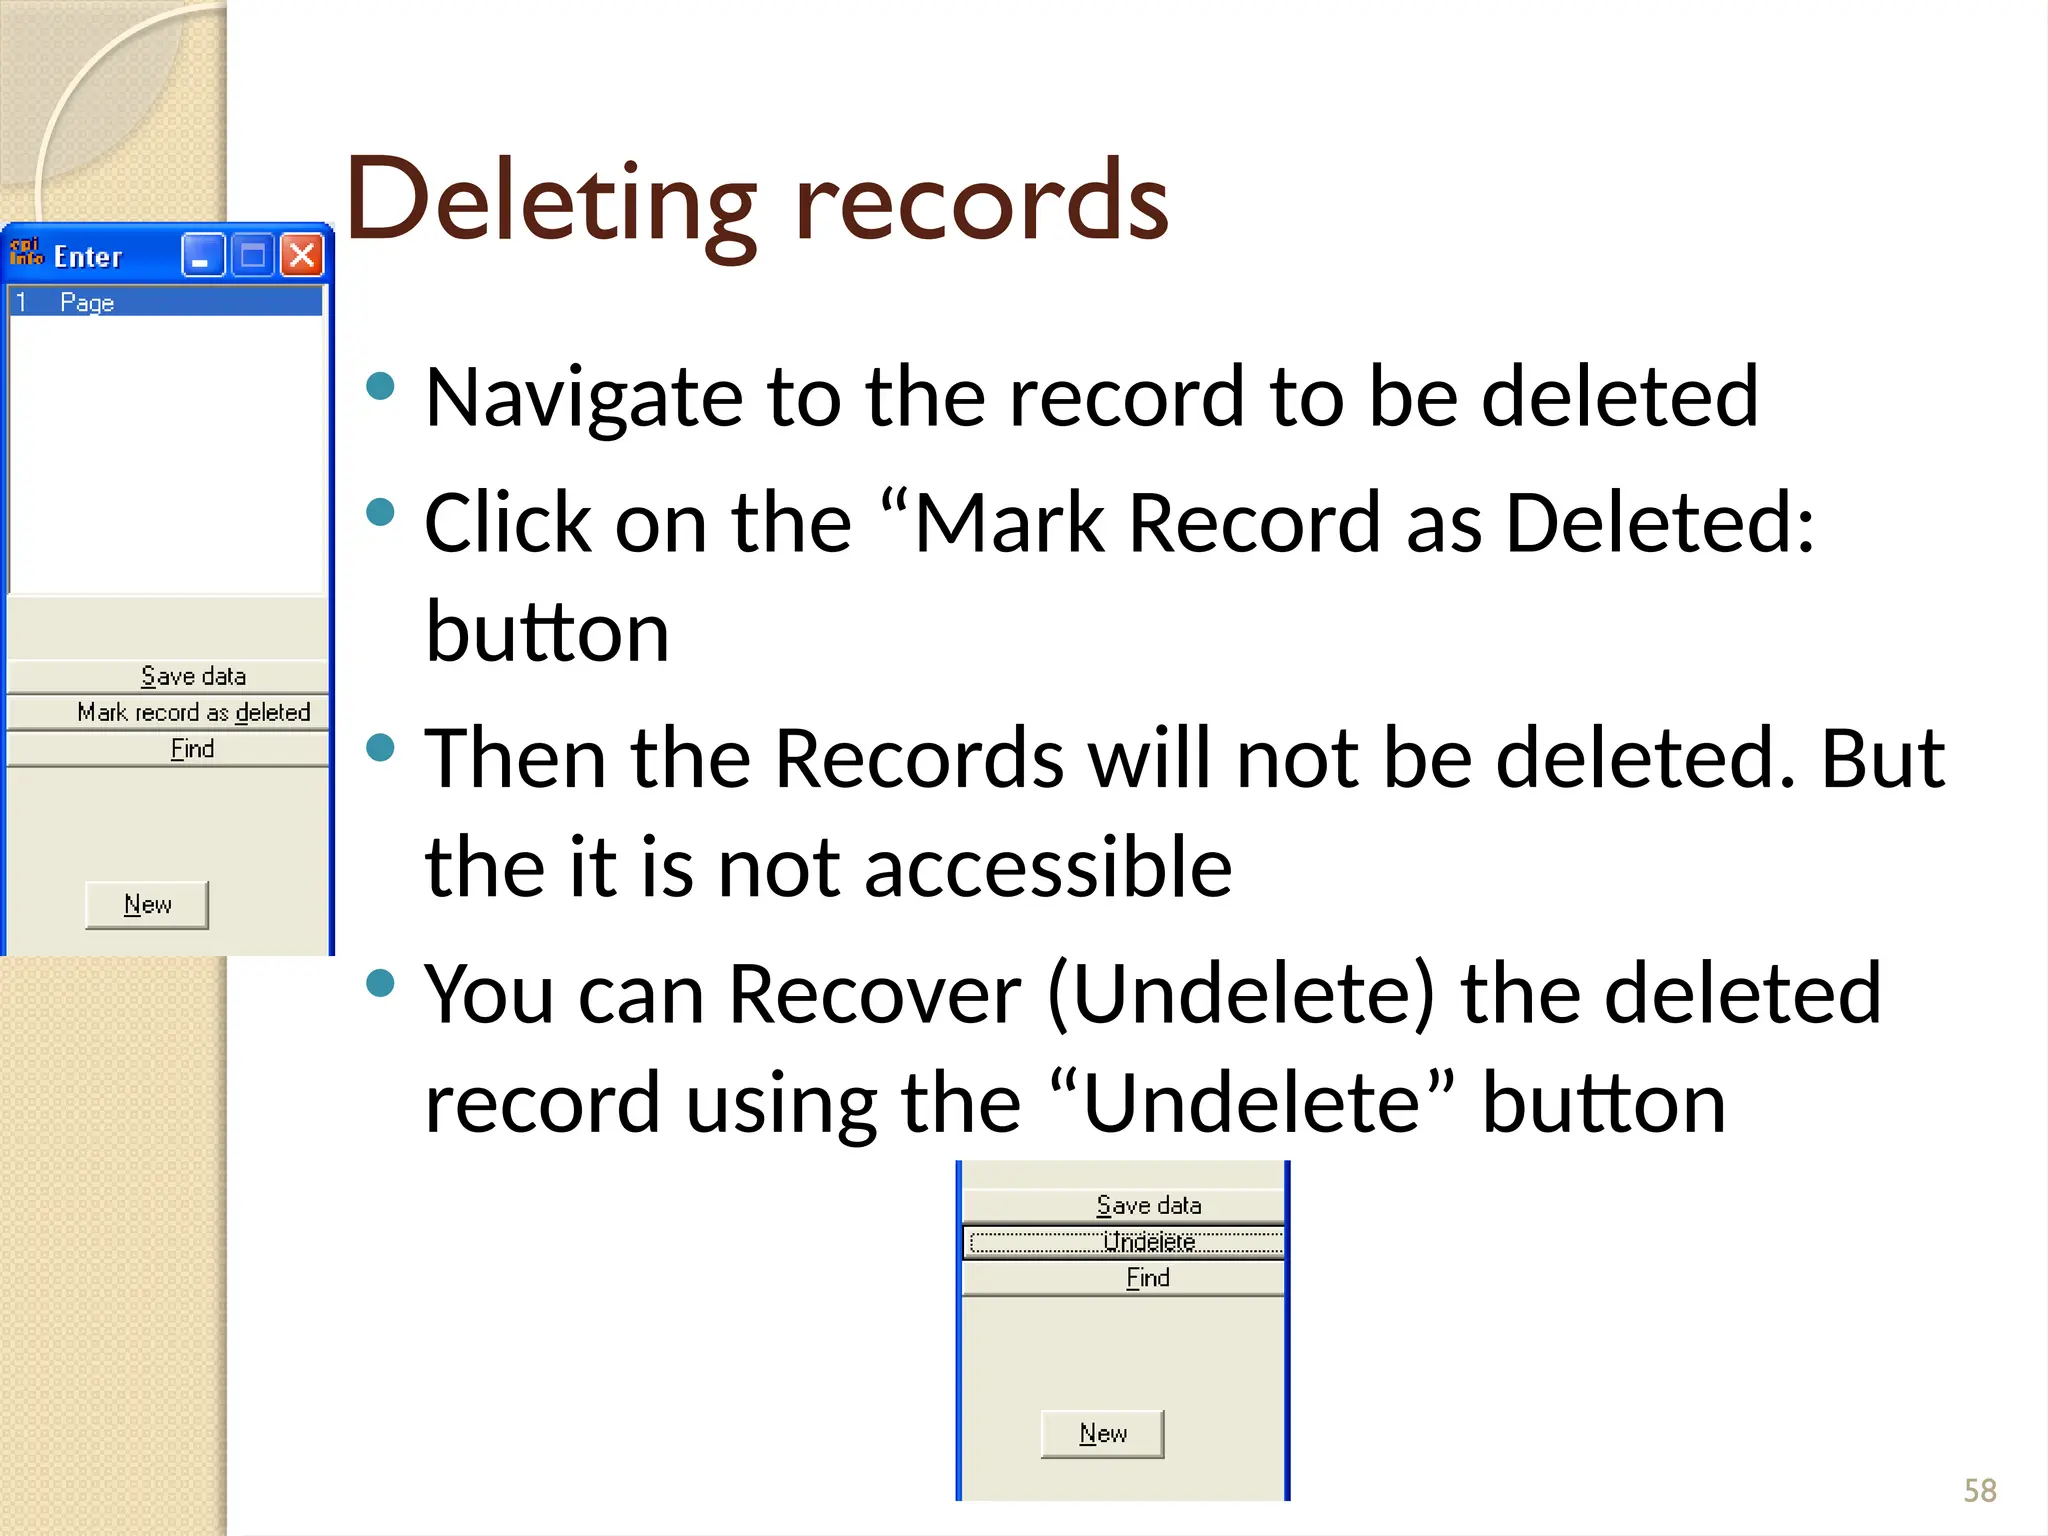
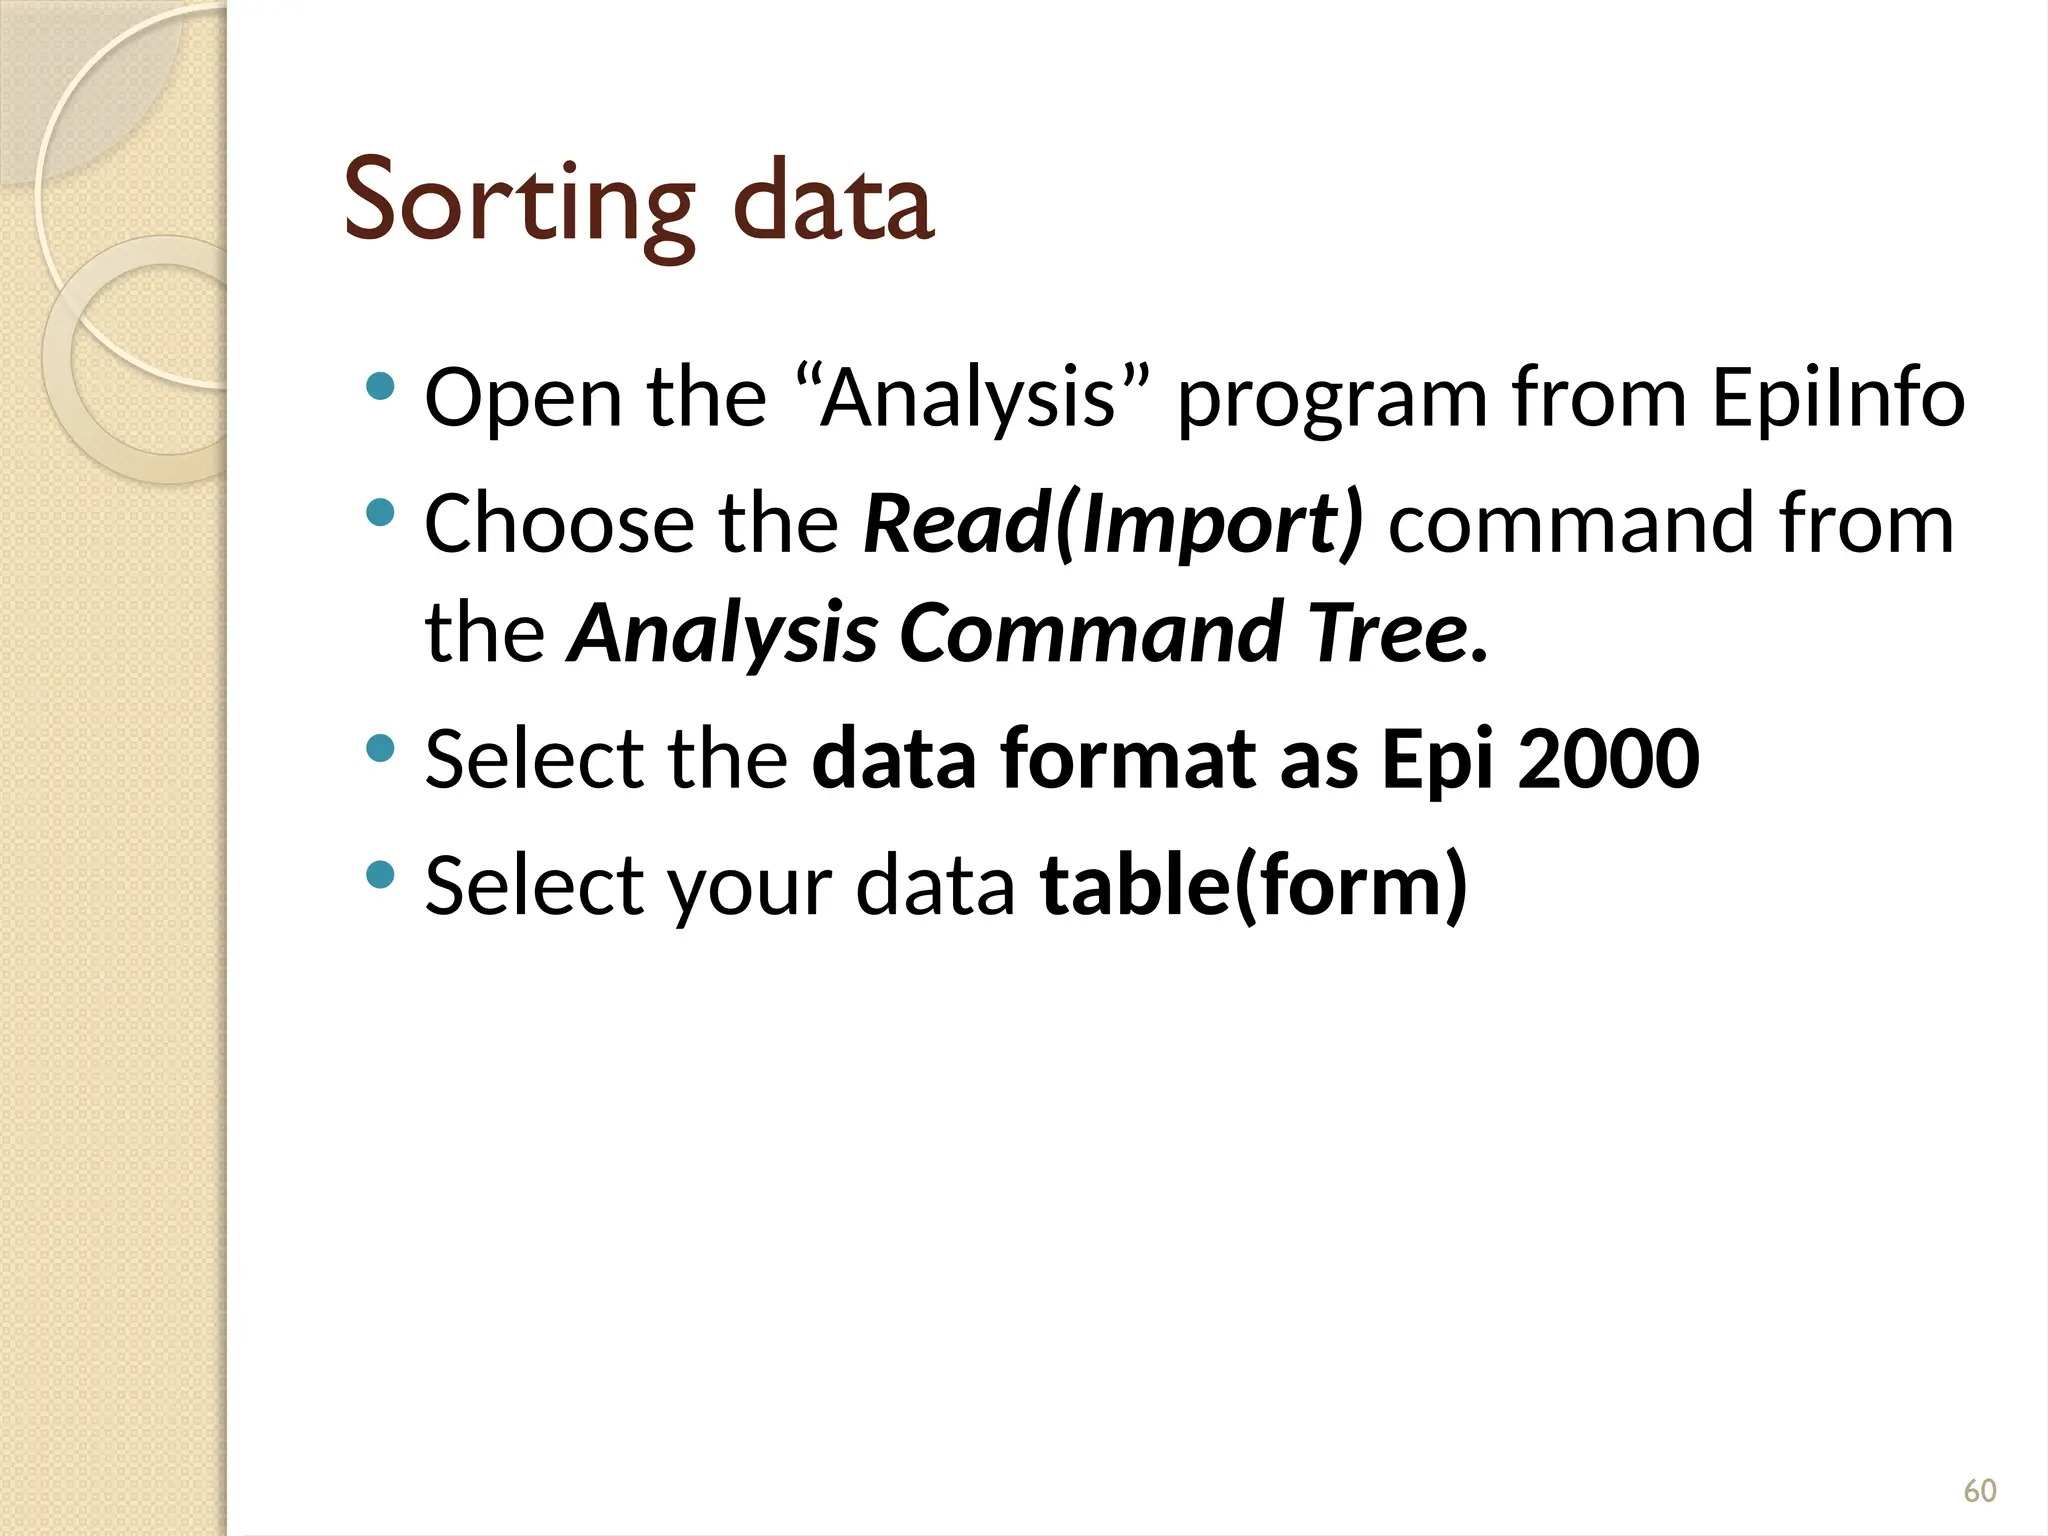
1
Data Handling Using
EpiInfo
Indunil Gunawardana
InformationTechnology Center
University of Peradeniya
DataVs Information
 Data : Raw facts and figures about an
organization and its business transactions
 Raw data can take a variety of forms, including
measurements, survey responses, and
observations.
 Information: Data that has been refined and
organized by processing to make them
meaningful in decision making
2
3
Example:A Mark Sheet
Name Marks
Sunil 89
Kamal 76
Nimal 45
Nayomi 91
Total Marks 301
Average 75.25
Data
Information
4
Example
1. Price: 32/=
2. Weight : 80g
3. Manufacturer: Uniliver
4. Number of items sold: 20
5. Total earning from soap: 20 × 32/=
** Information should be – Relevant, Accurate,
Understandable, Available, timely
Data
Information
?
Information System
 A system that generates information
 Information systems can be manual or
computer-based
5
Manual Information System Computer Based Information System
ManualVs Computer-Based
Information Systems
Manual Computer-based
Multitasking Impossible Possible
Speed Slow Very fast
Error rate Higher Negligible
Information
usage
For limited number of
people
For large number of people
(through computer networks)
Output
quality
Low quality Higher quality
Recovery Not efficient Efficient
6
7
Which System will give you more
benefits
Computer
Based
Information
ystems
8
What is data analysis
 Data analysis is a practice in which raw data
is ordered and organized so that useful
information can be extracted from it.
 Analysis can be done manually or using a
computer
9
Advantages of Analyzing data using
computer based systems
 Speed of Processing
 Repetitive Processing – similar tasks with a
high level of accuracy
 Data Storage Capacity – CD, DVD, Hard
disks
 Speed of Searching information
 Speed of Data Communications
 The Ability to Produce Different Output
Formats
10
Software for Data Analysis
 Microsoft Excel
 SAS
 OpenStat
 R
 MiniTab
 SPSS
 EPiInfo
11
About EPI INFO
 A free software developed by the United
States Centers for Disease Control (CDC)
 Download from
 http://wwwn.cdc.gov/epiinfo/html/downloa
ds.htm
 A simple software tool to create, collect,
analyze, visualize and report data.
 In addition, EpiInfo has analytic capabilities
to summarize data
12
About EPI INFO
 downloads over 1 million times over 180
countries
 Translations of the programs and manual
exist in 13 different languages
 There are many programs available in Epi
Info
13
Data Storage
 Data are stored in a database.
 Data base has many data tables.
14
Databases
 A database is a collection of organized
data about one or more subjects..
 A database consists of “Tables”
15
What is a Table….. ?
A table is a collection of records..
 A record is information that is related to
a single item.
16
Table….. ?
Table - Employee
Employee No Name Address
100 M S Perera Kandy
101 W S Asanka Galle
102 L K Ajith Colombo
Field
Record
17
What is a Primary key….. ?
 A ‘Primary Key’ is a field or combination
of fields which uniquely identifies the
record of a table.
 The primary key field must always contain
a value (i.e it cannot be NULL).
18
NIC Name Address
80502458V M S Perera Kandy
78452422V W S Asanka Galle
76335462V L K Ajith Colombo
81201925V M S Perera Matara
69052241V L K Ajith Kandy
Table - Employee
Which field can be set as the Primary key ?
19
What is a Foreign key
 When connecting separate data tables,
the foreign key is created
 A foreign key is a field that refer to the
primary key of a another table.
20
Relationships……
Employee
No
Name DepNo
Amal Perera Name DEP100
Department No Name
DEP100 Chemistry
EMPLOYEE
DEPARTMENT
21
What is a DBMS?
 DBMS –Data Base Management System
 A DBMS is a software that facilitate to
manipulate data in the database.
 Eg: Ms Access, SQL server, Mysql, etc
22
Data Storage of EpiInfo
 A database is created when creating a
new Epi Info Project using MS Access.
 Tables will be automatically created
 Tables hold data for the EpiInfo Project
 MS Access database must always be
connected with the EpiInfo Project
23
Programs available in Epi Info
 MakeView – designs questionnaires.
Once a questionnaire is designed, a
database is automatically created
 Enter – enters data into a questionnaire
 Analysis - analyzes data, report outputs,
and graph data
24
Programs available in Epi Info
 Maps - creates GIS maps and overlay
survey data onto them
 Reports – Create Reports
 NutStat – Calculates z-scores
25
Opening EpiInfo
Clicking on the buttons will open the corresponding programs
26
Make/View Program
 Displays two sections:
 left side of the screen
 Right side of the screen - used to design
 and edit questionnaire
27
Designing a questioner
 Create a new project
 File  New : prompt a location to store
your data ( database)
 Create a new view within that project
 There can be many views within a project
28
New Table
Existing Tables
DATA FORM
Creating a Project
Enter
Data
Table-to-
View
View
29
A project called Nutrition
30
Let us create a project called Company
and aView called Employee
 To collect information about employees
working in a company
 `
31
What is aVariable
 A variable is the name for a place in the
computer's memory where you store
some data.
 Lets consider a variable called Name- to
store names
Variable: Name
Sunil
NImal
Kamal
32
Variable types
 You must define variables according to the
type of data we use
 Available data types:-
∂ Numeric - hold numbers.
∂ Date - hold date values – ( the format can be
defined by the user)
∂ Custom currency – Hold currency values
∂ String – not numeric values (text, phone
number)
33
34
Fields
 Each Field represents a title or a question
for the survey
 For example, a question, “What is the last
grade you finished in school?” is treated
as a field
 The answer for the question are called as
parameters
35
Fields
 Parameters for the question above
 (a) no education,
 (b) primary, (c) secondary, (d) highest.
 Fields and Variables are used
interchangeably within Epi Info.
36
Creating fields in Epi Info
 Right click on the Make/view window
(Grid)
 A Field Definition dialog box will appear
37
Components of the Field Definition
dialog Box
 Question or Prompt - creates the text
that will appear on the questionnaire.
 This text can be a variable name, the title
of the survey, the subtitle of the survey,
etc.
 “Font for Prompt” button to format the
font - font style, and size of the text
38
FieldTypes in Epi Info
 Text
 Text(Uppercase)
 Label/Title
 Multiline
 Number
 Phone Number
 Date
 Time
 Date/Time
 Yes/No
 Check Box
 Option
 Image
 Command Button
 Mirror
 Grid
 Relate
39
Field Definition dialog box
 “Field or Variable Type”- the type of the
variable such as numeric response, text,
yes/no, date, time, etc.
 “Pattern” – defines specific types of fields
or variables such as: number, phone
number, date, time, and date/time.
 “Size”- defines the length of the text
when type is specified as text or
text(uppercase).
40
Field Definition dialog box
 “Field Name” - label of the variable or
text.
 Then click on “OK” button to add the
variable on to the View.
 It can be located by dragging on the
screen.
41
42
Adding Drop Downs
 Lets Create a drop down to enter the
“City”
 The answers are “Kandy, Colombo, Galle,
Jaffna”
 Enter the Field Name as “City”
 Select the type as “Text”
 Click on “Legal Values” button to enter the
list of answers.
 Create the Answer list
43
44
Add Radio Buttons
 Sex of students. The answer are “Male” or
“Female”
 Enter the name of the field as “Sex”
 Select the type as “Option”
 Then Click “Ok” will appear a new dialog
box to enter the choices (Answers)
45
 Click on the “Enter key” to add the
choises.
46
47
Yes/No Questions
 Are you Married? Will have only Yes or No
answer
 Enter the field name and select type as
“Yes/No”
48
Creating grids in the questionnaire
 Are added through the field definition
dialog box.
 Create several variables under one
heading
49
50
Creating groups in the questionnaire
 Place the variables under a different sub-
title to make it easier to identify that are
asking for similar information.
 Move the variables closer
 Select them
 Insert  Group  name the group
51
52
Change the Background
 Format background
53
Selecting the Tab Order
 This makes easier to enter data without
using the mouse.
 Move from field to field using the tab key
 Edit Order of Fields
 From there move fields up and down to
arrange the tab order
54
55
Entering data to the
Questionnaires
Epi Info
56
Enter Program
 Open the “Enter Programe” of Epi Infor to
insert data
 Open the questionnaire and the project
 Enter the data for the first Record
 Click the Save data button to add the
record
57
Navigate through Records
 Use the following set of buttons to
navigate through entered records
58
Deleting records
 Navigate to the record to be deleted
 Click on the “Mark Record as Deleted:
button
 Then the Records will not be deleted. But
the it is not accessible
 You can Recover (Undelete) the deleted
record using the “Undelete” button
59
Analyzing Data
Epi Info
60
Sorting data
 Open the “Analysis” program from EpiInfo
 Choose the Read(Import) command from
the Analysis Command Tree.
 Select the data format as Epi 2000
 Select your data table(form)
61
Listing Sorted data
 Choose the Sort subcommand from the
Select/IF folder within the Analysis
Command
 Double click on the variable to be sorted
 Click the OK
 Choose the List command from the
Analysis Command tree.
 Choose a variable to list. Data are sorted
by the above selected field
62
Cancel the Sorting
 To cancel the sorting criteria select
“Cancel Select” from the Analysis
Command tree
63
ThankYou …….

Epi_Info university of peradenya ICT center

  • 1.
    1 Data Handling Using EpiInfo IndunilGunawardana InformationTechnology Center University of Peradeniya
  • 2.
    DataVs Information  Data: Raw facts and figures about an organization and its business transactions  Raw data can take a variety of forms, including measurements, survey responses, and observations.  Information: Data that has been refined and organized by processing to make them meaningful in decision making 2
  • 3.
    3 Example:A Mark Sheet NameMarks Sunil 89 Kamal 76 Nimal 45 Nayomi 91 Total Marks 301 Average 75.25 Data Information
  • 4.
    4 Example 1. Price: 32/= 2.Weight : 80g 3. Manufacturer: Uniliver 4. Number of items sold: 20 5. Total earning from soap: 20 × 32/= ** Information should be – Relevant, Accurate, Understandable, Available, timely Data Information ?
  • 5.
    Information System  Asystem that generates information  Information systems can be manual or computer-based 5 Manual Information System Computer Based Information System
  • 6.
    ManualVs Computer-Based Information Systems ManualComputer-based Multitasking Impossible Possible Speed Slow Very fast Error rate Higher Negligible Information usage For limited number of people For large number of people (through computer networks) Output quality Low quality Higher quality Recovery Not efficient Efficient 6
  • 7.
    7 Which System willgive you more benefits Computer Based Information ystems
  • 8.
    8 What is dataanalysis  Data analysis is a practice in which raw data is ordered and organized so that useful information can be extracted from it.  Analysis can be done manually or using a computer
  • 9.
    9 Advantages of Analyzingdata using computer based systems  Speed of Processing  Repetitive Processing – similar tasks with a high level of accuracy  Data Storage Capacity – CD, DVD, Hard disks  Speed of Searching information  Speed of Data Communications  The Ability to Produce Different Output Formats
  • 10.
    10 Software for DataAnalysis  Microsoft Excel  SAS  OpenStat  R  MiniTab  SPSS  EPiInfo
  • 11.
    11 About EPI INFO A free software developed by the United States Centers for Disease Control (CDC)  Download from  http://wwwn.cdc.gov/epiinfo/html/downloa ds.htm  A simple software tool to create, collect, analyze, visualize and report data.  In addition, EpiInfo has analytic capabilities to summarize data
  • 12.
    12 About EPI INFO downloads over 1 million times over 180 countries  Translations of the programs and manual exist in 13 different languages  There are many programs available in Epi Info
  • 13.
    13 Data Storage  Dataare stored in a database.  Data base has many data tables.
  • 14.
    14 Databases  A databaseis a collection of organized data about one or more subjects..  A database consists of “Tables”
  • 15.
    15 What is aTable….. ? A table is a collection of records..  A record is information that is related to a single item.
  • 16.
    16 Table….. ? Table -Employee Employee No Name Address 100 M S Perera Kandy 101 W S Asanka Galle 102 L K Ajith Colombo Field Record
  • 17.
    17 What is aPrimary key….. ?  A ‘Primary Key’ is a field or combination of fields which uniquely identifies the record of a table.  The primary key field must always contain a value (i.e it cannot be NULL).
  • 18.
    18 NIC Name Address 80502458VM S Perera Kandy 78452422V W S Asanka Galle 76335462V L K Ajith Colombo 81201925V M S Perera Matara 69052241V L K Ajith Kandy Table - Employee Which field can be set as the Primary key ?
  • 19.
    19 What is aForeign key  When connecting separate data tables, the foreign key is created  A foreign key is a field that refer to the primary key of a another table.
  • 20.
    20 Relationships…… Employee No Name DepNo Amal PereraName DEP100 Department No Name DEP100 Chemistry EMPLOYEE DEPARTMENT
  • 21.
    21 What is aDBMS?  DBMS –Data Base Management System  A DBMS is a software that facilitate to manipulate data in the database.  Eg: Ms Access, SQL server, Mysql, etc
  • 22.
    22 Data Storage ofEpiInfo  A database is created when creating a new Epi Info Project using MS Access.  Tables will be automatically created  Tables hold data for the EpiInfo Project  MS Access database must always be connected with the EpiInfo Project
  • 23.
    23 Programs available inEpi Info  MakeView – designs questionnaires. Once a questionnaire is designed, a database is automatically created  Enter – enters data into a questionnaire  Analysis - analyzes data, report outputs, and graph data
  • 24.
    24 Programs available inEpi Info  Maps - creates GIS maps and overlay survey data onto them  Reports – Create Reports  NutStat – Calculates z-scores
  • 25.
    25 Opening EpiInfo Clicking onthe buttons will open the corresponding programs
  • 26.
    26 Make/View Program  Displaystwo sections:  left side of the screen  Right side of the screen - used to design  and edit questionnaire
  • 27.
    27 Designing a questioner Create a new project  File  New : prompt a location to store your data ( database)  Create a new view within that project  There can be many views within a project
  • 28.
    28 New Table Existing Tables DATAFORM Creating a Project Enter Data Table-to- View View
  • 29.
  • 30.
    30 Let us createa project called Company and aView called Employee  To collect information about employees working in a company  `
  • 31.
    31 What is aVariable A variable is the name for a place in the computer's memory where you store some data.  Lets consider a variable called Name- to store names Variable: Name Sunil NImal Kamal
  • 32.
    32 Variable types  Youmust define variables according to the type of data we use  Available data types:- ∂ Numeric - hold numbers. ∂ Date - hold date values – ( the format can be defined by the user) ∂ Custom currency – Hold currency values ∂ String – not numeric values (text, phone number)
  • 33.
  • 34.
    34 Fields  Each Fieldrepresents a title or a question for the survey  For example, a question, “What is the last grade you finished in school?” is treated as a field  The answer for the question are called as parameters
  • 35.
    35 Fields  Parameters forthe question above  (a) no education,  (b) primary, (c) secondary, (d) highest.  Fields and Variables are used interchangeably within Epi Info.
  • 36.
    36 Creating fields inEpi Info  Right click on the Make/view window (Grid)  A Field Definition dialog box will appear
  • 37.
    37 Components of theField Definition dialog Box  Question or Prompt - creates the text that will appear on the questionnaire.  This text can be a variable name, the title of the survey, the subtitle of the survey, etc.  “Font for Prompt” button to format the font - font style, and size of the text
  • 38.
    38 FieldTypes in EpiInfo  Text  Text(Uppercase)  Label/Title  Multiline  Number  Phone Number  Date  Time  Date/Time  Yes/No  Check Box  Option  Image  Command Button  Mirror  Grid  Relate
  • 39.
    39 Field Definition dialogbox  “Field or Variable Type”- the type of the variable such as numeric response, text, yes/no, date, time, etc.  “Pattern” – defines specific types of fields or variables such as: number, phone number, date, time, and date/time.  “Size”- defines the length of the text when type is specified as text or text(uppercase).
  • 40.
    40 Field Definition dialogbox  “Field Name” - label of the variable or text.  Then click on “OK” button to add the variable on to the View.  It can be located by dragging on the screen.
  • 41.
  • 42.
    42 Adding Drop Downs Lets Create a drop down to enter the “City”  The answers are “Kandy, Colombo, Galle, Jaffna”  Enter the Field Name as “City”  Select the type as “Text”  Click on “Legal Values” button to enter the list of answers.  Create the Answer list
  • 43.
  • 44.
    44 Add Radio Buttons Sex of students. The answer are “Male” or “Female”  Enter the name of the field as “Sex”  Select the type as “Option”  Then Click “Ok” will appear a new dialog box to enter the choices (Answers)
  • 45.
    45  Click onthe “Enter key” to add the choises.
  • 46.
  • 47.
    47 Yes/No Questions  Areyou Married? Will have only Yes or No answer  Enter the field name and select type as “Yes/No”
  • 48.
    48 Creating grids inthe questionnaire  Are added through the field definition dialog box.  Create several variables under one heading
  • 49.
  • 50.
    50 Creating groups inthe questionnaire  Place the variables under a different sub- title to make it easier to identify that are asking for similar information.  Move the variables closer  Select them  Insert  Group  name the group
  • 51.
  • 52.
    52 Change the Background Format background
  • 53.
    53 Selecting the TabOrder  This makes easier to enter data without using the mouse.  Move from field to field using the tab key  Edit Order of Fields  From there move fields up and down to arrange the tab order
  • 54.
  • 55.
    55 Entering data tothe Questionnaires Epi Info
  • 56.
    56 Enter Program  Openthe “Enter Programe” of Epi Infor to insert data  Open the questionnaire and the project  Enter the data for the first Record  Click the Save data button to add the record
  • 57.
    57 Navigate through Records Use the following set of buttons to navigate through entered records
  • 58.
    58 Deleting records  Navigateto the record to be deleted  Click on the “Mark Record as Deleted: button  Then the Records will not be deleted. But the it is not accessible  You can Recover (Undelete) the deleted record using the “Undelete” button
  • 59.
  • 60.
    60 Sorting data  Openthe “Analysis” program from EpiInfo  Choose the Read(Import) command from the Analysis Command Tree.  Select the data format as Epi 2000  Select your data table(form)
  • 61.
    61 Listing Sorted data Choose the Sort subcommand from the Select/IF folder within the Analysis Command  Double click on the variable to be sorted  Click the OK  Choose the List command from the Analysis Command tree.  Choose a variable to list. Data are sorted by the above selected field
  • 62.
    62 Cancel the Sorting To cancel the sorting criteria select “Cancel Select” from the Analysis Command tree
  • 63.