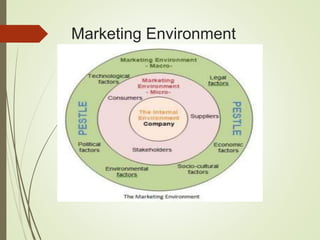
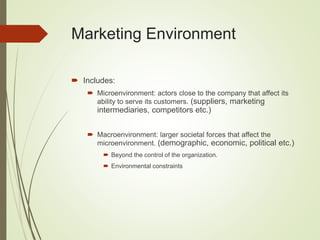
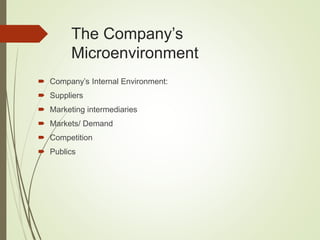
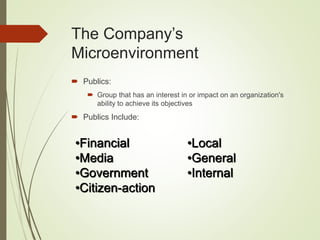
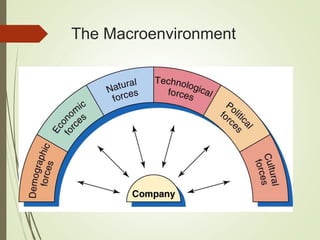
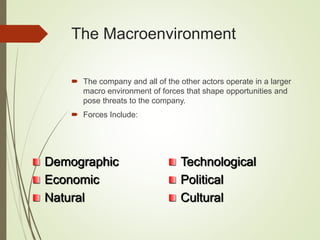
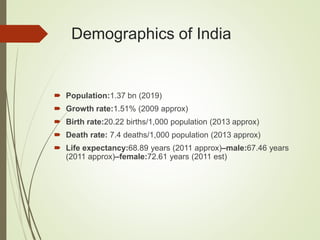
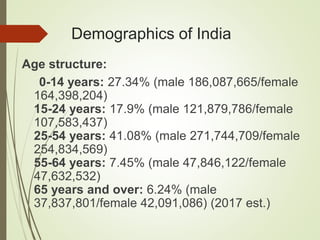
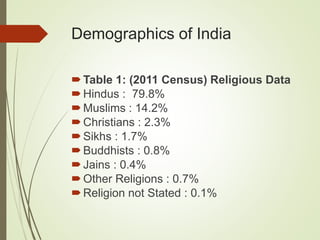
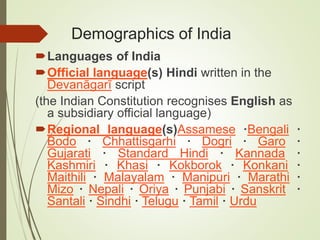
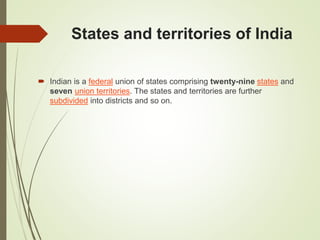
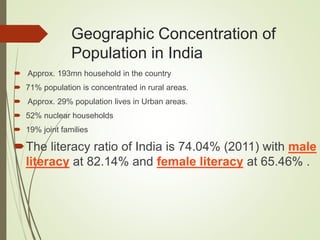
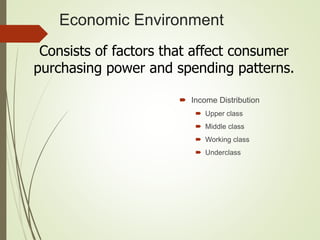
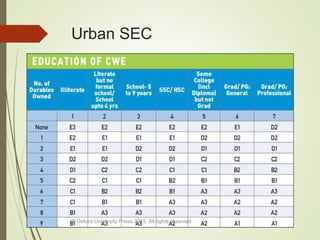
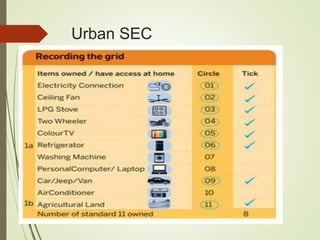
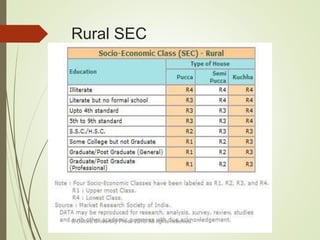
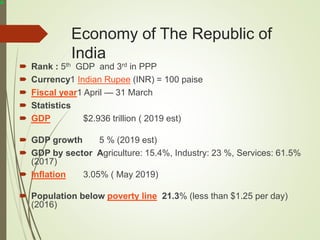
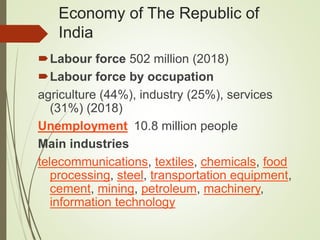
Chapter 2
The Marketing Environment
Marketing Environment
 Consists of actors and forces outside the organization that
affect management’s ability to build and maintain
relationships with target customers.
 Environment offers both opportunities and threats to the
company.
 Marketing intelligence and research used to collect
information about the environment.
Marketing Environment
 Includes:
 Microenvironment: actors close to the company that affect its
ability to serve its customers. (suppliers, marketing
intermediaries, competitors etc.)
 Macroenvironment: larger societal forces that affect the
microenvironment. (demographic, economic, political etc.)
 Beyond the control of the organization.
 Environmental constraints
The Company’s
Microenvironment
 Company’s Internal Environment:
Areas inside a company.
Affects the marketing department’s
planning strategies.
All departments must “think
consumer” and work together to
provide superior customer value and
satisfaction.
The Company’s
Microenvironment
 Company’s Internal Environment:
 Suppliers
 Marketing intermediaries
 Markets/ Demand
 Competition
 Publics
The Company’s
Microenvironment
 Suppliers:
 Provide resources needed to produce goods and services.
 Important link in the “value delivery system.”
 Most marketers treat suppliers like partners.
The Company’s
Microenvironment
Customers:
 Five types of markets that purchase a company’s goods and
services
Markets Include:
 Consumer
 Business
 Reseller
 Government
 International
The Company’s
Microenvironment
 Competitors:
 Those who serve a target market with products and services
that are viewed by consumers as being reasonable substitutes
 Company must gain strategic advantage against these
organizations
The Company’s
Microenvironment
 Publics:
 Group that has an interest in or impact on an organization's
ability to achieve its objectives
 Publics Include:
•Financial
•Media
•Government
•Citizen-action
•Local
•General
•Internal
The Macroenvironment
 The company and all of the other actors operate in a larger
macro environment of forces that shape opportunities and
pose threats to the company.
 Forces Include:
Technological
Political
Cultural
Demographic
Economic
Natural
Demographic
Environment
The Company’s
Macroenvironment
 Demographic:
 The study of human populations in terms of size, density,
location, age, gender, race, occupation, and other statistics.
 Marketers track changing age and family structures,
geographic population shifts, educational characteristics, and
population diversity.
Demographics of India
 Population:1.37 bn (2019)
 Growth rate:1.51% (2009 approx)
 Birth rate:20.22 births/1,000 population (2013 approx)
 Death rate: 7.4 deaths/1,000 population (2013 approx)
 Life expectancy:68.89 years (2011 approx)–male:67.46 years
(2011 approx)–female:72.61 years (2011 est)
Demographics of India
Age structure:
0-14 years: 27.34% (male 186,087,665/female
164,398,204)
15-24 years: 17.9% (male 121,879,786/female
107,583,437)
25-54 years: 41.08% (male 271,744,709/female
254,834,569)
55-64 years: 7.45% (male 47,846,122/female
47,632,532)
65 years and over: 6.24% (male
37,837,801/female 42,091,086) (2017 est.)
Demographics of India
Table 1: (2011 Census) Religious Data
Hindus : 79.8%
Muslims : 14.2%
Christians : 2.3%
Sikhs : 1.7%
Buddhists : 0.8%
Jains : 0.4%
Other Religions : 0.7%
Religion not Stated : 0.1%
Demographics of India
Languages of India
Official language(s) Hindi written in the
Devanāgarī script
(the Indian Constitution recognises English as
a subsidiary official language)
Regional language(s)Assamese ·Bengali ·
Bodo · Chhattisgarhi · Dogri · Garo ·
Gujarati · Standard Hindi · Kannada ·
Kashmiri · Khasi · Kokborok · Konkani ·
Maithili · Malayalam · Manipuri · Marathi ·
Mizo · Nepali · Oriya · Punjabi · Sanskrit ·
Santali · Sindhi · Telugu · Tamil · Urdu
States and territories of India
 Indian is a federal union of states comprising twenty-nine states and
seven union territories. The states and territories are further
subdivided into districts and so on.
Geographic Concentration of
Population in India
 Approx. 193mn household in the country
 71% population is concentrated in rural areas.
 Approx. 29% population lives in Urban areas.
 52% nuclear households
 19% joint families
The literacy ratio of India is 74.04% (2011) with male
literacy at 82.14% and female literacy at 65.46% .
Increasing Diversity
 India is a “salad bowl”
 Various groups mixed together, each retaining its ethnic and cultural
differences
 Increased marketing to:
 Children
 Youth `
Generations
Economic Environment
 Income Distribution
 Upper class
 Middle class
 Working class
 Underclass
Consists of factors that affect consumer
purchasing power and spending patterns.
Urban SEC
© Oxford University Press 2015. All rights reserved.
Urban SEC
 Education +Consumer durables + land owned
© Oxford University Press 2015. All rights reserved.
Rural SEC
© Oxford University Press 2015. All rights reserved.
Economy of The Republic of
India
 Rank : 5th GDP and 3rd in PPP
 Currency1 Indian Rupee (INR) = 100 paise
 Fiscal year1 April — 31 March
 Statistics
 GDP $2.936 trillion ( 2019 est)
 GDP growth 5 % (2019 est)
 GDP by sector Agriculture: 15.4%, Industry: 23 %, Services: 61.5%
(2017)
 Inflation 3.05% ( May 2019)
 Population below poverty line 21.3% (less than $1.25 per day)
(2016)
Economy of The Republic of
India
Labour force 502 million (2018)
Labour force by occupation
agriculture (44%), industry (25%), services
(31%) (2018)
Unemployment 10.8 million people
Main industries
telecommunications, textiles, chemicals, food
processing, steel, transportation equipment,
cement, mining, petroleum, machinery,
information technology
Economy of The Republic of
India
 Exports $330 billion (2018)
 Export goods
software, petroleum products, textile goods, gems and
jewelry, engineering goods, chemicals, leather
manufactures
Main export partners
US, UAE, China , EU, Hongkong.
Imports $514 billion (2018)
Import goods
crude oil, machinery, gems, fertilizer, chemicals
Main import partners
China, Saudi Arabia, US, UAE, ASEAN
Natural Environment
Natural Environment
 Factors Impacting the Natural Environment:
 Shortages of raw materials
 Increased pollution
 Increased government intervention
 Environmentally sustainable strategies
Technological Environment
Changes rapidly.
Creates new markets and opportunities.
Challenge is to make practical, affordable
products.
Safety regulations result in higher research
costs & longer time between
conceptualization and introduction of
product.
Political Environment
Includes Laws, Government Agencies, and
Pressure Groups that Influence or Limit
Various Organizations In a Given Society.
Areas of concern:
Increasing legislation
Changing government agency enforcement
Increased emphasis on ethics and socially
responsible behavior
Cultural Environment
The institutions and other forces that affect a
society’s basic values, perceptions, preference,
and behaviors.
Core beliefs and values are passed on from
parents to children and are reinforced by
schools, churches, business, and government.
Secondary beliefs and values are more open to
change.
Responding to the Marketing
Environment
 Environmental Management Perspective
Taking a proactive approach to managing
the environment by taking aggressive (rather
than reactive) actions to affect the publics
and forces in the marketing environment.
Consumer Environmental Segments
 Genuine Greens
 Not Me Greens
 Go-with-the-Flow Greens
 Dream Greens
 Business First Greens
 Mean Greens
Copyright © 2013 Dorling Kindersley (India) Pvt Ltd. Authorized adaptation from
the United States edition of Marketing Management, 14e.

environment (1).pptx

  • 1.
  • 2.
    Marketing Environment  Consistsof actors and forces outside the organization that affect management’s ability to build and maintain relationships with target customers.  Environment offers both opportunities and threats to the company.  Marketing intelligence and research used to collect information about the environment.
  • 3.
  • 4.
    Marketing Environment  Includes: Microenvironment: actors close to the company that affect its ability to serve its customers. (suppliers, marketing intermediaries, competitors etc.)  Macroenvironment: larger societal forces that affect the microenvironment. (demographic, economic, political etc.)  Beyond the control of the organization.  Environmental constraints
  • 5.
    The Company’s Microenvironment  Company’sInternal Environment: Areas inside a company. Affects the marketing department’s planning strategies. All departments must “think consumer” and work together to provide superior customer value and satisfaction.
  • 6.
    The Company’s Microenvironment  Company’sInternal Environment:  Suppliers  Marketing intermediaries  Markets/ Demand  Competition  Publics
  • 7.
    The Company’s Microenvironment  Suppliers: Provide resources needed to produce goods and services.  Important link in the “value delivery system.”  Most marketers treat suppliers like partners.
  • 8.
    The Company’s Microenvironment Customers:  Fivetypes of markets that purchase a company’s goods and services Markets Include:  Consumer  Business  Reseller  Government  International
  • 9.
    The Company’s Microenvironment  Competitors: Those who serve a target market with products and services that are viewed by consumers as being reasonable substitutes  Company must gain strategic advantage against these organizations
  • 10.
    The Company’s Microenvironment  Publics: Group that has an interest in or impact on an organization's ability to achieve its objectives  Publics Include: •Financial •Media •Government •Citizen-action •Local •General •Internal
  • 11.
  • 12.
    The Macroenvironment  Thecompany and all of the other actors operate in a larger macro environment of forces that shape opportunities and pose threats to the company.  Forces Include: Technological Political Cultural Demographic Economic Natural
  • 13.
  • 14.
    The Company’s Macroenvironment  Demographic: The study of human populations in terms of size, density, location, age, gender, race, occupation, and other statistics.  Marketers track changing age and family structures, geographic population shifts, educational characteristics, and population diversity.
  • 15.
    Demographics of India Population:1.37 bn (2019)  Growth rate:1.51% (2009 approx)  Birth rate:20.22 births/1,000 population (2013 approx)  Death rate: 7.4 deaths/1,000 population (2013 approx)  Life expectancy:68.89 years (2011 approx)–male:67.46 years (2011 approx)–female:72.61 years (2011 est)
  • 16.
    Demographics of India Agestructure: 0-14 years: 27.34% (male 186,087,665/female 164,398,204) 15-24 years: 17.9% (male 121,879,786/female 107,583,437) 25-54 years: 41.08% (male 271,744,709/female 254,834,569) 55-64 years: 7.45% (male 47,846,122/female 47,632,532) 65 years and over: 6.24% (male 37,837,801/female 42,091,086) (2017 est.)
  • 17.
    Demographics of India Table1: (2011 Census) Religious Data Hindus : 79.8% Muslims : 14.2% Christians : 2.3% Sikhs : 1.7% Buddhists : 0.8% Jains : 0.4% Other Religions : 0.7% Religion not Stated : 0.1%
  • 18.
    Demographics of India Languagesof India Official language(s) Hindi written in the Devanāgarī script (the Indian Constitution recognises English as a subsidiary official language) Regional language(s)Assamese ·Bengali · Bodo · Chhattisgarhi · Dogri · Garo · Gujarati · Standard Hindi · Kannada · Kashmiri · Khasi · Kokborok · Konkani · Maithili · Malayalam · Manipuri · Marathi · Mizo · Nepali · Oriya · Punjabi · Sanskrit · Santali · Sindhi · Telugu · Tamil · Urdu
  • 19.
    States and territoriesof India  Indian is a federal union of states comprising twenty-nine states and seven union territories. The states and territories are further subdivided into districts and so on.
  • 20.
    Geographic Concentration of Populationin India  Approx. 193mn household in the country  71% population is concentrated in rural areas.  Approx. 29% population lives in Urban areas.  52% nuclear households  19% joint families The literacy ratio of India is 74.04% (2011) with male literacy at 82.14% and female literacy at 65.46% .
  • 21.
    Increasing Diversity  Indiais a “salad bowl”  Various groups mixed together, each retaining its ethnic and cultural differences  Increased marketing to:  Children  Youth `
  • 22.
  • 23.
  • 24.
    Economic Environment  IncomeDistribution  Upper class  Middle class  Working class  Underclass Consists of factors that affect consumer purchasing power and spending patterns.
  • 25.
    Urban SEC © OxfordUniversity Press 2015. All rights reserved.
  • 26.
    Urban SEC  Education+Consumer durables + land owned © Oxford University Press 2015. All rights reserved.
  • 27.
    Rural SEC © OxfordUniversity Press 2015. All rights reserved.
  • 28.
    Economy of TheRepublic of India  Rank : 5th GDP and 3rd in PPP  Currency1 Indian Rupee (INR) = 100 paise  Fiscal year1 April — 31 March  Statistics  GDP $2.936 trillion ( 2019 est)  GDP growth 5 % (2019 est)  GDP by sector Agriculture: 15.4%, Industry: 23 %, Services: 61.5% (2017)  Inflation 3.05% ( May 2019)  Population below poverty line 21.3% (less than $1.25 per day) (2016)
  • 29.
    Economy of TheRepublic of India Labour force 502 million (2018) Labour force by occupation agriculture (44%), industry (25%), services (31%) (2018) Unemployment 10.8 million people Main industries telecommunications, textiles, chemicals, food processing, steel, transportation equipment, cement, mining, petroleum, machinery, information technology
  • 30.
    Economy of TheRepublic of India  Exports $330 billion (2018)  Export goods software, petroleum products, textile goods, gems and jewelry, engineering goods, chemicals, leather manufactures Main export partners US, UAE, China , EU, Hongkong. Imports $514 billion (2018) Import goods crude oil, machinery, gems, fertilizer, chemicals Main import partners China, Saudi Arabia, US, UAE, ASEAN
  • 31.
  • 32.
    Natural Environment  FactorsImpacting the Natural Environment:  Shortages of raw materials  Increased pollution  Increased government intervention  Environmentally sustainable strategies
  • 34.
    Technological Environment Changes rapidly. Createsnew markets and opportunities. Challenge is to make practical, affordable products. Safety regulations result in higher research costs & longer time between conceptualization and introduction of product.
  • 35.
    Political Environment Includes Laws,Government Agencies, and Pressure Groups that Influence or Limit Various Organizations In a Given Society. Areas of concern: Increasing legislation Changing government agency enforcement Increased emphasis on ethics and socially responsible behavior
  • 36.
    Cultural Environment The institutionsand other forces that affect a society’s basic values, perceptions, preference, and behaviors. Core beliefs and values are passed on from parents to children and are reinforced by schools, churches, business, and government. Secondary beliefs and values are more open to change.
  • 37.
    Responding to theMarketing Environment  Environmental Management Perspective Taking a proactive approach to managing the environment by taking aggressive (rather than reactive) actions to affect the publics and forces in the marketing environment.
  • 39.
    Consumer Environmental Segments Genuine Greens  Not Me Greens  Go-with-the-Flow Greens  Dream Greens  Business First Greens  Mean Greens Copyright © 2013 Dorling Kindersley (India) Pvt Ltd. Authorized adaptation from the United States edition of Marketing Management, 14e.