
Download to read offline

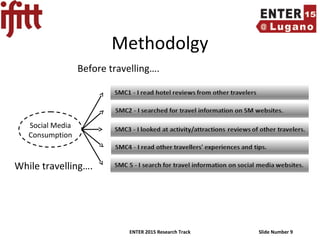
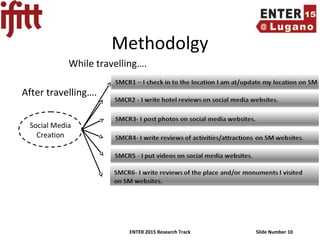
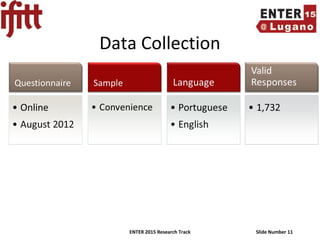

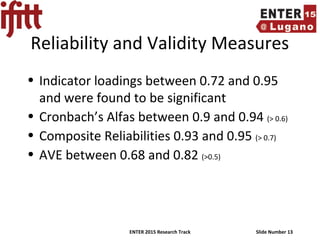
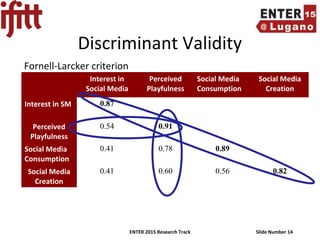
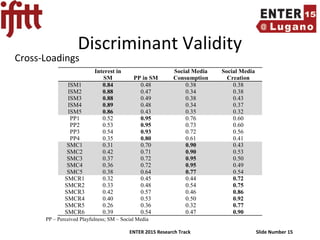
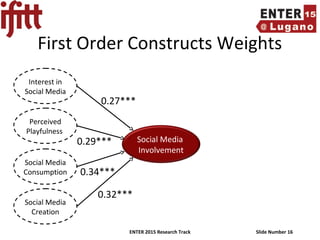

The document presents a study aimed at developing a measure to assess travelers' involvement with travel social media, highlighting the significance of social media in travel decision-making. It discusses the methodology for validating the instrument used in the study, including confirmatory factor analysis to ensure reliability and validity. Ultimately, the findings indicate that social media involvement is a multidimensional construct that can inform online personalization and segmentation strategies for travelers.


