SlideShare a Scribd company logo
New Laws Spur Market Growth
States increasingly are authorizing the use of alternative delivery to help
cash-strapped agencies build more efficiently By Gary J. Tulacz
Overview p. 40 // Design-Build Revenue p. 40 // CM-at-Risk Revenue p. 41 // 2016 Design-Build State Laws p. 42
Design-Build Total Revenue 2013-2015 p. 42 // CM-at-Risk Total Revenue 2013-2015 p. 42 // The ENR Top 100
Design-Build Firms List p. 43 // The ENR Top 100 Construction Management-at-Risk Firms List p. 44
PHOTOCOURTESYOFPCLCONSTRUCTIONENTERPRISES
enr.com June 13, 2016  ENR  39
NUMBER19TRAIN TO THE PLANE
PCL Construction Enterprises is
the design-builder on the South
200th Link Extension project, a
1.6-mile extension of the elevated
light-rail system to Sea-Tac
Airport in Seattle.
PROJECT DELIVERY FIRMS
ENR06132016_Top100PDF_Opener.indd 39 6/6/16 1:53 PM
2007
$53.75
2007
$29.68
2008
$64.42
2008
$33.19
$ BILLIONS DOMESTIC REVENUE INTERNATIONAL REVENUE
2009
$59.33
2010
$50.23
2010
$28.01
2011
$54.68
2011
$37.37
2012
$56.56
2012
$47.33
2013
$60.92
2013
$47.87
2014
$69.26
2014
$40.32
2015
$72.74
2015
$34.432009
$30.10
As the overall market continues to grow in the U.S.,
so has the market for alternative project delivery. Own-
ers increasingly have been looking for means to
squeeze conflicts and inefficiencies out of the construc-
tion process and see the old system of looking for the
lowest first costs in the traditional design-bid-build
procurement process as failing to address these con-
cerns. This dissatisfaction with the old delivery systems
is shown by the growing volume of state legislation
authorizing public agencies to use alternative project
delivery methods.
The market for alternative project delivery in 2015
also mirrors the global construction market, as can be
seen in the rankings of ENR’s Top 100 Construction
Management-at-Risk (CMR) Firms and Top 100
Design-Build (DB) Firms. The Top 100 CMR firms
had a combined revenue from CMR of $102.97 billion
in 2015, down 1.0% from the $103.98 billion reported
by the group in 2014.
But what is striking in the numbers is that CMR
revenue from international projects in 2015 for the
Top 100 dropped 40.2%, to $10.30 billion from $17.21
billion, in 2014. In the domestic market, CMR rose
6.8%, to a record $92.67 billion, in 2015.
The DB list provides a similar contrast between
domestic and international project delivery: Overall,
the Top 100 DB firms had total revenue of $107.21
billion in 2015, down 2.2% from 2014; revenue from
domestic DB projects grew a healthy 5.0%, rising to
$72.74 billion, in 2015. On the other hand, interna-
tional DB revenue dropped 14.6% in 2015, thanks in
part to a falloff in huge engineering-procurement-
construction projects in the international mining,
power and petroleum markets.
Domestic Design-Build Rises
Alternative project delivery options such as design-
build and public-private partnerships continue to be
an evolving part of construction. “Inevitably, it is all
about creating partnerships that share in a risk-reward
scenario that drives everyone to do their best work.
We are regularly partnering with contractors to pursue
large-scale opportunities,” says John Jastrem, CEO of
Arcadis North America. He notes that Arcadis was part
of the team that delivered the massive Carlsbad De-
salination Plant using a design-build-operate-finance
project delivery approach (see ENR 10/21/13 p. 32).
Public Agency Growth
Many firms comment that alternate project delivery is
getting increased attention from owners—especially
in the public-sector markets, long bastions of tradi-
tional design-bid-build. For example, legislation
authorizing alternative approaches to project delivery
by public agencies has flourished over the past decade.
Transportation agencies have been particular benefi-
ciaries (see p. 24).
Agencies in a broad variety of sectors have gained
from this enabling legislation. In 2015, 70% of the
state bills to expand the use of design-build in the pub-
lic sector that were supported by the Design-Build
Institute of America, Washington, D.C., were passed,
says Lisa Washington, DBIA’s CEO. “Missouri just
became the 25th state to pass a law granting full au-
thorization for public agencies to use design-build,”
she notes.
The long-term lack of a federal highway bill and
uncertain infrastructure funding has forced public
agencies to seek ways to streamline their procurement
and project delivery processes. These factors have
“Inevitably, it is
all about
creating
partnerships
that share in a
risk-reward
scenario that
drives
everyone to do
their best
work.”
John Jastrem,
CEO, Arcadis
North America
THE TOP 100 PROJECT DELIVERY FIRMS #57
MESSER CONSTRUCTION recently
won an integrated project delivery
contract for Riley Hospital for Children at
Indiana University Health, Indianapolis.
40 Ⅲ ENR Ⅲ June 13, 2016 enr.com
SOURCE: DODGE DATA & ANALYTICS/ENR
ENR06132016TL_PDF_Overview.indd 40 6/6/16 2:30 PM
OVERVIEW
2007
$79.23
2007
$10.55
2008
$87.74
2008
$15.60
$ BILLIONS DOMESTIC REVENUE INTERNATIONAL REVENUE
2009
$73.87
2010
$63.97
2010
$14.35
2011
$64.19
2011
$19.19
2012
$70.89
2012
$20.63
2013
$77.83
2013
$19.01
2014
$86.77
2014
$17.21
2015
$92.67
2015
$10.30
2009
$15.47
created more opportunities for alternative delivery
methods, such as public-private partnerships (P3s) and
design-build, and forced all parties to work closer to-
gether. “Stronger relationships with contractors, con-
cessionaires, the financial community and other stake-
holders are no longer an option but a requirement,”
says Nick DeNichilo, CEO of Mott MacDonald,
North America, an Iselin, N.J.-based engineering firm.
While many designers resisted what they perceived
as design-build’s usurpation of their traditional role in
shaping the project’s concept and overseeing construc-
tion, many have embraced the team concept associated
with alternative project delivery. “With the fact that
design-build and CM-at-risk have dominated the de-
livery process for the past 15 or 20 years, the contrac-
tor has necessarily become a strategic partner,” says
Mike Medici, president of Detroit-based architect-
engineer SmithGroupJJR. “I truly believe that focusing
on collaboration is head and shoulders above the tra-
ditional design-bid-build process,” he says.
These enabling laws have paid dividends to firms
experienced in alternative project delivery. “In Ohio,
our clients have many delivery methods to choose
from. We see this as a positive for clients and our
organization,” says Brian Burgett, CEO of Kokosing
Inc. Kokosing currently is building a $98-million
wastewater facility for the city of Euclid, the largest-
ever CMR treatment facility to be let in Ohio, he says.
“We continue to see significant change in project
delivery in the water and wastewater-treatment
market,” says Kevin McCarthy, CEO of PC Construc-
tion. He says these markets used to be dominated by
design-bid-build projects, with owners seeking out the
lowest cost. “Now, they are seeing the benefits that
DomesticCM-at-RiskTopsRecord
design-build and construction management-at-risk
delivery provide.” PC Construction is working as a
CMR contractor for the city of Atlanta’s water-supply
program, the Charleston, S.C., water system and in-
frastructure projects for Paulding County, Ga..
Many firms formerly thought of primarily as design-
ers have developed their own in-house construction
capabilities and now are embracing their role as an inte-
grated design-builder. “Our ability to merge the tradi-
tionally separate build and design roles into a seamless
integrated team has proven to be a valuable service for
our clients,” says Greg Carlson, vice president of Burns
& McDonnell. Since these services are from a single
source, the firm is able to provide the flexibility to quickly
adapt and expedite critical-path items—design decisions,
permitting and staffing needs, for example—to achieve
aggressive schedules and budgets, Carlson says.
Concerns
Alternative project delivery has raised concerns. Some
design firms say that, when developing a project, own-
ers are looking more toward contractors, rather than
design firms. “In certain market sectors and in certain
regions, clients go to contractors first, and then design
teams work through contractors,” says Kevin Hydes,
CEO of Integral Group, an Oakland, Calif.-based en-
gineering firm. “Typically, a lot of clients in the tech
sector go that route.” To ensure their continued impact
on projects, it is important for design firms to develop
strong ties with contractors and owners, he notes.
Design firms worry about the legal implications of
design under processes such as design-build. The po-
tential shift in responsibility for design services from
the traditional design consultant to the contractor un-
“A troubling
trend is that
owners are
trying to get
more
sophisticated,
getting into
P3s or other
alternative
methods of
procurement
that they don’t
understand.
What happens
is, the risk is all
getting shoved
down to the
contractor
level.”
Bob Alger, CEO,
Lane
Construction
#20
SKANSKA USA recently completed a
new clinic for the Palo Alto Medical
Foundation, an integrated project
delivery project in San Carlos, Calif.
enr.com June 13, 2016 Ⅲ ENR Ⅲ 41
SOURCE: DODGE DATA & ANALYTICS/ENR
ENR06132016TL_PDF_Overview.indd 41 6/6/16 2:30 PM
der design-build and the emerging integrated project
delivery models create “contractually gray areas that
are presenting themselves and require cooperation and
creative solutions,” says Philip M. Davis, senior vice
president of architecture for Fishbeck, Thompson,
Carr & Huber Inc., a Grand Rapids, Mich.-based
architectural and engineering firm.
Risky Business
Many owners see alternative project delivery as a
means of limiting their risk on a project. However,
risk-shifting is a double-edged sword. Alternative proj-
ect delivery may help to mitigate some risks by foster-
ing teamwork, but no process can eliminate all risk.
Owners may not understand that shifting risk to the
contractor or the design-build team comes at a price.
Many firms engaged in alternative project delivery
say owners need to understand the cost of risk. “A trou-
bling trend is that owners are trying to get more
sophisticated, getting into P3s or other alternative
methods of procurement that they don’t understand.
What happens is, the risk is all getting shoved down to
the contractor level … with onerous contract terms
like consequential damages and the like. Then, when
you try to price that risk, the owner says your price is
too high. We need to find a balance between price and
risk,” says Bob Alger, CEO of Lane Construction.
Washington of DBIA stresses that understanding
the process is the key to making design-build success-
ful, particularly for owners. “It’s all about education.
People have to understand the elements of design-
build done right,” she says.
To address the issue of education, DBIA has intro-
duced a series of best-practices guides, says Washington.
2016 Design-Build State Laws
She notes that DBIA produced a general guide to
design-build best practices early in 2015 but now is is-
suing a series of market-specific guides. “We came out
with our best-practices guide for the federal sector last
August, then one for the water and wastewater markets
in January and one for transportation in March.”
Progressive Design-Build
Many firms note the increased use of design-assist, a
process that brings in the contracting team early to
assist the design team in planning out the project. “We
are finding that the increasing need for design-assist
or other very early trade input on projects is promot-
ing much deeper relationships with the subset of sub-
contractors that are able to successfully collaborate
within teams and add value during the preconstruction
and planning phase,” says Steven F. Roznowski, CEO
of The Christman Co.
Washington of DBIA says there is a growing trend
to extend this design-assist concept into the use of
design-build; this method is called progressive design-
build. A design-build team is brought in early in the
design process to work closely with the owner on spec-
ification and equipment selection. Once the design is
about 35% complete, the design-build team offers a
guaranteed maximum price.
“This approach has become more common in the
water and wastewater sectors, where complicated
equipment selection is required early on,” says Wash-
ington. She says this approach gives owners greater
input into the design without sacrificing the collabora-
tion and single point of responsibility inherent in
design-build. “It also requires a qualifications-based
selection process to be the most effective,” she says. Ⅲ
“It’s all about
education.
People need to
understand the
elements of
design-build
done right.”
Lisa Washington,
CEO, Design-
Build Institute of
America
THE TOP 100 PROJECT DELIVERY FIRMS OVERVIEW#40
ROBINS & MORTON is the CMR for
the new $187-million, 534,000-sq-ft
replacement Baptist North Mississippi
Hospital in Oxford, Miss.
Design-build is permitted
by all agencies for all types
of design and construction
Design-build is limited to one
political subdivision, e.g., agency
commission, or special project
Design-build is
widely permitted
Design-build is
a limited option
SOURCE: DESIGN-BUILD INSTITUTE OF AMERICA, 2016
IL
WA
OR
CA
NV
ID
WY
UT
NE
SD
ND
MN
WI
OH
MI
NY
TX
MO
AL
SC
FL
KY
NC
ME
IN
LA
MS
TN
GA
AZ
OK
AR
AK
WV
KS
MT
CO
NM
PA
VA
IA
NJ
MD
DE
DC
HI
CT
RI
VT
NH
MA
CM-AT-RISK
2013 $96.84
DESIGN-BUILD
2013 $108.79
CM-AT-RISK
2014 $103.98
DESIGN-BUILD
2014 $109.59
$ BILLIONS
CM-AT-RISK
2015 $102.97
DESIGN-BUILD
2015 $107.21
42 Ⅲ ENR Ⅲ June 13, 2016 enr.com
ENR06132016TL_PDF_Overview.indd 42 6/6/16 2:30 PM
The Top 100 Design-Build Firms
COMPANIES ARE RANKED IN $ MILLIONS BASED ON 2015 REVENUE FROM DESIGN-BUILD CONTRACTS WHERE THE PROJECT IS DESIGNED BY EMPLOYEES OF THE FIRM OR JOINT-VENTURE PARTNER AND BUILT BY ITS OWN FORCE OR SUBCONTRACTORS
UNDER ITS SUPERVISION. **NOT RANKED IN 2015 AMONG THE TOP DESIGN-BUILD FIRMS.
THE TOP 100 PROJECT DELIVERY FIRMS #31
GRAY CONSTRUCTION is the
design-builder on the 578,742-sq-ft
Clemens Food Group pork-processing
facility in Coldwater, Mich.
enr.com June 13, 2016  ENR  43
RANK TOTAL REV. DOMESTIC INTER-
2016 2015 FIRM ($ MIL.) REVENUE NATIONAL
1 1 BECHTEL, San Francisco, Calif. 17,417.0 6,517.0 10,900.0
2 2 FLUOR CORP., Irving, Texas 11,552.2 4,484.6 7,067.6
3 3 CB&I INC., The Woodlands, Texas 10,446.1 6,907.3 3,538.8
4 4 JACOBS, Pasadena, Calif. 8,470.0 4,190.0 4,280.0
5 5 KIEWIT CORP., Omaha, Neb. 5,768.9 4,747.8 1,021.1
6 6 KBR, Houston, Texas 3,238.4 911.5 2,326.9
7 8 THE WALSH GROUP LTD., Chicago, Ill. 2,144.4 2,144.4 0.0
8 20 ZACHRY GROUP, San Antonio, Texas 1,991.0 1,991.0 0.0
9 7 WHITING-TURNER CONTRACTING, Baltimore, Md. 1,797.9 1,797.9 0.0
10 9 BLACK & VEATCH, Overland Park, Kan. 1,577.8 1,074.6 503.2
11 13 BURNS & MCDONNELL, Kansas City, Mo. 1,486.7 1,321.6 165.2
12 21 SWINERTON INC., San Francisco, Calif. 1,457.0 1,457.0 0.0
13 11 MATRIX SERVICE CO., Tulsa, Okla. 1,321.4 1,175.6 145.8
14 18 MORTENSON CONSTRUCTION, Minneapolis, Minn. 1,288.9 1,242.1 46.8
15 17 CLAYCO INC., Chicago, Ill. 1,282.5 1,282.5 0.0
16 19 CLARK GROUP, Bethesda, Md. 1,180.0 1,180.0 0.0
17 23 BABCOCK & WILCOX ENTERPR., Charlotte, N.C. 1,164.9 480.1 684.8
18 10 HENSEL PHELPS, Greeley, Colo. 1,154.4 952.4 202.0
19 16 PCL CONSTRUCTION ENTERPRISES, Denver, Colo. 1,110.9 33.5 1,077.5
20 24 SKANSKA USA, New York, N.Y. 1,103.6 1,103.1 0.0
21 25 MCCARTHY HOLDINGS INC., St. Louis, Mo. 1,018.0 1,018.0 0.0
22 14 BALFOUR BEATTY US, Dallas, Texas 1,006.6 977.2 0.0
23 22 CH2M, Englewood, Colo. 992.6 672.7 319.9
24 ** M+W GROUP, Albany, N.Y. 990.0 990.0 0.0
25 26 THE TURNER CORP., New York, N.Y. 871.4 859.3 12.1
26 15 FERROVIAL US CONSTRUCTION, Austin, Texas 815.0 815.0 0.0
27 58 AMEC FOSTER WHEELER, Tucker, Ga. 813.0 708.0 105.0
28 27 ARCO CONSTRUCTION COS., St. Louis, Mo. 773.9 773.8 0.0
29 29 RYAN COS. US INC., Minneapolis, Minn. 712.0 712.0 0.0
30 32 S&B ENG’RS & CONSTRUCTORS, Houston, Texas 700.3 700.3 0.0
31 43 GRAY CONSTRUCTION, Lexington, Ky. 660.0 660.0 0.0
32 31 GRANITE CONSTRUCTION INC., Watsonville, Calif. 649.0 649.0 0.0
33 75 LEIDOS, Reston, Va. 648.4 648.4 0.0
34 55 JE DUNN CONSTRUCTION, Kansas City, Mo. 629.6 629.6 0.0
35 38 HANOVER RS CONSTRUCTION, Houston, Texas 620.0 620.0 0.0
36 45 ALSTON CONSTRUCTION CO., Sacramento, Calif. 576.0 576.0 0.0
37 39 BL HARBERT INTERNATIONAL, Birmingham, Ala. 525.3 83.0 442.3
38 49 BARTON MALOW CO., Southfield, Mich. 500.0 500.0 0.0
39 30 WALBRIDGE, Detroit, Mich. 482.4 266.4 216.0
40 37 PARSONS, Pasadena, Calif. 477.2 426.3 50.9
41 34 HASKELL, Jacksonville, Fla. 476.2 454.6 21.6
42 ** AECOM, Los Angeles, Calif. 451.9 451.9 0.0
43 ** HOFFMAN CORP., Portland, Ore. 440.0 440.0 0.0
44 71 DPR CONSTRUCTION, Redwood City, Calif. 412.8 412.8 0.0
45 50 CDM SMITH, Boston, Mass. 410.6 384.6 26.0
46 61 DEVCON CONSTRUCTION INC., Milpitas, Calif. 405.0 405.0 0.0
47 48 DEACON CORP., Citrus Heights, Calif. 398.5 398.5 0.0
48 56 OHL USA INC., College Point, N.Y. 391.4 139.5 251.9
49 57 THE BECK GROUP, Dallas, Texas 376.8 376.8 0.0
50 ** SHIMIZU NORTH AMERICA LLC, Atlanta, Ga. 375.0 273.0 102.0
RANK TOTAL REV. DOMESTIC INTER-
2016 2015 FIRM ($ MIL.) REVENUE NATIONAL
51 33 DUKE CONSTRUCTION, Indianapolis, Ind. 368.7 368.7 0.0
52 46 FLATIRON CONSTR. CORP., Broomfield, Colo. 366.0 143.5 222.5
53 ** TUTOR PERINI CORP., Sylmar, Calif. 365.6 323.4 42.2
54 52 GEMMA POWER SYSTEMS, Glastonbury, Conn. 360.3 360.3 0.0
55 42 LANE INDUSTRIES INC., Cheshire, Conn. 336.2 336.2 0.0
56 91 AUSTIN INDUSTRIES, Dallas, Texas 322.5 322.5 0.0
57 62 MESSER CONSTRUCTION CO., Cincinnati, Ohio 319.5 319.5 0.0
58 53 THE MCSHANE COS., Rosemont, Ill. 316.8 316.8 0.0
59 73 GILBANE BUILDING CO., Providence, R.I. 316.2 274.4 41.8
60 68 TRAYLOR BROS. INC., Evansville, Ind. 314.5 314.5 0.0
61 64 ZACHRY CONSTRUCTION, San Antonio, Texas 312.0 312.0 0.0
62 ** LPCIMINELLI INC., Buffalo, N.Y. 309.6 309.6 0.0
63 ** MWH GLOBAL, Broomfield, Colo. 299.0 50.4 248.6
64 67 AMERICAN BRIDGE CO., Coraopolis, Pa. 293.4 232.0 61.4
65 60 LENDLEASE, New York, N.Y. 283.7 283.7 0.0
66 ** HERZOG FAMILY OF COS., St. Joseph, Mo. 280.7 274.6 6.1
67 74 KLINGER COS. INC., Sioux City, Iowa 280.0 280.0 0.0
68 ** XL CONSTRUCTION CORP., Milpitas, Calif. 275.0 275.0 0.0
69 93 TRANSCORE, Nashville, Tenn. 268.4 257.6 10.8
70 ** DOME CONSTR. CORP., So. San Francisco, Calif. 251.0 251.0 0.0
71 87 BBL CONSTRUCTION SERVICES LLC, Albany, N.Y. 249.6 249.6 0.0
72 47 DENNIS ENGINEERING GROUP, Springfield, Mass. 247.8 247.8 0.0
73 ** BIG-D CONSTRUCTION CORP., Salt Lake City, Utah 245.6 245.6 0.0
74 ** CAHILL CONTRACTORS INC., San Francisco, Calif. 236.0 236.0 0.0
75 81 CADDELL CONSTRUCTION CO., Montgomery, Ala. 231.9 46.0 185.9
76 ** FAGEN INC., Granite Falls, Minn. 228.7 228.7 0.0
77 78 CONTINENTAL BUILDING SYS., Columbus, Ohio 223.1 223.1 0.0
78 54 H&M CO. INC., Jackson, Tenn. 218.0 218.0 0.0
79 70 ARCADIS/CALLISONRTKL, Highlands Ranch, Colo. 212.0 192.0 20.0
80 77 ODEBRECHT CONSTRUCTION, Coral Gables, Fla. 210.0 210.0 0.0
81 66 STRUCTURE TONE, New York, N.Y. 210.0 125.0 85.0
82 ** PRIMUS BUILDERS INC., Woodstock, Ga. 193.0 193.0 0.0
83 63 VCC LLC, Irving, Texas 189.3 189.3 0.0
84 99 SUNDT CONSTRUCTION INC., Tempe, Ariz. 187.3 187.3 0.0
85 ** CORVAL GROUP INC., St. Paul, Minn. 187.0 187.0 0.0
86 ** ELECTRICAL CONSULTANTS INC., Billings, Mont. 174.3 174.3 0.0
87 ** JINGOLI-DCO, Lawrenceville, N.J. 170.0 170.0 0.0
88 ** PRO CON INC., Hooksett, N.H. 165.6 165.6 0.0
89 90 SHIMMICK CONSTRUCTION CO., Oakland, Calif. 164.3 164.3 0.0
90 83 CAROTHERS CONSTRUCTION, Oxford, Miss. 160.0 160.0 0.0
91 ** LAUREN ENG’S & CONSTRUCTORS, Abilene, Texas 155.8 155.8 0.0
92 ** LAYTON CONSTRUCTION CO. LLC, Sandy, Utah 147.0 147.0 0.0
93 ** THE HUBBARD GROUP INC., Orlando, Fla. 145.1 145.1 0.0
94 ** ROSENBERGER CONSTR., Sugar Land, Texas 139.1 139.1 0.0
95 95 CONSIGLI BUILDING GROUP INC., Milford, Mass. 135.3 135.3 0.0
96 ** POWER CONSTRUCTION CO. LLC, Chicago, Ill. 122.5 122.5 0.0
97 ** DAVID E. HARVEY BUILDERS, Houston, Texas 120.0 120.0 0.0
98 ** BERNARDS, San Fernando, Calif. 116.7 116.7 0.0
99 ** THE WEITZ CO., Des Moines, Iowa 114.7 114.7 0.0
100 ** LEVEL 10 CONSTRUCTION, Sunnyvale, Calif. 114.5 114.5 0.0
ENR06132016Top100_PDF_List.indd 43 6/6/16 1:52 PM
Construction Management-at-Risk Firms
BASED ON 2015 REVENUE IN $ MILLIONS FROM “AT RISK” CONSTRUCTION MANAGEMENT OR PROJECT AND PROGRAM CONTRACTS IN WHICH A FIRM IS EXPOSED TO FINANCIAL RESPONSIBILITIES AND RISK SIMILAR TO THOSE OF A GENERAL CONTRACTOR
**=NOT RANKED IN 2015 AMONG THE TOP 100 CM FIRMS-AT-RISK.
THE TOP 100 PROJECT DELIVERY FIRMS #70
THE CHRISTMAN CO. is CM on the
$271-million medical-center project
for Mercy Health in Muskegon, Mich.
RANK TOTAL REV. INTER-
NATIONAL2016 2015 FIRM ($ MIL.)
1 1 THE TURNER CORP., New York, N.Y. 9,683.2 719.9
2 2 BECHTEL, San Francisco, Calif. 6,970.0 6,916.0
3 5 SKANSKA USA, New York, N.Y. 3,684.6 2.8
4 ** AECOM, Los Angeles, Calif. 3,233.4 0.0
5 8 STRUCTURE TONE, New York, N.Y. 3,098.2 123.2
6 6 GILBANE BUILDING CO., Providence, R.I. 3,093.3 214.7
7 7 BALFOUR BEATTY US, Dallas, Texas 2,944.6 0.0
8 9 THE WHITING-TURNER CONTRACTING CO., Baltimore, Md. 2,704.4 0.0
9 12 LENDLEASE, New York, N.Y. 2,689.1 43.1
10 11 DPR CONSTRUCTION, Redwood City, Calif. 2,660.0 0.0
11 14 SUFFOLK CONSTRUCTION CO., Boston, Mass. 2,481.0 0.0
12 10 PCL CONSTRUCTION ENTERPRISES INC., Denver, Colo. 2,174.8 1,555.7
13 13 JE DUNN CONSTRUCTION, Kansas City, Mo. 2,164.4 0.0
14 15 MORTENSON CONSTRUCTION, Minneapolis, Minn. 2,138.0 0.0
15 51 CLARK GROUP, Bethesda, Md. 2,019.0 0.0
16 17 HOLDER CONSTRUCTION CO., Atlanta, Ga. 2,017.0 0.0
17 16 MCCARTHY HOLDINGS INC., St. Louis, Mo. 1,789.0 0.0
18 20 DAVID E. HARVEY BUILDERS, Houston, Texas 1,650.0 0.0
19 28 SWINERTON INC., San Francisco, Calif. 1,477.0 0.0
20 19 KBR, Houston, Texas 1,280.7 130.8
21 27 WEBCOR BUILDERS, San Francisco, Calif. 1,207.8 0.0
22 22 BARTON MALOW CO., Southfield, Mich. 1,161.5 33.8
23 34 HUNTER ROBERTS CONSTRUCTION GRP., New York, N.Y. 1,139.0 0.0
24 ** HATHAWAY DINWIDDIE CONSTR., San Francisco, Calif. 1,098.0 0.0
25 26 HITT CONTRACTING INC., Falls Church, Va. 1,082.8 0.0
26 23 CHINA CONSTR. AMER./PLAZA CONSTR., Jersey City, N.J. 1,075.0 0.0
27 46 ALBERICI-FLINTCO, St. Louis, Mo. 1,050.2 282.6
28 41 LAYTON CONSTRUCTION CO. LLC, Sandy, Utah 1,029.4 0.0
29 25 SHAWMUT DESIGN AND CONSTRUCTION, Boston, Mass. 905.6 0.0
30 18 HOFFMAN CORP., Portland, Ore. 894.0 0.0
31 47 PEPPER CONSTRUCTION GROUP, Chicago, Ill. 893.9 0.0
32 31 COASTAL CONSTRUCTION GROUP, Miami, Fla. 885.0 0.0
33 32 MANHATTAN CONSTRUCTION GROUP, Naples, Fla. 862.7 0.0
34 49 EMJ CORP., Chattanooga, Tenn. 840.0 6.0
35 33 AVALONBAY COMMUNITIES INC., Arlington, Va. 815.6 0.0
36 57 THE BECK GROUP, Dallas, Texas 780.0 39.6
37 39 CONSIGLI BUILDING GROUP INC., Milford, Mass. 779.5 0.0
38 29 POWER CONSTRUCTION CO. LLC, Chicago, Ill. 768.0 0.0
39 54 TELLEPSEN, Houston, Texas 715.0 0.0
40 45 ROBINS & MORTON, Birmingham, Ala. 701.4 0.0
41 37 MESSER CONSTRUCTION CO., Cincinnati, Ohio 693.5 0.0
42 36 CHOATE CONSTRUCTION CO., Atlanta, Ga. 677.7 0.0
43 38 LEVEL 10 CONSTRUCTION, Sunnyvale, Calif. 676.4 0.0
44 ** AUSTIN INDUSTRIES, Dallas, Texas 670.4 0.0
45 48 KIEWIT CORP., Omaha, Neb. 635.4 0.0
46 43 KRAUS-ANDERSON CONSTRUCTION, Minneapolis, Minn. 634.0 0.0
47 56 HOAR CONSTRUCTION, Birmingham, Ala. 624.2 0.0
48 70 OKLAND CONSTRUCTION CO. INC., Salt Lake City, Utah 581.0 0.0
49 60 GLY CONSTRUCTION, Bellevue, Wash. 562.0 0.0
50 44 CLUNE CONSTRUCTION CO., Chicago, Ill. 540.6 0.0
RANK TOTAL REV. INTER-
NATIONAL2016 2015 FIRM ($ MIL.)
51 63 SUNDT CONSTRUCTION INC., Tempe, Ariz. 526.1 0.0
52 61 C.W. DRIVER COS., Pasadena, Calif. 517.8 0.0
53 53 THE BOLDT CO., Appleton, Wis. 497.5 0.0
54 ** LEASE CRUTCHER LEWIS, Seattle, Wash. 497.3 0.0
55 55 JACOBSEN CONSTRUCTION CO. INC., Salt Lake City, Utah 494.0 10.0
56 59 MCGOUGH, St. Paul, Minn. 477.0 0.0
57 58 LEE LEWIS CONSTRUCTION, Lubbock, Texas 475.0 0.0
58 30 HENSEL PHELPS, Greeley, Colo. 473.1 0.0
59 3 FLUOR CORP., Irving, Texas 455.1 175.6
60 ** FORTIS CONSTRUCTION INC., Portland, Ore. 444.0 0.0
61 85 THE WALSH GROUP LTD., Chicago, Ill. 437.8 20.3
62 62 O’NEIL INDUSTRIES INC., Chicago, Ill. 430.5 0.0
63 84 INTECH CONSTRUCTION LLC, Philadelphia, Pa. 430.0 0.0
64 87 WEIS BUILDERS INC., Minneapolis, Minn. 406.7 0.0
65 82 BARTLETT COCKE GEN’L CONTRACTORS, San Antonio, Texas 406.4 0.0
66 52 WALBRIDGE, Detroit, Mich. 402.6 13.6
67 75 BUILD GROUP INC., San Francisco, Calif. 401.7 0.0
68 66 KITCHELL CORP., Phoenix, Ariz. 390.0 0.0
69 65 GE JOHNSON CONSTRUCTION CO., Colorado Springs, Colo. 386.0 0.0
70 67 THE CHRISTMAN CO., Lansing, Mich. 380.8 0.0
71 42 THE YATES COS. INC., Philadelphia, Miss. 378.2 0.0
72 ** THE PIKE COS. LTD., Rochester, N.Y. 362.0 0.0
73 78 J.H. FINDORFF & SON INC., Madison, Wis. 354.0 0.0
74 77 HILL & WILKINSON GENERAL CONTR., Richardson, Texas 353.9 0.0
75 69 DIMEO CONSTRUCTION CO., Providence, R.I. 347.4 0.0
76 80 THE PENTA BUILDING GROUP, Las Vegas, Nev. 344.4 0.0
77 ** KNUTSON CONSTRUCTION, St. Louis Park, Minn. 332.0 0.0
78 ** T.G. NICKEL & ASSOCIATES LLC, Ronkonkoma, N.Y. 321.2 0.0
79 89 RODGERS BUILDERS INC., Charlotte, N.C. 319.5 0.0
80 74 SAUNDERS CONSTRUCTION INC., Centennial, Colo. 319.0 0.0
81 71 LECHASE CONSTRUCTION SERVICES LLC, Rochester, N.Y. 315.0 0.0
82 ** JAMES R. VANNOY & SONS CONSTR., Jefferson, N.C. 314.0 0.0
83 ** JOERIS GENERAL CONTRACTORS LTD., San Antonio, Texas 313.2 0.0
84 73 LPCIMINELLI INC., Buffalo, N.Y. 304.6 0.0
85 ** BNBT BUILDERS INC., Redwood City, Calif. 300.0 0.0
86 ** JORDAN FOSTER CONSTRUCTION LLC, El Paso, Texas 297.0 0.0
87 ** IMC CONSTRUCTION, Malvern, Pa. 290.0 0.0
88 91 J.P. CULLEN & SONS INC., Janesville, Wis. 289.9 0.0
89 94 PLANT CONSTRUCTION CO. LP, San Francisco, Calif. 289.3 0.0
90 ** SKENDER CONSTRUCTION, Chicago, Ill. 287.0 0.0
91 ** ENGINEERED STRUCTURES INC. (ESI), Meridian, Idaho 285.4 0.0
92 ** KAST CONSTRUCTION CO. LLC, West Palm Beach, Fla. 276.4 0.0
93 96 BARR & BARR INC., New York, N.Y. 274.6 0.0
94 21 M+W GROUP, Albany, N.Y. 271.1 12.0
95 72 BIG-D CONSTRUCTION CORP., Salt Lake City, Utah 266.5 0.0
96 ** COMMODORE BUILDERS, Waltham, Mass. 263.0 0.0
97 92 DELLBROOK/JK SCANLAN, Quincy, Mass. 260.7 0.0
98 ** NEW SOUTH CONSTRUCTION CO. INC., Atlanta, Ga. 259.5 0.0
99 81 SPAWGLASS HOLDING LP, Selma, Texas 259.5 0.0
100 ** W.M. JORDAN CO., Newport News, Va. 259.0 0.0
44  ENR  June 13, 2016 enr.com
ENR06132016Top100_PDF_List.indd 44 6/6/16 1:52 PM

More Related Content

What's hot

The Demands on Auto Suppliers
The Demands on Auto SuppliersThe Demands on Auto Suppliers
The Demands on Auto Suppliers
Strategy&, a member of the PwC network
 
The New Game of Global Tech
The New Game of Global TechThe New Game of Global Tech
The New Game of Global Tech
Strategy&, a member of the PwC network
 
Construction Sector| Canada| December 2018
Construction Sector| Canada| December 2018Construction Sector| Canada| December 2018
Construction Sector| Canada| December 2018
paul young cpa, cga
 
perspectives-on-the-2016-energy-industry-landscape
perspectives-on-the-2016-energy-industry-landscapeperspectives-on-the-2016-energy-industry-landscape
perspectives-on-the-2016-energy-industry-landscapeKaren Iris Tucker
 
Creating new demand for gas
Creating new demand for gasCreating new demand for gas
Creating new demand for gas
EY
 
Detroit Auto Show
Detroit Auto ShowDetroit Auto Show
Detroit Auto Show
philbiggs
 
IMARK NOW Summer LEDs and the Future
IMARK NOW Summer LEDs and the FutureIMARK NOW Summer LEDs and the Future
IMARK NOW Summer LEDs and the Futuretkonnerth
 
2020 tech talent july
2020 tech talent july2020 tech talent july
2020 tech talent july
KarthikThirukondaPMP
 
Wentworth Institute 2010
Wentworth Institute 2010Wentworth Institute 2010
Wentworth Institute 2010
Greg Page
 
The Outcome Economy
The Outcome EconomyThe Outcome Economy
The Outcome Economy
Helge Tennø
 
U.S. construction trends and outlook (Q2 2015)
U.S. construction trends and outlook (Q2 2015)U.S. construction trends and outlook (Q2 2015)
U.S. construction trends and outlook (Q2 2015)
JLL
 
Digital_Whitepaper_EC&O_final_v2
Digital_Whitepaper_EC&O_final_v2Digital_Whitepaper_EC&O_final_v2
Digital_Whitepaper_EC&O_final_v2Michael Shomberg
 
America’s Real Manufacturing Advantage
America’s Real Manufacturing AdvantageAmerica’s Real Manufacturing Advantage
America’s Real Manufacturing Advantage
Strategy&, a member of the PwC network
 
Monthly Economic Update | June 2013
Monthly Economic Update | June 2013Monthly Economic Update | June 2013
Monthly Economic Update | June 2013One Columbus
 
3 Ways the Shale Boom Will Impact the Trucking Industry
3 Ways the Shale Boom Will Impact the Trucking Industry3 Ways the Shale Boom Will Impact the Trucking Industry
3 Ways the Shale Boom Will Impact the Trucking Industry
Marcellus Drilling News
 
U.S. construction trends and outlook (Q1 2015)
U.S. construction trends and outlook (Q1 2015)U.S. construction trends and outlook (Q1 2015)
U.S. construction trends and outlook (Q1 2015)
JLL
 
Impact of the Manufacturing Renaissance from Energy Intensive Sectors
Impact of the Manufacturing Renaissance from Energy Intensive SectorsImpact of the Manufacturing Renaissance from Energy Intensive Sectors
Impact of the Manufacturing Renaissance from Energy Intensive Sectors
Marcellus Drilling News
 
Industry 4.0 and the Innovation Gap in Advanced Manufacturing
Industry 4.0 and the Innovation Gap in Advanced ManufacturingIndustry 4.0 and the Innovation Gap in Advanced Manufacturing
Industry 4.0 and the Innovation Gap in Advanced Manufacturing
Mike Nager
 
U.S. construction trends and outlook (Q4 2014)
U.S. construction trends and outlook (Q4 2014)U.S. construction trends and outlook (Q4 2014)
U.S. construction trends and outlook (Q4 2014)
JLL
 
Detroit Engineering Employment
Detroit Engineering EmploymentDetroit Engineering Employment
Detroit Engineering Employment
gcorser
 

What's hot (20)

The Demands on Auto Suppliers
The Demands on Auto SuppliersThe Demands on Auto Suppliers
The Demands on Auto Suppliers
 
The New Game of Global Tech
The New Game of Global TechThe New Game of Global Tech
The New Game of Global Tech
 
Construction Sector| Canada| December 2018
Construction Sector| Canada| December 2018Construction Sector| Canada| December 2018
Construction Sector| Canada| December 2018
 
perspectives-on-the-2016-energy-industry-landscape
perspectives-on-the-2016-energy-industry-landscapeperspectives-on-the-2016-energy-industry-landscape
perspectives-on-the-2016-energy-industry-landscape
 
Creating new demand for gas
Creating new demand for gasCreating new demand for gas
Creating new demand for gas
 
Detroit Auto Show
Detroit Auto ShowDetroit Auto Show
Detroit Auto Show
 
IMARK NOW Summer LEDs and the Future
IMARK NOW Summer LEDs and the FutureIMARK NOW Summer LEDs and the Future
IMARK NOW Summer LEDs and the Future
 
2020 tech talent july
2020 tech talent july2020 tech talent july
2020 tech talent july
 
Wentworth Institute 2010
Wentworth Institute 2010Wentworth Institute 2010
Wentworth Institute 2010
 
The Outcome Economy
The Outcome EconomyThe Outcome Economy
The Outcome Economy
 
U.S. construction trends and outlook (Q2 2015)
U.S. construction trends and outlook (Q2 2015)U.S. construction trends and outlook (Q2 2015)
U.S. construction trends and outlook (Q2 2015)
 
Digital_Whitepaper_EC&O_final_v2
Digital_Whitepaper_EC&O_final_v2Digital_Whitepaper_EC&O_final_v2
Digital_Whitepaper_EC&O_final_v2
 
America’s Real Manufacturing Advantage
America’s Real Manufacturing AdvantageAmerica’s Real Manufacturing Advantage
America’s Real Manufacturing Advantage
 
Monthly Economic Update | June 2013
Monthly Economic Update | June 2013Monthly Economic Update | June 2013
Monthly Economic Update | June 2013
 
3 Ways the Shale Boom Will Impact the Trucking Industry
3 Ways the Shale Boom Will Impact the Trucking Industry3 Ways the Shale Boom Will Impact the Trucking Industry
3 Ways the Shale Boom Will Impact the Trucking Industry
 
U.S. construction trends and outlook (Q1 2015)
U.S. construction trends and outlook (Q1 2015)U.S. construction trends and outlook (Q1 2015)
U.S. construction trends and outlook (Q1 2015)
 
Impact of the Manufacturing Renaissance from Energy Intensive Sectors
Impact of the Manufacturing Renaissance from Energy Intensive SectorsImpact of the Manufacturing Renaissance from Energy Intensive Sectors
Impact of the Manufacturing Renaissance from Energy Intensive Sectors
 
Industry 4.0 and the Innovation Gap in Advanced Manufacturing
Industry 4.0 and the Innovation Gap in Advanced ManufacturingIndustry 4.0 and the Innovation Gap in Advanced Manufacturing
Industry 4.0 and the Innovation Gap in Advanced Manufacturing
 
U.S. construction trends and outlook (Q4 2014)
U.S. construction trends and outlook (Q4 2014)U.S. construction trends and outlook (Q4 2014)
U.S. construction trends and outlook (Q4 2014)
 
Detroit Engineering Employment
Detroit Engineering EmploymentDetroit Engineering Employment
Detroit Engineering Employment
 

Similar to ENR 2016 CM at Risk PLANT #89

Construction Lead Generation - The Definitive Guide
Construction Lead Generation - The Definitive GuideConstruction Lead Generation - The Definitive Guide
Construction Lead Generation - The Definitive Guide
Modern Marketing Partners
 
Van Dyne NYT - Dec. 16, 2011
Van Dyne NYT - Dec. 16, 2011Van Dyne NYT - Dec. 16, 2011
Van Dyne NYT - Dec. 16, 2011Vincent Dipas
 
What has changed since the crash of 2008
What has changed since the crash of 2008What has changed since the crash of 2008
What has changed since the crash of 2008
Construction Economics & Strategies, LLC.
 
The Construction Manager-General Contractor method for consctruction of trans...
The Construction Manager-General Contractor method for consctruction of trans...The Construction Manager-General Contractor method for consctruction of trans...
The Construction Manager-General Contractor method for consctruction of trans...Angel Damian Rivera-Saez
 
Laura - Construction Manager (Main), June 2016
Laura - Construction Manager (Main), June 2016Laura - Construction Manager (Main), June 2016
Laura - Construction Manager (Main), June 2016Laura Lintott (Teodorescu)
 
Whitepaper - Healthy economy carries hidden risks for developers
Whitepaper - Healthy economy carries hidden risks for developersWhitepaper - Healthy economy carries hidden risks for developers
Whitepaper - Healthy economy carries hidden risks for developersKit Carroll
 
Reshoring Initiative: How to Reshore Manufacturing to Maryland
Reshoring Initiative: How to Reshore Manufacturing to MarylandReshoring Initiative: How to Reshore Manufacturing to Maryland
Reshoring Initiative: How to Reshore Manufacturing to Maryland
Maryland Economic Development Association (MEDA)
 
The future for construction insurance report
The future for construction insurance reportThe future for construction insurance report
The future for construction insurance report
Lucas Fettes & Partners
 
Oregon Transportation Report
Oregon Transportation ReportOregon Transportation Report
Oregon Transportation Report
Jonathan Hunt
 
161103 Mueller_Sustainable_infrastructure_imperative_07_S
161103 Mueller_Sustainable_infrastructure_imperative_07_S161103 Mueller_Sustainable_infrastructure_imperative_07_S
161103 Mueller_Sustainable_infrastructure_imperative_07_SSven-Uwe Mueller
 
Kentucky Transportation Report
Kentucky Transportation ReportKentucky Transportation Report
Kentucky Transportation Report
Jonathan Hunt
 
Infrastructure and Design Build Contracting
Infrastructure and Design Build ContractingInfrastructure and Design Build Contracting
Infrastructure and Design Build Contracting
Wagner College
 
Public Private Partnerships - State of the Market and the Future of P3's
Public Private Partnerships - State of the Market and the Future of P3'sPublic Private Partnerships - State of the Market and the Future of P3's
Public Private Partnerships - State of the Market and the Future of P3's
Jonathan Hunt
 
How to achieve productivity gains through digitisation (CIHT Annual Conferenc...
How to achieve productivity gains through digitisation (CIHT Annual Conferenc...How to achieve productivity gains through digitisation (CIHT Annual Conferenc...
How to achieve productivity gains through digitisation (CIHT Annual Conferenc...
Causeway Technologies
 
Infrastructure and Capital Investment| Canada | March 2019
Infrastructure and Capital Investment| Canada | March 2019Infrastructure and Capital Investment| Canada | March 2019
Infrastructure and Capital Investment| Canada | March 2019
paul young cpa, cga
 

Similar to ENR 2016 CM at Risk PLANT #89 (20)

Construction Lead Generation - The Definitive Guide
Construction Lead Generation - The Definitive GuideConstruction Lead Generation - The Definitive Guide
Construction Lead Generation - The Definitive Guide
 
Van Dyne NYT - Dec. 16, 2011
Van Dyne NYT - Dec. 16, 2011Van Dyne NYT - Dec. 16, 2011
Van Dyne NYT - Dec. 16, 2011
 
Bidcom Economist
Bidcom EconomistBidcom Economist
Bidcom Economist
 
What has changed since the crash of 2008
What has changed since the crash of 2008What has changed since the crash of 2008
What has changed since the crash of 2008
 
Innovation15_Innovators
Innovation15_InnovatorsInnovation15_Innovators
Innovation15_Innovators
 
The Construction Manager-General Contractor method for consctruction of trans...
The Construction Manager-General Contractor method for consctruction of trans...The Construction Manager-General Contractor method for consctruction of trans...
The Construction Manager-General Contractor method for consctruction of trans...
 
Working With Uncle Sam: Washington Building Congress
Working With Uncle Sam: Washington Building CongressWorking With Uncle Sam: Washington Building Congress
Working With Uncle Sam: Washington Building Congress
 
Laura - Construction Manager (Main), June 2016
Laura - Construction Manager (Main), June 2016Laura - Construction Manager (Main), June 2016
Laura - Construction Manager (Main), June 2016
 
Whitepaper - Healthy economy carries hidden risks for developers
Whitepaper - Healthy economy carries hidden risks for developersWhitepaper - Healthy economy carries hidden risks for developers
Whitepaper - Healthy economy carries hidden risks for developers
 
Reshoring Initiative: How to Reshore Manufacturing to Maryland
Reshoring Initiative: How to Reshore Manufacturing to MarylandReshoring Initiative: How to Reshore Manufacturing to Maryland
Reshoring Initiative: How to Reshore Manufacturing to Maryland
 
JF14_APICS_Rennie
JF14_APICS_RennieJF14_APICS_Rennie
JF14_APICS_Rennie
 
The future for construction insurance report
The future for construction insurance reportThe future for construction insurance report
The future for construction insurance report
 
Oregon Transportation Report
Oregon Transportation ReportOregon Transportation Report
Oregon Transportation Report
 
161103 Mueller_Sustainable_infrastructure_imperative_07_S
161103 Mueller_Sustainable_infrastructure_imperative_07_S161103 Mueller_Sustainable_infrastructure_imperative_07_S
161103 Mueller_Sustainable_infrastructure_imperative_07_S
 
Kentucky Transportation Report
Kentucky Transportation ReportKentucky Transportation Report
Kentucky Transportation Report
 
Infrastructure and Design Build Contracting
Infrastructure and Design Build ContractingInfrastructure and Design Build Contracting
Infrastructure and Design Build Contracting
 
Public Private Partnerships - State of the Market and the Future of P3's
Public Private Partnerships - State of the Market and the Future of P3'sPublic Private Partnerships - State of the Market and the Future of P3's
Public Private Partnerships - State of the Market and the Future of P3's
 
DESIGN & BUILD
DESIGN & BUILDDESIGN & BUILD
DESIGN & BUILD
 
How to achieve productivity gains through digitisation (CIHT Annual Conferenc...
How to achieve productivity gains through digitisation (CIHT Annual Conferenc...How to achieve productivity gains through digitisation (CIHT Annual Conferenc...
How to achieve productivity gains through digitisation (CIHT Annual Conferenc...
 
Infrastructure and Capital Investment| Canada | March 2019
Infrastructure and Capital Investment| Canada | March 2019Infrastructure and Capital Investment| Canada | March 2019
Infrastructure and Capital Investment| Canada | March 2019
 

ENR 2016 CM at Risk PLANT #89

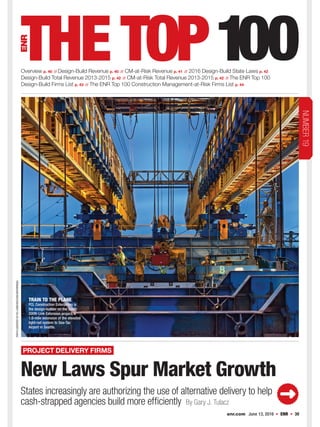
  • 1. New Laws Spur Market Growth States increasingly are authorizing the use of alternative delivery to help cash-strapped agencies build more efficiently By Gary J. Tulacz Overview p. 40 // Design-Build Revenue p. 40 // CM-at-Risk Revenue p. 41 // 2016 Design-Build State Laws p. 42 Design-Build Total Revenue 2013-2015 p. 42 // CM-at-Risk Total Revenue 2013-2015 p. 42 // The ENR Top 100 Design-Build Firms List p. 43 // The ENR Top 100 Construction Management-at-Risk Firms List p. 44 PHOTOCOURTESYOFPCLCONSTRUCTIONENTERPRISES enr.com June 13, 2016  ENR  39 NUMBER19TRAIN TO THE PLANE PCL Construction Enterprises is the design-builder on the South 200th Link Extension project, a 1.6-mile extension of the elevated light-rail system to Sea-Tac Airport in Seattle. PROJECT DELIVERY FIRMS ENR06132016_Top100PDF_Opener.indd 39 6/6/16 1:53 PM
  • 2. 2007 $53.75 2007 $29.68 2008 $64.42 2008 $33.19 $ BILLIONS DOMESTIC REVENUE INTERNATIONAL REVENUE 2009 $59.33 2010 $50.23 2010 $28.01 2011 $54.68 2011 $37.37 2012 $56.56 2012 $47.33 2013 $60.92 2013 $47.87 2014 $69.26 2014 $40.32 2015 $72.74 2015 $34.432009 $30.10 As the overall market continues to grow in the U.S., so has the market for alternative project delivery. Own- ers increasingly have been looking for means to squeeze conflicts and inefficiencies out of the construc- tion process and see the old system of looking for the lowest first costs in the traditional design-bid-build procurement process as failing to address these con- cerns. This dissatisfaction with the old delivery systems is shown by the growing volume of state legislation authorizing public agencies to use alternative project delivery methods. The market for alternative project delivery in 2015 also mirrors the global construction market, as can be seen in the rankings of ENR’s Top 100 Construction Management-at-Risk (CMR) Firms and Top 100 Design-Build (DB) Firms. The Top 100 CMR firms had a combined revenue from CMR of $102.97 billion in 2015, down 1.0% from the $103.98 billion reported by the group in 2014. But what is striking in the numbers is that CMR revenue from international projects in 2015 for the Top 100 dropped 40.2%, to $10.30 billion from $17.21 billion, in 2014. In the domestic market, CMR rose 6.8%, to a record $92.67 billion, in 2015. The DB list provides a similar contrast between domestic and international project delivery: Overall, the Top 100 DB firms had total revenue of $107.21 billion in 2015, down 2.2% from 2014; revenue from domestic DB projects grew a healthy 5.0%, rising to $72.74 billion, in 2015. On the other hand, interna- tional DB revenue dropped 14.6% in 2015, thanks in part to a falloff in huge engineering-procurement- construction projects in the international mining, power and petroleum markets. Domestic Design-Build Rises Alternative project delivery options such as design- build and public-private partnerships continue to be an evolving part of construction. “Inevitably, it is all about creating partnerships that share in a risk-reward scenario that drives everyone to do their best work. We are regularly partnering with contractors to pursue large-scale opportunities,” says John Jastrem, CEO of Arcadis North America. He notes that Arcadis was part of the team that delivered the massive Carlsbad De- salination Plant using a design-build-operate-finance project delivery approach (see ENR 10/21/13 p. 32). Public Agency Growth Many firms comment that alternate project delivery is getting increased attention from owners—especially in the public-sector markets, long bastions of tradi- tional design-bid-build. For example, legislation authorizing alternative approaches to project delivery by public agencies has flourished over the past decade. Transportation agencies have been particular benefi- ciaries (see p. 24). Agencies in a broad variety of sectors have gained from this enabling legislation. In 2015, 70% of the state bills to expand the use of design-build in the pub- lic sector that were supported by the Design-Build Institute of America, Washington, D.C., were passed, says Lisa Washington, DBIA’s CEO. “Missouri just became the 25th state to pass a law granting full au- thorization for public agencies to use design-build,” she notes. The long-term lack of a federal highway bill and uncertain infrastructure funding has forced public agencies to seek ways to streamline their procurement and project delivery processes. These factors have “Inevitably, it is all about creating partnerships that share in a risk-reward scenario that drives everyone to do their best work.” John Jastrem, CEO, Arcadis North America THE TOP 100 PROJECT DELIVERY FIRMS #57 MESSER CONSTRUCTION recently won an integrated project delivery contract for Riley Hospital for Children at Indiana University Health, Indianapolis. 40 Ⅲ ENR Ⅲ June 13, 2016 enr.com SOURCE: DODGE DATA & ANALYTICS/ENR ENR06132016TL_PDF_Overview.indd 40 6/6/16 2:30 PM
  • 3. OVERVIEW 2007 $79.23 2007 $10.55 2008 $87.74 2008 $15.60 $ BILLIONS DOMESTIC REVENUE INTERNATIONAL REVENUE 2009 $73.87 2010 $63.97 2010 $14.35 2011 $64.19 2011 $19.19 2012 $70.89 2012 $20.63 2013 $77.83 2013 $19.01 2014 $86.77 2014 $17.21 2015 $92.67 2015 $10.30 2009 $15.47 created more opportunities for alternative delivery methods, such as public-private partnerships (P3s) and design-build, and forced all parties to work closer to- gether. “Stronger relationships with contractors, con- cessionaires, the financial community and other stake- holders are no longer an option but a requirement,” says Nick DeNichilo, CEO of Mott MacDonald, North America, an Iselin, N.J.-based engineering firm. While many designers resisted what they perceived as design-build’s usurpation of their traditional role in shaping the project’s concept and overseeing construc- tion, many have embraced the team concept associated with alternative project delivery. “With the fact that design-build and CM-at-risk have dominated the de- livery process for the past 15 or 20 years, the contrac- tor has necessarily become a strategic partner,” says Mike Medici, president of Detroit-based architect- engineer SmithGroupJJR. “I truly believe that focusing on collaboration is head and shoulders above the tra- ditional design-bid-build process,” he says. These enabling laws have paid dividends to firms experienced in alternative project delivery. “In Ohio, our clients have many delivery methods to choose from. We see this as a positive for clients and our organization,” says Brian Burgett, CEO of Kokosing Inc. Kokosing currently is building a $98-million wastewater facility for the city of Euclid, the largest- ever CMR treatment facility to be let in Ohio, he says. “We continue to see significant change in project delivery in the water and wastewater-treatment market,” says Kevin McCarthy, CEO of PC Construc- tion. He says these markets used to be dominated by design-bid-build projects, with owners seeking out the lowest cost. “Now, they are seeing the benefits that DomesticCM-at-RiskTopsRecord design-build and construction management-at-risk delivery provide.” PC Construction is working as a CMR contractor for the city of Atlanta’s water-supply program, the Charleston, S.C., water system and in- frastructure projects for Paulding County, Ga.. Many firms formerly thought of primarily as design- ers have developed their own in-house construction capabilities and now are embracing their role as an inte- grated design-builder. “Our ability to merge the tradi- tionally separate build and design roles into a seamless integrated team has proven to be a valuable service for our clients,” says Greg Carlson, vice president of Burns & McDonnell. Since these services are from a single source, the firm is able to provide the flexibility to quickly adapt and expedite critical-path items—design decisions, permitting and staffing needs, for example—to achieve aggressive schedules and budgets, Carlson says. Concerns Alternative project delivery has raised concerns. Some design firms say that, when developing a project, own- ers are looking more toward contractors, rather than design firms. “In certain market sectors and in certain regions, clients go to contractors first, and then design teams work through contractors,” says Kevin Hydes, CEO of Integral Group, an Oakland, Calif.-based en- gineering firm. “Typically, a lot of clients in the tech sector go that route.” To ensure their continued impact on projects, it is important for design firms to develop strong ties with contractors and owners, he notes. Design firms worry about the legal implications of design under processes such as design-build. The po- tential shift in responsibility for design services from the traditional design consultant to the contractor un- “A troubling trend is that owners are trying to get more sophisticated, getting into P3s or other alternative methods of procurement that they don’t understand. What happens is, the risk is all getting shoved down to the contractor level.” Bob Alger, CEO, Lane Construction #20 SKANSKA USA recently completed a new clinic for the Palo Alto Medical Foundation, an integrated project delivery project in San Carlos, Calif. enr.com June 13, 2016 Ⅲ ENR Ⅲ 41 SOURCE: DODGE DATA & ANALYTICS/ENR ENR06132016TL_PDF_Overview.indd 41 6/6/16 2:30 PM
  • 4. der design-build and the emerging integrated project delivery models create “contractually gray areas that are presenting themselves and require cooperation and creative solutions,” says Philip M. Davis, senior vice president of architecture for Fishbeck, Thompson, Carr & Huber Inc., a Grand Rapids, Mich.-based architectural and engineering firm. Risky Business Many owners see alternative project delivery as a means of limiting their risk on a project. However, risk-shifting is a double-edged sword. Alternative proj- ect delivery may help to mitigate some risks by foster- ing teamwork, but no process can eliminate all risk. Owners may not understand that shifting risk to the contractor or the design-build team comes at a price. Many firms engaged in alternative project delivery say owners need to understand the cost of risk. “A trou- bling trend is that owners are trying to get more sophisticated, getting into P3s or other alternative methods of procurement that they don’t understand. What happens is, the risk is all getting shoved down to the contractor level … with onerous contract terms like consequential damages and the like. Then, when you try to price that risk, the owner says your price is too high. We need to find a balance between price and risk,” says Bob Alger, CEO of Lane Construction. Washington of DBIA stresses that understanding the process is the key to making design-build success- ful, particularly for owners. “It’s all about education. People have to understand the elements of design- build done right,” she says. To address the issue of education, DBIA has intro- duced a series of best-practices guides, says Washington. 2016 Design-Build State Laws She notes that DBIA produced a general guide to design-build best practices early in 2015 but now is is- suing a series of market-specific guides. “We came out with our best-practices guide for the federal sector last August, then one for the water and wastewater markets in January and one for transportation in March.” Progressive Design-Build Many firms note the increased use of design-assist, a process that brings in the contracting team early to assist the design team in planning out the project. “We are finding that the increasing need for design-assist or other very early trade input on projects is promot- ing much deeper relationships with the subset of sub- contractors that are able to successfully collaborate within teams and add value during the preconstruction and planning phase,” says Steven F. Roznowski, CEO of The Christman Co. Washington of DBIA says there is a growing trend to extend this design-assist concept into the use of design-build; this method is called progressive design- build. A design-build team is brought in early in the design process to work closely with the owner on spec- ification and equipment selection. Once the design is about 35% complete, the design-build team offers a guaranteed maximum price. “This approach has become more common in the water and wastewater sectors, where complicated equipment selection is required early on,” says Wash- ington. She says this approach gives owners greater input into the design without sacrificing the collabora- tion and single point of responsibility inherent in design-build. “It also requires a qualifications-based selection process to be the most effective,” she says. Ⅲ “It’s all about education. People need to understand the elements of design-build done right.” Lisa Washington, CEO, Design- Build Institute of America THE TOP 100 PROJECT DELIVERY FIRMS OVERVIEW#40 ROBINS & MORTON is the CMR for the new $187-million, 534,000-sq-ft replacement Baptist North Mississippi Hospital in Oxford, Miss. Design-build is permitted by all agencies for all types of design and construction Design-build is limited to one political subdivision, e.g., agency commission, or special project Design-build is widely permitted Design-build is a limited option SOURCE: DESIGN-BUILD INSTITUTE OF AMERICA, 2016 IL WA OR CA NV ID WY UT NE SD ND MN WI OH MI NY TX MO AL SC FL KY NC ME IN LA MS TN GA AZ OK AR AK WV KS MT CO NM PA VA IA NJ MD DE DC HI CT RI VT NH MA CM-AT-RISK 2013 $96.84 DESIGN-BUILD 2013 $108.79 CM-AT-RISK 2014 $103.98 DESIGN-BUILD 2014 $109.59 $ BILLIONS CM-AT-RISK 2015 $102.97 DESIGN-BUILD 2015 $107.21 42 Ⅲ ENR Ⅲ June 13, 2016 enr.com ENR06132016TL_PDF_Overview.indd 42 6/6/16 2:30 PM
  • 5. The Top 100 Design-Build Firms COMPANIES ARE RANKED IN $ MILLIONS BASED ON 2015 REVENUE FROM DESIGN-BUILD CONTRACTS WHERE THE PROJECT IS DESIGNED BY EMPLOYEES OF THE FIRM OR JOINT-VENTURE PARTNER AND BUILT BY ITS OWN FORCE OR SUBCONTRACTORS UNDER ITS SUPERVISION. **NOT RANKED IN 2015 AMONG THE TOP DESIGN-BUILD FIRMS. THE TOP 100 PROJECT DELIVERY FIRMS #31 GRAY CONSTRUCTION is the design-builder on the 578,742-sq-ft Clemens Food Group pork-processing facility in Coldwater, Mich. enr.com June 13, 2016  ENR  43 RANK TOTAL REV. DOMESTIC INTER- 2016 2015 FIRM ($ MIL.) REVENUE NATIONAL 1 1 BECHTEL, San Francisco, Calif. 17,417.0 6,517.0 10,900.0 2 2 FLUOR CORP., Irving, Texas 11,552.2 4,484.6 7,067.6 3 3 CB&I INC., The Woodlands, Texas 10,446.1 6,907.3 3,538.8 4 4 JACOBS, Pasadena, Calif. 8,470.0 4,190.0 4,280.0 5 5 KIEWIT CORP., Omaha, Neb. 5,768.9 4,747.8 1,021.1 6 6 KBR, Houston, Texas 3,238.4 911.5 2,326.9 7 8 THE WALSH GROUP LTD., Chicago, Ill. 2,144.4 2,144.4 0.0 8 20 ZACHRY GROUP, San Antonio, Texas 1,991.0 1,991.0 0.0 9 7 WHITING-TURNER CONTRACTING, Baltimore, Md. 1,797.9 1,797.9 0.0 10 9 BLACK & VEATCH, Overland Park, Kan. 1,577.8 1,074.6 503.2 11 13 BURNS & MCDONNELL, Kansas City, Mo. 1,486.7 1,321.6 165.2 12 21 SWINERTON INC., San Francisco, Calif. 1,457.0 1,457.0 0.0 13 11 MATRIX SERVICE CO., Tulsa, Okla. 1,321.4 1,175.6 145.8 14 18 MORTENSON CONSTRUCTION, Minneapolis, Minn. 1,288.9 1,242.1 46.8 15 17 CLAYCO INC., Chicago, Ill. 1,282.5 1,282.5 0.0 16 19 CLARK GROUP, Bethesda, Md. 1,180.0 1,180.0 0.0 17 23 BABCOCK & WILCOX ENTERPR., Charlotte, N.C. 1,164.9 480.1 684.8 18 10 HENSEL PHELPS, Greeley, Colo. 1,154.4 952.4 202.0 19 16 PCL CONSTRUCTION ENTERPRISES, Denver, Colo. 1,110.9 33.5 1,077.5 20 24 SKANSKA USA, New York, N.Y. 1,103.6 1,103.1 0.0 21 25 MCCARTHY HOLDINGS INC., St. Louis, Mo. 1,018.0 1,018.0 0.0 22 14 BALFOUR BEATTY US, Dallas, Texas 1,006.6 977.2 0.0 23 22 CH2M, Englewood, Colo. 992.6 672.7 319.9 24 ** M+W GROUP, Albany, N.Y. 990.0 990.0 0.0 25 26 THE TURNER CORP., New York, N.Y. 871.4 859.3 12.1 26 15 FERROVIAL US CONSTRUCTION, Austin, Texas 815.0 815.0 0.0 27 58 AMEC FOSTER WHEELER, Tucker, Ga. 813.0 708.0 105.0 28 27 ARCO CONSTRUCTION COS., St. Louis, Mo. 773.9 773.8 0.0 29 29 RYAN COS. US INC., Minneapolis, Minn. 712.0 712.0 0.0 30 32 S&B ENG’RS & CONSTRUCTORS, Houston, Texas 700.3 700.3 0.0 31 43 GRAY CONSTRUCTION, Lexington, Ky. 660.0 660.0 0.0 32 31 GRANITE CONSTRUCTION INC., Watsonville, Calif. 649.0 649.0 0.0 33 75 LEIDOS, Reston, Va. 648.4 648.4 0.0 34 55 JE DUNN CONSTRUCTION, Kansas City, Mo. 629.6 629.6 0.0 35 38 HANOVER RS CONSTRUCTION, Houston, Texas 620.0 620.0 0.0 36 45 ALSTON CONSTRUCTION CO., Sacramento, Calif. 576.0 576.0 0.0 37 39 BL HARBERT INTERNATIONAL, Birmingham, Ala. 525.3 83.0 442.3 38 49 BARTON MALOW CO., Southfield, Mich. 500.0 500.0 0.0 39 30 WALBRIDGE, Detroit, Mich. 482.4 266.4 216.0 40 37 PARSONS, Pasadena, Calif. 477.2 426.3 50.9 41 34 HASKELL, Jacksonville, Fla. 476.2 454.6 21.6 42 ** AECOM, Los Angeles, Calif. 451.9 451.9 0.0 43 ** HOFFMAN CORP., Portland, Ore. 440.0 440.0 0.0 44 71 DPR CONSTRUCTION, Redwood City, Calif. 412.8 412.8 0.0 45 50 CDM SMITH, Boston, Mass. 410.6 384.6 26.0 46 61 DEVCON CONSTRUCTION INC., Milpitas, Calif. 405.0 405.0 0.0 47 48 DEACON CORP., Citrus Heights, Calif. 398.5 398.5 0.0 48 56 OHL USA INC., College Point, N.Y. 391.4 139.5 251.9 49 57 THE BECK GROUP, Dallas, Texas 376.8 376.8 0.0 50 ** SHIMIZU NORTH AMERICA LLC, Atlanta, Ga. 375.0 273.0 102.0 RANK TOTAL REV. DOMESTIC INTER- 2016 2015 FIRM ($ MIL.) REVENUE NATIONAL 51 33 DUKE CONSTRUCTION, Indianapolis, Ind. 368.7 368.7 0.0 52 46 FLATIRON CONSTR. CORP., Broomfield, Colo. 366.0 143.5 222.5 53 ** TUTOR PERINI CORP., Sylmar, Calif. 365.6 323.4 42.2 54 52 GEMMA POWER SYSTEMS, Glastonbury, Conn. 360.3 360.3 0.0 55 42 LANE INDUSTRIES INC., Cheshire, Conn. 336.2 336.2 0.0 56 91 AUSTIN INDUSTRIES, Dallas, Texas 322.5 322.5 0.0 57 62 MESSER CONSTRUCTION CO., Cincinnati, Ohio 319.5 319.5 0.0 58 53 THE MCSHANE COS., Rosemont, Ill. 316.8 316.8 0.0 59 73 GILBANE BUILDING CO., Providence, R.I. 316.2 274.4 41.8 60 68 TRAYLOR BROS. INC., Evansville, Ind. 314.5 314.5 0.0 61 64 ZACHRY CONSTRUCTION, San Antonio, Texas 312.0 312.0 0.0 62 ** LPCIMINELLI INC., Buffalo, N.Y. 309.6 309.6 0.0 63 ** MWH GLOBAL, Broomfield, Colo. 299.0 50.4 248.6 64 67 AMERICAN BRIDGE CO., Coraopolis, Pa. 293.4 232.0 61.4 65 60 LENDLEASE, New York, N.Y. 283.7 283.7 0.0 66 ** HERZOG FAMILY OF COS., St. Joseph, Mo. 280.7 274.6 6.1 67 74 KLINGER COS. INC., Sioux City, Iowa 280.0 280.0 0.0 68 ** XL CONSTRUCTION CORP., Milpitas, Calif. 275.0 275.0 0.0 69 93 TRANSCORE, Nashville, Tenn. 268.4 257.6 10.8 70 ** DOME CONSTR. CORP., So. San Francisco, Calif. 251.0 251.0 0.0 71 87 BBL CONSTRUCTION SERVICES LLC, Albany, N.Y. 249.6 249.6 0.0 72 47 DENNIS ENGINEERING GROUP, Springfield, Mass. 247.8 247.8 0.0 73 ** BIG-D CONSTRUCTION CORP., Salt Lake City, Utah 245.6 245.6 0.0 74 ** CAHILL CONTRACTORS INC., San Francisco, Calif. 236.0 236.0 0.0 75 81 CADDELL CONSTRUCTION CO., Montgomery, Ala. 231.9 46.0 185.9 76 ** FAGEN INC., Granite Falls, Minn. 228.7 228.7 0.0 77 78 CONTINENTAL BUILDING SYS., Columbus, Ohio 223.1 223.1 0.0 78 54 H&M CO. INC., Jackson, Tenn. 218.0 218.0 0.0 79 70 ARCADIS/CALLISONRTKL, Highlands Ranch, Colo. 212.0 192.0 20.0 80 77 ODEBRECHT CONSTRUCTION, Coral Gables, Fla. 210.0 210.0 0.0 81 66 STRUCTURE TONE, New York, N.Y. 210.0 125.0 85.0 82 ** PRIMUS BUILDERS INC., Woodstock, Ga. 193.0 193.0 0.0 83 63 VCC LLC, Irving, Texas 189.3 189.3 0.0 84 99 SUNDT CONSTRUCTION INC., Tempe, Ariz. 187.3 187.3 0.0 85 ** CORVAL GROUP INC., St. Paul, Minn. 187.0 187.0 0.0 86 ** ELECTRICAL CONSULTANTS INC., Billings, Mont. 174.3 174.3 0.0 87 ** JINGOLI-DCO, Lawrenceville, N.J. 170.0 170.0 0.0 88 ** PRO CON INC., Hooksett, N.H. 165.6 165.6 0.0 89 90 SHIMMICK CONSTRUCTION CO., Oakland, Calif. 164.3 164.3 0.0 90 83 CAROTHERS CONSTRUCTION, Oxford, Miss. 160.0 160.0 0.0 91 ** LAUREN ENG’S & CONSTRUCTORS, Abilene, Texas 155.8 155.8 0.0 92 ** LAYTON CONSTRUCTION CO. LLC, Sandy, Utah 147.0 147.0 0.0 93 ** THE HUBBARD GROUP INC., Orlando, Fla. 145.1 145.1 0.0 94 ** ROSENBERGER CONSTR., Sugar Land, Texas 139.1 139.1 0.0 95 95 CONSIGLI BUILDING GROUP INC., Milford, Mass. 135.3 135.3 0.0 96 ** POWER CONSTRUCTION CO. LLC, Chicago, Ill. 122.5 122.5 0.0 97 ** DAVID E. HARVEY BUILDERS, Houston, Texas 120.0 120.0 0.0 98 ** BERNARDS, San Fernando, Calif. 116.7 116.7 0.0 99 ** THE WEITZ CO., Des Moines, Iowa 114.7 114.7 0.0 100 ** LEVEL 10 CONSTRUCTION, Sunnyvale, Calif. 114.5 114.5 0.0 ENR06132016Top100_PDF_List.indd 43 6/6/16 1:52 PM
  • 6. Construction Management-at-Risk Firms BASED ON 2015 REVENUE IN $ MILLIONS FROM “AT RISK” CONSTRUCTION MANAGEMENT OR PROJECT AND PROGRAM CONTRACTS IN WHICH A FIRM IS EXPOSED TO FINANCIAL RESPONSIBILITIES AND RISK SIMILAR TO THOSE OF A GENERAL CONTRACTOR **=NOT RANKED IN 2015 AMONG THE TOP 100 CM FIRMS-AT-RISK. THE TOP 100 PROJECT DELIVERY FIRMS #70 THE CHRISTMAN CO. is CM on the $271-million medical-center project for Mercy Health in Muskegon, Mich. RANK TOTAL REV. INTER- NATIONAL2016 2015 FIRM ($ MIL.) 1 1 THE TURNER CORP., New York, N.Y. 9,683.2 719.9 2 2 BECHTEL, San Francisco, Calif. 6,970.0 6,916.0 3 5 SKANSKA USA, New York, N.Y. 3,684.6 2.8 4 ** AECOM, Los Angeles, Calif. 3,233.4 0.0 5 8 STRUCTURE TONE, New York, N.Y. 3,098.2 123.2 6 6 GILBANE BUILDING CO., Providence, R.I. 3,093.3 214.7 7 7 BALFOUR BEATTY US, Dallas, Texas 2,944.6 0.0 8 9 THE WHITING-TURNER CONTRACTING CO., Baltimore, Md. 2,704.4 0.0 9 12 LENDLEASE, New York, N.Y. 2,689.1 43.1 10 11 DPR CONSTRUCTION, Redwood City, Calif. 2,660.0 0.0 11 14 SUFFOLK CONSTRUCTION CO., Boston, Mass. 2,481.0 0.0 12 10 PCL CONSTRUCTION ENTERPRISES INC., Denver, Colo. 2,174.8 1,555.7 13 13 JE DUNN CONSTRUCTION, Kansas City, Mo. 2,164.4 0.0 14 15 MORTENSON CONSTRUCTION, Minneapolis, Minn. 2,138.0 0.0 15 51 CLARK GROUP, Bethesda, Md. 2,019.0 0.0 16 17 HOLDER CONSTRUCTION CO., Atlanta, Ga. 2,017.0 0.0 17 16 MCCARTHY HOLDINGS INC., St. Louis, Mo. 1,789.0 0.0 18 20 DAVID E. HARVEY BUILDERS, Houston, Texas 1,650.0 0.0 19 28 SWINERTON INC., San Francisco, Calif. 1,477.0 0.0 20 19 KBR, Houston, Texas 1,280.7 130.8 21 27 WEBCOR BUILDERS, San Francisco, Calif. 1,207.8 0.0 22 22 BARTON MALOW CO., Southfield, Mich. 1,161.5 33.8 23 34 HUNTER ROBERTS CONSTRUCTION GRP., New York, N.Y. 1,139.0 0.0 24 ** HATHAWAY DINWIDDIE CONSTR., San Francisco, Calif. 1,098.0 0.0 25 26 HITT CONTRACTING INC., Falls Church, Va. 1,082.8 0.0 26 23 CHINA CONSTR. AMER./PLAZA CONSTR., Jersey City, N.J. 1,075.0 0.0 27 46 ALBERICI-FLINTCO, St. Louis, Mo. 1,050.2 282.6 28 41 LAYTON CONSTRUCTION CO. LLC, Sandy, Utah 1,029.4 0.0 29 25 SHAWMUT DESIGN AND CONSTRUCTION, Boston, Mass. 905.6 0.0 30 18 HOFFMAN CORP., Portland, Ore. 894.0 0.0 31 47 PEPPER CONSTRUCTION GROUP, Chicago, Ill. 893.9 0.0 32 31 COASTAL CONSTRUCTION GROUP, Miami, Fla. 885.0 0.0 33 32 MANHATTAN CONSTRUCTION GROUP, Naples, Fla. 862.7 0.0 34 49 EMJ CORP., Chattanooga, Tenn. 840.0 6.0 35 33 AVALONBAY COMMUNITIES INC., Arlington, Va. 815.6 0.0 36 57 THE BECK GROUP, Dallas, Texas 780.0 39.6 37 39 CONSIGLI BUILDING GROUP INC., Milford, Mass. 779.5 0.0 38 29 POWER CONSTRUCTION CO. LLC, Chicago, Ill. 768.0 0.0 39 54 TELLEPSEN, Houston, Texas 715.0 0.0 40 45 ROBINS & MORTON, Birmingham, Ala. 701.4 0.0 41 37 MESSER CONSTRUCTION CO., Cincinnati, Ohio 693.5 0.0 42 36 CHOATE CONSTRUCTION CO., Atlanta, Ga. 677.7 0.0 43 38 LEVEL 10 CONSTRUCTION, Sunnyvale, Calif. 676.4 0.0 44 ** AUSTIN INDUSTRIES, Dallas, Texas 670.4 0.0 45 48 KIEWIT CORP., Omaha, Neb. 635.4 0.0 46 43 KRAUS-ANDERSON CONSTRUCTION, Minneapolis, Minn. 634.0 0.0 47 56 HOAR CONSTRUCTION, Birmingham, Ala. 624.2 0.0 48 70 OKLAND CONSTRUCTION CO. INC., Salt Lake City, Utah 581.0 0.0 49 60 GLY CONSTRUCTION, Bellevue, Wash. 562.0 0.0 50 44 CLUNE CONSTRUCTION CO., Chicago, Ill. 540.6 0.0 RANK TOTAL REV. INTER- NATIONAL2016 2015 FIRM ($ MIL.) 51 63 SUNDT CONSTRUCTION INC., Tempe, Ariz. 526.1 0.0 52 61 C.W. DRIVER COS., Pasadena, Calif. 517.8 0.0 53 53 THE BOLDT CO., Appleton, Wis. 497.5 0.0 54 ** LEASE CRUTCHER LEWIS, Seattle, Wash. 497.3 0.0 55 55 JACOBSEN CONSTRUCTION CO. INC., Salt Lake City, Utah 494.0 10.0 56 59 MCGOUGH, St. Paul, Minn. 477.0 0.0 57 58 LEE LEWIS CONSTRUCTION, Lubbock, Texas 475.0 0.0 58 30 HENSEL PHELPS, Greeley, Colo. 473.1 0.0 59 3 FLUOR CORP., Irving, Texas 455.1 175.6 60 ** FORTIS CONSTRUCTION INC., Portland, Ore. 444.0 0.0 61 85 THE WALSH GROUP LTD., Chicago, Ill. 437.8 20.3 62 62 O’NEIL INDUSTRIES INC., Chicago, Ill. 430.5 0.0 63 84 INTECH CONSTRUCTION LLC, Philadelphia, Pa. 430.0 0.0 64 87 WEIS BUILDERS INC., Minneapolis, Minn. 406.7 0.0 65 82 BARTLETT COCKE GEN’L CONTRACTORS, San Antonio, Texas 406.4 0.0 66 52 WALBRIDGE, Detroit, Mich. 402.6 13.6 67 75 BUILD GROUP INC., San Francisco, Calif. 401.7 0.0 68 66 KITCHELL CORP., Phoenix, Ariz. 390.0 0.0 69 65 GE JOHNSON CONSTRUCTION CO., Colorado Springs, Colo. 386.0 0.0 70 67 THE CHRISTMAN CO., Lansing, Mich. 380.8 0.0 71 42 THE YATES COS. INC., Philadelphia, Miss. 378.2 0.0 72 ** THE PIKE COS. LTD., Rochester, N.Y. 362.0 0.0 73 78 J.H. FINDORFF & SON INC., Madison, Wis. 354.0 0.0 74 77 HILL & WILKINSON GENERAL CONTR., Richardson, Texas 353.9 0.0 75 69 DIMEO CONSTRUCTION CO., Providence, R.I. 347.4 0.0 76 80 THE PENTA BUILDING GROUP, Las Vegas, Nev. 344.4 0.0 77 ** KNUTSON CONSTRUCTION, St. Louis Park, Minn. 332.0 0.0 78 ** T.G. NICKEL & ASSOCIATES LLC, Ronkonkoma, N.Y. 321.2 0.0 79 89 RODGERS BUILDERS INC., Charlotte, N.C. 319.5 0.0 80 74 SAUNDERS CONSTRUCTION INC., Centennial, Colo. 319.0 0.0 81 71 LECHASE CONSTRUCTION SERVICES LLC, Rochester, N.Y. 315.0 0.0 82 ** JAMES R. VANNOY & SONS CONSTR., Jefferson, N.C. 314.0 0.0 83 ** JOERIS GENERAL CONTRACTORS LTD., San Antonio, Texas 313.2 0.0 84 73 LPCIMINELLI INC., Buffalo, N.Y. 304.6 0.0 85 ** BNBT BUILDERS INC., Redwood City, Calif. 300.0 0.0 86 ** JORDAN FOSTER CONSTRUCTION LLC, El Paso, Texas 297.0 0.0 87 ** IMC CONSTRUCTION, Malvern, Pa. 290.0 0.0 88 91 J.P. CULLEN & SONS INC., Janesville, Wis. 289.9 0.0 89 94 PLANT CONSTRUCTION CO. LP, San Francisco, Calif. 289.3 0.0 90 ** SKENDER CONSTRUCTION, Chicago, Ill. 287.0 0.0 91 ** ENGINEERED STRUCTURES INC. (ESI), Meridian, Idaho 285.4 0.0 92 ** KAST CONSTRUCTION CO. LLC, West Palm Beach, Fla. 276.4 0.0 93 96 BARR & BARR INC., New York, N.Y. 274.6 0.0 94 21 M+W GROUP, Albany, N.Y. 271.1 12.0 95 72 BIG-D CONSTRUCTION CORP., Salt Lake City, Utah 266.5 0.0 96 ** COMMODORE BUILDERS, Waltham, Mass. 263.0 0.0 97 92 DELLBROOK/JK SCANLAN, Quincy, Mass. 260.7 0.0 98 ** NEW SOUTH CONSTRUCTION CO. INC., Atlanta, Ga. 259.5 0.0 99 81 SPAWGLASS HOLDING LP, Selma, Texas 259.5 0.0 100 ** W.M. JORDAN CO., Newport News, Va. 259.0 0.0 44  ENR  June 13, 2016 enr.com ENR06132016Top100_PDF_List.indd 44 6/6/16 1:52 PM