One Party State? Select Committees: The Changing Face of Parliamentary ScrutinyHarry Shackleton
A report which shares our insights on potential changes to select committee membership, impact on opposition parties and the future role of the House of Lords as a scrutinising function.
This paper deals with the question of how consumption taxes, especially the value-added tax, affect consumption prices. The analyses are based on data from EU countries for the period 1970–2004. The starting point is a conventional supply-demand analysis of the tax incidence problem. This problem is solved using some simple price mark-up equations, Phillips curves and inflation forecast error equations. All these equations are estimated from panel data from EU countries using different estimators and variable specifications. In addition, an analysis is carried out with Finnish excise taxes using commodity/outlet level micro data for the period 1997–2004. A general result of all analyses is that about two thirds of a tax increase shifts to consumer prices. By contrast, there is less evidence on shifts to producer prices.
Le Royaume-Uni lui-même serait le plus affecté, avec, à l'horizon 2030, un différentiel de Produit intérieur brut (PIB) par habitant pouvant aller, dans le pire des scénarios, jusqu'à 14% par rapport à ce qu'il serait en restant dans l'UE. Les économies que pourrait réaliser Londres en ne contribuant plus au budget européen ne compenseraient en aucun cas le manque à gagner, préviennent les auteurs de l'étude.
Tässä tutkimuksessa näytetään, että hinnat reagoivat enemmän arvonlisäveron (alv) nousuihin kuin laskuihin. Ensiksi hyödyntäen alv:n muutoksia EU-maissa vuosina 1996-2015 havaitaan, että hinnat nousevat 3-4 kertaa enemmän alv:n nousujen seurauksena kuin ne laskevat alv:n laskujen seurauksena. Toiseksi hyödyntäen Suomen hiusalan alv:n muutoksia, jotka nähdään uskottavasti eksogeenisena hintojen ja yritysten käyttäytymiselle, havaitaan että epäsymmetrinen hintojen muutos alv:n vaikutuksesta säilyy usean vuoden ajan veromuutosten jälkeen. Kolmanneksi tutkimuksessa dokumentoidaan useita empiirisiä havaintoja, jotka eivät ole yhdenmukaisia taloustieteellisten veron kohtaantoa käsittelevien mallien kanssa. Tutkimuksen havaintojen perusteella yritysten käyttäytymisen piirteet aiheuttavat alv:n epäsymmetrisen hintavaikutuksen. Tulosten mukaan yritykset hyötyvät eri suuntiin tapahtuvista alv:n muutoksista korkeampien voittojen muodossa.
Presentation by Precious C. Akanonu and Joseph Ishaku at the second annual Nigerian Tax Research Network meeting which took place in Abuja on 24th and 25th November 2018.
This is a colour coded suggested answer to the May 2014 EdExcel economic question on the market for cigarettes. Colour coding is used to demonstrate the different skills of knowledge, application, analysis and evaluation to show how answers can be constructed to earn high marks under timed conditions.
U.S. Organic Tobacco Market. Analysis and Forecast To 2025IndexBox Marketing
This report provides an in-depth analysis of the U.S. organic tobacco market. It presents the latest data of the market size and volume, domestic production, exports and imports, price dynamics and turnover in the industry. The forecast reveals market prospects to 2025.
Excise taxes on alcohol & other sin products have long been a dependable and significant revenue source for Policy planners in India. Maximization of Government Revenue to generate resources that can be utilized to finance Departmental projects is always accorded a high priority on the agenda of the policymakers. However, when it comes to framing a policy such as Excise Policy, the Excise & Taxation Department has to give due weight to the health and well-being of the citizens of the State. An ideal Excise Policy, therefore, not only has to strike a delicate balance between the twin objectives of preventing dominance of liquor mafia or social degeneration on the one hand and securing an optimum revenue for the Government on the other, but also has to address the concerns of all the four key stakeholders i.e. the Government, the Manufacturers, the Licensees and most important of all, the Consumer. While there are various other factors that also play a significant role in
achieving the State Excise Objective, the article explores the role of Tax Stamps & Traceability Technology Role in State Excise Policy in the current scenario.
EU: Cigarettes Containing Tobacco – Market Report. Analysis and Forecast to 2020IndexBox Marketing
IndexBox Marketing has just published its report: “EU: Cigarettes Containing Tobacco - Market Report. Analysis And Forecast To 2020”. This report focuses on the EU cigarette with tobacco market, providing a comprehensive analysis and the most recent data on its market size and volume, EU trade, price dynamics, domestic production, and turnover in the industry. The market trends section reveals the main issues and uncertainties concerning the industry, while the medium-term outlook uncovers market prospects. The attractivity index (IB Index) summarizes the source of existing opportunities as they appear in this market, as well as an interpretation of the trade figures.
Alco-beverages industry to be adversely hit by exclusion from GST - Dr Sanjiv...D Murali ☆
Alco-beverages industry to be adversely hit by exclusion from GST - Dr Sanjiv Agarwal - Article published in Business Advisor, dated March 25, 2017 - http://www.magzter.com/IN/Shrinikethan/Business-Advisor/Business/
ESRI researchers Tim Callan and Claire Keane presented "Tax and welfare policy: indexation and benchmarks for distributional impact" at the Budget Perspectives 2020 conference on 13 June, 2019.
Read the full publication here: https://www.esri.ie/publications/assessing-the-distributional-impact-of-budgetary-policy-the-role-of-benchmarks-and
See more from the conference here: https://www.esri.ie/events/budget-perspectives-2020
The Cap & Trade program is Ontario's critical step towards meeting environmental goals while retaining competitiveness for its industries.
Here is an overview of the program - deep enough to grasp all aspects but simple and brief enough to maintain focus.
Illicit liquor trade poses a serious threat to government, socially
as well economically. Excise duty which is an important source
of revenue is continually under threat from the practice of illicit
trade. Considerable amount of money which could be used to
benefit the government services of a country are being diverted
to the pockets of criminals participating in illegal trading. In
addition, the illicit trade in liquor poses a serious threat to
consumer health.
To counteract it, some State governments have implemented
Tax Stamps as part of their anti-counterfeiting strategy. This
has not only minimized the hooch tragedies and duplication but
has also substantially increased the excise revenue collection in
States.
This issue brings our cover story on “TAX STAMPS
ROLE IN IMPLEMENTING IDEAL STATE EXCISE
POLICY”. Apart from this, the issue also covers interviews,
industry updates & news.
We hope you will find this issue informative and interesting and
as always, we look forward to receiving your feedback.
If you have any news, contributions or comments for the
editorial team, please feel free to email us at info@aspaglobal.
com
what is the future of Pi Network currency.DOT TECH
The future of the Pi cryptocurrency is uncertain, and its success will depend on several factors. Pi is a relatively new cryptocurrency that aims to be user-friendly and accessible to a wide audience. Here are a few key considerations for its future:
Message: @Pi_vendor_247 on telegram if u want to sell PI COINS.
1. Mainnet Launch: As of my last knowledge update in January 2022, Pi was still in the testnet phase. Its success will depend on a successful transition to a mainnet, where actual transactions can take place.
2. User Adoption: Pi's success will be closely tied to user adoption. The more users who join the network and actively participate, the stronger the ecosystem can become.
3. Utility and Use Cases: For a cryptocurrency to thrive, it must offer utility and practical use cases. The Pi team has talked about various applications, including peer-to-peer transactions, smart contracts, and more. The development and implementation of these features will be essential.
4. Regulatory Environment: The regulatory environment for cryptocurrencies is evolving globally. How Pi navigates and complies with regulations in various jurisdictions will significantly impact its future.
5. Technology Development: The Pi network must continue to develop and improve its technology, security, and scalability to compete with established cryptocurrencies.
6. Community Engagement: The Pi community plays a critical role in its future. Engaged users can help build trust and grow the network.
7. Monetization and Sustainability: The Pi team's monetization strategy, such as fees, partnerships, or other revenue sources, will affect its long-term sustainability.
It's essential to approach Pi or any new cryptocurrency with caution and conduct due diligence. Cryptocurrency investments involve risks, and potential rewards can be uncertain. The success and future of Pi will depend on the collective efforts of its team, community, and the broader cryptocurrency market dynamics. It's advisable to stay updated on Pi's development and follow any updates from the official Pi Network website or announcements from the team.
where can I find a legit pi merchant onlineDOT TECH
Yes. This is very easy what you need is a recommendation from someone who has successfully traded pi coins before with a merchant.
Who is a pi merchant?
A pi merchant is someone who buys pi network coins and resell them to Investors looking forward to hold thousands of pi coins before the open mainnet.
I will leave the telegram contact of my personal pi merchant to trade with
@Pi_vendor_247
Exploring Abhay Bhutada’s Views After Poonawalla Fincorp’s Collaboration With...beulahfernandes8
The financial landscape in India has witnessed a significant development with the recent collaboration between Poonawalla Fincorp and IndusInd Bank.
The launch of the co-branded credit card, the IndusInd Bank Poonawalla Fincorp eLITE RuPay Platinum Credit Card, marks a major milestone for both entities.
This strategic move aims to redefine and elevate the banking experience for customers.
how can i use my minded pi coins I need some funds.DOT TECH
If you are interested in selling your pi coins, i have a verified pi merchant, who buys pi coins and resell them to exchanges looking forward to hold till mainnet launch.
Because the core team has announced that pi network will not be doing any pre-sale. The only way exchanges like huobi, bitmart and hotbit can get pi is by buying from miners.
Now a merchant stands in between these exchanges and the miners. As a link to make transactions smooth. Because right now in the enclosed mainnet you can't sell pi coins your self. You need the help of a merchant,
i will leave the telegram contact of my personal pi merchant below. 👇 I and my friends has traded more than 3000pi coins with him successfully.
@Pi_vendor_247
The Evolution of Non-Banking Financial Companies (NBFCs) in India: Challenges...beulahfernandes8
Role in Financial System
NBFCs are critical in bridging the financial inclusion gap.
They provide specialized financial services that cater to segments often neglected by traditional banks.
Economic Impact
NBFCs contribute significantly to India's GDP.
They support sectors like micro, small, and medium enterprises (MSMEs), housing finance, and personal loans.
Even tho Pi network is not listed on any exchange yet.
Buying/Selling or investing in pi network coins is highly possible through the help of vendors. You can buy from vendors[ buy directly from the pi network miners and resell it]. I will leave the telegram contact of my personal vendor.
@Pi_vendor_247
The European Unemployment Puzzle: implications from population agingGRAPE
We study the link between the evolving age structure of the working population and unemployment. We build a large new Keynesian OLG model with a realistic age structure, labor market frictions, sticky prices, and aggregate shocks. Once calibrated to the European economy, we quantify the extent to which demographic changes over the last three decades have contributed to the decline of the unemployment rate. Our findings yield important implications for the future evolution of unemployment given the anticipated further aging of the working population in Europe. We also quantify the implications for optimal monetary policy: lowering inflation volatility becomes less costly in terms of GDP and unemployment volatility, which hints that optimal monetary policy may be more hawkish in an aging society. Finally, our results also propose a partial reversal of the European-US unemployment puzzle due to the fact that the share of young workers is expected to remain robust in the US.
how to sell pi coins in all Africa Countries.DOT TECH
Yes. You can sell your pi network for other cryptocurrencies like Bitcoin, usdt , Ethereum and other currencies And this is done easily with the help from a pi merchant.
What is a pi merchant ?
Since pi is not launched yet in any exchange. The only way you can sell right now is through merchants.
A verified Pi merchant is someone who buys pi network coins from miners and resell them to investors looking forward to hold massive quantities of pi coins before mainnet launch in 2026.
I will leave the telegram contact of my personal pi merchant to trade with.
@Pi_vendor_247
What website can I sell pi coins securely.DOT TECH
Currently there are no website or exchange that allow buying or selling of pi coins..
But you can still easily sell pi coins, by reselling it to exchanges/crypto whales interested in holding thousands of pi coins before the mainnet launch.
Who is a pi merchant?
A pi merchant is someone who buys pi coins from miners and resell to these crypto whales and holders of pi..
This is because pi network is not doing any pre-sale. The only way exchanges can get pi is by buying from miners and pi merchants stands in between the miners and the exchanges.
How can I sell my pi coins?
Selling pi coins is really easy, but first you need to migrate to mainnet wallet before you can do that. I will leave the telegram contact of my personal pi merchant to trade with.
Tele-gram.
@Pi_vendor_247
how to sell pi coins effectively (from 50 - 100k pi)DOT TECH
Anywhere in the world, including Africa, America, and Europe, you can sell Pi Network Coins online and receive cash through online payment options.
Pi has not yet been launched on any exchange because we are currently using the confined Mainnet. The planned launch date for Pi is June 28, 2026.
Reselling to investors who want to hold until the mainnet launch in 2026 is currently the sole way to sell.
Consequently, right now. All you need to do is select the right pi network provider.
Who is a pi merchant?
An individual who buys coins from miners on the pi network and resells them to investors hoping to hang onto them until the mainnet is launched is known as a pi merchant.
debuts.
I'll provide you the Telegram username
@Pi_vendor_247
when will pi network coin be available on crypto exchange.DOT TECH
There is no set date for when Pi coins will enter the market.
However, the developers are working hard to get them released as soon as possible.
Once they are available, users will be able to exchange other cryptocurrencies for Pi coins on designated exchanges.
But for now the only way to sell your pi coins is through verified pi vendor.
Here is the telegram contact of my personal pi vendor
@Pi_vendor_247
US Economic Outlook - Being Decided - M Capital Group August 2021.pdfpchutichetpong
The U.S. economy is continuing its impressive recovery from the COVID-19 pandemic and not slowing down despite re-occurring bumps. The U.S. savings rate reached its highest ever recorded level at 34% in April 2020 and Americans seem ready to spend. The sectors that had been hurt the most by the pandemic specifically reduced consumer spending, like retail, leisure, hospitality, and travel, are now experiencing massive growth in revenue and job openings.
Could this growth lead to a “Roaring Twenties”? As quickly as the U.S. economy contracted, experiencing a 9.1% drop in economic output relative to the business cycle in Q2 2020, the largest in recorded history, it has rebounded beyond expectations. This surprising growth seems to be fueled by the U.S. government’s aggressive fiscal and monetary policies, and an increase in consumer spending as mobility restrictions are lifted. Unemployment rates between June 2020 and June 2021 decreased by 5.2%, while the demand for labor is increasing, coupled with increasing wages to incentivize Americans to rejoin the labor force. Schools and businesses are expected to fully reopen soon. In parallel, vaccination rates across the country and the world continue to rise, with full vaccination rates of 50% and 14.8% respectively.
However, it is not completely smooth sailing from here. According to M Capital Group, the main risks that threaten the continued growth of the U.S. economy are inflation, unsettled trade relations, and another wave of Covid-19 mutations that could shut down the world again. Have we learned from the past year of COVID-19 and adapted our economy accordingly?
“In order for the U.S. economy to continue growing, whether there is another wave or not, the U.S. needs to focus on diversifying supply chains, supporting business investment, and maintaining consumer spending,” says Grace Feeley, a research analyst at M Capital Group.
While the economic indicators are positive, the risks are coming closer to manifesting and threatening such growth. The new variants spreading throughout the world, Delta, Lambda, and Gamma, are vaccine-resistant and muddy the predictions made about the economy and health of the country. These variants bring back the feeling of uncertainty that has wreaked havoc not only on the stock market but the mindset of people around the world. MCG provides unique insight on how to mitigate these risks to possibly ensure a bright economic future.
The secret way to sell pi coins effortlessly.DOT TECH
Well as we all know pi isn't launched yet. But you can still sell your pi coins effortlessly because some whales in China are interested in holding massive pi coins. And they are willing to pay good money for it. If you are interested in selling I will leave a contact for you. Just telegram this number below. I sold about 3000 pi coins to him and he paid me immediately.
Telegram: @Pi_vendor_247
how to swap pi coins to foreign currency withdrawable.DOT TECH
As of my last update, Pi is still in the testing phase and is not tradable on any exchanges.
However, Pi Network has announced plans to launch its Testnet and Mainnet in the future, which may include listing Pi on exchanges.
The current method for selling pi coins involves exchanging them with a pi vendor who purchases pi coins for investment reasons.
If you want to sell your pi coins, reach out to a pi vendor and sell them to anyone looking to sell pi coins from any country around the globe.
Below is the contact information for my personal pi vendor.
Telegram: @Pi_vendor_247
how to swap pi coins to foreign currency withdrawable.
Enhanced tobacco taxation is likely to reduce cigarette consumption and generate more revenue
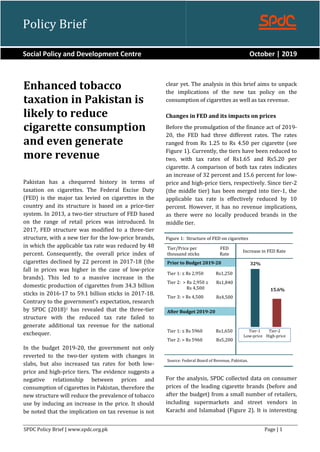
1. SPDC Policy Brief | www.spdc.org.pk Page | 1
Pakistan has a chequered history in terms of
taxation on cigarettes. The Federal Excise Duty
(FED) is the major tax levied on cigarettes in the
country and its structure is based on a price-tier
system. In 2013, a two-tier structure of FED based
on the range of retail prices was introduced. In
2017, FED structure was modified to a three-tier
structure, with a new tier for the low-price brands,
in which the applicable tax rate was reduced by 48
percent. Consequently, the overall price index of
cigarettes declined by 22 percent in 2017-18 (the
fall in prices was higher in the case of low-price
brands). This led to a massive increase in the
domestic production of cigarettes from 34.3 billion
sticks in 2016-17 to 59.1 billion sticks in 2017-18.
Contrary to the government’s expectation, research
by SPDC (2018)1 has revealed that the three-tier
structure with the reduced tax rate failed to
generate additional tax revenue for the national
exchequer.
In the budget 2019-20, the government not only
reverted to the two-tier system with changes in
slabs, but also increased tax rates for both low-
price and high-price tiers. The evidence suggests a
negative relationship between prices and
consumption of cigarettes in Pakistan, therefore the
new structure will reduce the prevalence of tobacco
use by inducing an increase in the price. It should
be noted that the implication on tax revenue is not
clear yet. The analysis in this brief aims to unpack
the implications of the new tax policy on the
consumption of cigarettes as well as tax revenue.
Changes in FED and its impacts on prices
Before the promulgation of the finance act of 2019-
20, the FED had three different rates. The rates
ranged from Rs 1.25 to Rs 4.50 per cigarette (see
Figure 1). Currently, the tiers have been reduced to
two, with tax rates of Rs1.65 and Rs5.20 per
cigarette. A comparison of both tax rates indicates
an increase of 32 percent and 15.6 percent for low-
price and high-price tiers, respectively. Since tier-2
(the middle tier) has been merged into tier-1, the
applicable tax rate is effectively reduced by 10
percent. However, it has no revenue implications,
as there were no locally produced brands in the
middle tier.
Figure 1: Structure of FED on cigarettes
Tier/Price per
thousand sticks
FED
Rate
Increase in FED Rate
Prior to Budget 2019-20
Tier 1: ≤ Rs 2,950
Tier 2: > Rs 2,950 ≤
Rs 4,500
Tier 3: > Rs 4,500
Rs1,250
Rs1,840
Rs4,500
After Budget 2019-20
Tier 1: ≤ Rs 5960
Tier 2: > Rs 5960
Rs1,650
Rs5,200
Source: Federal Board of Revenue, Pakistan.
For the analysis, SPDC collected data on consumer
prices of the leading cigarette brands (before and
after the budget) from a small number of retailers,
including supermarkets and street vendors in
Karachi and Islamabad (Figure 2). It is interesting
32%
15.6%
Tier-1 Tier-2
Low-price High-price
Policy Brief
Social Policy and Development Centre October | 2019
Enhanced tobacco
taxation in Pakistan is
likely to reduce
cigarette consumption
and even generate
more revenue
2. SPDC Policy Brief | www.spdc.org.pk Page | 2
to note that all the leading brands fall either under
the low-price or high-price tiers. Thus, none of
these brands could have an advantage from tax
reduction in the middle tier. One of the potential
reasons is that the cigarette manufacturers lowered
the prices when there was a three-tier tax structure
regime to enjoy the benefits of lower taxes in tier-1.
Figure 2: Consumer Price of cigarettes– before and
after change in FED (Rs per pack of 20 cigarettes)
Source: Data collected from retailers.
Note: Brands in Tier 1 include Capstan by Pall Mall, Morven
Gold, Gold Flake, K2, Red & White and Diplomat. Brands in
Tier 2 include Benson & Hedges, Dunhill and John Player
Gold Leaf.
As far as the market share of various locally
manufactured brands is concerned, six low-price
brands occupy at least 78.5 percent of the market
while four high-price brands have a share of 16.4
percent, as shown in Figure 3. Altogether, these
brands constitute a market share of 94.9 percent of
locally produced taxable cigarettes. To put it
simply, these brands cover a sizable portion of the
market and can be used for analysis to represent
the market at large.
The final consumer price (or final price) of locally
produced taxable cigarettes have three
components. The first being a net-of-tax price that
includes the cost of producing cigarettes, the
producer’s profit, a wholesaler and retailer’s
margin as well as freight charges. The second
includes the FED, and the third, the General Sales
Tax (GST). Figure 4 presents the breakdown of
these price components per pack (20 cigarettes)
before and after the budget 2019-20.
In the case of the low-price tier, the net-of-tax price
and the FED have an almost equal share in the final
consumer price before and after the budget.
Interestingly, manufacturers increased the net-of-
tax price more than the increase of the FED. As a
result, the share of the FED in the final consumer
price declined marginally from 43.1 percent to 42.6
percent. Conversely, the net-of-tax price in the high-
price tier increased by 9.4 percent as compared to a
15.6 percent increase in the FED. This resulted in a
slight increase of the FED share in final price from
62.5 percent to 63.4 percent. Overall, the final price
increased by 33.6 percent and 13.9 percent for low-
price and high-price tiers, respectively.
The changes have profound implications on the
consumption of cigarettes. Due to the fact that the
consumption of cigarettes are sensitive to price
changes, an increase in the final consumer price is
likely to reduce the consumption of cigarettes in
Pakistan. It is important to note that the decline will
be an outcome of an increase in both the net-of-tax
price as well as the FED.
Figure 3: Market shares of leading brands
Brand Company Share (%)
Tier 1 – Low-price 78.5
Capstan by Pall Mall PTC 32.4
Morven Gold PMPK 20.6
Gold Flake PTC 19.2
Red & White PMPK 4.2
K2 PMPK 1.1
Diplomat PMPK 1.0
Tier 2 –High-price 16.4
John Player Gold Leaf PTC 12.4
Marlboro PMPK 2.5
Benson & Hedges PTC 0.9
Dunhill PTC 0.6
Others 5.1
All - Locally Produced 100.0
Sources:
i) Euromonitor Report 2017 (for market shares)
ii) FBR (for tax rates)
PTC= Pakistan Tobacco Company
PMPK= Philip Morris Pakistan
58.0
144.0
77.5
164.0
Low-price High-price
Before After
33.6%
13.9%
3. SPDC Policy Brief | www.spdc.org.pk Page | 3
Figure 4: Components of price
(Rs per pack of 20 cigarettes)
Before
June2019
After
June 2019
Change
(%)
Low-Price
Price net of taxes 24.6 33.2 35.2%
FED 25.0 33.0 32.0%
GST 8.4 11.3 33.7%
Final consumer price 58.0 77.5 33.6%
Share of FED in final price 43.1% 42.6%
High-Price
Price net of taxes 33.1 36.2 9.4%
FED 90.0 104.0 15.6%
GST 20.9 23.8 13.9%
Final consumer price 144.0 164.0 13.9%
Share of FED in final price 62.5% 63.4%
Source: Authors’ computations based on retail prices and applicable
tax rates.
Impact of increased price on cigarette
consumption
The quantum of decline in consumption depends on
the change in price and the own-price elasticity of
the commodity i.e., cigarettes.2 The final consumer
price increased due to two reasons: an increase in
the net-of-tax price (producer price) as well as the
change in taxes. In order to isolate these impacts,
three sets of prices were used: P0–the weighted
average price (of all tiers) without any change in
the net-of-tax price and tax rates, P1– an
intermediate weighted average price containing
only the impact of increase in net-of-tax price, and
P2– weighted average price containing both impacts
i.e., change in net-of-tax price and taxation. Figure 5
presents the three sets of prices with their
components. It shows on average, the net-of-tax
price per cigarette increased from Rs 1.29 to Rs
1.66, resulting in an increase of more than 12
percent in the final consumer price. After
incorporating the change in the FED (from Rs 1.74
to Rs 2.18) and GST, the final consumer price
increased to Rs 4.49 per cigarette (26.5 percent).
Few studies in Pakistan have systematically
estimated the elasticity of demand or own-price
elasticity of cigarettes, with PIDE’s (2018)3 being
the latest addition. Based on the HIES4 (2016)
cross-sectional data, PIDE estimated the own-price
elasticity of -1.069 for all price tiers of cigarettes. In
another study, Burki, et al. (2014)5 used a time
series model and estimated the own-price elasticity
of cigarettes to be -0.58 in short-run for all tiers of
cigarette prices.
Given that the brief focuses on the analysis of one
year only, it uses both elasticities to estimate the
consumption of cigarettes between 2019-20.
Similar to the price computations above, there were
three quantities of consumption that were
estimated: Q0 – baseline quantity of consumption of
cigarettes in 2018-19; Q1 – intermediate
consumption based on price P1 (price containing
only the impact of increase in net-of-tax price); and
Q2–the final projected consumption of cigarettes in
2019-20 based on price P2 (incorporating changes
in the net-of-tax prices and taxes).
Figure 5: Per cigarette price and taxes (Rs)
Price Components P0 P1 P2
Net-of-tax Price 1.29 1.66 1.66
Federal Excise Duty 1.74 1.74 2.18
Sales Tax 0.52 0.58 0.65
Final Price 3.55 3.97 4.49
Source: Authors’ estimates
As shown in Figure 6, the change in the FED caused
an expected decline of 18 percent based on cross-
sectional elasticity and 9.2 percent based on the
short-run time series elasticity. Therefore,
regardless of the elasticity used, consumption of
cigarettes is likely to decline in 2019-20 within the
estimated range due to the change in prices of
cigarettes.
Figure 6: Projected Consumption of Cigarettes in 2019-20
(Billion sticks)
Scenario 1 Scenario 2
Q0 60.70 60.70
Elasticity -1.069 -0.580
Q1 52.90 56.47
Q2 43.37 51.30
Decline in Consumption due
to change in FED
-18.0% -9.2%
Source: Authors’ estimates
4. SPDC Policy Brief | www.spdc.org.pk Page | 4
Impact on tax revenue
The estimated impact of change in structure and
rate of the FED on tax revenue for 2019-20 is
presented in Figure 7. Estimates based on the
cross-sectional elasticity indicate that the tax
authorities are likely to collect Rs 0.5 billion more
collectively from both the FED and GST. However,
if consumption declines in line with the short-run
elasticity, revenue collection from both taxes will
be increased by Rs 15 billion– from Rs 130.8 billion
in 2018-19 to Rs 145.5 billion in 2019-20. In either
case, the current tax policy is likely to have a
positive impact on tax revenue.
Figure 7: Estimated impact of change in FED on tax
revenues (Billion Rs)
No Change in
FED
Change
in FED
Change in
Revenues
Growth
Tax revenue based on cross-section elasticity
FED 92.0 94.7 2.7 3.0%
GST 30.5 28.3 -2.2 -7.3%
Total 122.5 123.0 0.5 0.4%
Tax revenue on short-run time series elasticity
FED 98.2 112.0 13.8 14.1%
GST 32.6 33.5 0.9 2.8%
Total 130.8 145.5 14.7 11.3%
Source: Authors’ estimates.
Conclusion
This analysis demonstrates that changes in
structure and rate of the FED introduced in the
Budget 2019-20 are commendable in two ways:
First, these changes are likely to reduce
cigarette consumption between 9 percent
and 18 percent in Pakistan. A decline of this
magnitude will positively contribute to
public health outcomes.
Second, in contrast to the general perception
that the tax increase may result in reduced
revenues, this analysis shows an increase in
tax revenues, though the quantum of
increase will depend on the magnitude of
reduction in the consumption of cigarettes.
Notes:
1. Macroeconomic Impacts of Tobacco Use in Pakistan.
Social Policy and Development Centre (SPDC). Karachi.
2018. Available at:
www.spdc.org.pk/Publication_detail.aspx?sysID=853
2. The own-price elasticity of demand is the percentage
change in the quantity demanded of a good or service
divided by the percentage change in the price.
3. Economics of Tobacco Taxation and Consumption in
Pakistan. Pakistan Institute of Development Economics
(PIDE). Islamabad. 2018. Available at:
https://pide.org.pk/Research/Economics-of-Tobacco.pdf
4. Household Integrated Economic Survey (HIES) 2015-
16, Pakistan Bureau of Statistics.
5. Burki, SJ, Pasha AG, Pasha HA, John R, Jha P, Baloch AA,
Kamboh GN, Cherukupalli R, Chaloupka FJ. The
Economics of Tobacco and Tobacco Taxation in
Pakistan. Paris: International Union against
Tuberculosis and Lung Disease. 2013.
The Social Policy and Development Centre (SPDC) is funded by the University of Illinois at Chicago’s (UIC) Institute for
Health Research and Policy to conduct economic research on tobacco taxation in Pakistan. UIC is a core partner of the
Bloomberg Philanthropies’ Initiative to Reduce Tobacco Use. The views expressed in this document cannot be attributed to,
nor do they represent, the views of UIC, the Institute for Health Research and Policy, or Bloomberg Philanthropies.
Social Policy and Development Centre
7th Floor, Aman Tower, IBA City Campus, Kayani Shaheed Road, Karachi
92 316 1113113 www.spdc.org.pk spdc@spdc.org.pk