1. U.S. State Cigarette Excise Taxes: Are They Tougher on Poor Smokers?
James Midkiff
George Washington University
May 4, 2016
Abstract: Usingdata from the 2009-10 and 2012-3 National AdultTobaccoSurvey (NATS),thispaper
looksat how variationinstate cigarette excise taxesaffectshow muchof theirincome smokersspend
on cigarettes. Usingseveral specificationsof alinearregression model andafteraccountingfor
smokers’ demographicinformation,state of residence,and state unemploymentrate atthe time the
surveywastaken, thisstudyfindsthat a one dollarincrease inthe state cigarette excise tax isassociated
witha one to two percentincrease inthe percentage of theirannual incomewhich asmokerspendson
cigarettes. Thisalongside the coefficientsof several otherincome-relatedindependentvariablespoints
to the conclusionthatstate cigarette excise taxeshave regressive effectsonsmokers.
2. 1
1. Introduction
Consideringthatsmokingcausesapproximately480,000 premature deathsinthe UnitedStates
each yearand entailsanestimated$300 billioninhealthcare expenditures,itisnowonderthatthe U.S.
federal governmentandstate governmentshave akeeninterestinreducingthe negative outcomes
fromsmoking.(Jamal etal.,2015) Currently,the U.S.CentersforDisease Control andPrevention (CDC)
estimatesthatapproximately16.8%of the U.S. adultnoninstitutionalizedcivilianpopulationare current
cigarette smokers,havingdecreasedfromarate of 20.9% in 2005. (Jamal etal.,2015) In2010, the
UnitedStates Departmentof HealthandHumanServicesestablishedaprogramcalled Healthy People
2020 withthe statedgoal of loweringsmokingprevalenceto12% by the year2020. Whetheror not the
countryas a whole will be able toreachthistargetremainstobe seen,buta varietyof factors have thus
far workedtodramaticallylowerthe prevalence of cigarette smokingoverthe long-termandwill
continue todo so. These include the scientificconsensusthatconsumingtobaccogreatlyincreases
one’sriskof developingspecificconditionssuchasheart disease,several typesof cancer,andstroke,
the growingevidence thatcigarette smokingcausesharmbeyondthe immediatesmokerviathe effects
of secondhandsmoke, long-termincreasesin fundingfortobaccocontrol programs, new regulations
requiringwarninglabels oncigarettes andlimitingtheiradvertising,increasedavailabilityof medical aids
to quitsmoking,andlarge increasesincigarette excise taxesat the state and local level. The CDCinfact
recommendsasone of its bestpracticesthatstatescontinue toincrease theircigarette excise taxes.
(Kingetal.,2014)
Cigarette excise taxeshave beenaroundforsome time asthe firstfederal cigaretteexcise tax
was enactedin1864, thoughprimarilyasa revenue-generatingmeasure,andthe firststate cigarette
excise tax wasenactedin1921 inIowa.(Tax Foundation) Howeveritisa much more recenthabitfor
statesto greatlyincrease theircigarette excisetaxesinanefforttocombatsmoking. Nevertheless,the
3. 2
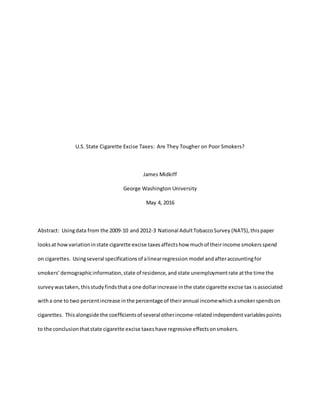
tax amountsvary greatly fromstate to state,rangingfrom $0.17 per pack of 20 cigarettes inMissouri to
$4.35 inNewYork as of January 2016. (Boonn,2016) See Figure 1 for a graph of all statesby their
abbreviationandtheirnominalcigarette excisetaxesin2009-10 and 2012-13; see Appendix1 fora list
of all state namesbytheirabbreviations alongwith theirexactnominaltax amounts. Although
PennsylvaniaandMinnesotachangedtheirexcisetaxesatthe beginningof the 2009-10 surveyperiod
and the endof the 2012-13 surveyperiod,respectively, Iignore these changes inmyanalysis due tothe
fact theywere onlyinplace fora veryshort periodof time andaffectedveryfew respondents. Itis
worthwhile tonote,althoughtheyare nota part of thisanalysis, thatstate cigarette excise taxesare
chargedon top of the $1.01 federal excisetax enactedinearly2009 and anylocal excise taxes,of which
Chicagoand NewYorkCity are noteworthyexampleswiththeircombinedstate-local cigarette excise
taxesof $6.16 and $5.85, respectively.
Like mostgovernmentpolicies,cigarette excisetaxeshave effectsbeyondthe immediate goal of
inducingsmokerstoquitandraisinggovernmentrevenueinthe process. Thispaperfocuseson one
aspectof thisbyspecificallylookingatthe income effectwhichstate-level excisetaxes have onsmokers,
particularlyonthose whoare lower-income. Afterexaminingthe existingliteratureoncigarette excise
taxesandgivingthe theorybehindthisstudy,Iwill presentandanalyze the regressionsbeforeexploring
theirimplicationsandavenuesforfuture research. Thisstudyfindsthree indicationsthatstate cigarette
excise taxesplace adisproportionate burdenonlower-income smokers: First, aone dollarincrease in
the state cigarette excise tax isassociatedwithbetweenaone and twopercentincrease inthe
percentage of theirannual income which asmokerspendsoncigarettes. Due tothe fact that lower-
income people smokeare more likelytosmoke thanare higher-incomepeople,anincrease incigarette
excise taxeswill affectmore lower-income peoplethanitwill higher-income people.(Farrellyetal.,
2012) Second,asthe baselinesmokerascendsincome categoriesshe pays8.5-12.5% lessof her income
towardcigarettes,demonstratingthatpoorersmokers alreadypaymore towardscigarettesthando
4. 3
higher-income smokers. Andthird,the interactiontermsof nominal tax multipliedbymiddle-income
groupand higher-incomegroupstatuslowerthe percentagesspentby smokersinthese groupsby
approximately1.5%and2%, respectively. Thisdemonstratesthatnominal taxesaffectsmokersinthese
income groupslessthantheydosmokersinthe lower-incomegroup.
01234
ID SCWYKY TN NEMS KS NV CO CA IN AR ORMN OH FL IA TX SD DE PA NMNH UT MT IL MI MD AZ ME AK DC MAWI VT NJWA HI CT RI NYMOVA OK LA GA AL ND NCWV
State Abbreviation
2009-10 Nominal Tax 2012-13 Nominal Tax
State Nominal Excise Tax per Pack of 20 Cigarettes
Figure 1 – State Nominal Excise Tax per Pack of 20 Cigarettes
Only eleven states (SC, NM, NH [decrease], UT, IL, VT, WA, HI, CT, RI, and NY) had increased their
nominal cigarette excise taxes by 2012-13 compared to their tax levels in 2009-10.
5. 4
2. Literature Review
There have beenmanydifferentstudieslookingthusfarat cigarette excisetaxesandhowthey
impactsmokersandaggregate smokinghabits. Originally,cigarette excise taxes were seenas positive
policymeasures because the increase inprice leadstoadecrease in demand. LewitandCoate (1982)
findthatthe U.S. adultprice elasticityof demandforcigarettesis -0.42withthe largesteffectsonyoung
malesviathe decisiontosmoke ornot ratherthan viaadjustmentsinthe quantityof cigarettes
consumed. Thus,foreverytenpercentincrease inprice,U.S.demandforcigarettesdecreases byabout
fourpercent. Theyfurtherpostulate thatthe beneficial effectsof cigarette excise taxeswouldincrease
overtime due to the natural tendencyof price elasticityof demandtoalsoincrease overtime;thus
successive generationswouldtake upsmokingevenlessthancurrentgenerations. Keeleretal.(1992)
use a natural experimentinCaliforniaandfindthatthe price elasticityof demandvaries from-0.3
to -0.5 in the short runand that thisalsoincreasedinthe longrun to between -0.5and-0.6. In a later
literature review,Baderetal. (2011) conclude thatcertainpopulationsathighriskof smokingare
6. 5
particularlyresponsive toincreasedcigarette pricesdue totaxation,namelyyouth,youngadults,and
personsof lowsocioeconomicstatus.
Lookingcloserat the theorybehindaddicts’behaviorandhow cigarette excise taxescanaffect
this, BeckerandMurphy (1988) bestarticulate the traditional modelof rational addiction astheybelieve
that an increase inthe permanentprice of addictive goodshas astrongereffectinreducingpresent
consumptionthananytemporarychange. Gruberand Koszegi (2003) take a differentapproach,
constructinga model of time-inconsistentsmokers’preferencesinwhichsmokersuse excise taxesasa
self-controlmechanismto helpthemselvesquit. Theyfindthatthe overall elasticityof demand
is-0.661, but the lowestincome quartilehassucha higherprice elasticityof demandat -1.05 that
cigarette excise taxescaninfactbe progressive. GruberandMullainathan(2005) follow thisupwiththe
findingthatinboththe UnitedStatesand inCanada smokersreport higherlevelsof happinessafter
increasesincigarette excisetaxes,aneffectabsentintheiranalysisof otherexcise taxes.
The major criticismprevalentinthe literature oncigarette excisetaxesistheirsupposed
regressivity. Giventhe traditional definitionof regressivity,thatthe poorpaya higherpercentage of
theirincome forthe tax thando higherincome groups,cigarette excise taxes are typicallyseenas
regressive.(Remler,2004) Remler(2004) alsoholdsthatthisregressivityworsenswheneconomists
take intoaccount the welfare implicationsof aperson’sdesire tosmoke. Manyotherresearchers
supportthe conclusionthatcigarette excise taxesare regressive: Franksetal.(2007) findthatwhile
lowerincome groupsusedtohave higherelasticitiesof demandforcigarettesthanhigherincome
groups,afterthe Master SettlementAgreement(MSA) betweenthe majorTobaccocompaniesandthe
attorneygeneralsof moststatesin1998, the difference betweentheirprice elasticitiesof demand
narrowed. The authorsconclude thatprice-basedtobaccocontrol policyafterthe MSA may have
become ineffective andregressiveasthe now remainingsmokersare highlyaddicted.
7. 6
Alongthe same lines, ColmanandRemler(2008) counterthe Gruber andKoszegi (2004) study
withthe findingthatwhile lowerincome groupsare more price sensitivethanthose withmore income,
the difference isnotenoughtoallowcigarette excisetaxestobe progressive. Theycalculate the price
elasticitiesof demand forlow,middle,andhigh-income groupstobe -0.37, -0.35 and-0.20, respectively.
Lastly, Farrellyetal.(2012) support the regressivityfindingsusingthe New YorkandNational Adult
Tobacco Surveys. Theycalculate thatinNew York,the state withthe highestcigarette excise tax levels
inthe country,householdsearninglessthan$30,000 annuallyspent23.6% of theirincome oncigarettes
in2010-11, up from 11.6% in 2003-04. These numbersare significantlyhigherthanthe percentage of
income spentoncigarettesbyotherincome groupsinNew York,as well asthe overall percentage of
income spentoncigarettesinthe United States. Farrellyetal.(2012) furthersupport theirconclusion
that cigarette excise taxesare regressive withthe findingthatdailycigarette consumptionisnotrelated
to income, muchas do Hofferetal.(2015). ThisstudyservestobuilduponFarrellyetal.’s(2012)
analysisbyincorporatingotheryearsfromthe NATS,poolingthesedatasetstogether, includingthe
state’sunemploymentrate inan attempttocapture statewide economicperformance, andexpanding
the study’sscope to include all stateswithinthe U.S.andthe Districtof Columbia.
3. Model
As the UnitedStatescontinuestostrive tolowerthe prevalence of smokingand itsrelated
healthandexpense impacts,itisimportanttochoose amongstavarietyof effectivepolicymeasures,
includingcigarette excisetaxes. Indoingso howeveritis alsoimportantto look outfor unanticipated
negative effects inthese policies. Therefore the aimof thispaperistoexplore how nominal state
cigarette excise taxesaffectthe percentof householdincome spentbysmokersof differentincome
groupsin 2009-10 and 2012-13. These yearswere the onlypubliclyavailableversionsof the NATS. This
8. 7
paperis highlyrelevantasthe CDC hasreportedthat people atorbelow the federal povertylevel are
one of the groupswithhigherthanaverage ratesof smoking(Jamal etal.,2015). The possibilitythat
these excise taxesmaynegativelyaffectthe same peoplewhomthe governmentispushingtoquitisan
importantconsiderationasstatescontinue toincrease theircigarette excisetaxes.
The basic linearregressions isasfollows,withvariabledescriptionsprovidedin Table 1:
PercentIncome= βi1Marital+ βi2Gender+ βi3Educa + βi4Age+ βi5RaceEthnic+ βi6Income+ βi7State
+ βi8Year+ βi10MidInteraction +βi11HighInteraction +β12NominalTax +β13StateUnemp +α
Table 1 – Variable Descriptions
Observations were dropped if they did not match these categories.“i” means that each different category of those
variableshad a different β value.
Variables Description
PercentIncome The percentage of their household income which each smoker spends on cigarettes annually:
= Self-Reported NATS Daily Cigarette Consumption * Underreporting Adjustment * (NATS
Self-Reported Priceper Pack/20 cigarettes per pack) * 365 days per year/Income Midpoint*
100
This is the dependent variablefor the Original Model and Alternate Model 1. See Appendix 2.
PercentIncome2 The percentage of their household income which each smoker spends on cigarettes annually:
= Calculated National Mean of Cigarette Consumption per Day * (NATS Self-Reported Price
per Pack/20 cigarettes per pack) * 365 days per year/Income Midpoint* 100
This is the dependent variableonly for Alternate Model 2 as itonly includes thosesmokers
who originally self-reported their income and does not includethose smokers for whom the
average cigarette consumption per person was imputed for that year. See Appendix 2.
i.Marital Categorical Variableof Respondent’s Marital Status
1 if Single/Never Married/Not Livingwith Partner
2 if Livingwith a Partner
3 if Married
4 if Separated
5 if Divorced
6 if Widowed
i.Gender Categorical Variableof Respondent’s Preferred Gender
0 if Female
1 if Male
i.Educa Categorical Variableof Respondent’s Highest Educational Attainment
1 if Less than High School Diploma,GED, or equivalent
2 if High School Diploma,GED, or equivalent
3 if Some College, no Degree
4 if Post High School Certificate or Diploma,or Associate’s Degree
9. 8
5 if Bachelor’s Degree
6 if Master’s, Professional,or Doctoral Degree
i.Age Categorical Variableof Respondent’s Age Group
1 if 18-24
2 if 25-34
3 if 35-44
4 if 45-54
5 if 55-64
6 if 65+
i.RaceEthnic Categorical Variableof Respondent’s Race and Ethnicity:
1 if White only,non-Hispanic
2 if Black only,non-Hispanic
3 if Hispanic
4 if Asian only,non-Hispanic
5 if Other non-Hispanic
i.Income Categorical Variableof the Annual Household Income Group:
1 if less than $20,000 (assigned a midpointof $11000)
2 if $20,000 or greater, but less than $30,000 (assigned a midpointof $25,000)
3 if $30,000 or greater, but less than $40,000 (assigned a midpointof $35,000)
4 if $40,000 or greater, but less than $50,000 (assigned a midpointof $45,000)
5 if $50,000 or greater, but less than $70,000 (assigned a midpointof $60,000)
6 if $70,000 or greater, but less than $100,000 (assigned a midpointof $85,000)
7 if $100,000 or greater, but less than $150,000 (assigned a midpoint of $125,000)
8 if $150,000 or greater (assigned a midpointof $225,000)
i.State Categorical Variableof the Respondent’s State of Residence, includingthe Districtof
Columbia,numbered 1-51 in alphabetical order based upon the state’s postal abbreviation.
See Appendix 1 for a listingof states by abbreviation and number.
MidInteraction Interaction term equal to the respondent’s state nominal tax the year the survey was taken if
the respondent’s household income is $30,000 or greater but less than $70,000 (intended to
capture smokers in households which are “middle-income”). The term is equal to zero
otherwise.
This applies to income midpoints 3,4, and 5.
HighInteraction Interaction term equal to the respondent’s state nominal tax the year the survey was taken if
the respondent’s household income is greater than $70,000 (intended to capture smokers in
households which are“high-income”). The term is equal to zero otherwise.
This applies to income midpoints 6,7, and 8.
NominalTax The nominal tax in dollars on a pack of 20 cigarettes in the state when the survey was taken.
See Appendix 1 for a listingof the state nominal taxes.
i.Year Categorical Variableof the year in which the respondent received the survey.
1 = 2009-10
2 = 2012-13
StateUnemp The unemployment rate in the respondent’s state of residence averaged over the months in
which the survey was taken. (Bureau of Labor Statistics)
Giventhatpeople participatinginanactivityviewednegativelybysocietywill tendto
underreporttheiramountof participationinthatactivity (Warner,1978) andfollowingthe calculations
laidoutby Farrellyetal.(2012), thisstudyincludesanadjustmentto the percentage of household
10. 9
income whichsmokersspentoncigarettes. The variable PercentIncomeisafunctionof the total
cigarette production inthe UnitedStatesduringthe surveyyear – 303 billionin2010 and273 billionin
2013 – dividedbythe total numberof smokersinthe U.S.duringthe surveyyear – 45,704,214 in2010
and 43,589,334 in2013. This numberwasthendividedby365 to get the National EstimatedAverage
DailyCigarette Consumption persmoker,equal to 18.16325 for 2009-10 and 17.1589 for2012-13.
ThisEstimatedAverage DailyConsumptionwasthendividedbythe Average Self-ReportedDaily
Consumptionof all smokerswhorespondedtothe questiontoarrive at an adjustmentfactorof
1.192683 for 2012-13 and 1.181189 for 2009-10. Thisnumberwas multipliedbythe Self-Reported
Average DailyConsumptionforeachsmokertoarrive at theirAdjustedSelf-ReportedAverage Daily
Consumption.Anysmokerwhodidnotanswerwitha Self-ReportedAverage DailyConsumptionhad
that informationfilledinwiththe CalculatedNational DailyCigarette Consumptionfortheiryear,listed
above. The AdjustedSelf-ReportedAverageDailyConsumptionwasthenmultipliedbytheirself-
reportedprice of theirmostrecentpack theybought(orthe midpointof thatdollarcategory) and
dividedby20 cigarettesina pack. Lastly,itwas divided bythe midpointof the income categoryto
whichthe respondentbelonged(11,000; 25,000; 35,000; 45,000; 60,000; 85,000; 125,000; or 225,000)
and thenmultipliedby100. The midpointsof the income categories“<$20,000” and “>$150,000” were
increasedto$11,000 and $225,000 to account for the upward-skewedmeansinthose income
categories.(CensusBureau,2014 & 2016) See Appendix2 for a concise explanation of these
calculations.
I droppedobservations forrespondents:
1) Who had not smoked atleast 100 cigarettes in their life. I didthisto ensure thatthe
smokersinmyanalysiswere infact committed smokers.
11. 10
2) Who were not classified as a current “every day”or “somedays”smokerby theCDC. I
didthisbecause myanalysisonlylooksata state’s nominal excisetaxesatthe time the CDC
administeredthe survey,soformersmokersandnon-smokersare notaffectedbythese taxes.
3) Who reported that themostrecent pack they boughtexceeded $15 or wasless than $1. I
didthisin orderto eliminateatypical outlierswhichcouldskew myresults,asthese smokers
may nothave paid theirstate’sexcisetax.
4) Who had a PercentIncomevaluegreaterthan 60. I didthisbecause itisunreasonable
for someone totrulyspendmore than60% of theirhousehold’sincomeoncigarettesalone,and
it wouldskewmyresults.
5) Who had specified “unknown”,“don’tknow”,orleftblankany of the demographicor
incomequestions. I didthisinorder to analyze onlyfullycompletedsurveys.
Thispaperhas undertakenafewassumptions. First,the overwhelmingmajorityof acigarette
excise tax ispassedonto the endconsumerdue to theirinelasticdemand. Althoughotherstudieshave
accountedforinternetbuying,cigarette smuggling,andotherformsof tax evasion,theyare beyondthe
scope of thispaper.Additionally,thispaperdoesnotlookatthe effectsof local excise taxeson
consumers’behavior; these taxesare rare andtypicallyinconsequential,exceptforinthe citiesof
Chicagoand NewYork. Lastly,this analysis doesnotinclude the federal excise tax because the current
federal excisetax of $1.01 per pack wasinstitutedinApril of 2009 before the firstsurveyperiod,soall
smokersinthe NATSwhobuy throughlegal,proper,andnormal channels(e.g.notviasmuggling,
Internetsales,orNative Americanreservations) paythe exactsame federal excisetax regardlessof their
state or the surveyyear.
4. Data
12. 11
The combineddatasetfrom2009-10 and 2012-11 initiallyincluded178,773 observations,of
which66.33% came fromthe 2009-10 sample periodandthe remaindercame the 2012-13 sample
period. Afterreducingthe total observationstoonlythose smokerswhomthe CDCclassifiedascurrent
everyday/somedayssmokersandeliminatingrespondentswithincomplete income ordemographic
information,the datasetcontains n=12,896 observations. The mostnumerousrespondentsfromeach
demographiccategory are female,white only/non-Hispanic,have ahighschool diplomaorequivalent,
have a household income lessthan$20,000 annually,and are fromthe state of Louisiana. Iprovide the
mostimportantsummarystatistics forthe 12,896 observationsusedinthe Original Model inthe
followingfiguresandtables,alongwithhow several of the measuresregardingdemographic
compositioncompare tothe findingsfromJamal etal.(2014).
Figure 2 showsthatthe range of the percentage of annual householdincomespentbysmokers
inthe studyvaries greatlyfrom0.06% to more than sixtypercent. The x-axisinthisgraphisthe
percentage of income spentbyasmokeron cigaretteswiththatvariable condensedinto1% increments,
e.g.0-1%, 1-2%, 2-3%,etc. The y-axisisthe percentage of smokerswhofall intoeachparticular
incrementoutof the total sample. The mediansmokerspendslessthanfourpercentof hisor her
annual householdincomeoncigarettes while the average smokerspends slightlymore thansix percent
of hisor herannual householdincome oncigarettes. Ichose todrop any observations whichhave a
PercentIncomegreaterthan60 as those representunlikelyoutlierswhichwouldhighlyskew the results.
PercentIncome2,the dependentvariable inAlternate Specification2whichonlyincludessmokerswho
self-reporttheircigarette consumption, isvirtuallyidentical tothe variable PercentIncomewhich
includes all smokersincludingthose forwhom Ihave imputed theiraverage dailycigaretteconsumption.
68
ample
Percentage of Income Spent by Smokers on Cigarettes
Figure 2 – Graph of variable PercentIncome
13. 12
Regardingothersummarystatistics, Table 2 showsthata pluralityof smokersare married,
althoughsmokers docome froma varietyof differentcivilstatuscategories. Table 3 showsthat while
the overall datasethas more female smokersthanmale smokers,thisispredominantlydue tothe 2009-
10 dataset’sgenderimbalance asthe 2012-13 datasethas more male smokersthanfemale smokers.
Jamal et al.(2014) findthat menare more likelytosmoke thanwomen,however.
Table 2 – Marital Status Table 3 – Gender
Total 8,895 4,001 12,896
male 4,111 2,057 6,168
female 4,784 1,944 6,728
Gender 2009 2012 Total
Year
Total 12,896 100.00
Widowed 802 6.22 100.00
Divorced 2,240 17.37 93.78
Separated 571 4.43 76.41
Married 4,545 35.24 71.98
Living With Partner 1,584 12.28 36.74
Single 3,154 24.46 24.46
Marital Freq. Percent Cum.
Total 12,896 100.00
Master's, Professional, or Doctoral Deg 786 6.09 100.00
Bachelor's Degree 1,692 13.12 93.91
Post High School Certificate or Diploma 2,157 16.73 80.78
Some College, no Degree 2,495 19.35 64.06
High School Diploma, GED, or Equivalent 4,117 31.92 44.71
Less than High School Diploma, GED, or 1,649 12.79 12.79
Educa Freq. Percent Cum.
Table 4 – Educational Attainment
14. 13
Table 4 showsthat almosta majorityof smokersinthe combineddatasethave ahighschool
diplomaorless,withonly19% of smokershavingabachelor’sdegree orhigher. Thisislargelyinline
withwhatJamal et al.(2014) findto be the case, that smokingprevalence ishigheramonglesseducated
Americans.
Table 5 showsthat the ages of smokersare fairlyevenlydistributed,albeitthe highest
concentrationof respondentswhosmoke is betweenthe agesof 45 and 54. As tosmokers’race and
ethnicity, Table 6 showsthata vastmajorityof smokers are white,non-Hispanic. Jamal etal.(2014)
agree that whiteshave some of the highestprevalence ratesof smoking, butthatNative Americans,
AlaskanNatives,andmultiplerace individuals –individualswhowould likely fall underthe categoryof
“other”– have evenhigherprevalence ratesthanwhites.
Total 12,896 100.00
65+ 1,237 9.59 100.00
55-64 2,452 19.01 90.41
45-54 3,131 24.28 71.39
35-44 2,321 18.00 47.12
25-34 2,526 19.59 29.12
18-24 1,229 9.53 9.53
Age Freq. Percent Cum.
Table 5 – Age Table 6 – Race & Ethnicity
Total 12,896 100.00
Other, Non-Hispanic 1,156 8.96 100.00
Asian Only, Non-Hispanic 122 0.95 91.04
Hispanic 825 6.40 90.09
Black Only, Non-Hispanic 1,634 12.67 83.69
White Only, Non-Hispanic 9,159 71.02 71.02
RaceEthnic Freq. Percent Cum.
Total 12,896 100.00
225000 426 3.30 100.00
125000 882 6.84 96.70
85000 1,540 11.94 89.86
60000 1,898 14.72 77.92
45000 1,704 13.21 63.20
35000 1,829 14.18 49.98
25000 1,826 14.16 35.80
11000 2,791 21.64 21.64
ints Freq. Percent Cum.
IncomeMidpo
Table 7 – Income
15. 14
Table 7 displaysthe percentage of smokerswhofall withineachincome categoryandshows
that majorityof smokershave ahouseholdincome lessthan$40,000 annually.Thisiswell supportedby
Jamal et al.(2014) whoholdthat individualsbelow the federal povertylineare muchmore likelyto
smoke thanthose whoare above the federal povertyline.While thisstudydoesnotinclude information
on householdsize,itissafe toassume thatmany of the individualsinthe lowesttwoincome categories
are belowthe federal povertyline. Referback toTable 1 fora listingof income categoriesbytheir
assignedincome midpoints.
Figure 3 showsthe frequencyof smokersbaseduponthe adjustednumberof cigarettessmoked
perday, groupedtogetherinintervalsof asingle cigarette (e.g.0-1cigarettes,1-2cigarettes,etc.). Keep
inmindthat the adjustmentrateswere 18.119% inthe 2009-10 datasetand15.2105% in the 2012-13
dataset.It isevidentthatthere isa significantbunchingeffectinthe intervalsof 11-12 cigarettes,16-17
cigarettes,17-18 cigarettes,and23-24 cigarettes. There are two reasonsforthis: First,there was
understandablybunchinginthe smokers’original self-reportedcigarette consumptionaround10
cigarettes,ahalf-pack,andaround20 cigarettes,afull pack. These numbersare easyto mentally
calculate forthe smoker,easyto communicate tothe surveytaker,andperhapsserve asbenchmarksby
16. 15
whicha personmonitorstheirownsmoking. Afterincludingthe adjustmentrates,thesesmokersfall
intothe 11-12 cigarettescategoryandthe 23-24 cigarettescategoryrespectively.Secondly,the large
groupingat 16-17 and 17-18 cigarettesisdue to a large percentage of smokerswho,despite includingall
otherdemographicandcigarette relatedinformation,didnotindicate theiraverage dailycigarette
consumption. These smokersrepresent about28% of the reduced sample,numbering3,662, whichis
the difference inthe numberof observationsbetweenthe Original ModelandAlternate Model 2. The
author hasimputedthe calculatedaverage nationalcigarette consumptionforthese particularsmokers
dependinguponthe yearwhentheirsurveywastaken: 18.16325 for smokersin2009-10 and 17.1589
for those in2012-13. Lastly, Figure 4 showsthe self-reportedcostof the last packof cigarettes
purchasedbysmokersinthe NATSsurveygroupedbydollarcategory(e.g.$1-$2, $2-$3, etc.). The vast
05
10152025
Percent
0 5 10 15 20 25 30 35 40 45 50 55 60 65 70 75 80 85 90 95
AdjSmokPerDay
Adjusted Cigarettes Smoked per Day
Figure 3 – AdjustedCigarettesSmoked perDay
17. 16
majorityof smokersinthissurveypaidbetweenthree dollarsandeightdollarsfortheirlastpackof
cigarettes.
Regardingthe numberof smokersbystate and the state unemploymentrates, theyare notan
essential partof the analysis andtheirlengthytablesaddlittle tomyanalysis. Neverthelessitisworth
mentioningthatthe 51 states(50 state plus the Districtof Columbia) vary significantlyintermsof their
sample size, fromjustover40 respondents forsome states inthe 2012-13 surveyto300 or more in
certainstatesinthe 2009-10 surveyperiod. Forexample,Louisianahas527 smokersinthe final analysis
from2009-10 butonly61 smokersinthe seconddataset. The coefficientestimatesforstate
unemploymentare alwaysinsignificant,regardlessof the specification. Thusoverall itisclearthat in
many ways,the combineddatasetaccuratelyreflects the habitsandthe demographicprofile of
Americanswhosmoke –specificallyastheytend tobe low-income,white,andlow-educated. The data
usedforthisanalysis,however,doesdepart fromthe factsgivenbyJamal etal. (2014) regarding
smokers’sex andtheirstate of residence.
0
102030
Percent
0 1 2 3 4 5 6 7 8 9 10 11 12 13 14 15
Cost of Pack in Dollars
Self-Reported Cost of Last Pack of Cigarettes Purchased
Figure 4 – Self-Reported Cost of Last Pack of Cigarettes Purchased
18. 17
5. Results
The resultsfromthe mainmodel are presented inTable 8 below.Onlythose categorieswhich
are significantbelow the fivepercentlevel are includedhere.The breakinthe listof variables
representsthe fifty-one fixedstate variables,approximatelyhalf of which are significantatthe five
percentlevel,but theyare notessentialtothe analysis andsufferfromlow sample sizes. Forthe listof
statesby theirstate abbreviationand theirnominal taxesin2009-10 and 2012-13, see Appendix1.
Table 8: Original Model
All variablesare significantatthe five percentlevel(p<0.05) unlessprecededwith“~”.
Othernon-significantvariablesare notshowninthistable.
regressed on PercentIncome Coefficient
(β value)
Omitted Category: P-value
Marital2 (Living with Partner) -0.387 Marital1 (Single) 0.005
Marital3 (Married) -0.326 Marital1 (Single) 0.005
Marital4 (Separated) -0.602 Marital1 (Single) 0.003
Gender1 (Male) 0.804 Gender0 (Female) 0.000
Educa2 (High School Diploma) -0.682 Educa1 (Less than High School) 0.000
Educa3 (Some college) -0.694 Educa1 (Less than High School) 0.000
Educa4 (Associate’s Degree) -0.801 Educa1 (Less than High School) 0.000
Educa5 (Bachelor’s Degree) -0.748 Educa1 (Less than High School) 0.000
Educa6 (Graduate Degree) -0.781 Educa1 (Less than High School) 0.000
Age2 (25-34) 0.392 Age1 (18-24) 0.013
Age3 (35-44) 0.819 Age1 (18-24) 0.000
Age4 (45-54) 0.870 Age1 (18-24) 0.000
Age5 (55-64) 0.503 Age1 (18-24) 0.003
RaceEthnic2 (Black Only) -0.948 RaceEthnic1 (White Only) 0.000
RaceEthnic3 (Hispanic) -0.889 RaceEthnic1 (White Only) 0.000
RaceEthnic5 (Other non-Hispanic) -0.497 RaceEthnic1 (White Only) 0.001
Income2 (>$20k, <$30k) -8.596 Income1 (<$20,000) 0.000
Income3 (>$30k, <$40k) -8.307 Income1 (<$20,000) 0.000
Income4 (>$40k, <$50k) -9.424 Income1 (<$20,000) 0.000
Income5 (>$50k, <$70k) -10.437 Income1 (<$20,000) 0.000
Income6 (>$70k), <$100k) -10.708 Income1 (<$20,000) 0.000
19. 18
Income7 (>$100k, <$125k) -11.407 Income1 (<$20,000) 0.000
Income8 (>$125k) -12.139 Income1 (<$20,000) 0.000
… (States 2 - 51)… … …(State Number 1: Alaska)… …
MidInteraction -1.651 LowInteraction 0.000
HighInteraction -2.118 LowInteraction 0.000
NominalTax 1.774 N/A 0.000
~Year2012 ~-0.086 ~Year2009 ~0.684
~StateUnemp ~-0.500 ~N/A ~0.572
Constant α = 15.334 N/A 0.000
N = 12,896
F(82,12813) = 220.83
Prob> F = 0.000.
R-squared= 0.5856.
Adj.R-squared=0.5830.
Root MSE = 4.4277.
The firstspecification inTable 8 showsthatgivena smokerwhoisa single female withlessthan
a highschool diplomawhois18-24 years of age,white,and has a householdincomelessthan$20,000
annuallyfromthe state of Alaska (state numberone),she paysonaverage 15.334% of her income on
cigarettes. The regressionhighlightsanumberof waysinwhichif she had differentdemographic
characteristicsshe wouldspendalowerpercentage of her householdincome oncigarettes: For
example,if she were tobe married,she wouldspendabout0.3% lessof herhouseholdincome on
cigarettes. If she were tohave a college education,she wouldspendabout0.8% lessof herhousehold
income on cigarettes. If she were tobe blackor Hispanicshe wouldspendalmost1% less. Butif she
were middle-aged,she wouldspendalmostone percentmore of herincome oncigarettes,likely
because heraddictionismore pronouncedandshe thussmokesmore. Similarly,if she were male,she
wouldspend0.8%more of herhouseholdincome oncigarettes. These percentagesare cumulative,so
that a married blackfemale,whosmokes,hasanAssociate’sdegree,is18-24 yearsold,is fromAlaska,
but still hasa householdincomeof lessthan$20,000 wouldspendonly anaverage 13.198% of her
householdincomeoncigarettes,comparedtothe 15.334% beforehand,ignoringanystate excise taxes.
20. 19
Above all,the largestcoefficientsare those relatedto the smoker’s income category. Inthe
nexthighestincome categorynamed Income2,forwithhouseholdincomesof $20,000 or more but less
than $30,000 per year,thissame womanspendsonaverage 8.596% lessof herincome oncigarettes.
Thisbringsher cigarette spendingdownto about6.7% of herannual householdincome.If she were to
move to the highestincome category Income8alongside those earningmore than$150,000 annually,
she thusspendsonlyaboutthree percentof herincome oncigarettes,ceterisparibus. Interestingly,the
effectof the yearin whichthe surveywastakenandof herstate’sunemploymentrate are
indistinguishable fromzero. However,the middle-income Interactionterm, the high-income interaction
termand the NominalTax variable are all significant;Idiscussthese resultsinthe analysissection. Two
alternate specificationsare presentedin Table 9 and Table 10.
Table 9: Alternate Specification1
All variablesare significantatthe five percentlevel(p<0.05) unlessprecededwith“~”
Othernon-significantvariablesare notshowninthistable.
regressed on PercentIncome Coefficient (β
value)
Omitted Category: P-value
Gender1 (Male) 0.773 Gender0 (Female) 0.000
Educa2 (High School Diploma) -2.023 Educa1 (Less than High School) 0.000
Educa3 (Some college) -2.293 Educa1 (Less than High School) 0.000
Educa4 (Associate’s Degree) -1.895 Educa1 (Less than High School) 0.000
Educa5 (Bachelor’s Degree) -1.755 Educa1 (Less than High School) 0.000
Educa6 (Graduate Degree) -2.074 Educa1 (Less than High School) 0.000
Age3 (35-44) 1.024 Age1 (18-24) 0.025
Age4 (45-54) 1.046 Age1 (18-24) 0.017
RaceEthnic2 (Black Only) -0.691 RaceEthnic1 (White Only) 0.048
RaceEthnic3 (Hispanic) -0.883 RaceEthnic1 (White Only) 0.029
RaceEthnic5(Othernon-Hispanic) -0.845 RaceEthnic1 (White Only) 0.029
Income2 (>$20k, <$30k) -9.481 Income1 (<$20,000) 0.000
Income3 (>$30k, <$40k) -8.469 Income1 (<$20,000) 0.000
Income4 (>$40k, <$50k) -9.563 Income1 (<$20,000) 0.000
Income5 (>$50k, <$70k) -10.669 Income1 (<$20,000) 0.000
Income6 (>$70k), <$100k) -10.672 Income1 (<$20,000) 0.000
Income7 (>$100k, <$125k) -11.556 Income1 (<$20,000) 0.000
Income8 (>$125k) -12.330 Income1 (<$20,000) 0.000
… (10 states)… … … (State No. 41 – South Carolina)… …
MidInteraction -1.704 LowInteraction 0.000
HighInteraction -2.164 LowInteraction 0.000
NominalTax 1.171 N/A 0.010
21. 20
~Year2012 ~0.920 ~Year2009 ~0.148
~StateUnemp ~0.093 N/A ~0.707
Constant α = 12.647 N/A 0.000
N = 2411
F(40,2370) = 84.49
Prob> F = 0.0000
R-squared= 0.5878
Adj.R-squared=0.5808
Root MSE = 5.0128
In this firstalternate specification, only smokersfromthe 11 stateswhichchangedtheir
cigarette excise taxesbetweenthe twosurveyperiodsare included. See Appendix1. The total number
of observationshasthusdecreasedtoN = 2411. The coefficientestimatesare largelythe same,though
interestinglynoneof the Maritalvariablesare significantandfewerof the Agevariablesare significant
too. The constant givenbyalpha hasdecreasedtojustover12, but thisismost likelydue tothe fact
that the omittedstate isnow state numberforty-one (SouthCarolina) insteadof the original state
numberone (Alaska). Thusthe same single femalewithlessthanahighschool diplomawhois18-24
yearsof age,white, fromSouthCarolina, andhasa householdincome lessthan$20,000 annually spends
12.647% of her household’sannual incomeonaverage oncigarettes.
Table 10: Alternate Specification2
All variablesare significantatthe five percentlevel(p<0.05) unlessprecededwith“~”
Othernon-significantvariablesare notshowninthistable.
regressed on PercentIncome Coefficient (β
value)
Omitted Category: P-value
Marital2 (Living with Partner) -0.386 Marital1 (Single) 0.038
Marital3 (Married) -0.351 Marital1 (Single) 0.025
Marital4 (Separated) -0.726 Marital1 (Single) 0.007
Gender1 (Male) 1.161 Gender0 (Female) 0.000
Educa2 (High School Diploma) -0.947 Educa1 (Less than High School) 0.000
Educa3 (Some college) -0.960 Educa1 (Less than High School) 0.000
Educa4 (Associate’s Degree) -1.080 Educa1 (Less than High School) 0.000
Educa5 (Bachelor’s Degree) -1.138 Educa1 (Less than High School) 0.000
Educa6 (Graduate Degree) -1.200 Educa1 (Less than High School) 0.000
Age2 (25-34) 0.670 Age1 (18-24) 0.002
Age3 (35-44) 1.290 Age1 (18-24) 0.000
Age4 (45-54) 1.443 Age1 (18-24) 0.000
Age5 (55-64) 1.002 Age1 (18-24) 0.000
RaceEthnic2 (Black Only) -1.512 RaceEthnic1 (White Only) 0.000
22. 21
RaceEthnic3 (Hispanic) -1.419 RaceEthnic1 (White Only) 0.000
RaceEthnic5(Othernon-Hispanic) -0.780 RaceEthnic1 (White Only) 0.001
Income2 (>$20k, <$30k) -8.581 Income1 (<$20,000) 0.000
Income3 (>$30k, <$40k) -8.492 Income1 (<$20,000) 0.000
Income4 (>$40k, <$50k) -9.557 Income1 (<$20,000) 0.000
Income5 (>$50k, <$70k) -10.653 Income1 (<$20,000) 0.000
Income6 (>$70k), <$100k) -10.868 Income1 (<$20,000) 0.000
Income7 (>$100k, <$125k) -11.595 Income1 (<$20,000) 0.000
Income8 (>$125k) -12.332 Income1 (<$20,000) 0.000
… (States 2 - 51)… … …(State Number 1 – Alaska)… …
MidInteraction -1.488 LowInteraction 0.000
HighInteraction -1.963 LowInteraction 0.000
NominalTax 1.459 N/A 0.000
~Year2012 ~-0.144 ~Year2009 ~0.608
~StateUnemp ~-0.101 ~N/A ~0.389
Constant α = 15.756 N/A 0.000
N = 9234
F(82, 9151) = 125.01
R-squared= 0.5283
Adj.R-squared=0.5241
Root MSE = 5.0674
The secondalternate specification inTable 9only includes those respondents,N =9234, who
originallylisttheiraverage daily cigarette consumption,whichthe authorsubsequentlyhasadjustedfor
underreporting. The other3,662 observations removedfromthe originalmodel are those smokers who
do notoffertheiraverage dailycigarette consumptionand forwhomthe authorhas imputedthe
average adjusted dailycigaretteconsumption(18.16325 for 2009-10 and17.1589 for 2012-13). The
resultsare verysimilaroverall tothose obtainedinthe original model.
6. Analysis
There are several noteworthypointstodraw from these regressions whichilluminate the
impactsof state cigarette excise taxes. Inall three specifications the coefficienton the nominal state-
level cigarette excisetax hasa positive andsignificantcoefficient,wherebyaone dollarincrease inthe
tax isassociatedwithanapproximate one percent increase inthe percentageof income asmoker
23. 22
spends oncigarettes. Eventhough thisdoesnotsoundlike animportantmatter,thiscorrespondstoa
personinthe lowestincome groupspendinganextra$200 or so oncigarettesannually andapersonin
the highestincome categoryspendinganextra$1250 or so annuallyoncigarettes. While thiscoefficient
seemstoindicate thatnominal state cigarette excise taxesare proportional,the factremainsthatmore
low-incomepersonssmokethandohigh-incomepersons.(Jamal etal.,2014) This meansthatcigarette
excise taxeshave aregressiveeffectonlow-income people inthe aggregate,evenif the taxesare not
regressive forindividual smokers.
Othercoefficients,however, provide evidence thatthese taxesmayinfactplace heavier
burdenson individualsmokers withlowerhouseholdincomes. Firstoff,all three modelsfindthatthe
groupspendingthe largest percentage of income oncigarettesisthose smokers earninglessthan
$20,000 annually. Advancingintothe secondlowestincome groupwoulddecrease thatpercentageby
between8.5—9.5%while movingintothe highesthouseholdincome categorieswill decrease that
percentage bymore than12%. Thismeansthat merelyascendingincomecategoriesallowsapersonto
spendmuchlessof theirincome oncigarettes,mostlikelybecause they willholdtheircigarette
consumptionrelativelyconstant despite arise inincome, asFarrellyetal.(2012) assert. This alsomeans
that evenif state cigarette excisetaxesare proportionalbythemselves,theyperpetuate the regressivity
of individual spendingoncigarettes. Figure 5showsthat smokersinthe lowestincome group on
average spendmuchmore of theirhouseholdincome oncigarettesthandothose inthe middle-income
and higher-income groups. Secondly andperhapsmostimportantly, the interactionterms MidIncome
and HighIncomewhichequal the respondent’snominalstate excise tax if theyare of middle-income
statusor higher-incomestatus,respectively,bothhave negative coefficients. These indicate thatthe
nominal taxeshave abouta1.5% smallerimpactonmiddle-income individualsandaboutatwo percent
smallerimpactonhighincome individualsthan theydoon low-income individuals.
24. 23
However, itimportanttonote that thisanalysiscannot definitivelyconclude thatcigarette
excise taxesdirectlyincreasethe percentageof their householdincome which smokersspendon
cigarettes.Itispossible thatstatesraise theirexcisetaxesbecausetheyalreadyknowthattheir
residentsspendalarge amountof theirincome oncigarettes,sothe state governmentslookto
encourage these smokers toquit. Popularrhetoricnonetheless suggeststhatstatesmayuse their
cigarette taxingauthority forreasonsmore relatedto fiscal budgetconcerns ratherthantotheirsimple
concernfor smokers’wellbeing.(Sack,2008) Additionally,the implicationsof thisstudydonotapplyto
all smokers. Thisisfirstdue to the fact that onlyelevenstatesexperiencedchangesintheircigarette
excise taxes betweenthe twosurveyperiods aslistedin Appendix1. Additionally,the conclusions
regardingcigarette excisetax regressivity only applytothose smokerswhocontinuetosmoke. Because
the regressionsignore those smokers whoalreadyhave quitorwhoactuallywill quitinthe future due
25. 24
to the excise taxes,itcannotcommentonthose individuals. Lastly,these surveysrely onself-reported
data whichismore subjectto errorsthan data collectedinalaboratoryexperiment.
7. Future Direction
12.0448%
3.99906%
1.779%
0
5
10
15
Low-Income Middle-Income High-Income
Income Category
Figure 5 – Means of PercentIncome Spent by Smokers on Cigarettes, by Income Group
A One Way Analysisof Variance testfindsthatthe meansare equivalentwithprobability
0.0000. The income definitions in each group are given in Table 1.
26. 25
Thisstudylendsadditional support tothe ideathatcigarette taxesare regressive andplace
heavierfinancialburdensonlowerincome smokers thanonmore well-off smokers. The bestwayto
move forward withthisanalysis willbe toexpandthe datasetwithadditional survey yearssoas to
include furtherchangesinstate-levelcigarette excisetax rates. Additionally,amore thoroughanalysis
would:betteraccountforthe weightsassignedtoeachobservationinthe NATS aswell as more
accuratelycalculate total national cigarette consumptionbyincludingU.S.cigarette exportandimport
data inadditionto measuresforthe percentage of cigarettesboughtwhichare actuallyconsumed –
some may be defective,broken,orsimplythrownaway. Beyondthisstudythough,future analysis
shouldcontinue tomonitorhowmuchof their household incomeindividualsspendoncigarettes,ideally
by followingthembefore andafterachange incigarette excise tax rates. Owingtothe risingpopularity
of e-cigarettes,researchersshouldfocusonthe rate of substitutionbetweencigarettesande-cigarettes
and howtaxesaffectconsumerpreferences. Lastly,policymakersshouldbe aware of the likely
possibility thatcigarette excise taxesdopotentiallyhave drawbacksastheymayimpactpoorsmokers
much more than richsmokers. One wayto addressthisconcernwouldbe to earmarkrevenue
generatedfromstate cigarette excisetaxesspecificallytoprogramsaddressedtohelplow-income
smokers. One viable possibility couldtake the formof partiallysubsidizingtobaccoquitaidsforthose in
the lowestincome groups orfor those receivingMedicaid.
27. 26
Appendix 1: States List
“*” indicatesthatthe state changeditscigarette excise tax ona pack of 20 cigarettesbetweenthe two
survey periods. These statesare the onlyonesincludedinAlternate Specification2(Table 9).
State No.
(in fixed
effects list)
State Abbreviation State Name 2009-10 Tax in
dollars per pack
of 20 cigarettes
2012-13 Tax in
dollars per pack
of 20 cigarettes
1 AK Alaska 2 2
2 AL Alabama 0.425 0.425
3 AR Arkansas 1.15 1.15
4 AZ Arizona 2 2
5 CA California 0.87 0.87
6 CO Colorado 0.84 0.84
7 *CT* Connecticut 3 3.4
8 DC District of Columbia 2.5 2.5
9 DE Delaware 1.6 1.6
10 FL Florida 1.339 1.339
11 GA Georgia 0.37 0.37
12 *HI* Hawaii 2.6 3.2
13 IA Iowa 1.36 1.36
14 ID Idaho 0.57 0.57
15 *IL* Illinois 0.98 1.98
16 IN Indiana 0.995 0.995
17 KS Kansas 0.79 0.79
18 KY Kentucky 0.6 0.6
19 LA Louisiana 0.36 0.36
20 MA Massachusetts 2.51 2.51
21 MD Maryland 2 2
22 ME Maine 2 2
23 MI Michigan 2 2
24 MN Minnesota 1.23 1.23
25 MO Missouri 0.17 0.17
26 MS Mississippi 0.68 0.68
27 MT Montana 1.7 1.7
28 NC North Carolina 0.45 0.45
29 ND North Dakota 0.44 0.44
30 NE Nebraska 0.64 0.64
31 *NH* New Hampshire 1.78 1.68
32 NJ New Jersey 2.7 2.7
33 *NM* New Mexico 0.91 1.66
34 NV Nevada 0.8 0.8
35 *NY* New York 2.75 4.35
36 OH Ohio 1.25 1.25
37 OK Oklahoma 0.3 0.3
38 OR Oregon 1.18 1.18
28. 27
39 PA Pennsylvania 1.6 1.6
40 *RI* Rhode Island 3.46 3.5
41 *SC* South Carolina 0.07 0.57
42 SD South Dakota 1.53 1.53
43 TN Tennessee 0.62 0.62
44 TX Texas 1.41 1.41
45 *UT* Utah 0.695 1.7
46 VA Virginia 0.3 0.3
47 *VT* Vermont 1.19 2.62
48 *WA* Washington 2 3.025
49 WI Wisconsin 2.52 2.52
50 WV West Virginia 0.55 0.55
51 WY Wyoming 0.6 0.6
Appendix 2: Explanation of Cigarette Consumption per Day Adjustment
2009-10 2012-13
Total Cigarette Sales or Production 303,000,000,0001
273,000,000,0002
Cigarette Smoking Prevalence Rate 19.3% 17.8%
Civilian Noninstitutional Population 236,809,400 244,883,899
Calculated Number of Smokers 45,704,2143
43,589,3344
Calculated National Mean Cigarette
Consumption
18.16325 17.1589
Calculated NATS Mean for Smokers who
Self-Reported Consumption
15.3771 14.89352
Underreporting Adjustment for Smokers
who did not self-report their average
daily cigarette consumption
18.119% 15.2105%
1 The number of cigarettes sold in 2010,303 billion,comes from Learn Sociology by Edward Brent & J. Scott Lewis
(2013),which cites “The Maxwell Report: Year End & Fourth Quarter 2011 Cigarette Industry”by JC Maxwell. The
author of this paper was unableto directly access TheMaxwell Reports at a reasonablecharge.
2 The number of cigarettes produced in 2013,273 billion,comes from “Economic Facts About U.S. Tobacco
Production and Use” lastupdated by the CDC in 2015 usingfigures from “The Maxwell Report: Year End & Fourth
Quarter 2013 Cigarette Industry”by JC Maxwell. The author of this paper was unableto directly access The
Maxwell Reports at a reasonablecharge.
3 The 45,704,214 smokers in 2009-10 is estimated usingthe 19.3% prevalence rate given by the CDC’s Morbidity
and Mortality Weekly Report (no author,2012) multiplied by the average of the adultcivilian noninstitutionalized
population duringthe survey months of October 2009 – February 2010,the NATS survey period, availablefromthe
Federal Reserve Bank of St. Louis.
4 The 43,589,334 smokers in 2012-13 is estimated usingthe 17.8% prevalence rate given by Jamal et al.(2015) of
smokers for 2013 multiplied by an average of the adultcivilian noninstitutionalized population duringthe survey
months of October 2012 – July 2013,the NATS survey period, availablefromthe Federal Reserve Bank of St. Louis.
29. 28
References
Bader,P.,et al.,2011. Effectsof tobacco taxationandpricingonsmokingbehaviorinhighrisk
populations:A knowledgesynthesis.International Journal of Environmental ResearchandPublic
Health8(11), 4118-4139.
Becker,G.,Murphy, K.,1988. A theoryof rational addiction.Journal of Political Economy96(4),675-700.
Boonn,A.,2015. Cigarette Tax IncreasesbyState perYear 2000-2016. CampaignforTobacco-Free Kids.
Online.AccessedApril 8,2016.
Boonn,A.,2016. State Cigarette Excise Tax Rates & Rankings.CampaignforTobacco-Free Kids.Online.
AccessedApril 8,2016.
Cebula,R.,etal.,2014. Empirical analysisof the impactof cigarette excise taxesoncigarette
consumption:Estimatesfromrecentstate-level data.Journal of EconomicsandFinance 38,164-
180.
Chiou, L.,and Muehlegger,E.,2014. Consumerresponse tocigarette excisetax changes.National Tax
Journal,67(3), 621-650.
Colman,G.,Remler,D.,2008. Vertical equityconsequencesof veryhighcigarette tax increases:If the
poor are the onessmoking,how couldcigarette tax increasesbe progressive? Journal of Policy
AnalysisandManagement27(2),376-400.
Farrelly,M.,etal., 2012. The consequencesof highcigarette excise taxesforlow-income smokers.PLOS
One 7(9).
Franks,F.,et al.,2007. Cigarette prices,smoking,andthe poor: Implicationsof recenttrends.American
Journal of PublicHealth97(10), 1873-1877.
Gruber,J., Koszegi,B.,2003. Tax incidence whenindividualsare time-inconsistent:The case of cigarette
excise taxes.Journal of PublicEconomics88,1959-1987.
30. 29
Gruber,J., Mullainathan,S.,2005. Do cigarette taxesmake smokershappier?Advances inEconomic
Analysis&Policy5(1)(4).
“Historical Income Tables: Table F-1.Income LimitsforEach FifthandTop 5 Percentof Families(All
Races):1947 to 2014”. CensusBureau.Online.AccessedApril 8,2016.
“Historical Income Tables: Table F-3. Mean Income ReceivedbyEachFifthandTop 5 Percentof
Families,All Races:1966 to 2016”. CensusBureau.Online.AccessedApril8,2016.
Hoffer,A.,etal.,2015. Regressiveeffects:Causesandconsequencesof selectiveconsumptiontaxation.
Mercatus WorkingPaper,George MasonUniversity(unpublished).
Jamal,A.,et al.,2015. Current cigarette smokingamongadults – UnitedStates,2005-2014. Morbidity
and MortalityWeeklyReport,64(44),1233-1240.
Keeler,T.,etal.,1993. Taxation,regulation,andaddiction:ademandfunctionforcigarettesbasedon
time-seriesevidence.Journal of HealthEconomics12(18),1-18.
King,B.,et al.,2014. Best practicesfor ComprehensiveTobacco ControlPrograms.NationalCenterfor
ChronicDisease PreventionandHealthPromotion,U.S.CentersforDiseaseControl and
Prevention.
Lewit,E.,Coate,D., 1982. The potential forusingexcisetaxestoreduce smoking. Journal of Health
Economics(1),121-145.
“Local AreaUnemploymentStatistics”.Bureauof LaborStatistics.Online.AccessedApril8,2016.
Remler,K.,2004. Poorsmokers,poorquitters,andcigarette tax regressivity.AmericanJournal of Public
Health94(2), 225-229.
Sack, K.“StatesLook to Tobacco Tax for BudgetHoles”. TheNew York Times. April 21, 2008.
U.S. Departmentof HealthandHuman Services.Ending the TobaccoEpidemic:Progresstowarda
HealthierNation.Washington:U.S.Departmentof HealthandHumanServices,Office of the
AssistantSecretaryforHealth,August2012.
31. 30
Warner,K., 1978. Possible increasesinthe underreportingof cigarette consumption.Journalof the
AmericanStatistical Association73(362), 314-318.