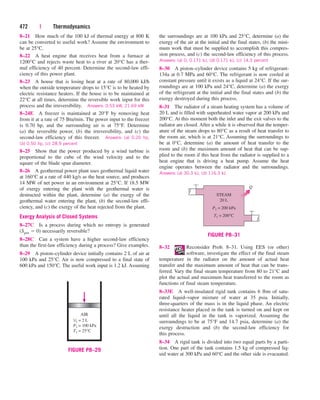
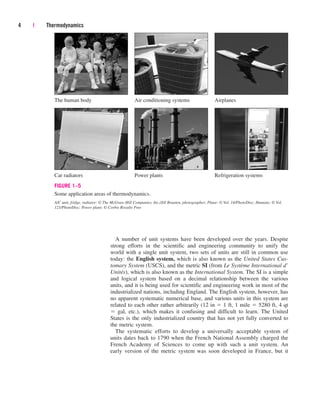
This document provides errata for the 5th edition of the textbook "Thermodynamics: An Engineering Approach" by Y.A. Çengel and M.A. Boles. It lists page numbers where errors have been found and provides the corrections. Over 300 new comprehensive problems have been added to this edition. Several chapters have been reorganized and the coverage of compressible flow has been greatly expanded and revised. The steam and refrigerant property tables have also been updated.
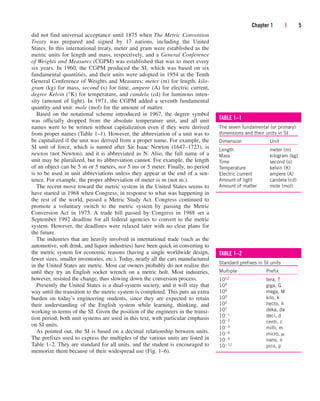
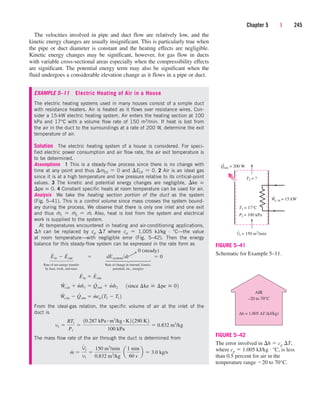
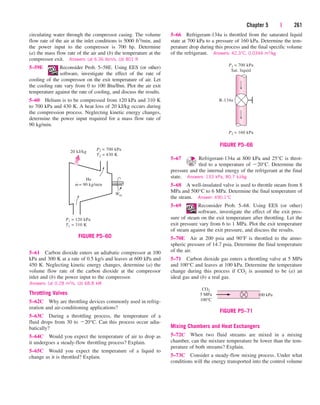
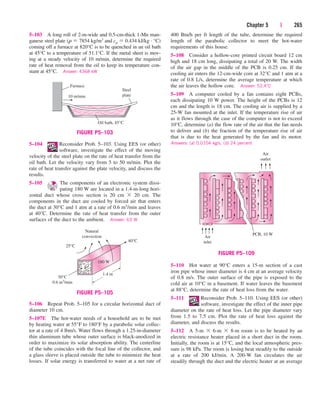
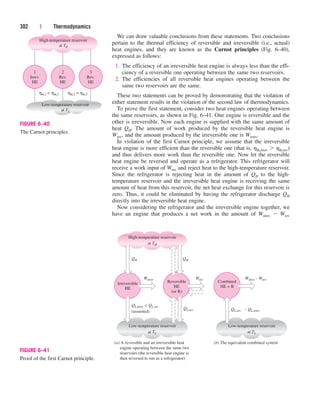
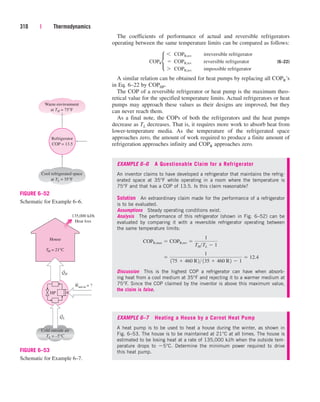
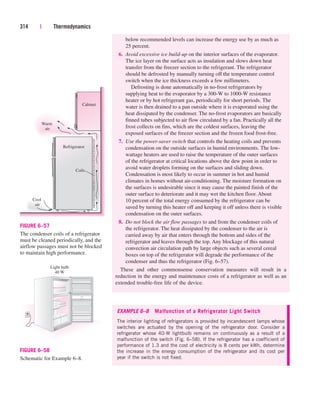
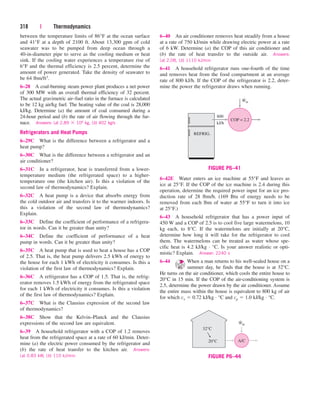
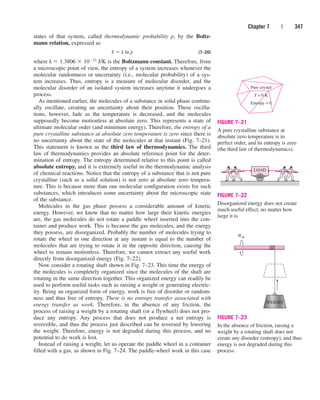
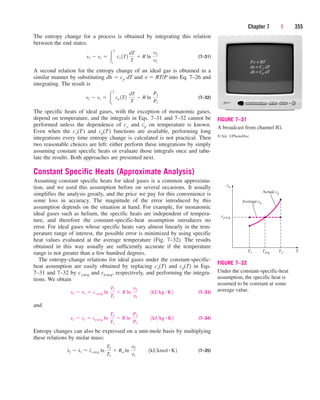
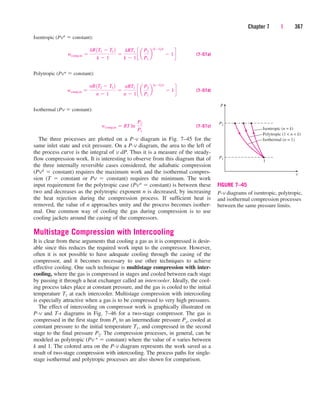
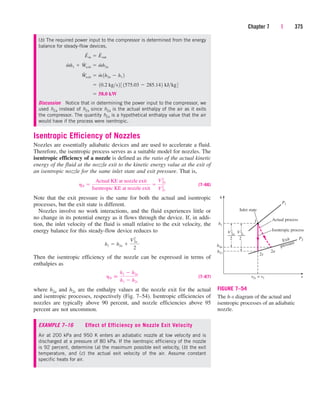
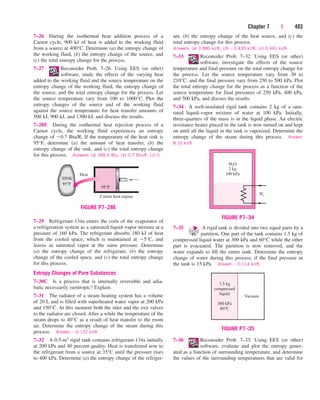
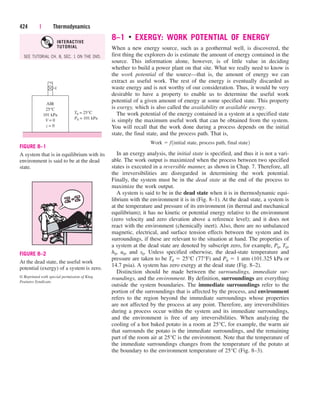
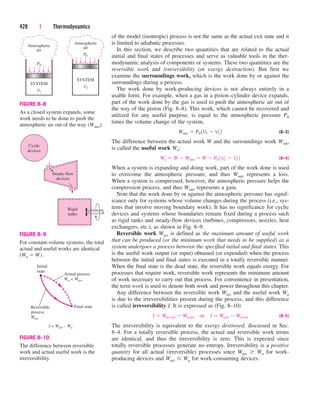
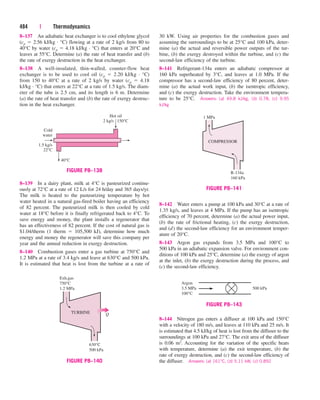
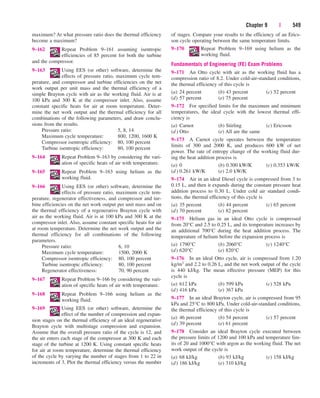
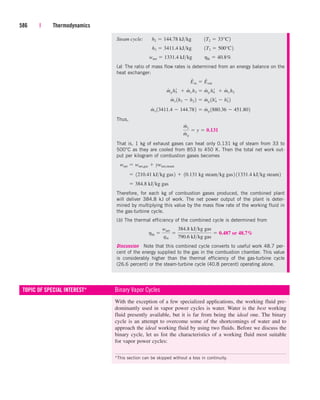
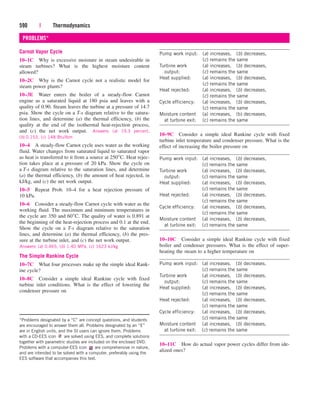
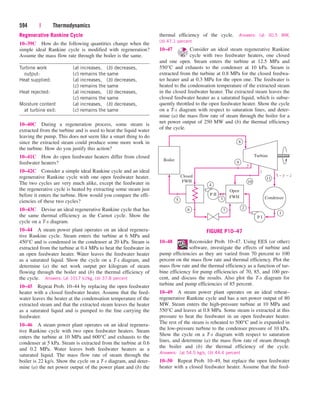
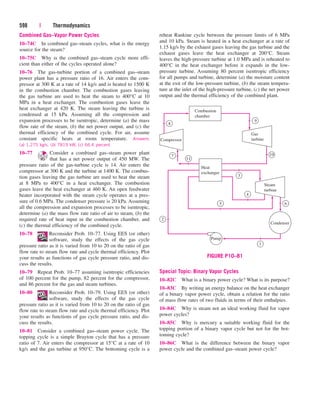
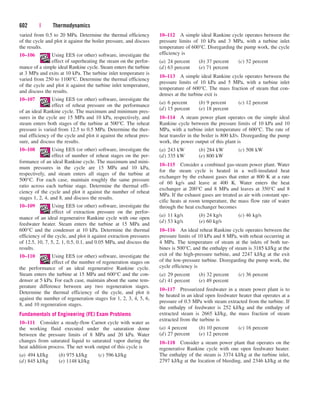
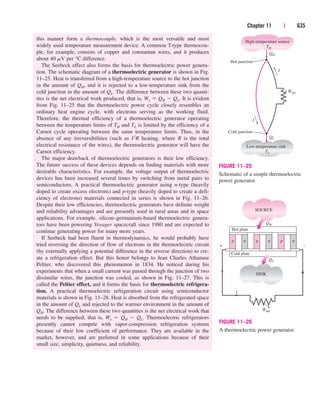
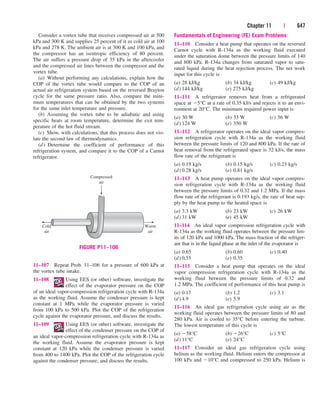
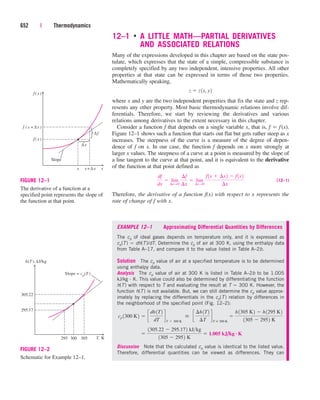
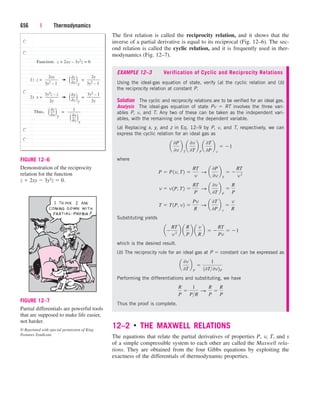
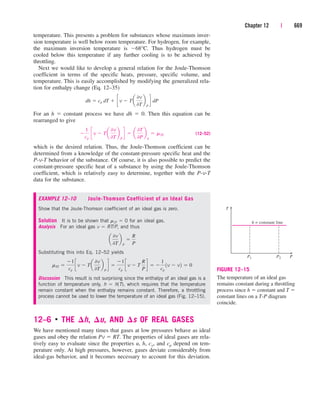
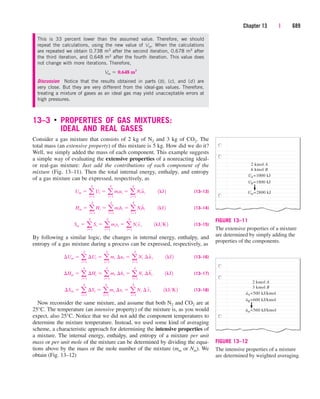
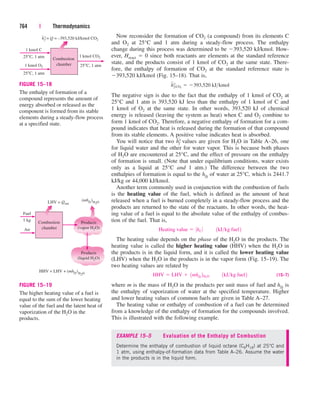
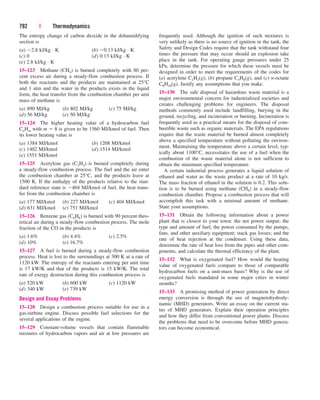
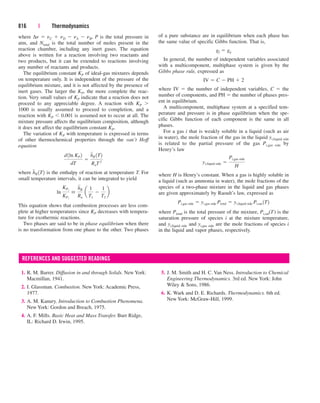
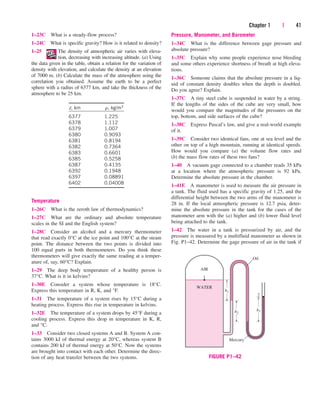
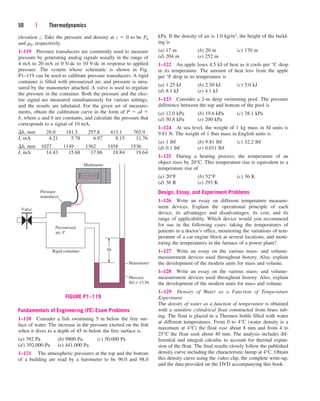
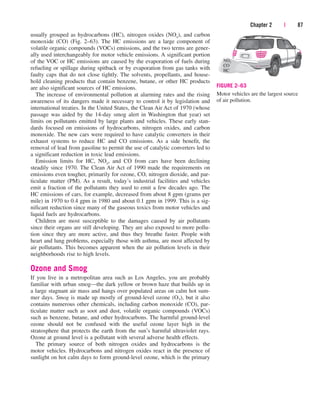
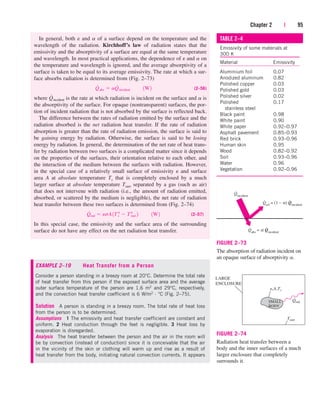
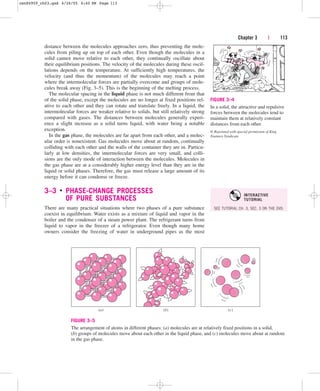
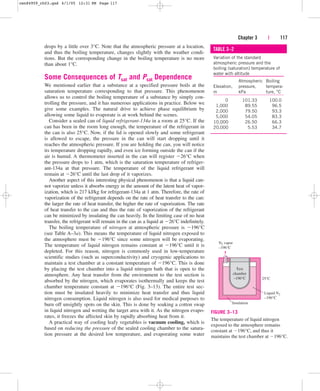
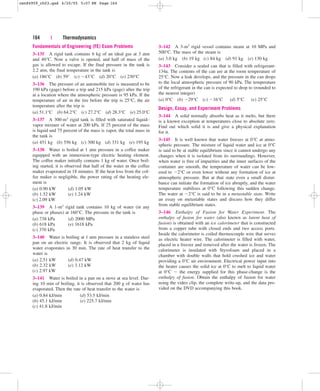
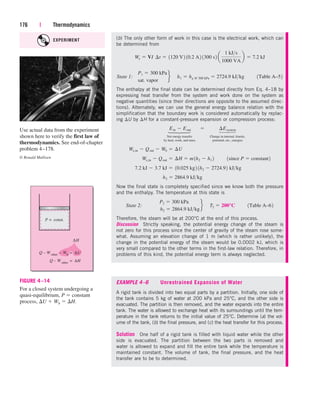
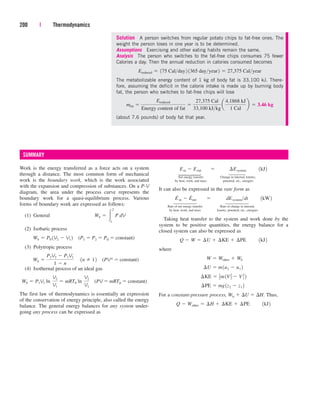
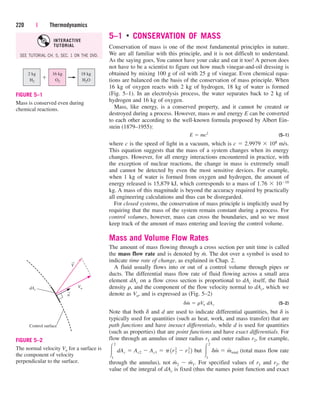
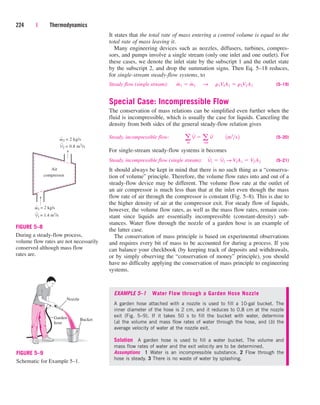
![A Remark on Significant Digits
In engineering calculations, the information given is not known to more
than a certain number of significant digits, usually three digits. Conse-
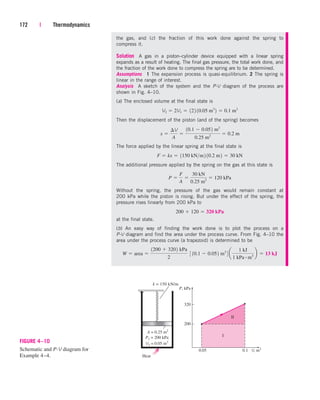
quently, the results obtained cannot possibly be accurate to more significant
digits. Reporting results in more significant digits implies greater accuracy
than exists, and it should be avoided.
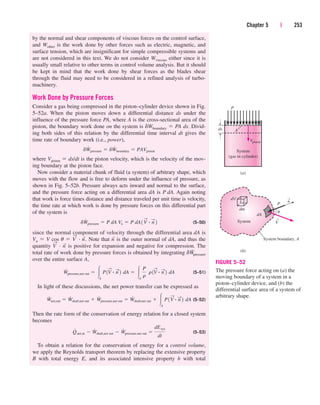
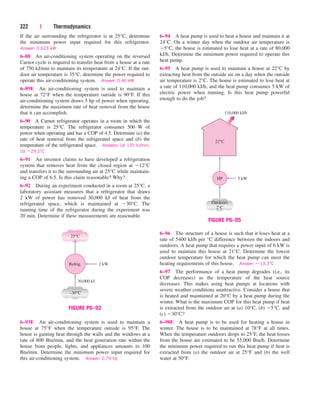
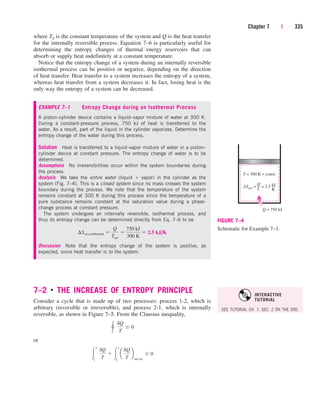
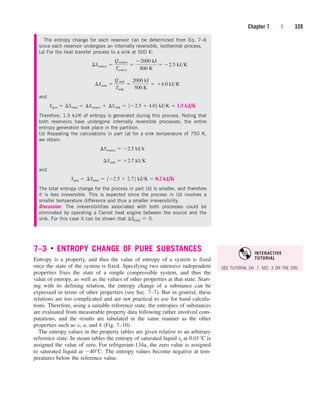
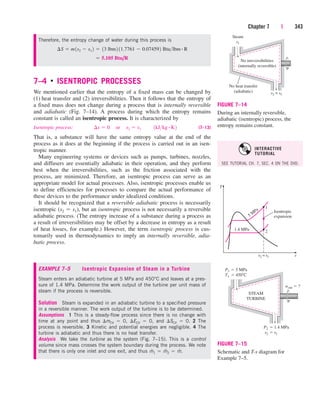
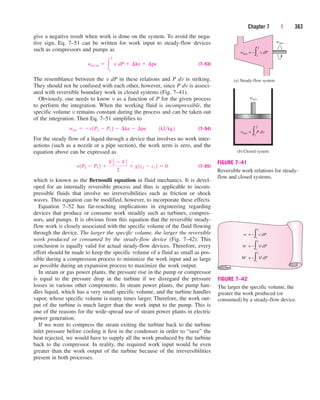
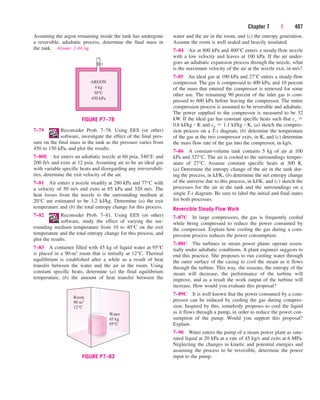
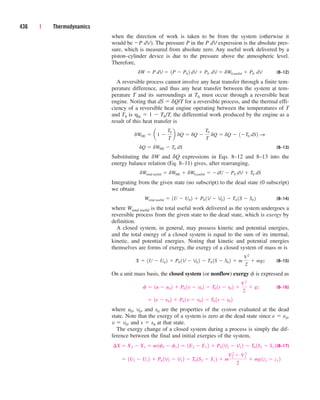
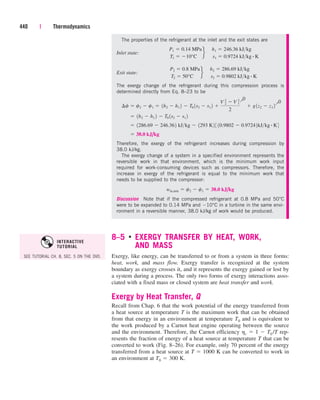
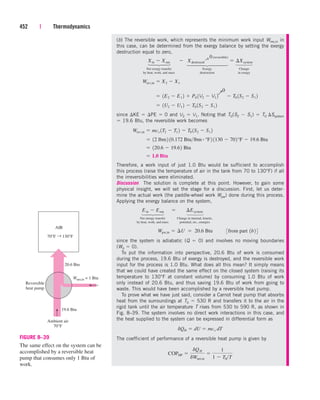
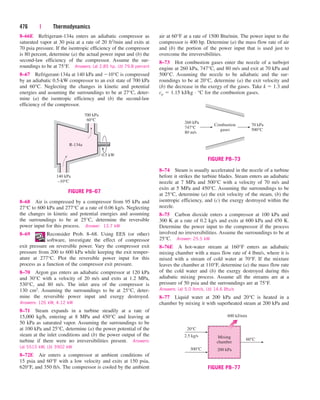
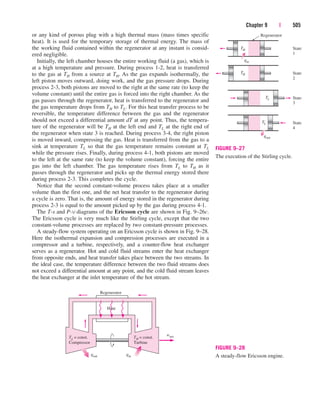
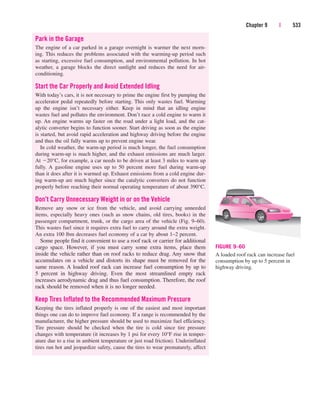
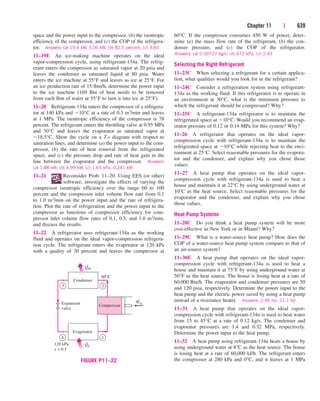
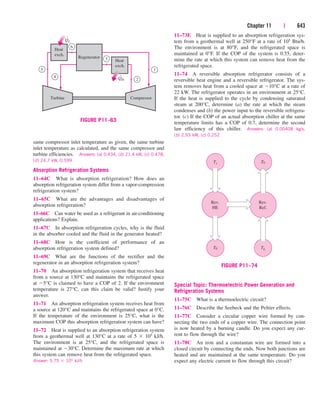
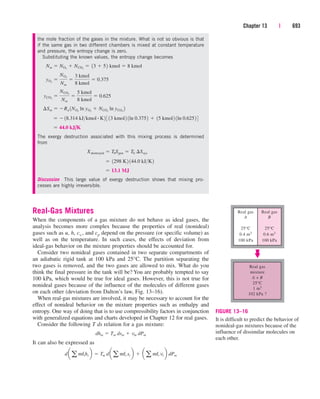
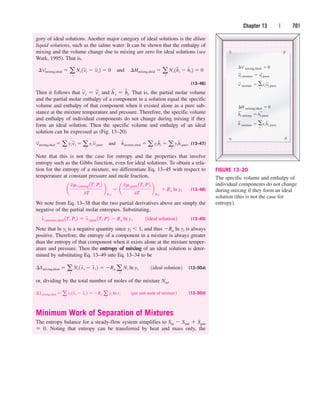
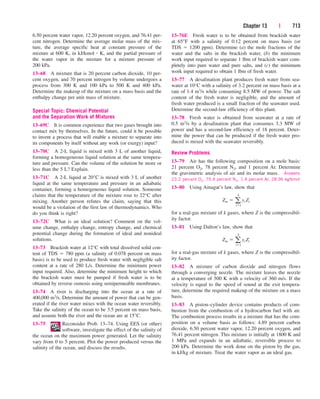
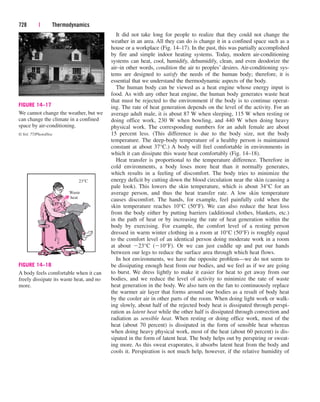
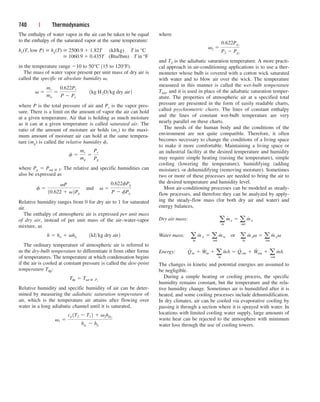
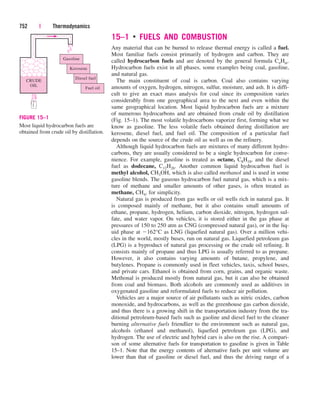
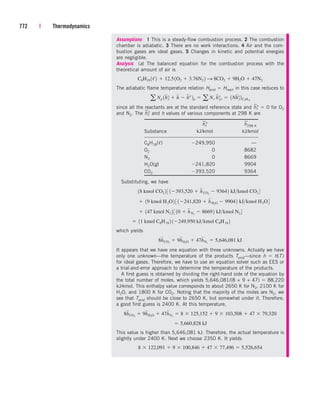
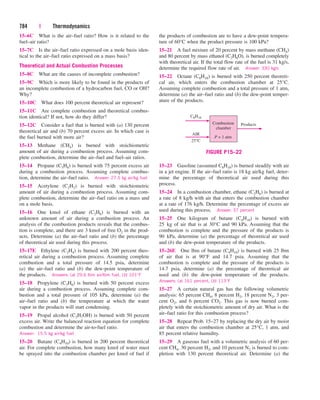
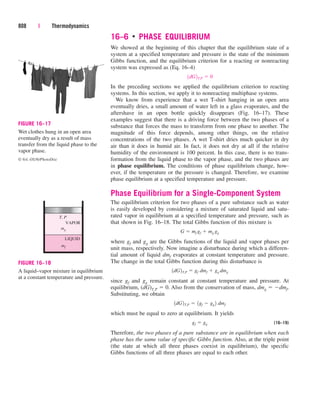
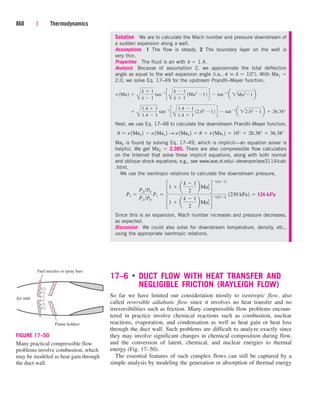
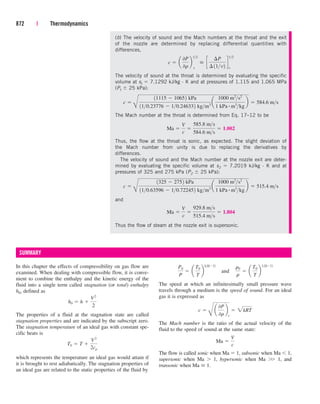
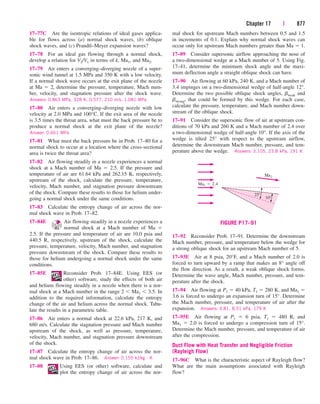
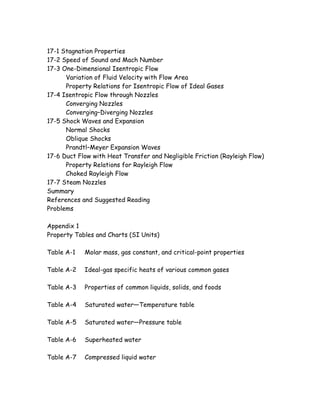
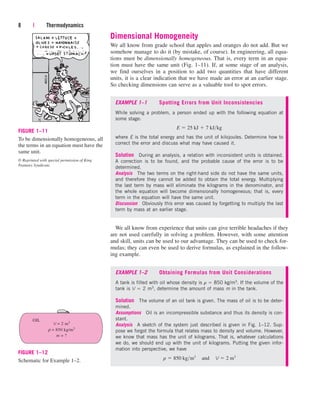
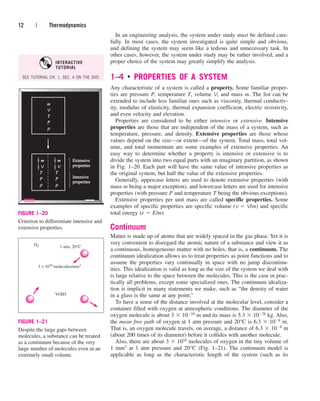
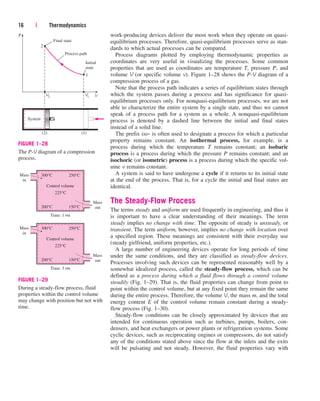
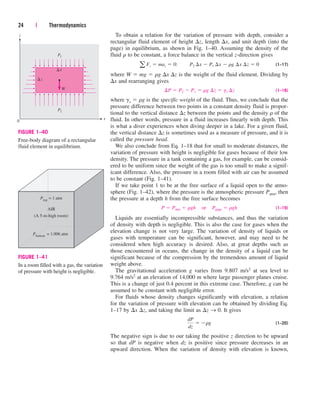
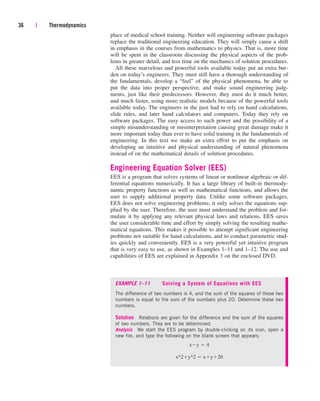
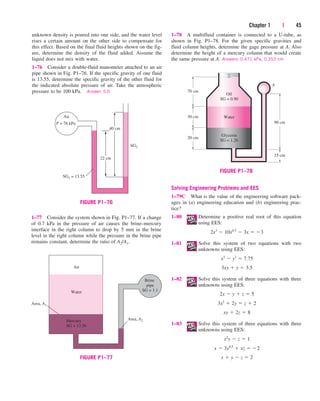
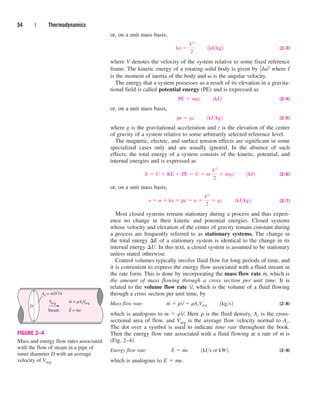
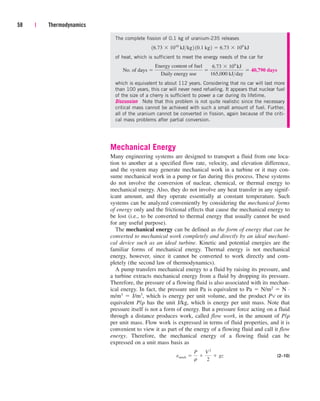
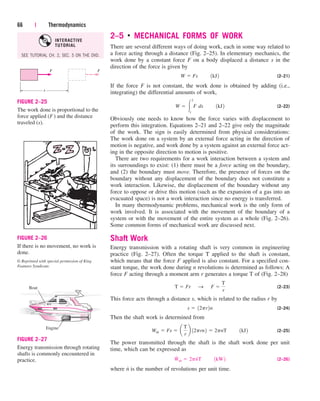
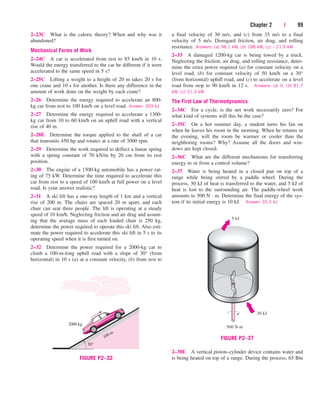
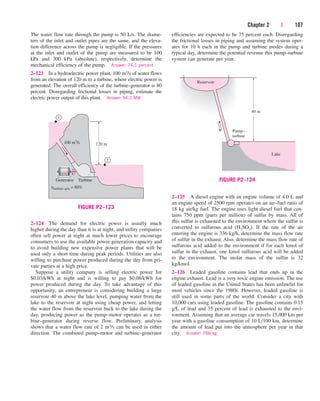
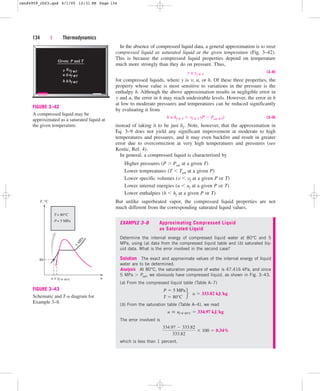
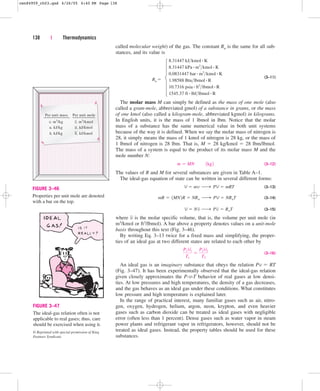
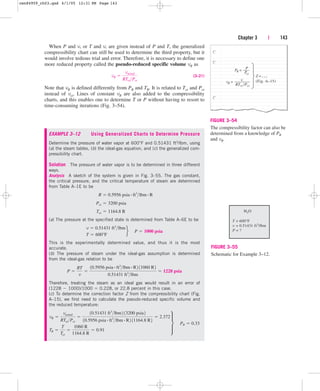
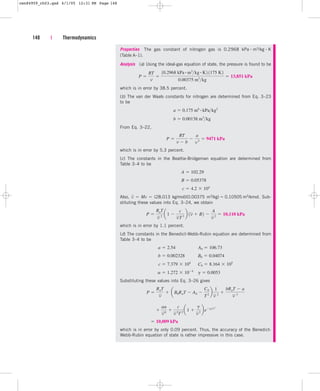
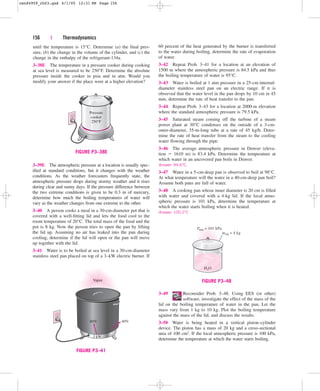
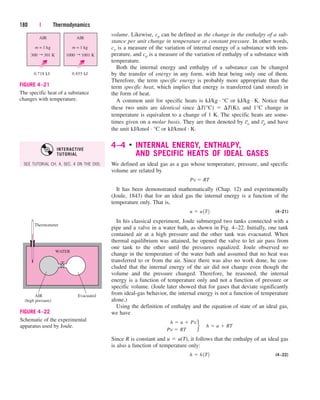
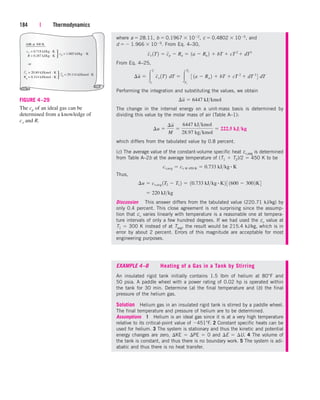
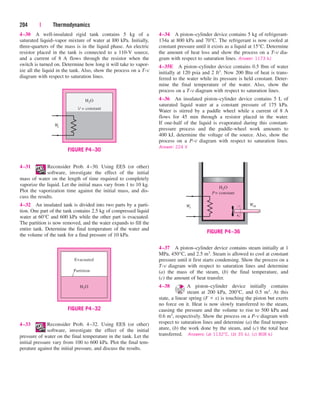
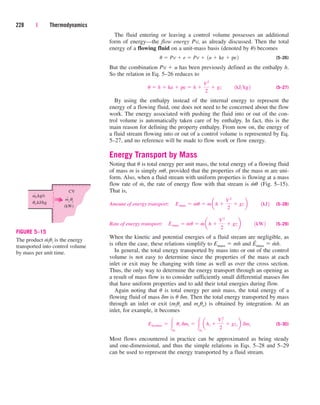
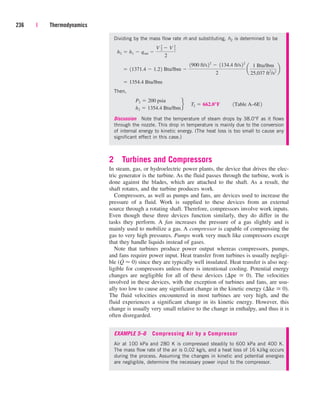
For example, consider a 3.75-L container filled with gasoline whose den-
sity is 0.845 kg/L, and try to determine its mass. Probably the first thought
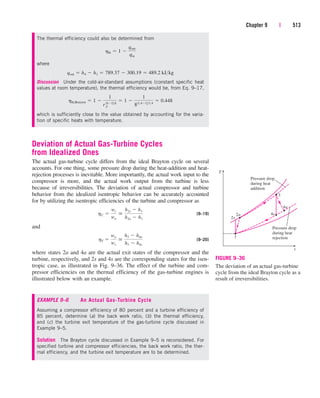
that comes to your mind is to multiply the volume and density to obtain
3.16875 kg for the mass, which falsely implies that the mass determined is
accurate to six significant digits. In reality, however, the mass cannot be
more accurate than three significant digits since both the volume and the
density are accurate to three significant digits only. Therefore, the result
should be rounded to three significant digits, and the mass should be
reported to be 3.17 kg instead of what appears in the screen of the calcula-
tor. The result 3.16875 kg would be correct only if the volume and density
were given to be 3.75000 L and 0.845000 kg/L, respectively. The value 3.75
L implies that we are fairly confident that the volume is accurate within
0.01 L, and it cannot be 3.74 or 3.76 L. However, the volume can be
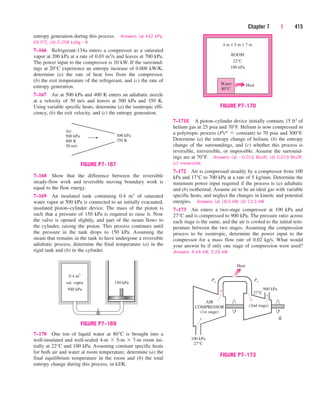
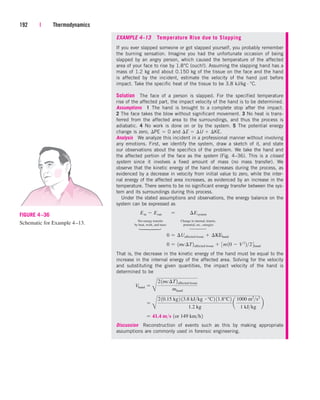
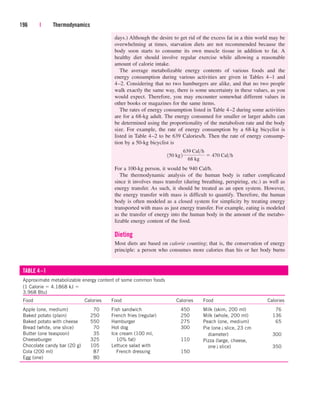
3.746, 3.750, 3.753, etc., since they all round to 3.75 L (Fig. 1–62). It is
more appropriate to retain all the digits during intermediate calculations,
and to do the rounding in the final step since this is what a computer will
normally do.
When solving problems, we will assume the given information to be
accurate to at least three significant digits. Therefore, if the length of a pipe
is given to be 40 m, we will assume it to be 40.0 m in order to justify using
three significant digits in the final results. You should also keep in mind that
all experimentally determined values are subject to measurement errors, and
such errors will reflect in the results obtained. For example, if the density of
a substance has an uncertainty of 2 percent, then the mass determined using
this density value will also have an uncertainty of 2 percent.
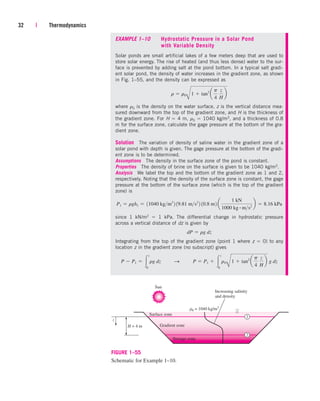
You should also be aware that we sometimes knowingly introduce small
errors in order to avoid the trouble of searching for more accurate data. For
example, when dealing with liquid water, we just use the value of 1000
kg/m3 for density, which is the density value of pure water at 0°C. Using
this value at 75°C will result in an error of 2.5 percent since the density at
this temperature is 975 kg/m3. The minerals and impurities in the water will
introduce additional error. This being the case, you should have no reserva-
tion in rounding the final results to a reasonable number of significant dig-
its. Besides, having a few percent uncertainty in the results of engineering
analysis is usually the norm, not the exception.
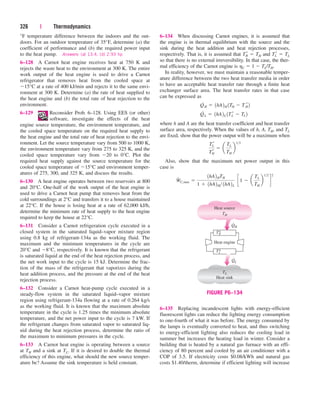
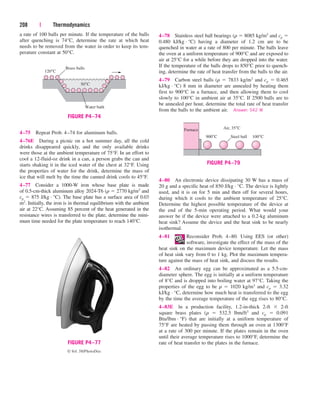
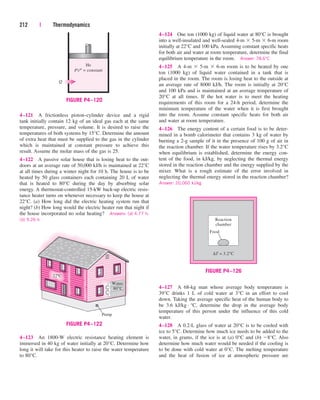
38 | Thermodynamics
Given:
Given:
Also,
Also, 3.75
3.75 0.845 = 3.16875
0.845 = 3.16875
Volume:
Volume:
Density:
Density:
Find:
Find:
Mass:
Mass: m =
= rV = 3.16875 kg
= 3.16875 kg
Rounding to 3 significant digits:
Rounding to 3 significant digits:
m = 3.17 kg
= 3.17 kg
(3 significant digits)
(3 significant digits)
V = 3.75 L
= 3.75 L
r = 0.845 kg
= 0.845 kg/L
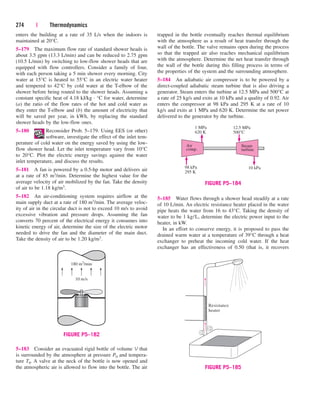
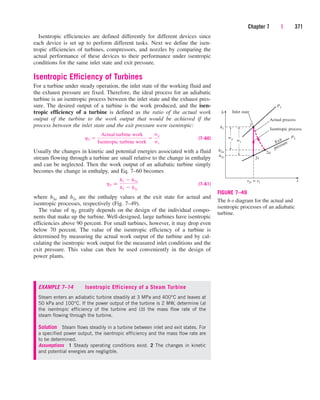
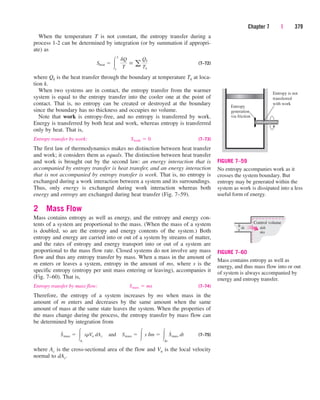
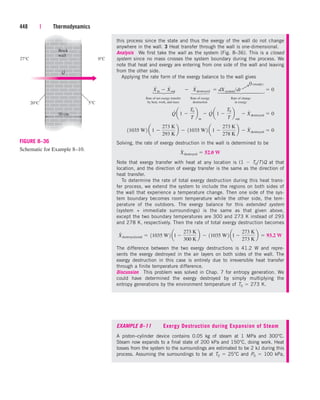
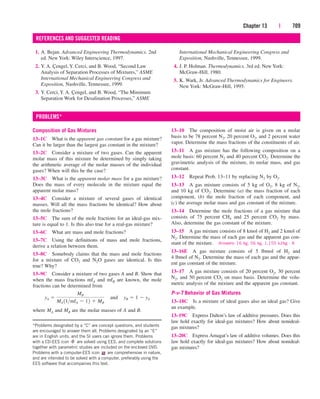
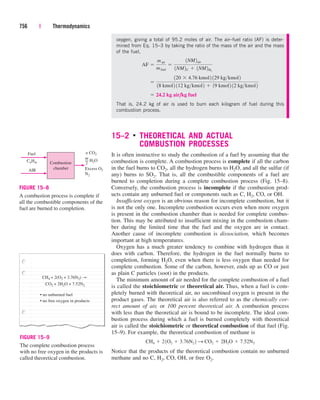
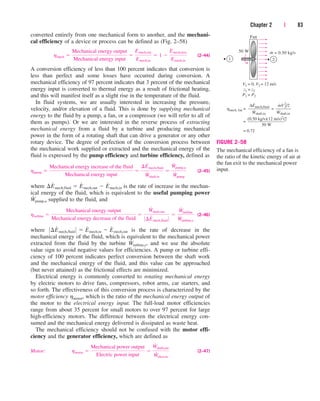
FIGURE 1–62
A result with more significant digits
than that of given data falsely implies
more accuracy.
within brackets [ ] after the specified value. When this feature is utilized,
the previous equations would take the following form:
g=9.81 [m/s^2]
Patm=85600 [Pa]
h1=0.1 [m]; h2=0.2 [m]; h3=0.35 [m]
rw=1000 [kg/m^3]; roil=850 [kg/m^3]; rm=13600 [kg/m^3]
P1+rw*g*h1+roil*g*h2-rm*g*h3=Patm
cen84959_ch01.qxd 3/31/05 3:39 PM Page 38](https://image.slidesharecdn.com/engineeringthermodynamics-230915082801-f5cce7d4/85/Engineering-Thermodynamics-pdf-118-320.jpg)
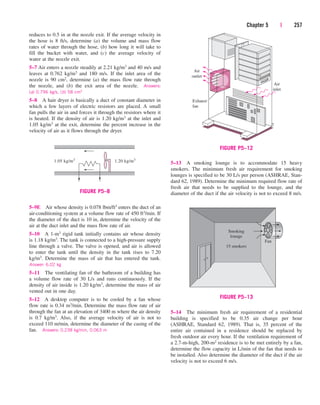
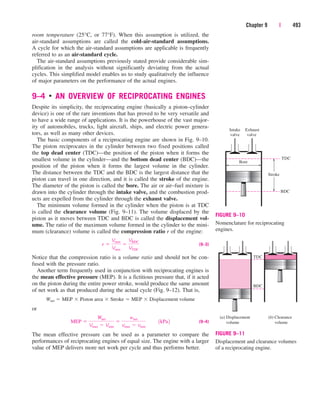
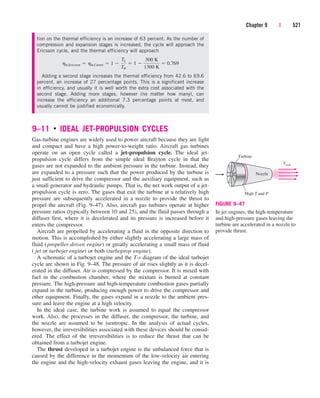
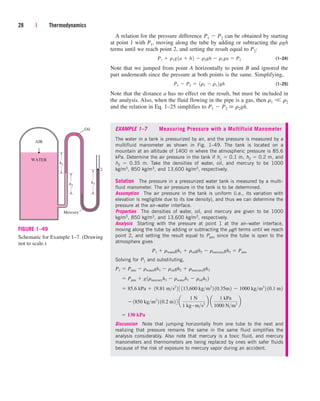
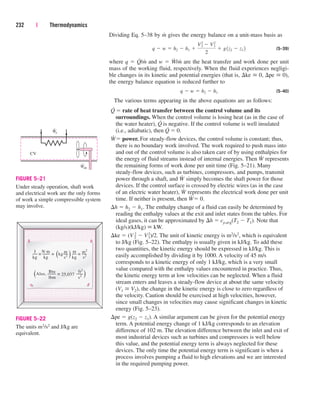
![Chapter 1 | 47
1–96 The average temperature of the atmosphere in the
world is approximated as a function of altitude by the relation
where Tatm is the temperature of the atmosphere in K and z is
the altitude in km with z 0 at sea level. Determine the
average temperature of the atmosphere outside an airplane
that is cruising at an altitude of 12,000 m.
1–97 Joe Smith, an old-fashioned engineering student,
believes that the boiling point of water is best suited for use as
the reference point on temperature scales. Unhappy that the
boiling point corresponds to some odd number in the current
absolute temperature scales, he has proposed a new absolute
temperature scale that he calls the Smith scale. The temperature
unit on this scale is smith, denoted by S, and the boiling point
of water on this scale is assigned to be 1000 S. From a thermo-
dynamic point of view, discuss if it is an acceptable temperature
scale. Also, determine the ice point of water on the Smith scale
and obtain a relation between the Smith and Celsius scales.
1–98E It is well-known that cold air feels much colder in
windy weather than what the thermometer reading indicates
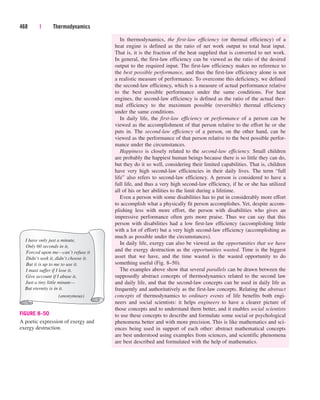
because of the “chilling effect” of the wind. This effect is due
to the increase in the convection heat transfer coefficient with
increasing air velocities. The equivalent wind chill tempera-
ture in °F is given by [ASHRAE, Handbook of Fundamentals
(Atlanta, GA, 1993), p. 8.15]
where V is the wind velocity in mi/h and Tambient is the ambi-
ent air temperature in °F in calm air, which is taken to be air
with light winds at speeds up to 4 mi/h. The constant 91.4°F
in the given equation is the mean skin temperature of a rest-
ing person in a comfortable environment. Windy air at tem-
perature Tambient and velocity V will feel as cold as the calm
air at temperature Tequiv. Using proper conversion factors,
obtain an equivalent relation in SI units where V is the wind
velocity in km/h and Tambient is the ambient air temperature in
°C.
Answer: Tequiv 33.0(33.0Tambient)
(0.475 0.0126V 0.240V
–
)
1–99E Reconsider Problem 1–98E. Using EES (or
other) software, plot the equivalent wind chill
temperatures in °F as a function of wind velocity in the range
of 4 to 100 mph for the ambient temperatures of 20, 40, and
60°F. Discuss the results.
1–100 An air-conditioning system requires a 20-m-long
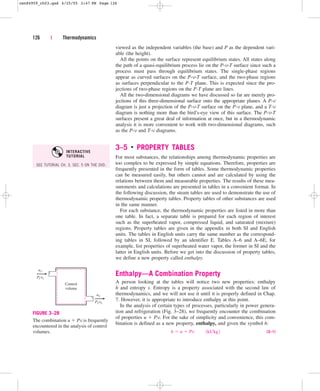
section of 15-cm diameter duct work to be laid underwater.
¬ 10.475 0.0203V 0.3042V2
Tequiv 91.4 191.4 Tambient 2
Tatm 288.15 6.5z
Determine the upward force the water will exert on the duct.
Take the densities of air and water to be 1.3 kg/m3 and 1000
kg/m3, respectively.
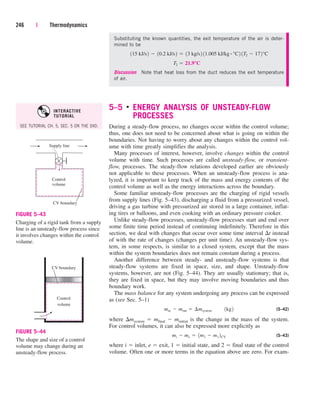
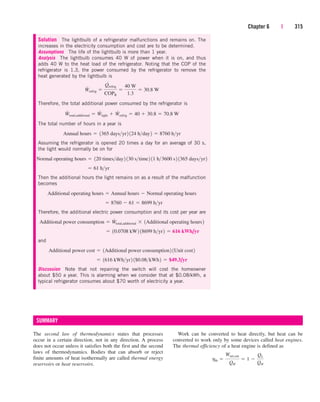
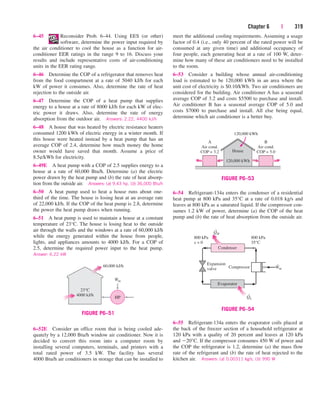
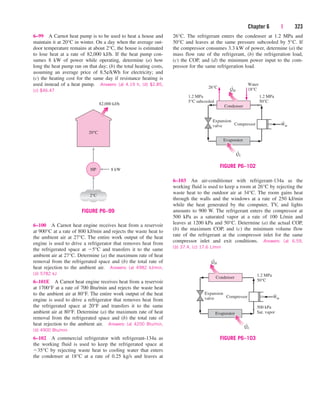
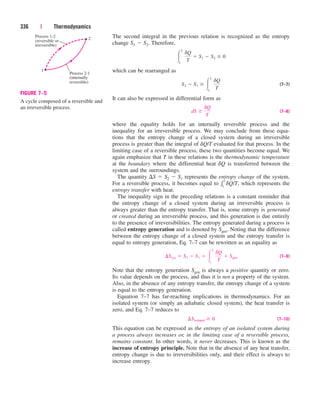
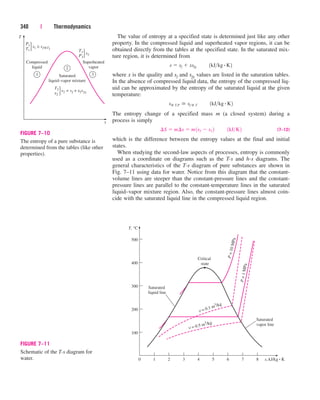
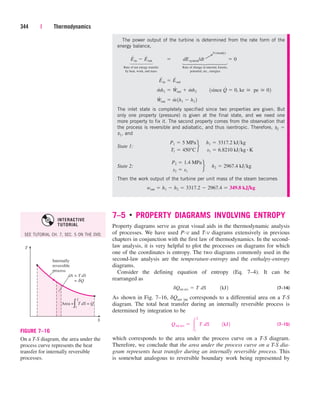
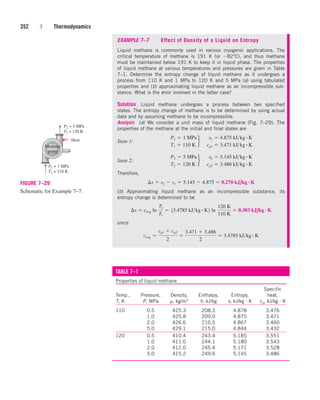
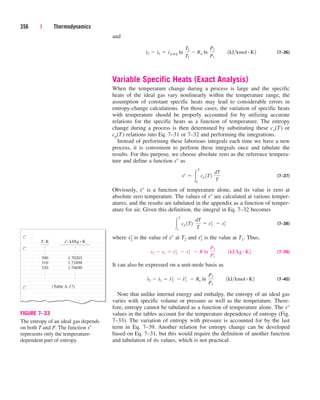
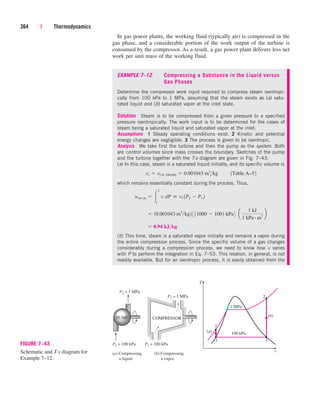
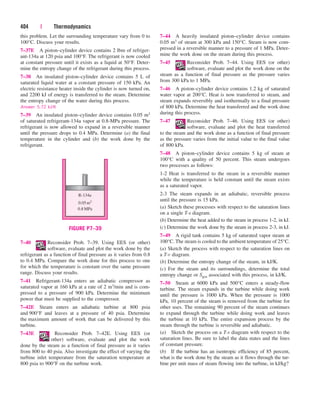
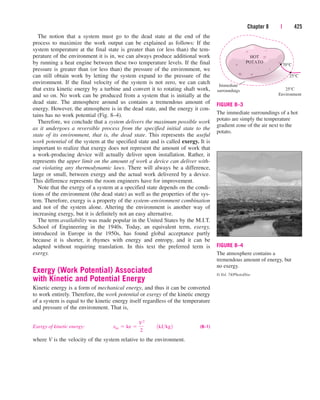
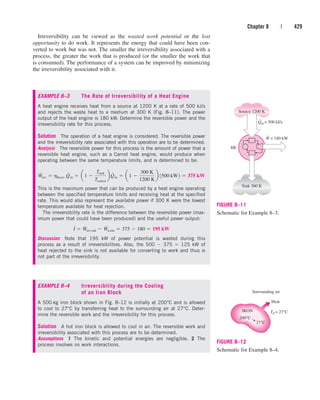
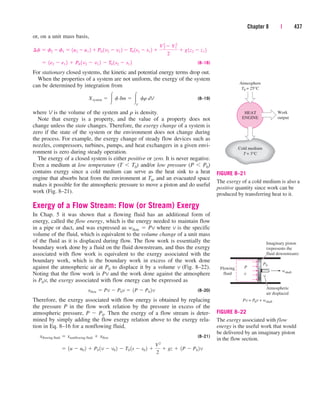
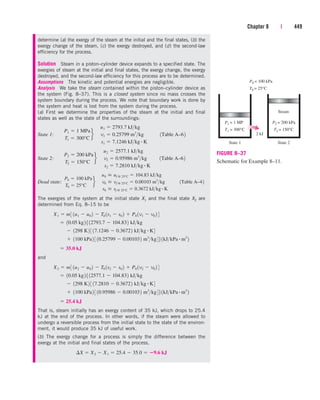
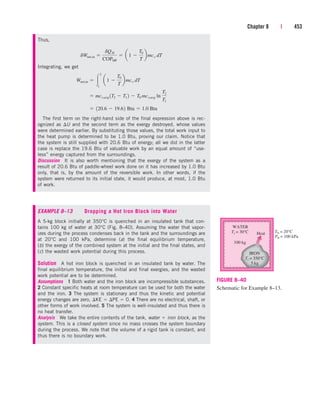
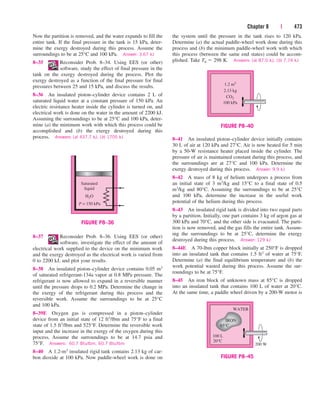
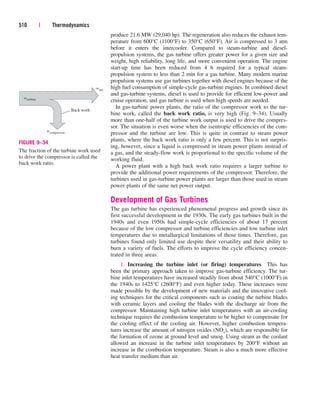
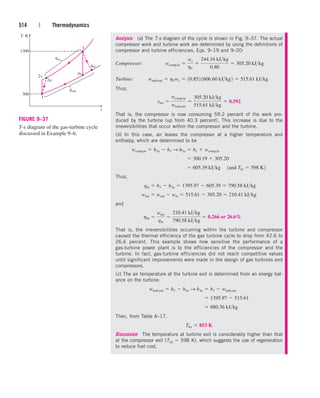
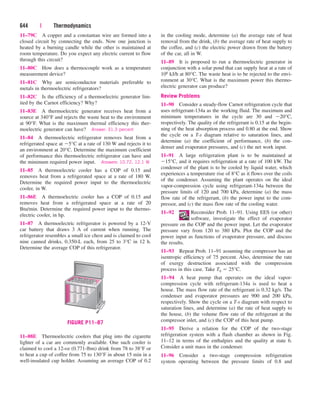
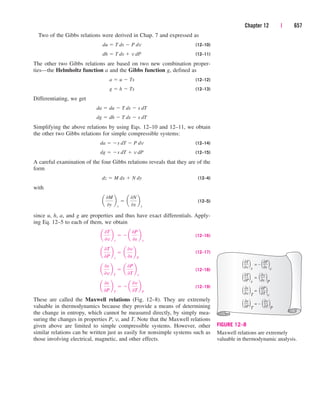
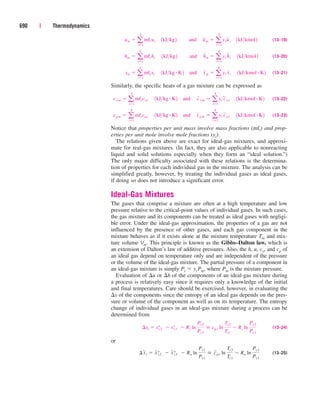
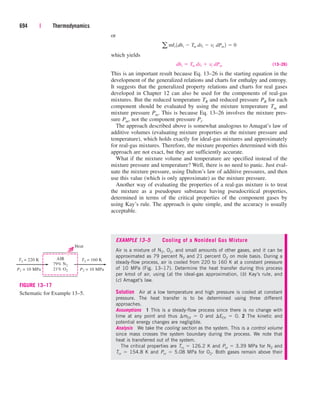
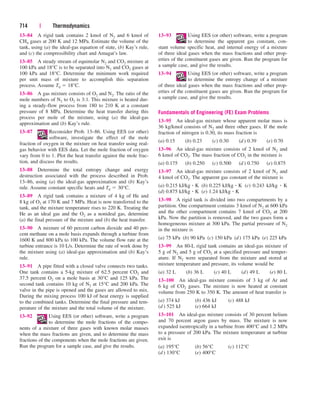
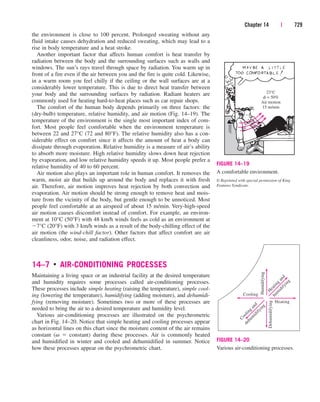
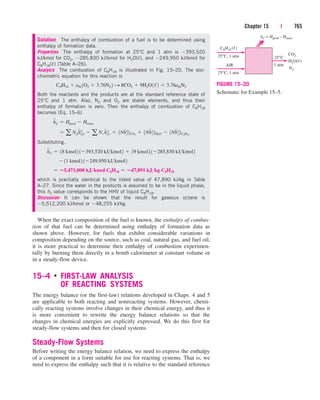
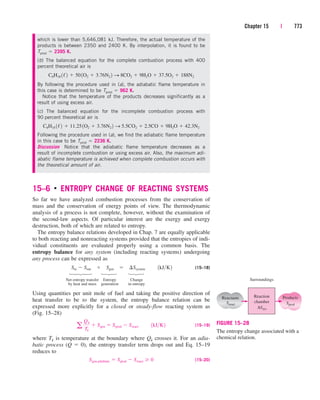
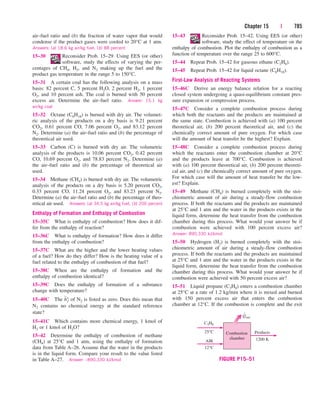
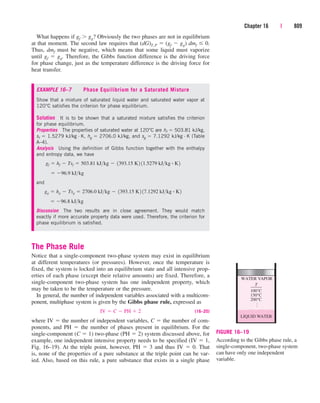
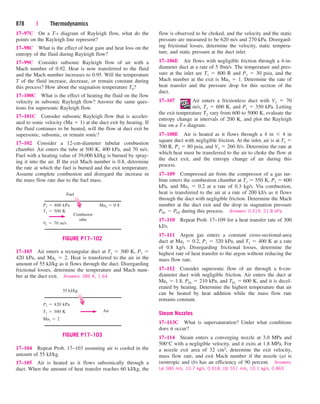
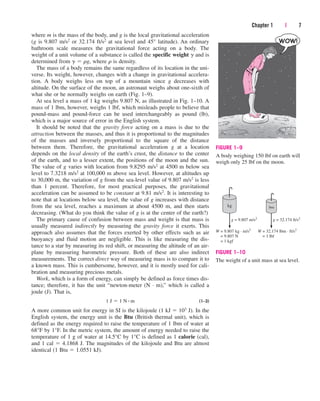
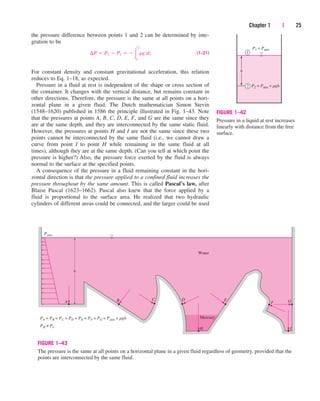
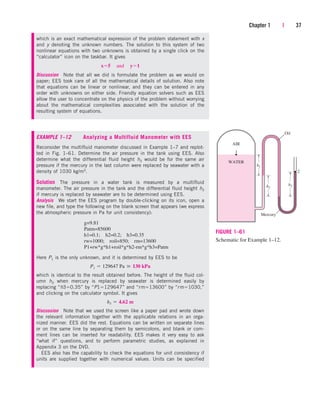
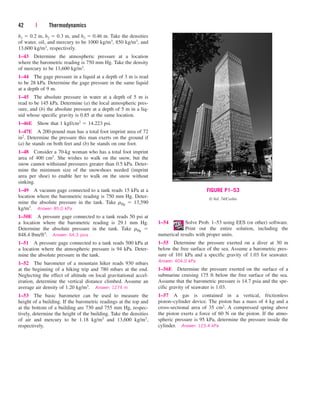
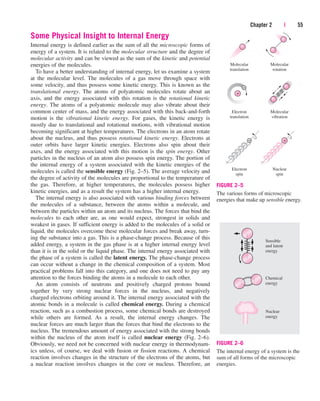
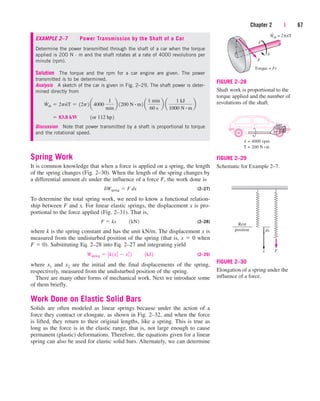
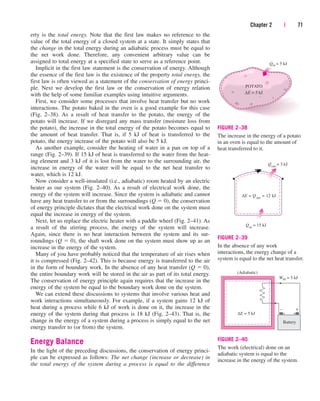
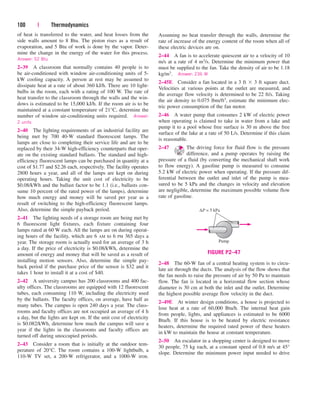
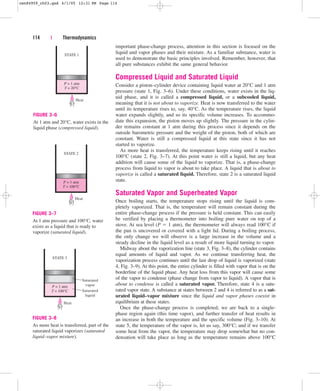
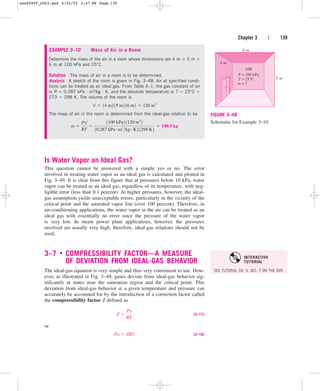
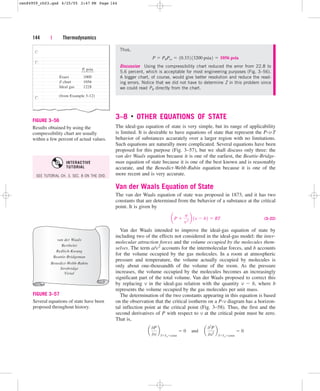
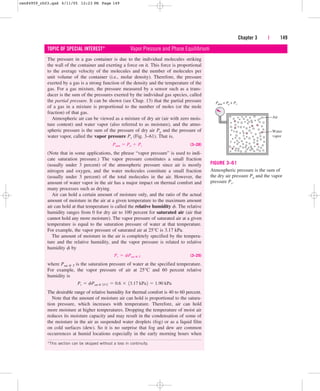
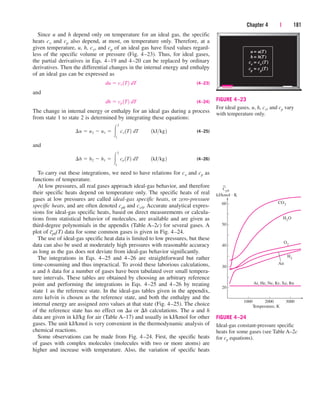
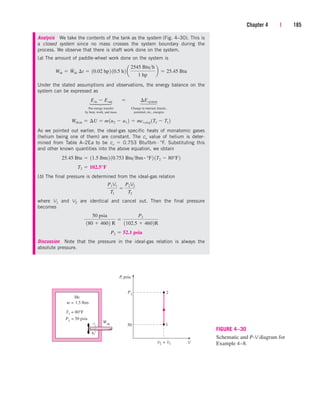
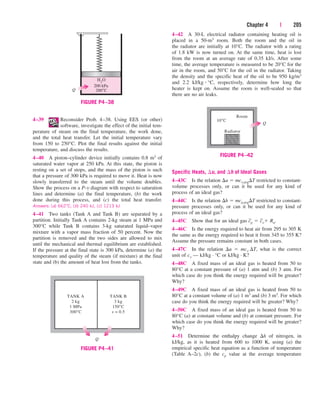
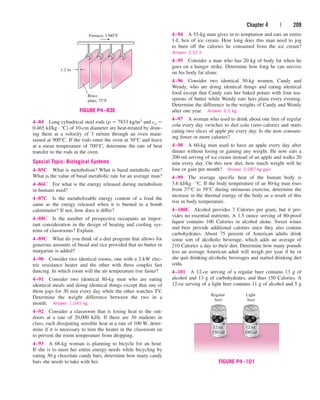
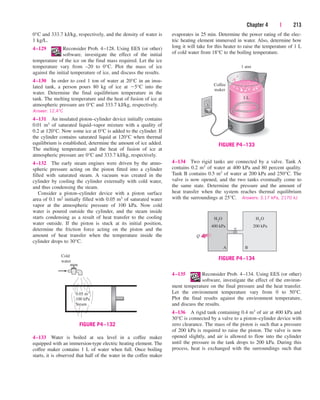
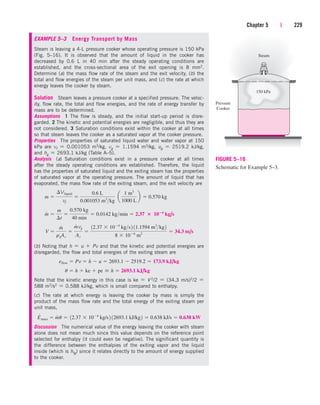
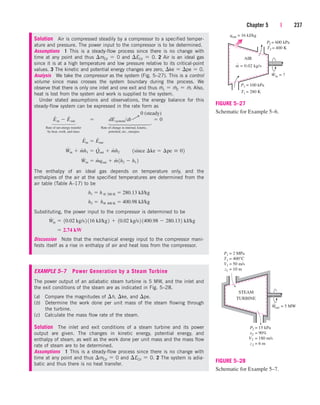
1–101 Balloons are often filled with helium gas because it
weighs only about one-seventh of what air weighs under
identical conditions. The buoyancy force, which can be
expressed as Fb rairgVballoon, will push the balloon upward.
If the balloon has a diameter of 10 m and carries two people,
70 kg each, determine the acceleration of the balloon when it
is first released. Assume the density of air is r 1.16 kg/m3,
and neglect the weight of the ropes and the cage. Answer:
16.5 m/s2
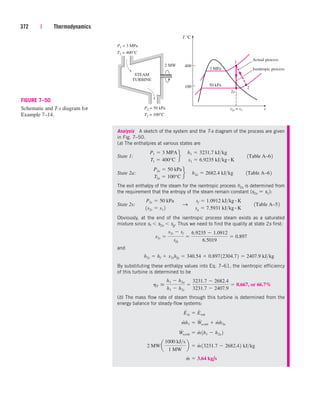
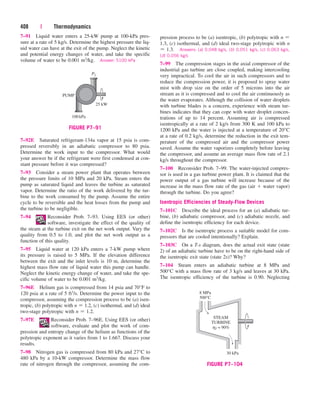
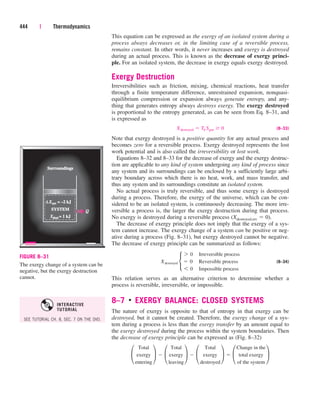
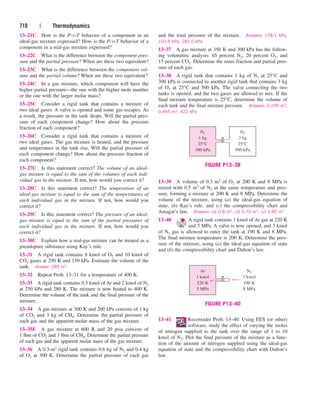
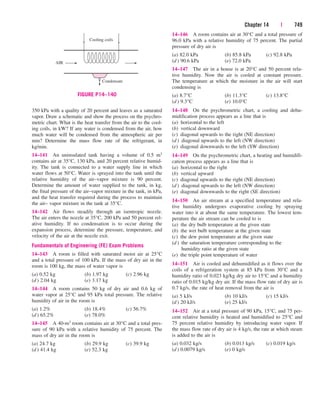
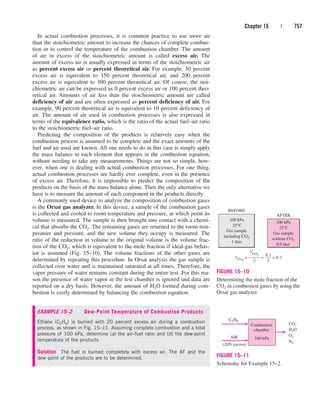
HELIUM
D = 10 m
rHe = rair
1
7
m = 140 kg
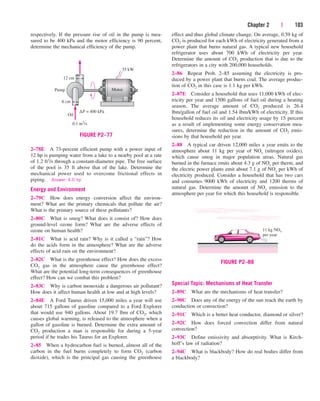
FIGURE P1–101
1–102 Reconsider Prob. 1–101. Using EES (or other)
software, investigate the effect of the number
of people carried in the balloon on acceleration. Plot the
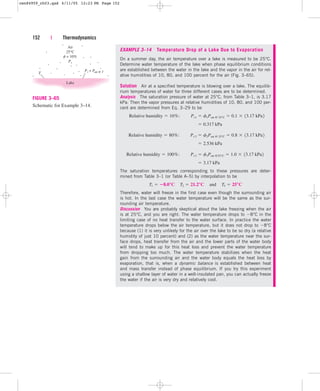
acceleration against the number of people, and discuss the
results.
1–103 Determine the maximum amount of load, in kg,
the balloon described in Prob. 1–101 can carry. Answer:
520.5 kg
1–104E The pressure in a steam boiler is given to be
92 kgf/cm2. Express this pressure in psi, kPa, atm, and bars.
1–105 The basic barometer can be used as an altitude-
measuring device in airplanes. The ground control reports a
barometric reading of 753 mm Hg while the pilot’s reading is
690 mm Hg. Estimate the altitude of the plane from ground
level if the average air density is 1.20 kg/m3. Answer: 714 m
cen84959_ch01.qxd 3/31/05 3:39 PM Page 47](https://image.slidesharecdn.com/engineeringthermodynamics-230915082801-f5cce7d4/85/Engineering-Thermodynamics-pdf-127-320.jpg)
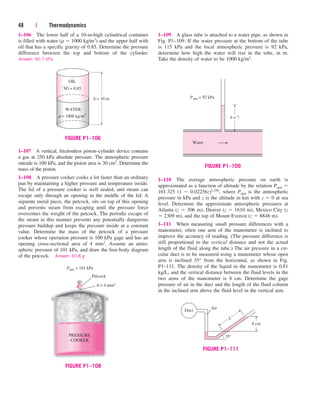
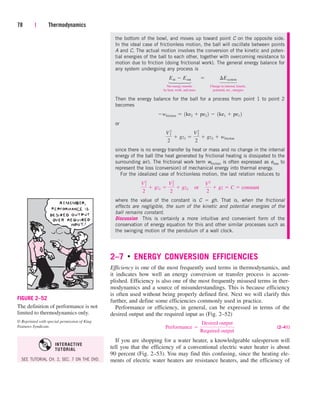
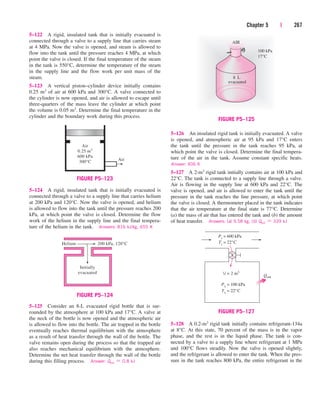
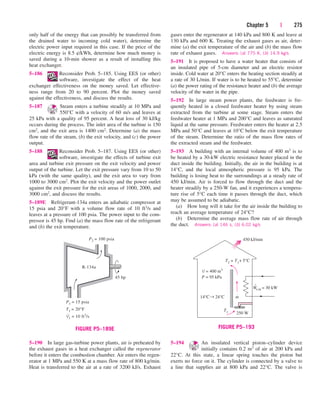
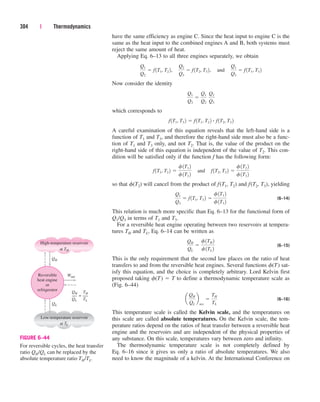
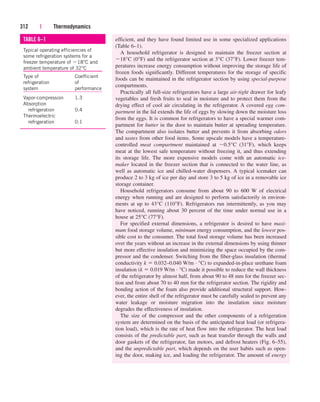
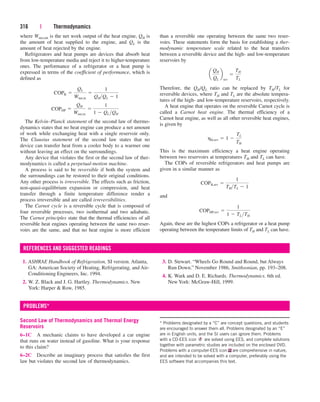
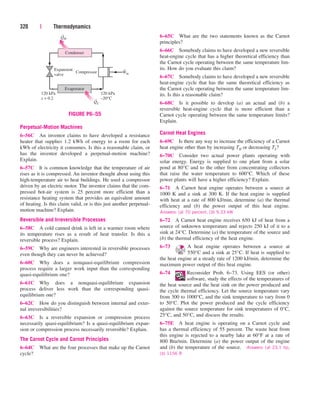
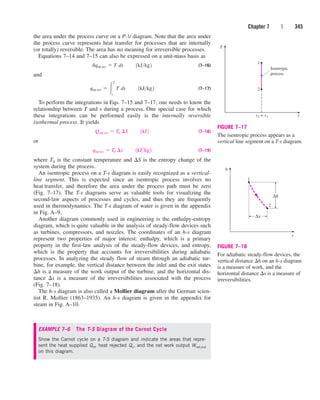
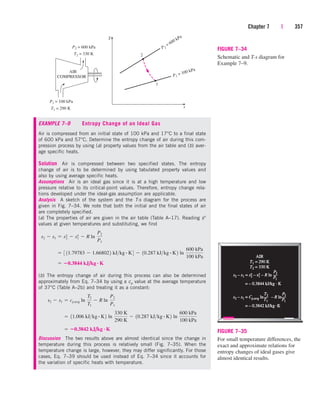
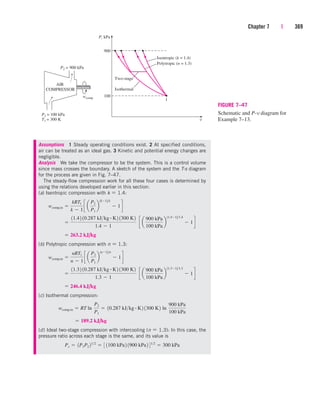
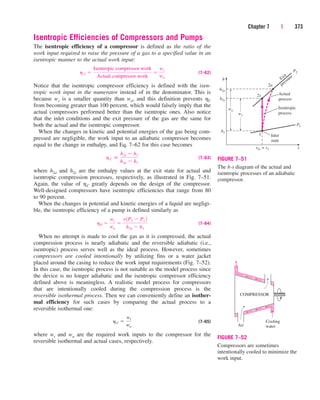
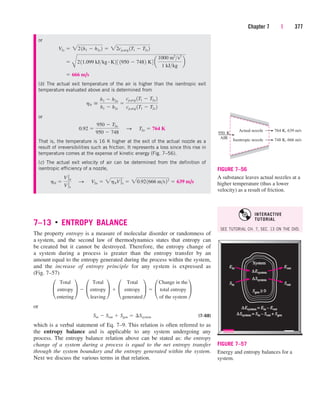
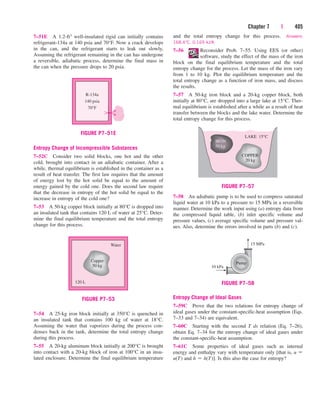
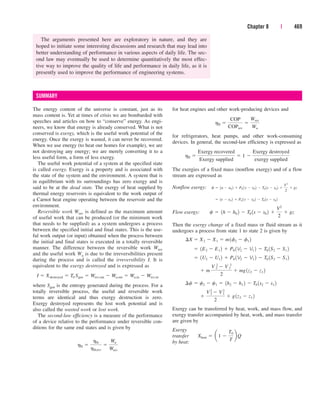
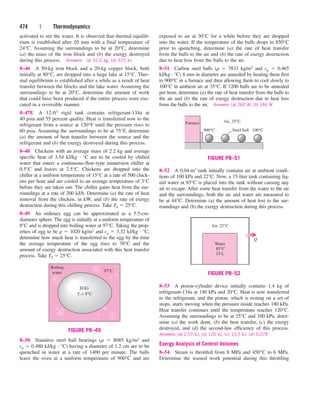
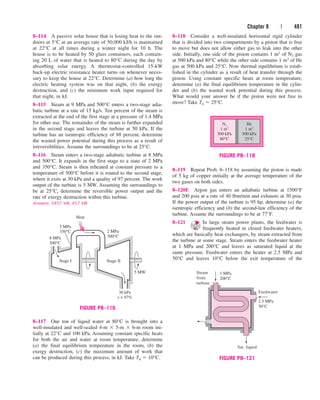
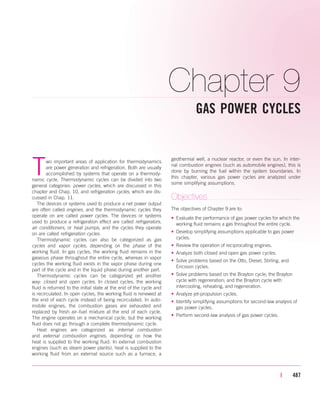
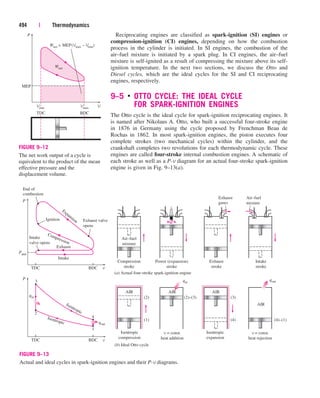
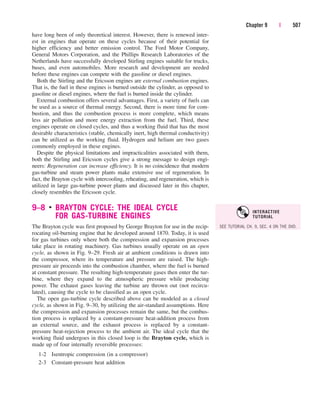
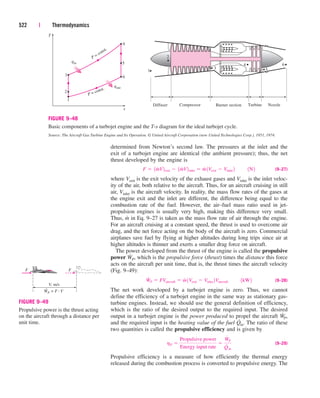
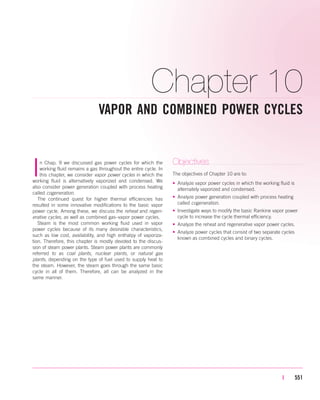
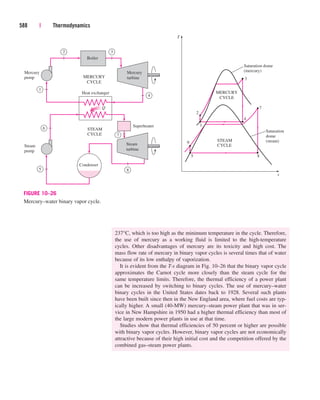
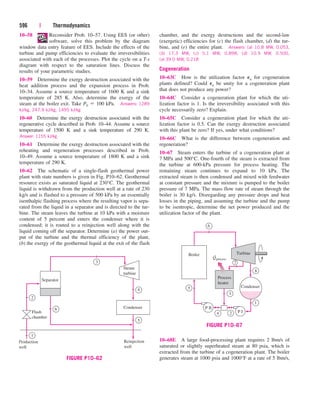
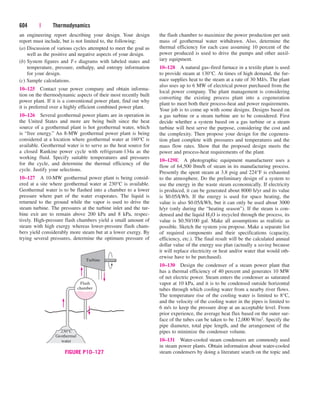
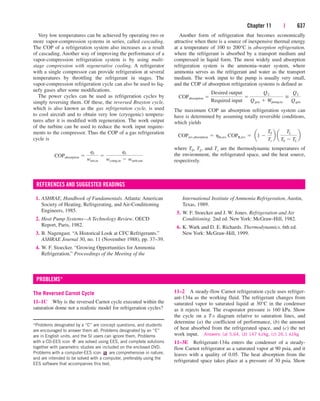
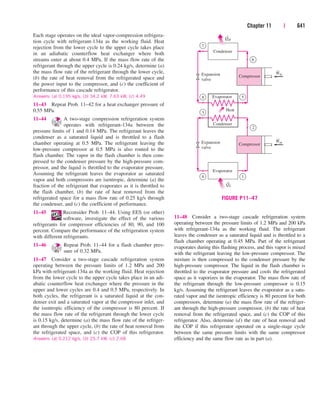
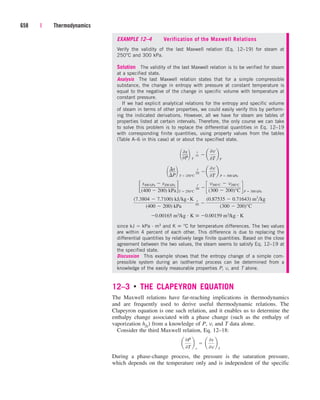
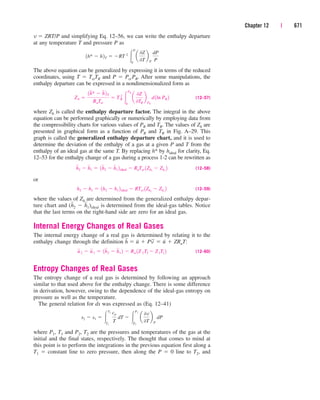
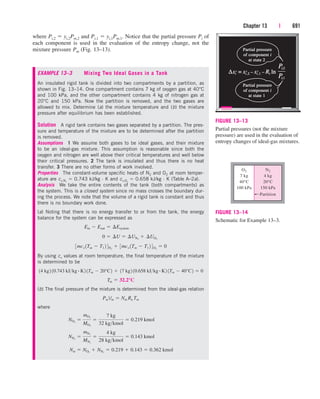
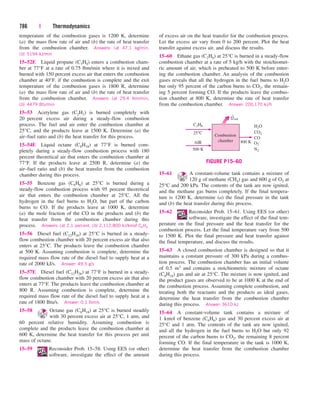
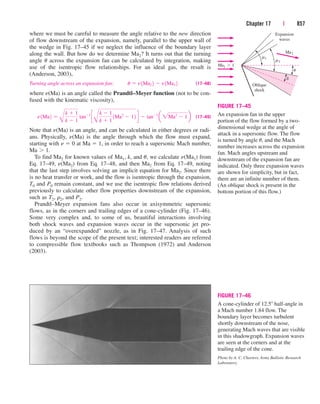
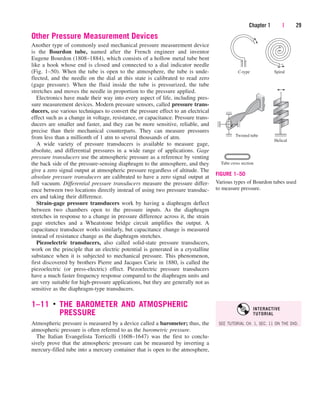
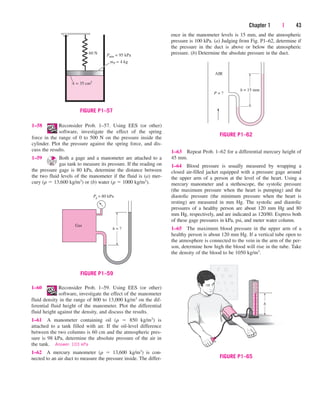
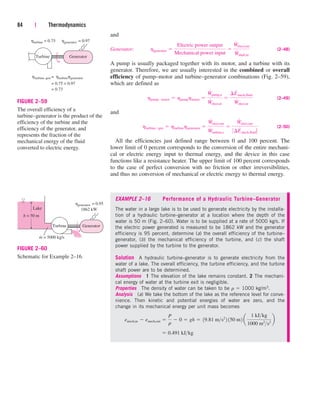
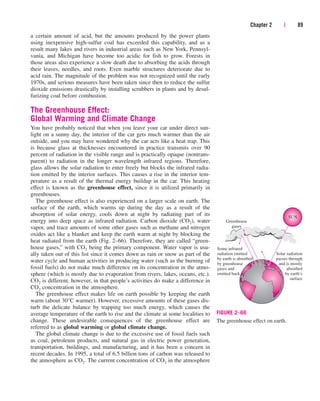
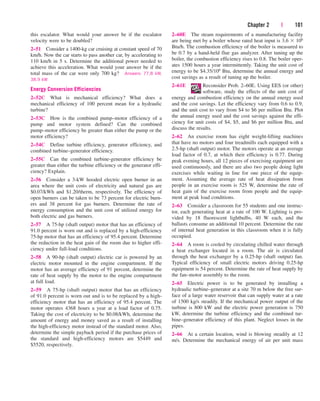
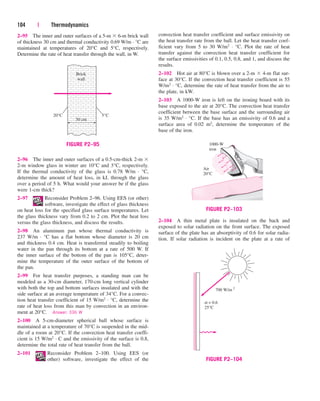
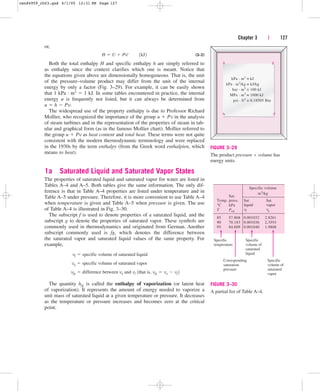
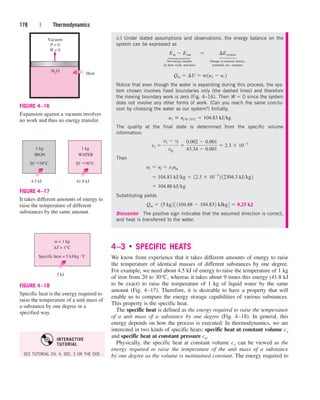
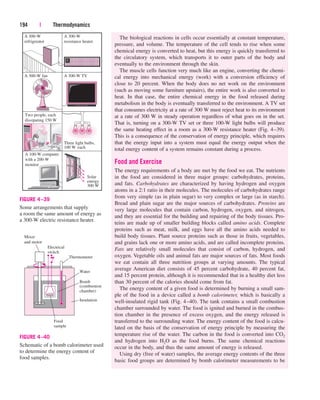
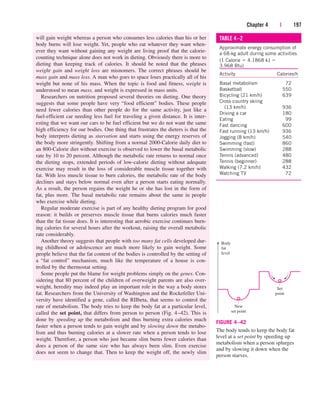
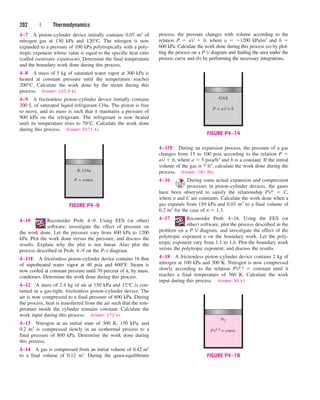
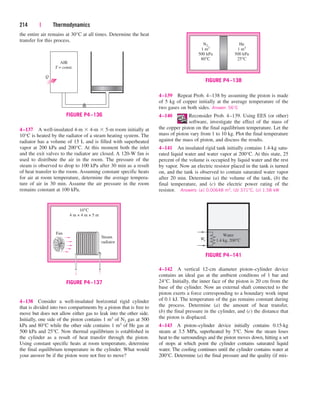
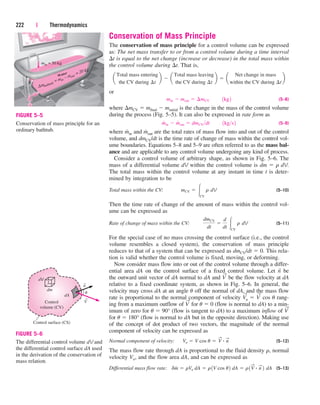
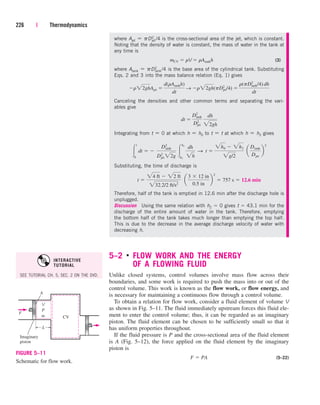
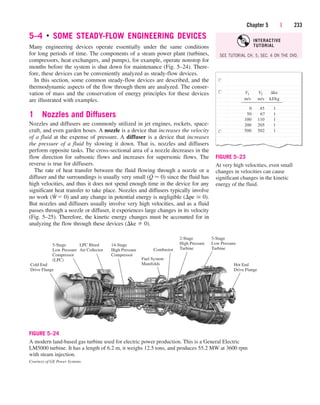
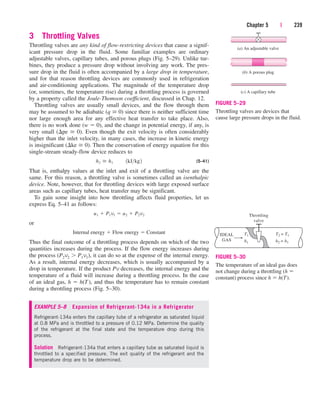
![Chapter 2 | 81
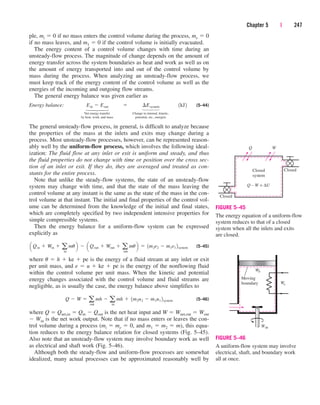
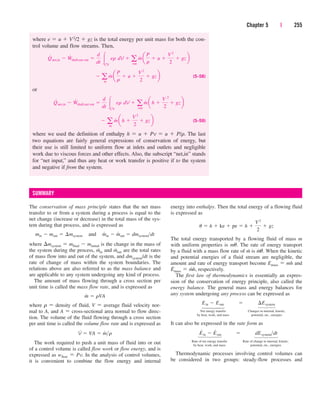
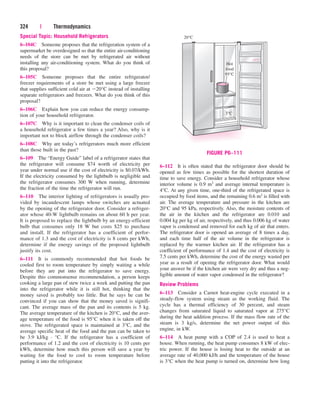
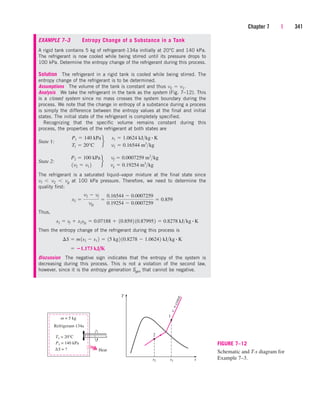
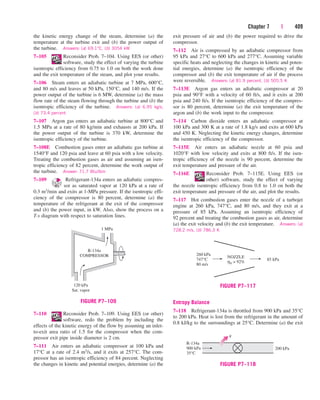
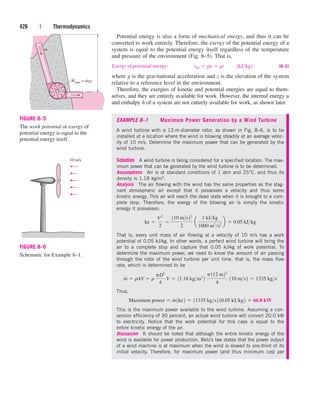
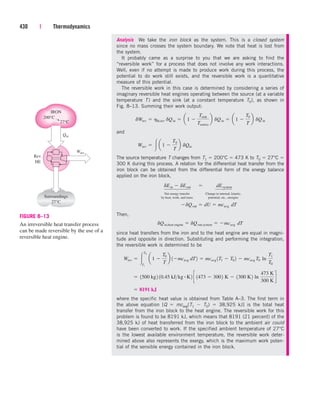
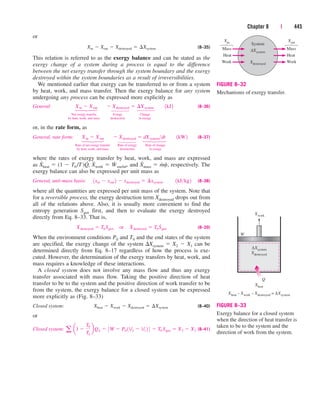
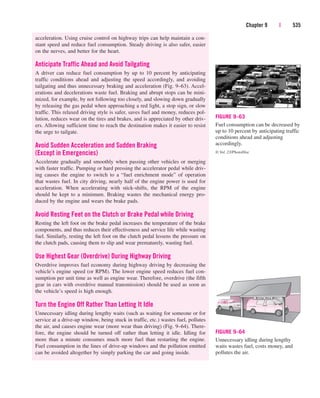
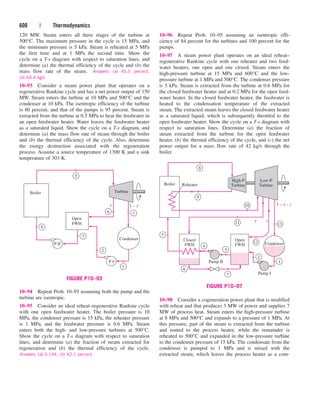
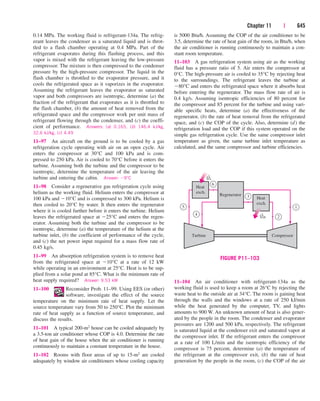
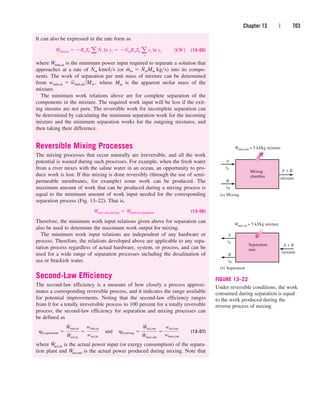
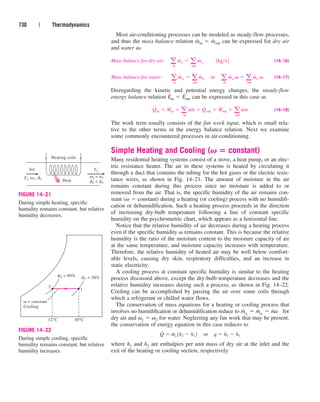
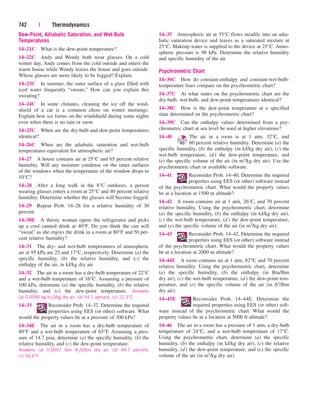
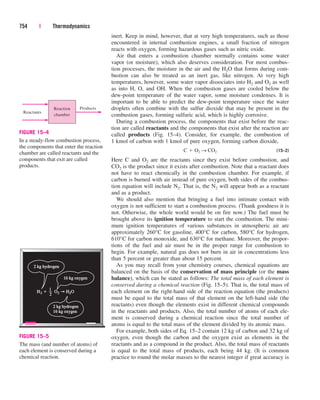
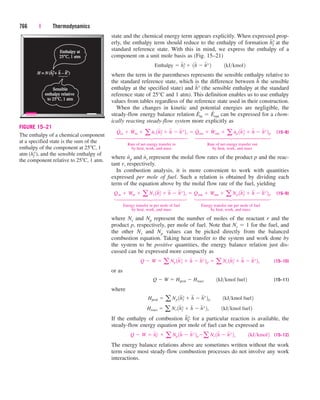
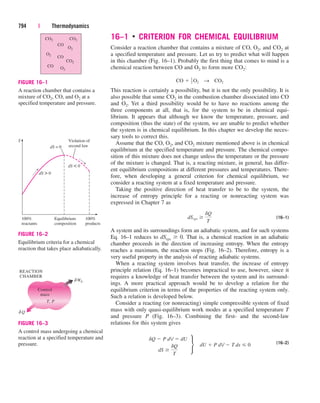
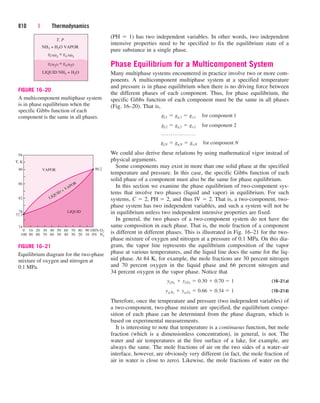
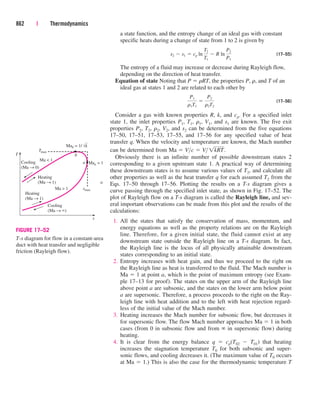
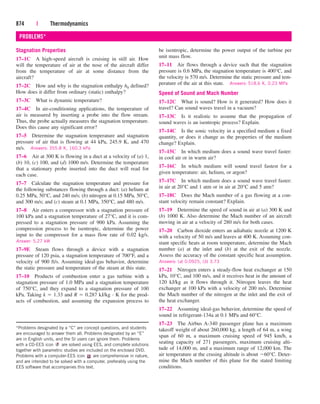
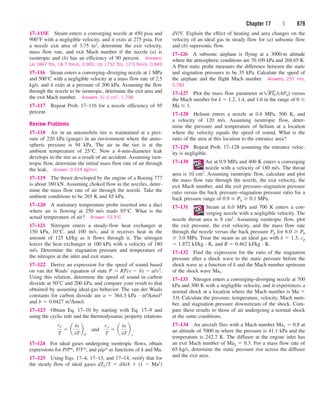
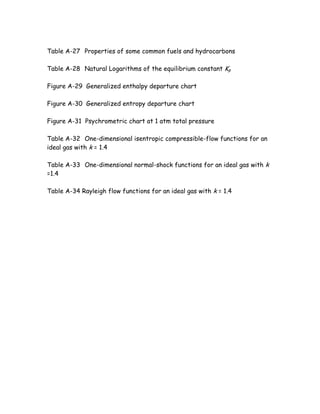
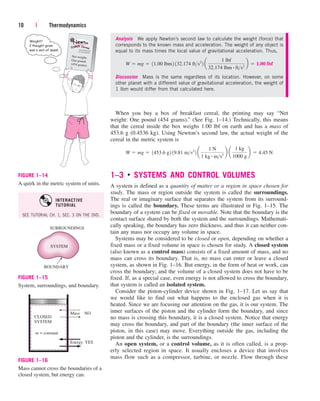
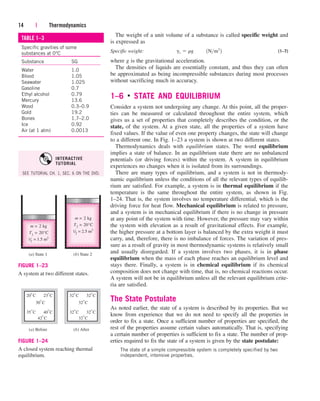
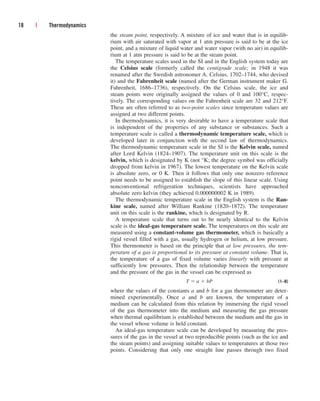
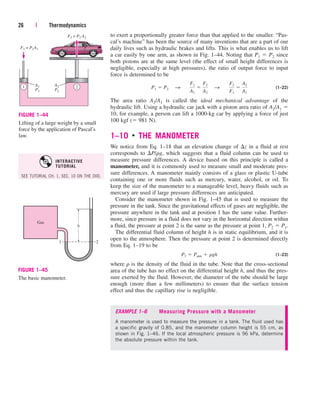
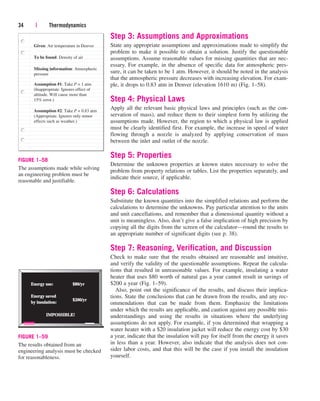
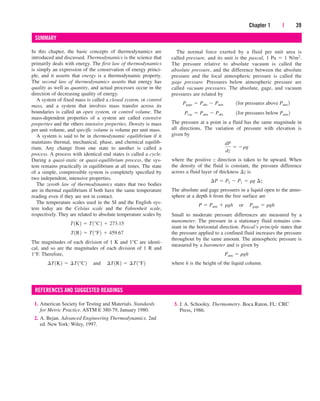
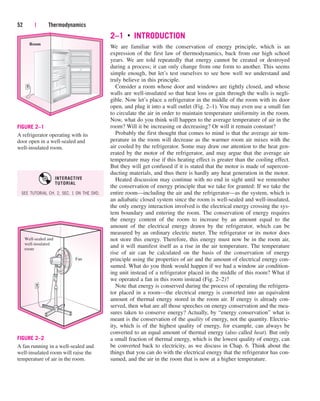
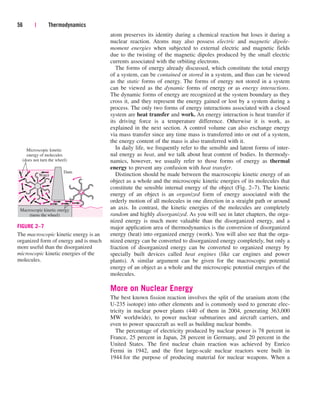
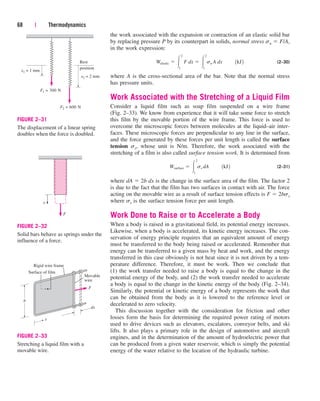
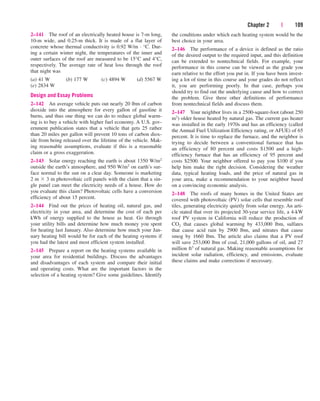
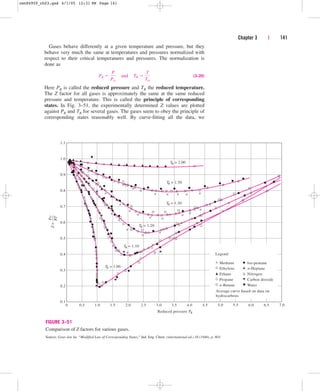
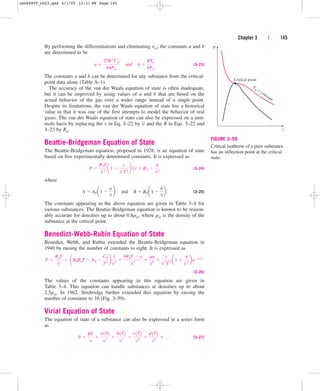
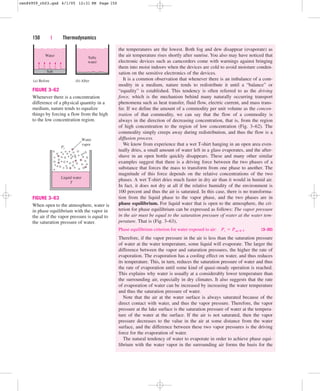
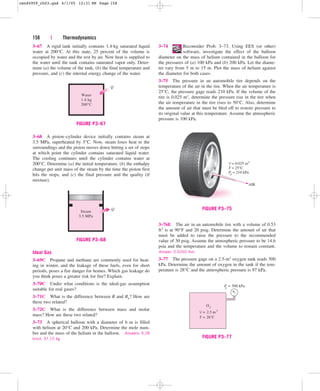
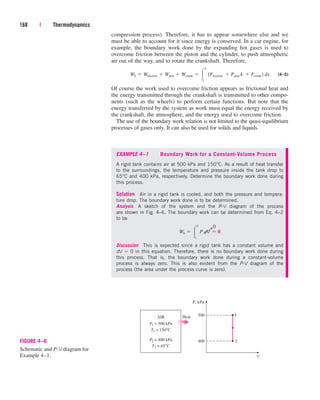
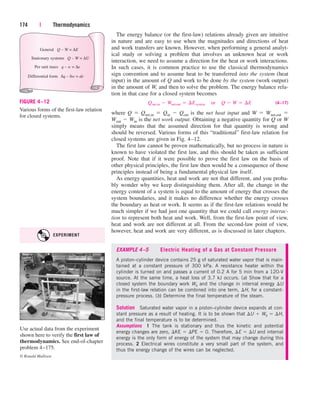
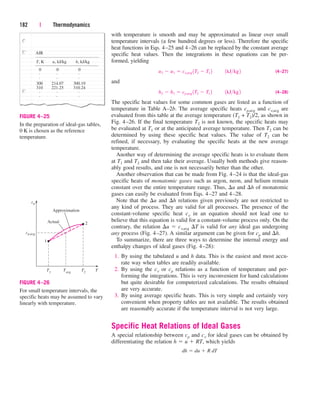
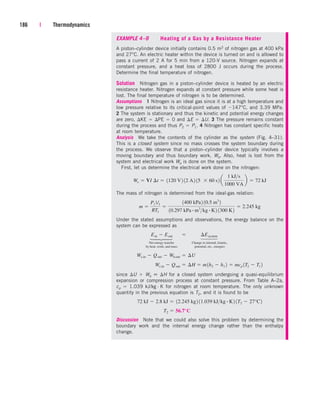
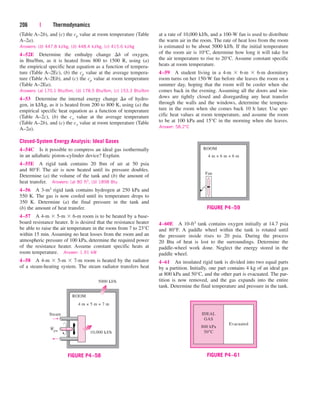
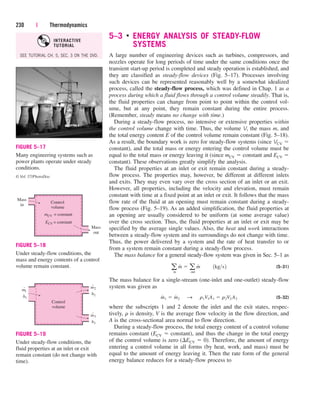
the food to the energy consumed by the appliance (Fig. 2–56). Electric
ranges are more efficient than gas ranges, but it is much cheaper to cook
with natural gas than with electricity because of the lower unit cost of nat-
ural gas (Table 2–2).
The cooking efficiency depends on user habits as well as the individual
appliances. Convection and microwave ovens are inherently more efficient
than conventional ovens. On average, convection ovens save about one-third
and microwave ovens save about two-thirds of the energy used by conven-
tional ovens. The cooking efficiency can be increased by using the smallest
oven for baking, using a pressure cooker, using an electric slow cooker for
stews and soups, using the smallest pan that will do the job, using the
smaller heating element for small pans on electric ranges, using flat-bot-
tomed pans on electric burners to assure good contact, keeping burner drip
pans clean and shiny, defrosting frozen foods in the refrigerator before
cooking, avoiding preheating unless it is necessary, keeping the pans cov-
ered during cooking, using timers and thermometers to avoid overcooking,
using the self-cleaning feature of ovens right after cooking, and keeping
inside surfaces of microwave ovens clean.
Using energy-efficient appliances and practicing energy conservation
measures help our pocketbooks by reducing our utility bills. It also helps
the environment by reducing the amount of pollutants emitted to the atmo-
sphere during the combustion of fuel at home or at the power plants where
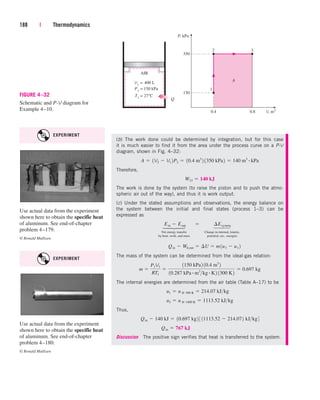
electricity is generated. The combustion of each therm of natural gas pro-
duces 6.4 kg of carbon dioxide, which causes global climate change; 4.7 g
of nitrogen oxides and 0.54 g of hydrocarbons, which cause smog; 2.0 g of
carbon monoxide, which is toxic; and 0.030 g of sulfur dioxide, which
causes acid rain. Each therm of natural gas saved eliminates the emission of
these pollutants while saving $0.60 for the average consumer in the United
States. Each kWh of electricity conserved saves 0.4 kg of coal and 1.0 kg of
CO2 and 15 g of SO2 from a coal power plant.
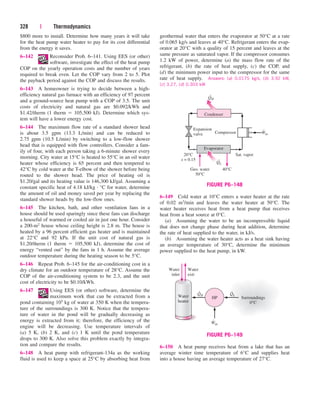
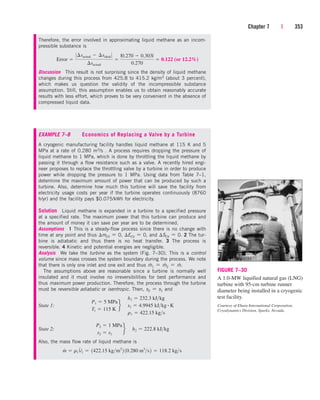
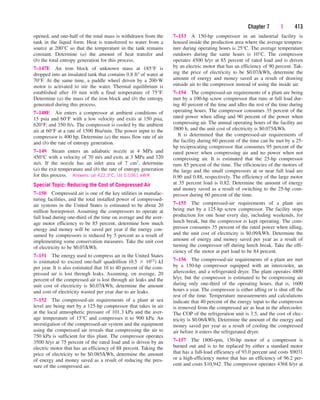
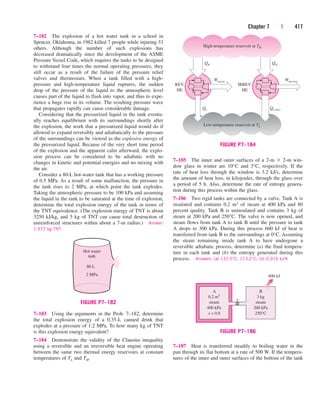
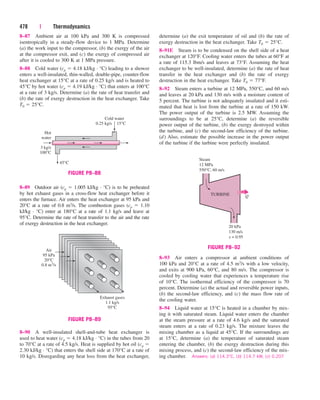
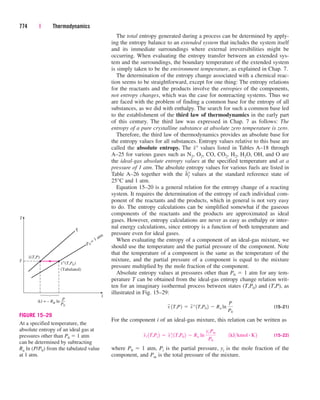
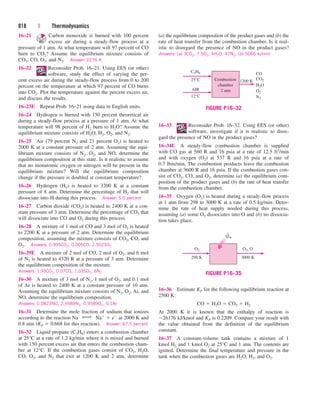
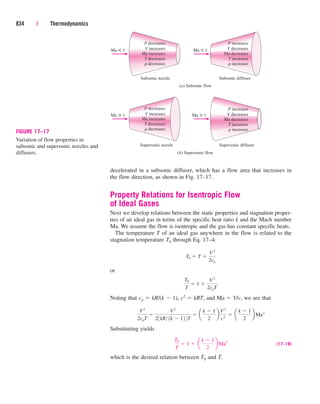
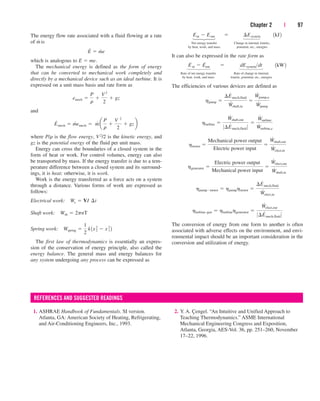
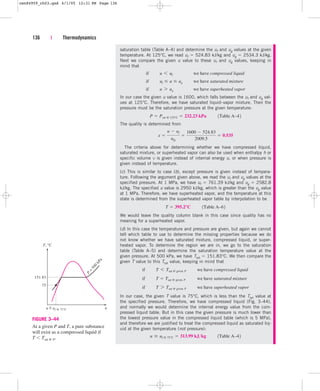
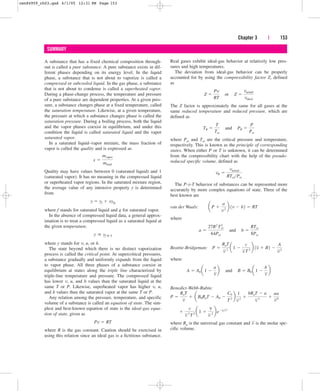
TABLE 2–2
Energy costs of cooking a casserole with different appliances*
[From A. Wilson and J. Morril, Consumer Guide to Home Energy Savings, Washington, DC:
American Council for an Energy-Efficient Economy, 1996, p. 192.]
Cooking Cooking Energy Cost of
Cooking appliance temperature time used energy
Electric oven 350F (177C) 1 h 2.0 kWh $0.16
Convection oven (elect.) 325F (163C) 45 min 1.39 kWh $0.11
Gas oven 350F (177C) 1 h 0.112 therm $0.07
Frying pan 420F (216C) 1 h 0.9 kWh $0.07
Toaster oven 425F (218C) 50 min 0.95 kWh $0.08
Electric slow cooker 200F (93C) 7 h 0.7 kWh $0.06
Microwave oven “High” 15 min 0.36 kWh $0.03
*Assumes a unit cost of $0.08/kWh for electricity and $0.60/therm for gas.
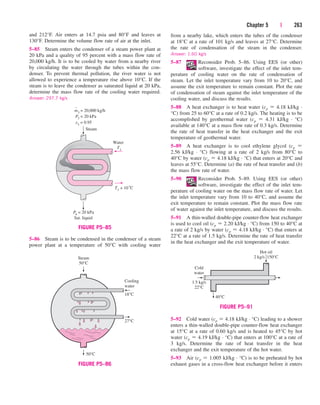
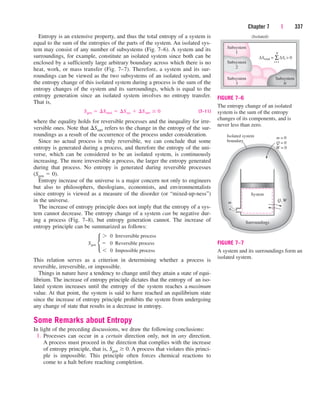
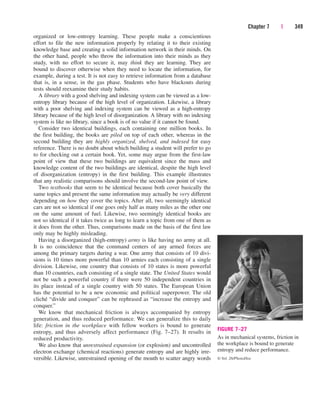
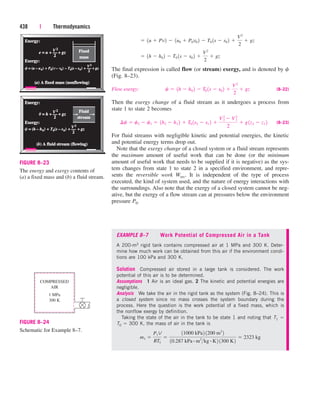
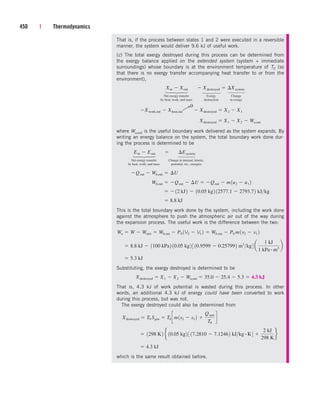
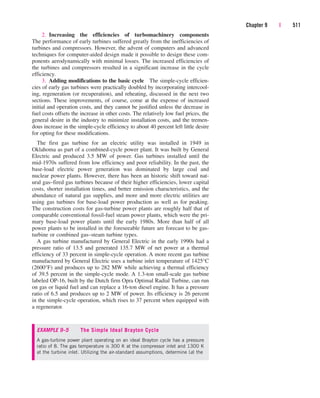
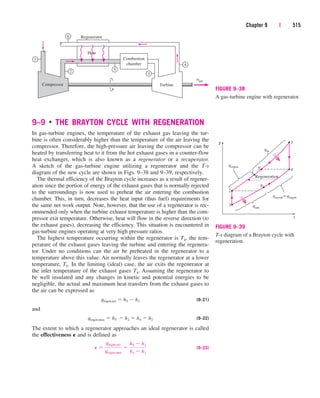
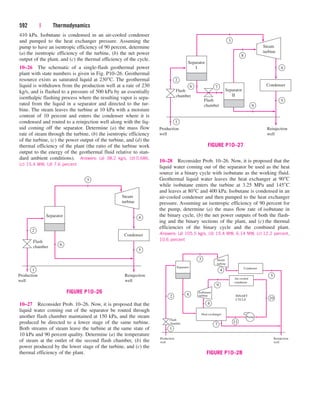
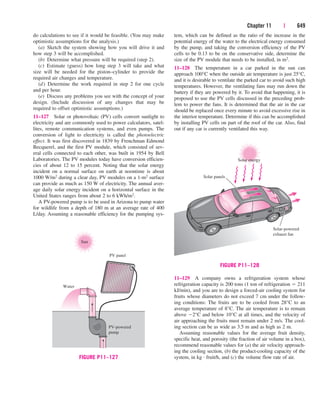
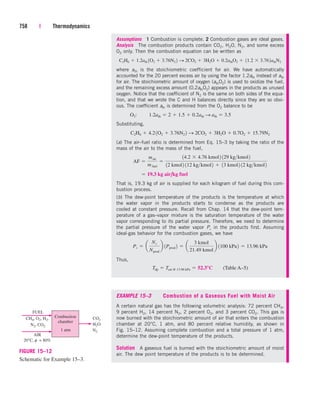
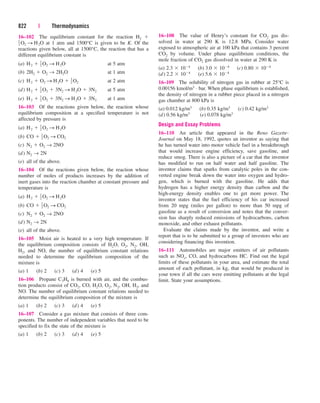
5 kW
3 kW
2 kW
Efficiency =
Energy utilized
Energy supplied to appliance
3 kWh
5 kWh
= = 0.60
FIGURE 2–56
The efficiency of a cooking appliance
represents the fraction of the energy
supplied to the appliance that is
transferred to the food.
cen84959_ch02.qxd 3/31/05 5:02 PM Page 81](https://image.slidesharecdn.com/engineeringthermodynamics-230915082801-f5cce7d4/85/Engineering-Thermodynamics-pdf-161-320.jpg)
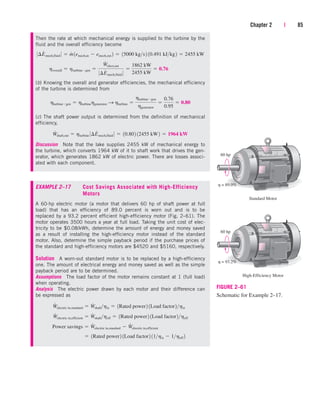
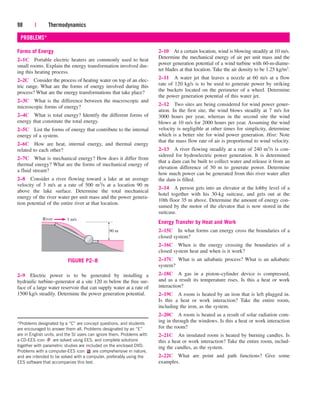
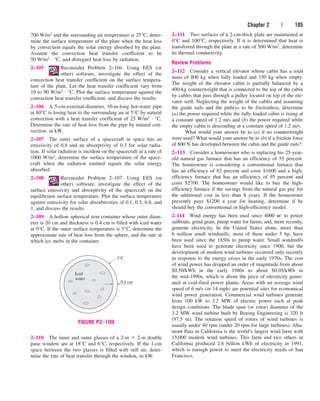


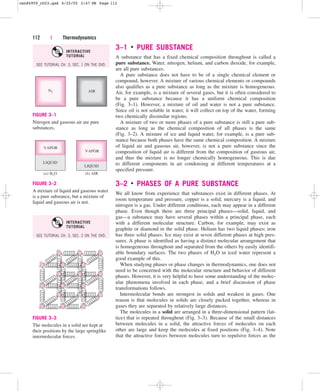
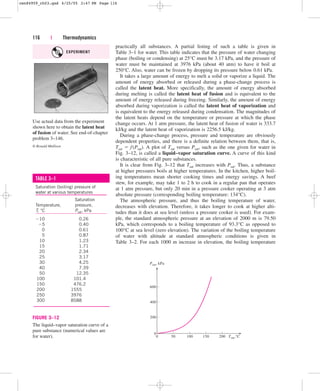
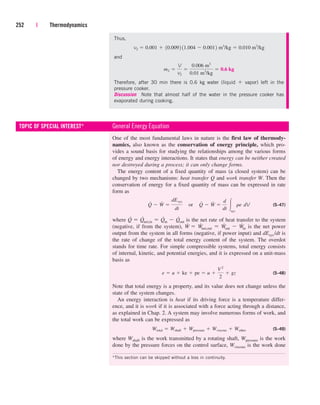
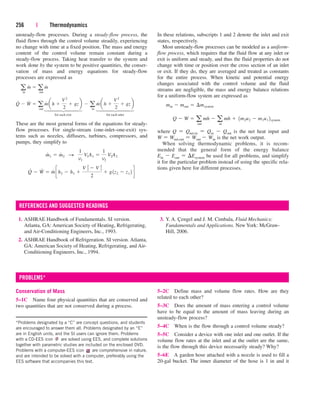
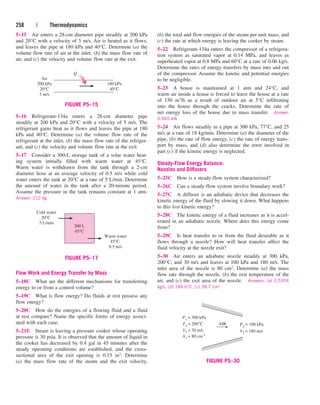
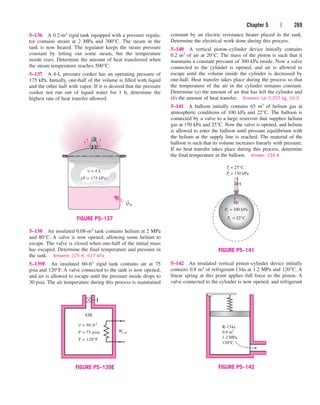
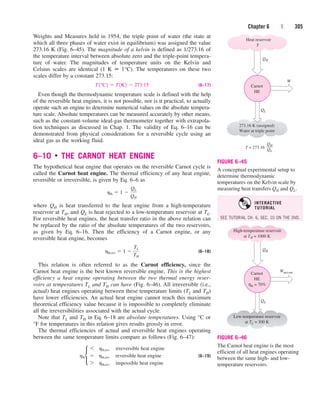
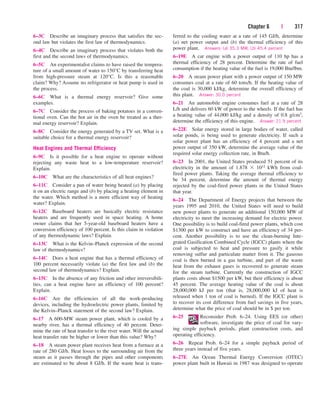
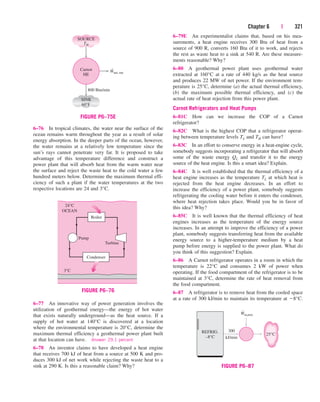
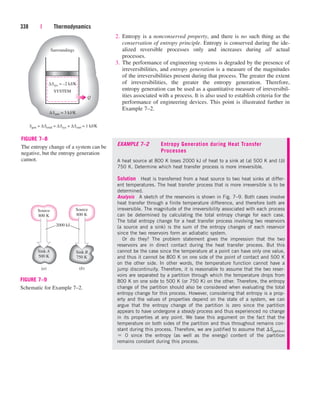
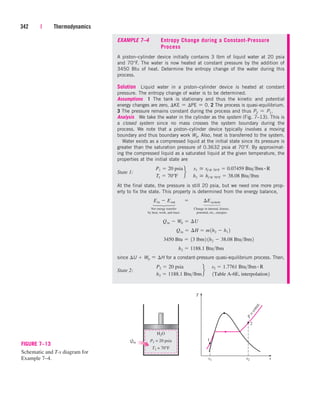
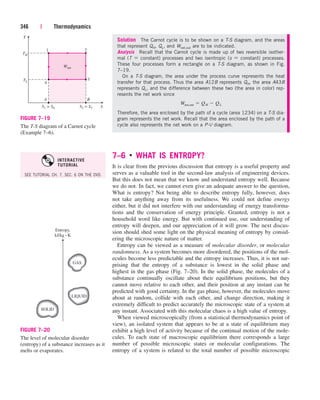
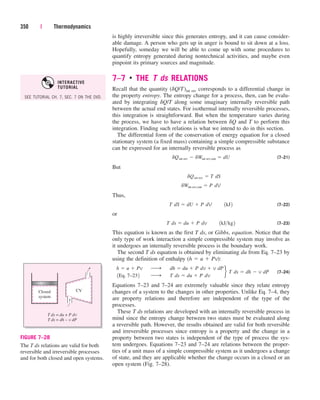
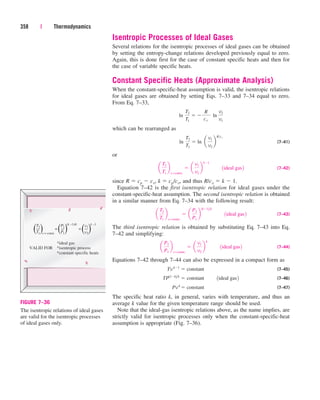
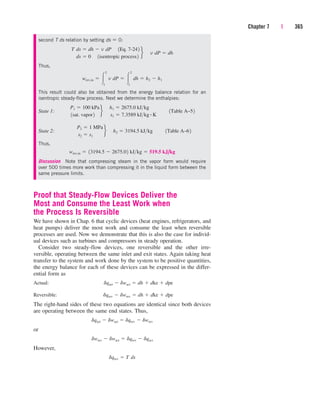
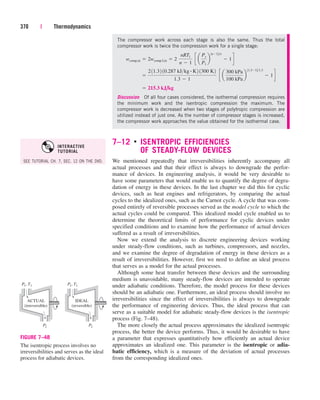
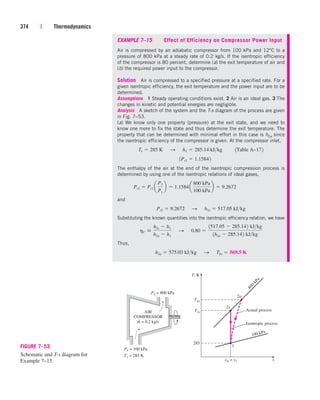
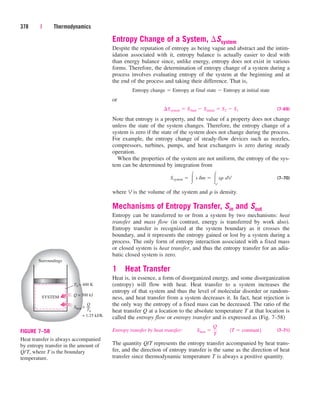
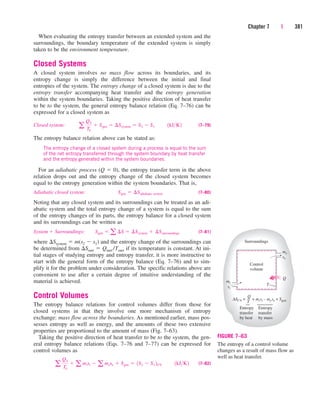
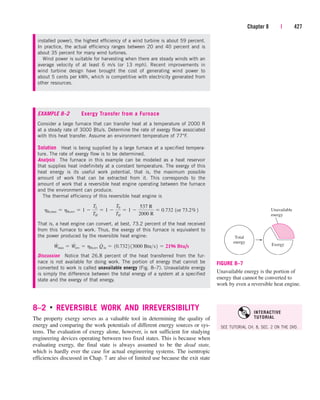
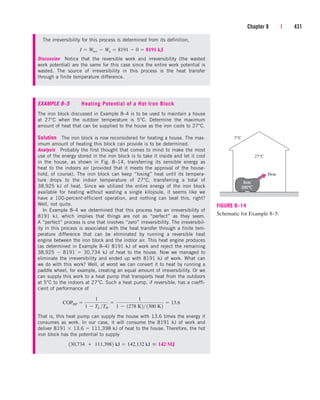
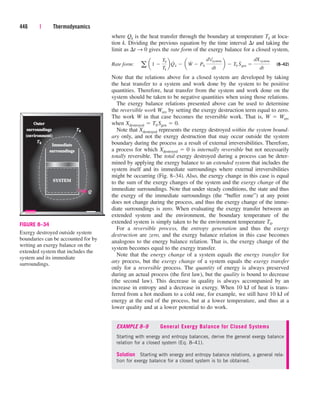
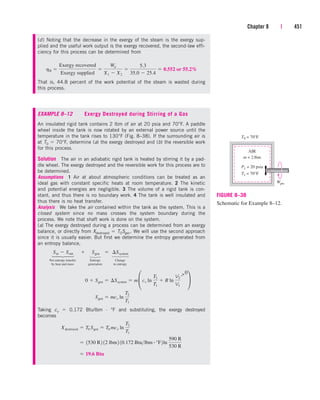
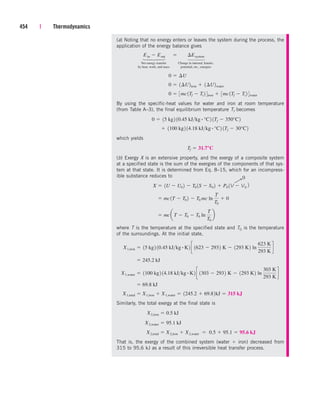
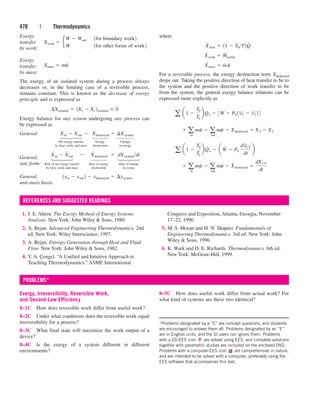
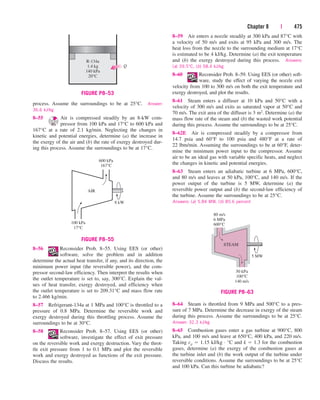
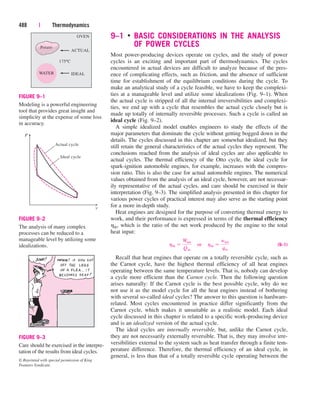
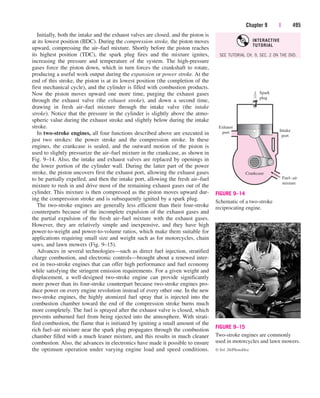
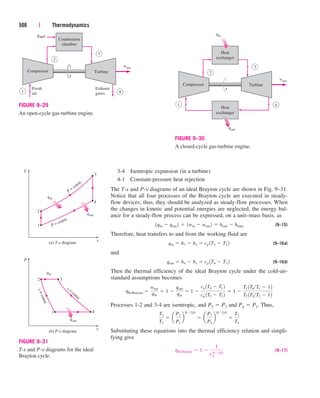
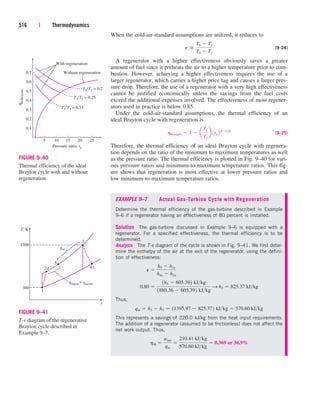
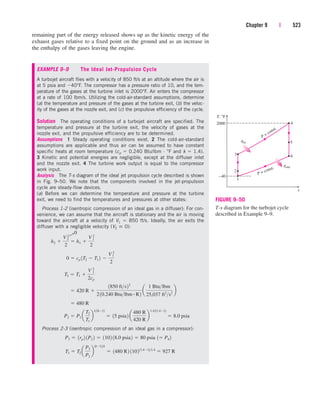
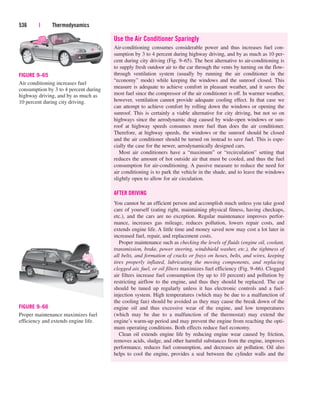
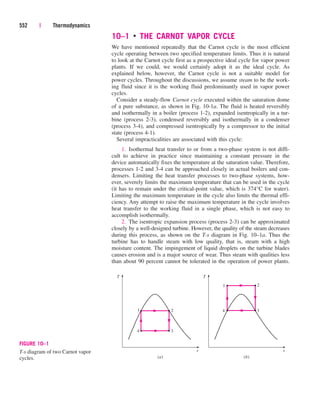
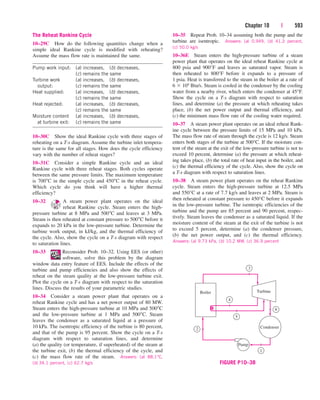
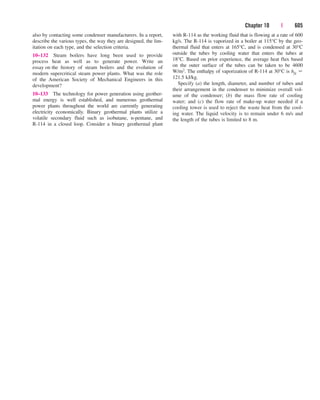
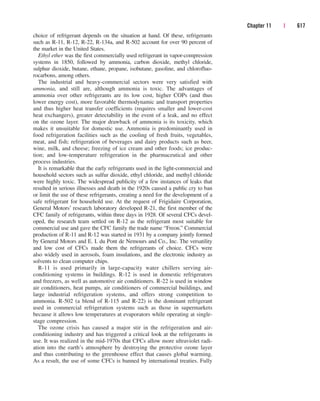
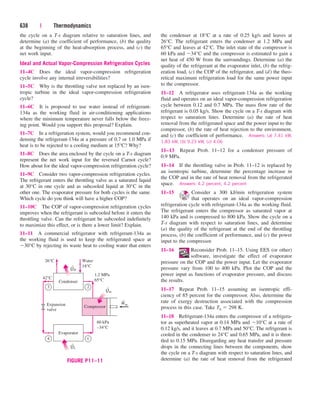
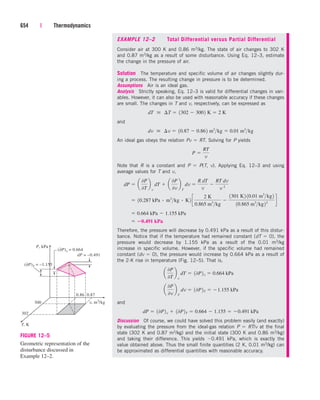
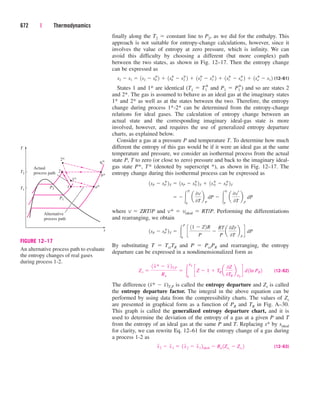
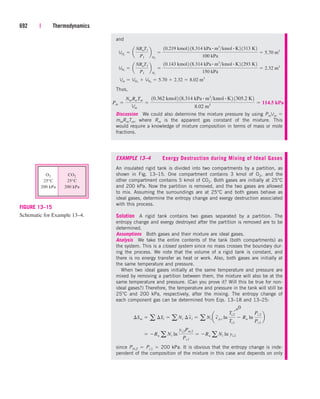
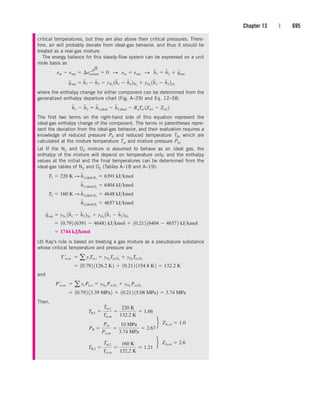
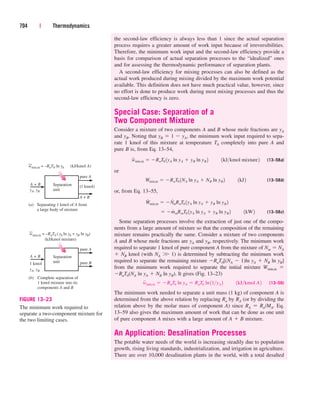
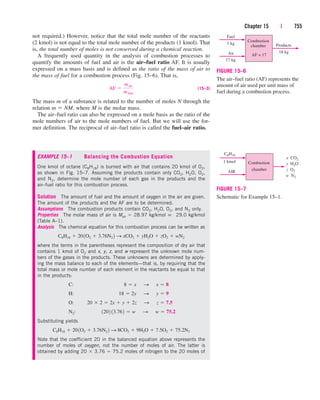
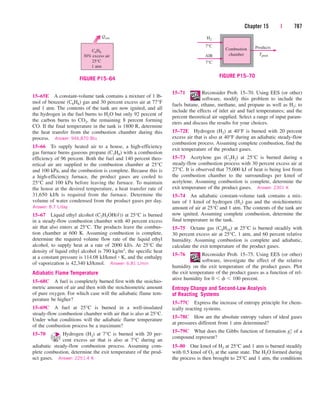
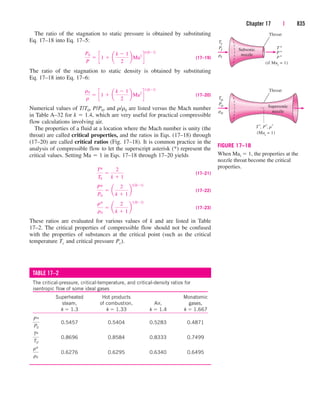
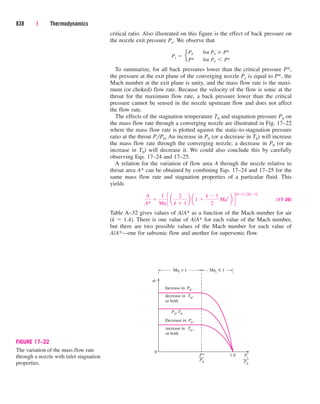
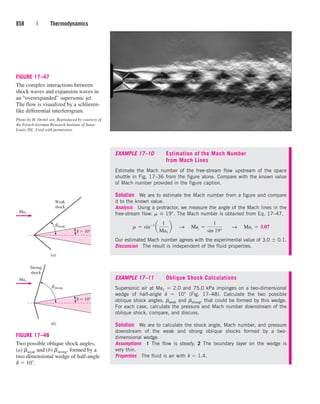
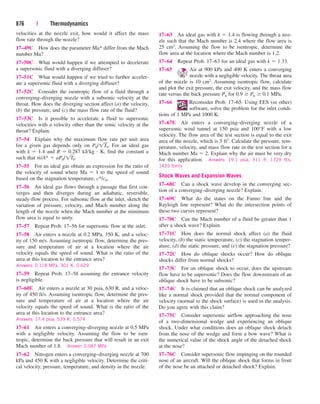
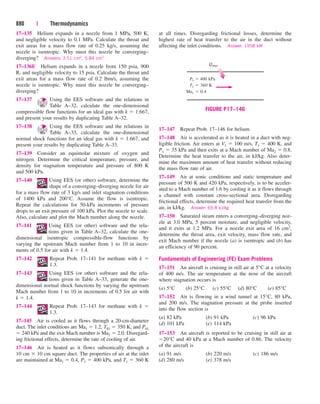
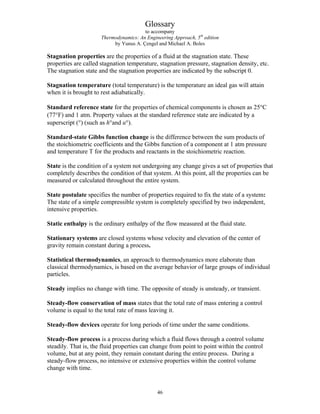
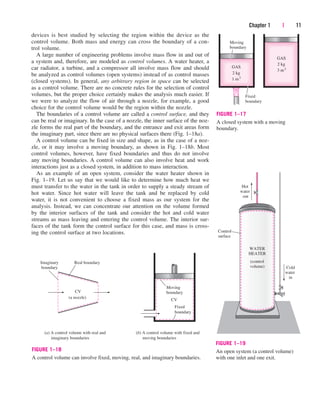
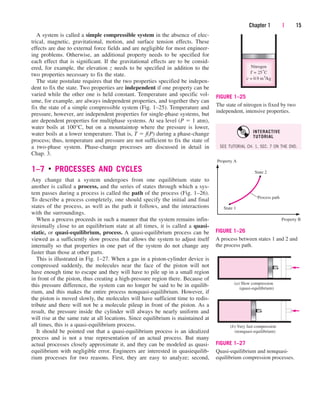
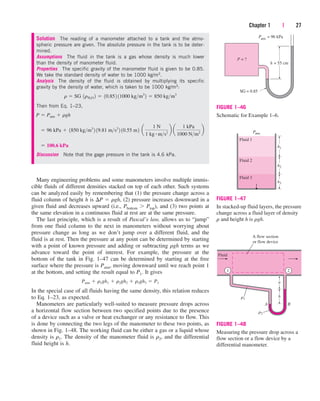
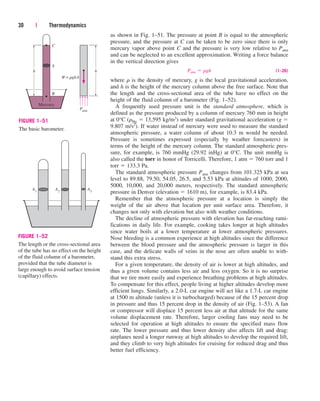
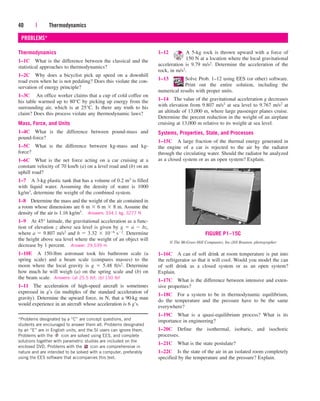
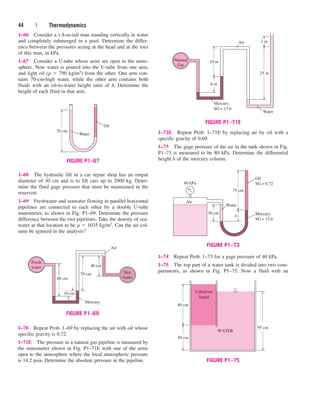
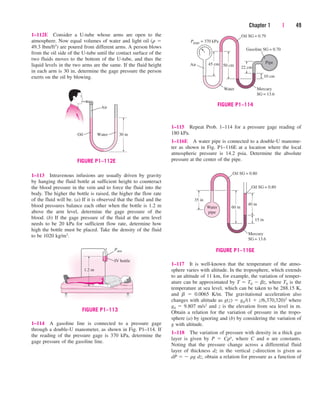
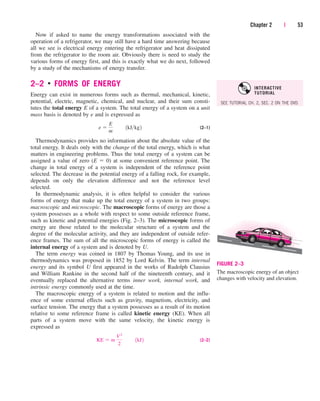
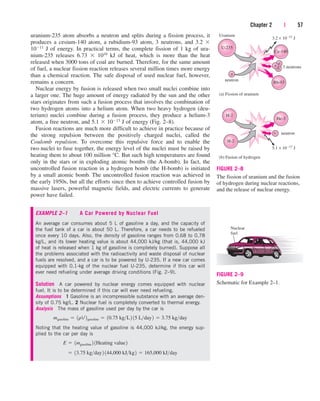
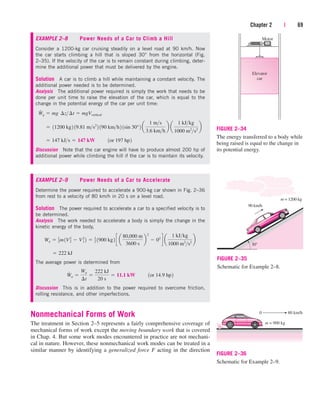
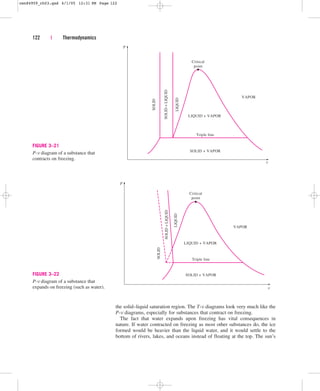
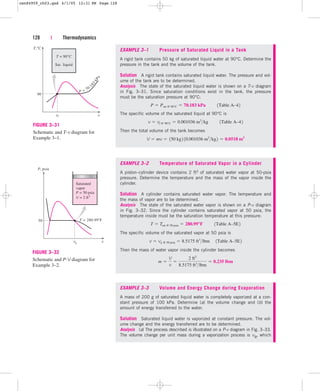
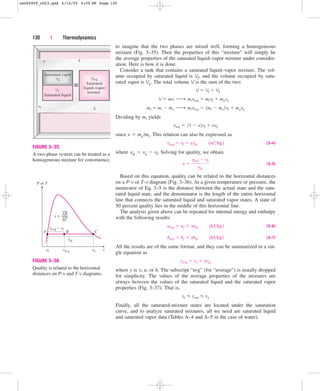
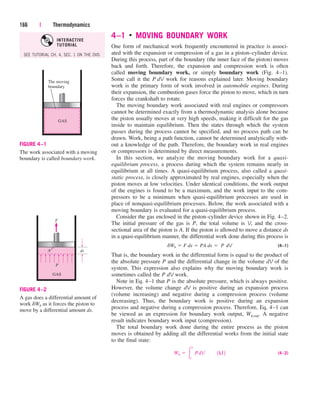
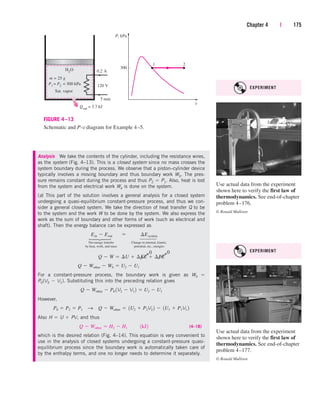
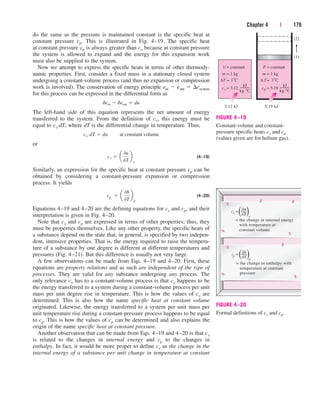
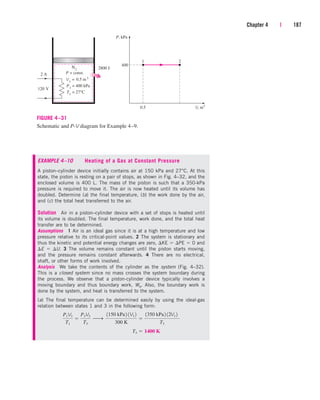
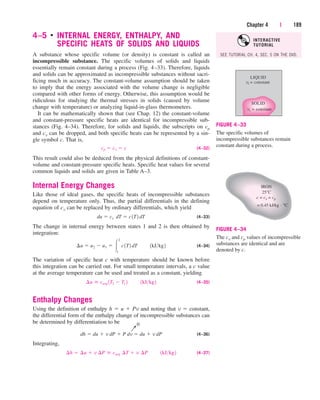
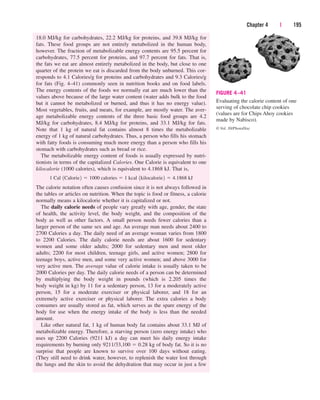
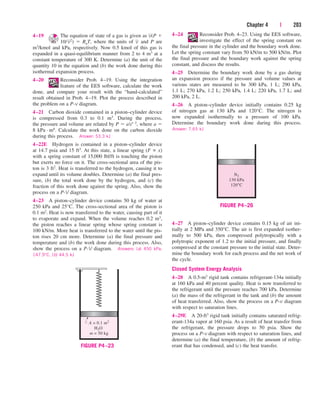
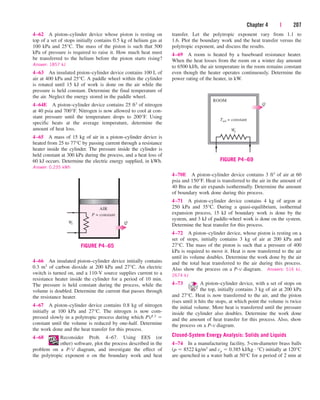
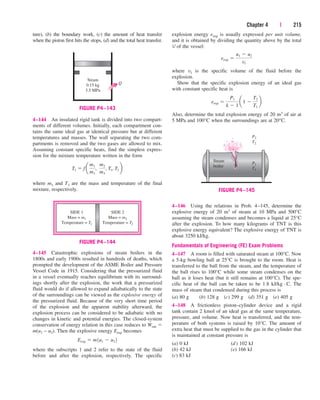
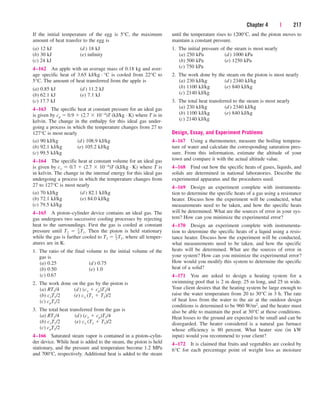
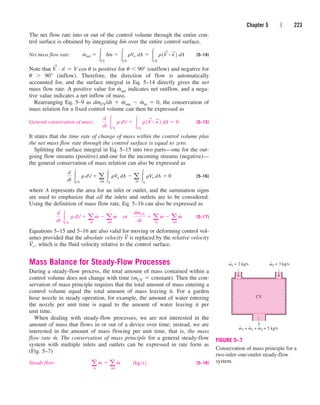
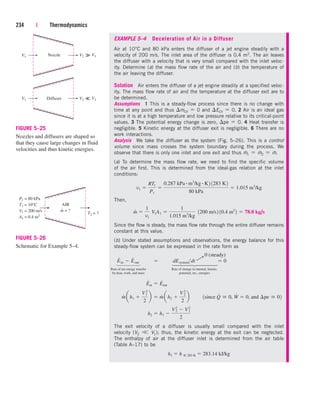
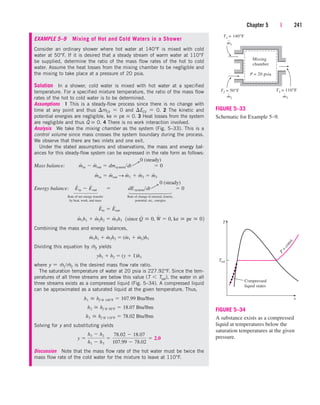
![Chapter 3 | 121
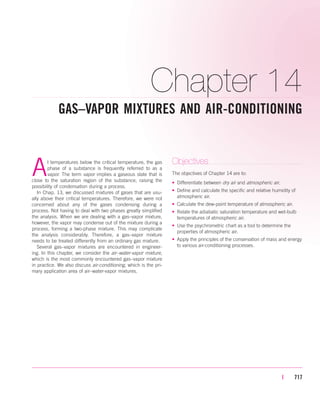
P
Critical
point
l
i
n
e
l
i
q
u
i
d
S
a
tu
r
a
te
d
l
i
n
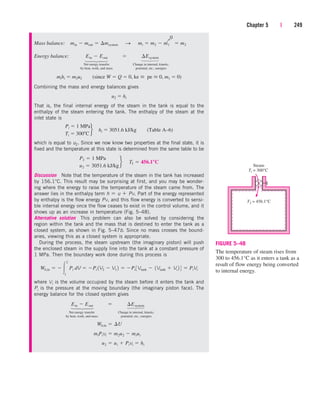
e
v
a
p
o
r
S
a
t
u
r
a
t
e
d
T2 = const. T1
T1 = const.
COMPRESSED
LIQUID
REGION
SATURATED
LIQUID–VAPOR
REGION
SUPERHEATED
VAPOR
REGION
v
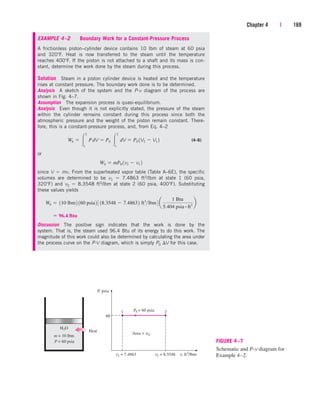
FIGURE 3–19
P-v diagram of a pure substance.
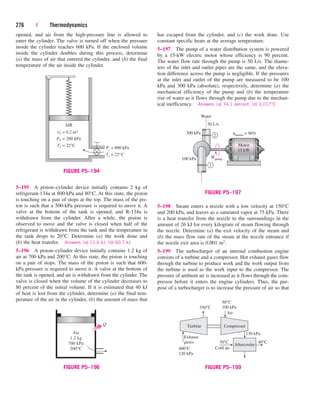
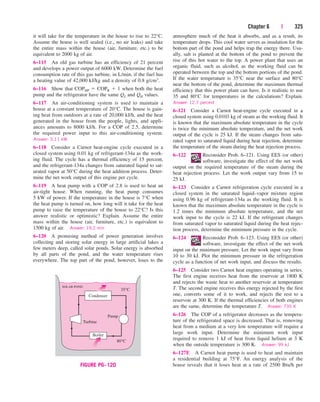
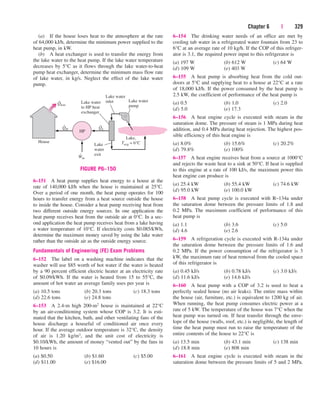
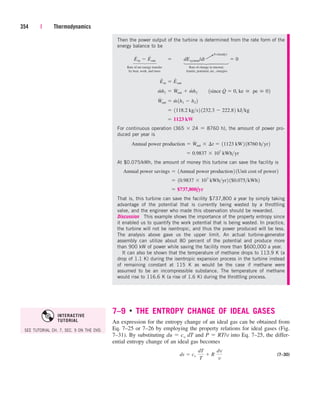
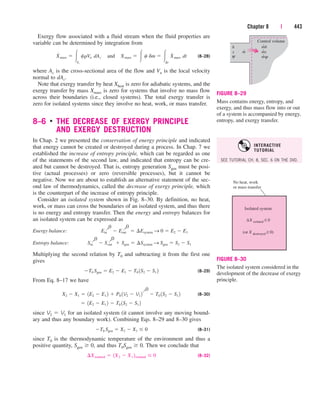
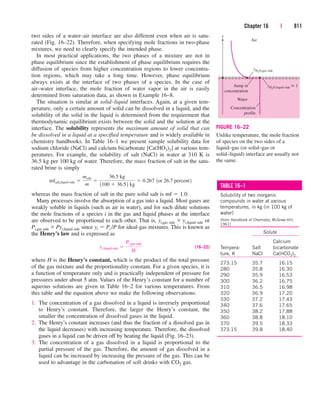
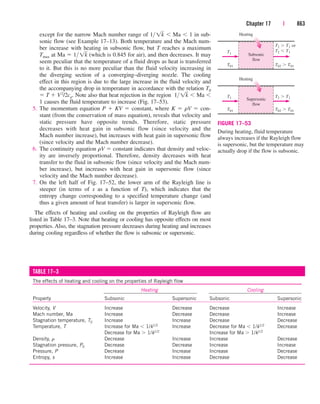
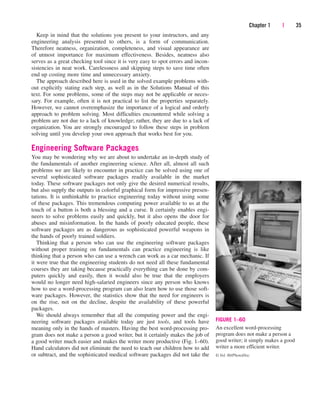
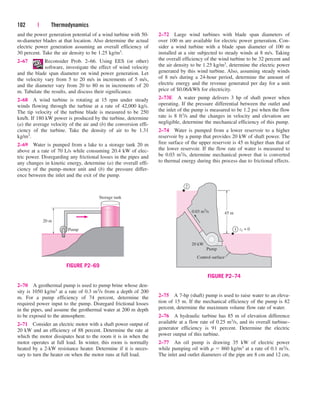
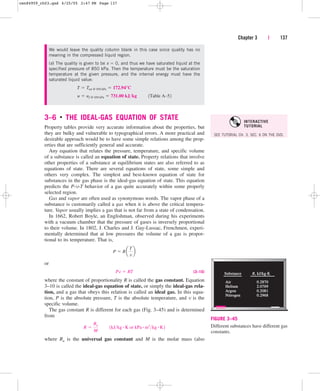
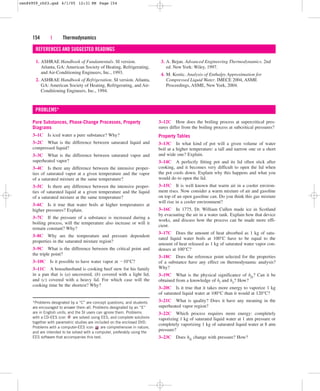
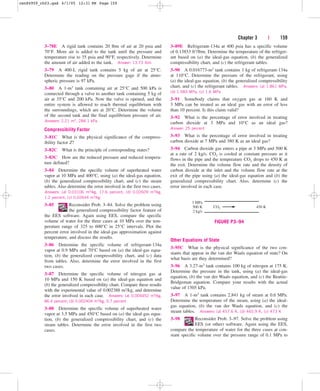
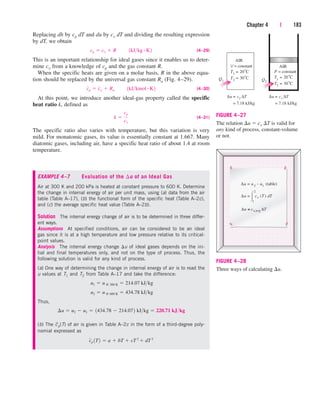
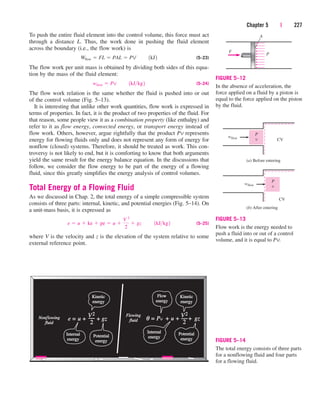
the pressure decreases, the volume of the water increases slightly. When the
pressure reaches the saturation-pressure value at the specified temperature
(0.4762 MPa), the water starts to boil. During this vaporization process,
both the temperature and the pressure remain constant, but the specific vol-
ume increases. Once the last drop of liquid is vaporized, further reduction in
pressure results in a further increase in specific volume. Notice that during
the phase-change process, we did not remove any weights. Doing so would
cause the pressure and therefore the temperature to drop [since Tsat
f (Psat)], and the process would no longer be isothermal.
When the process is repeated for other temperatures, similar paths are
obtained for the phase-change processes. Connecting the saturated liquid
and the saturated vapor states by a curve, we obtain the P-v diagram of a
pure substance, as shown in Fig. 3–19.
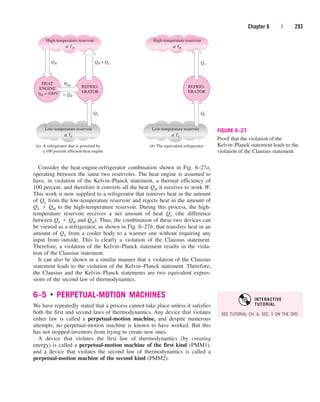
Extending the Diagrams to Include
the Solid Phase
The two equilibrium diagrams developed so far represent the equilibrium
states involving the liquid and the vapor phases only. However, these dia-
grams can easily be extended to include the solid phase as well as the
solid–liquid and the solid–vapor saturation regions. The basic principles dis-
cussed in conjunction with the liquid–vapor phase-change process apply
equally to the solid–liquid and solid–vapor phase-change processes. Most
substances contract during a solidification (i.e., freezing) process. Others,
like water, expand as they freeze. The P-v diagrams for both groups of sub-
stances are given in Figs. 3–21 and 3–22. These two diagrams differ only in
Heat
P = 1 MPa
T = 150°C
FIGURE 3–20
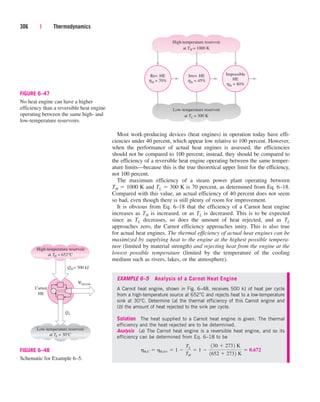
The pressure in a piston–cylinder
device can be reduced by reducing the
weight of the piston.
cen84959_ch03.qxd 4/1/05 12:31 PM Page 121](https://image.slidesharecdn.com/engineeringthermodynamics-230915082801-f5cce7d4/85/Engineering-Thermodynamics-pdf-201-320.jpg)
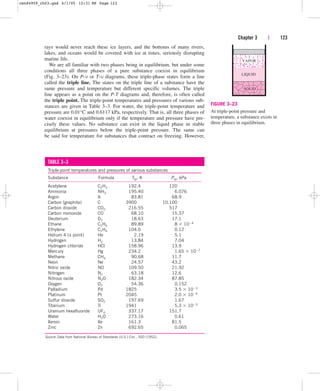
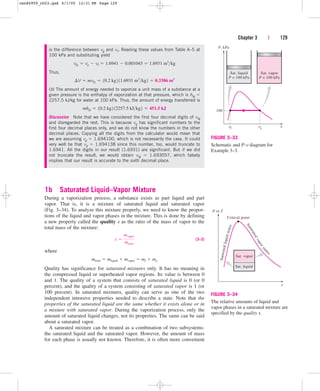
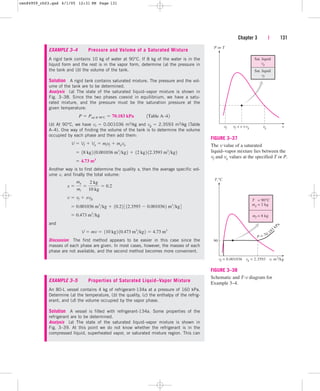
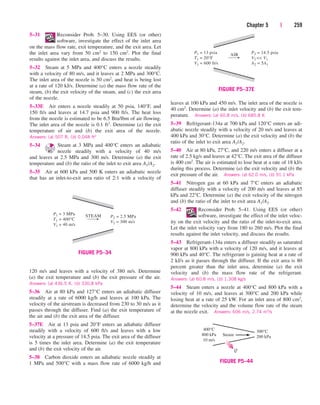
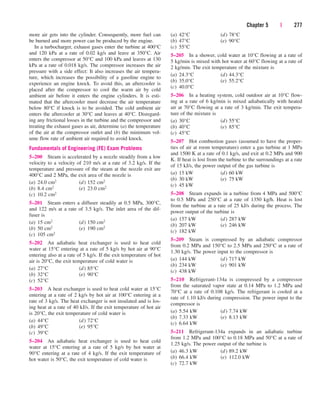
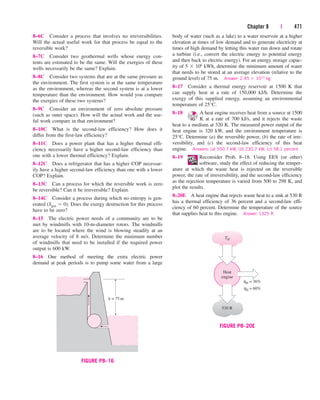
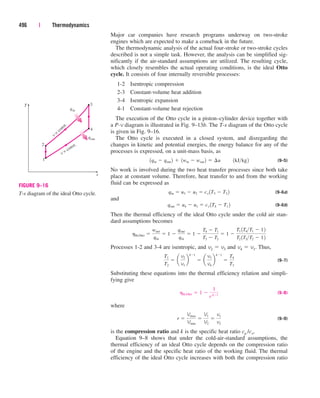
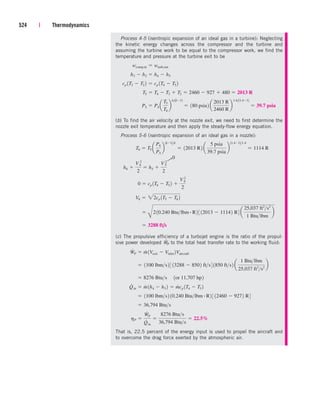
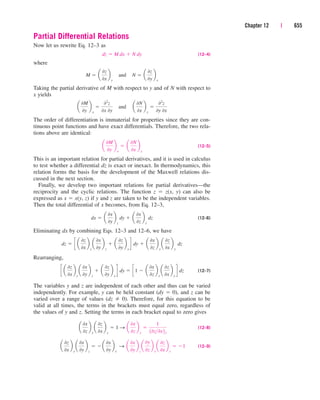
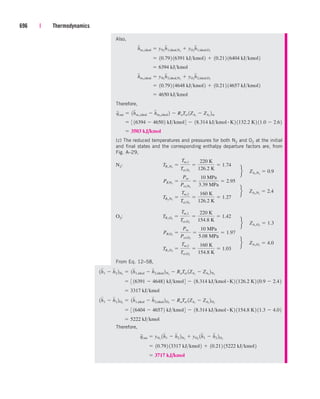
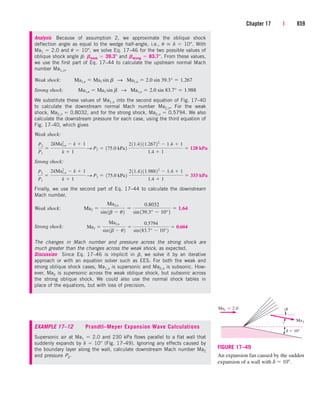
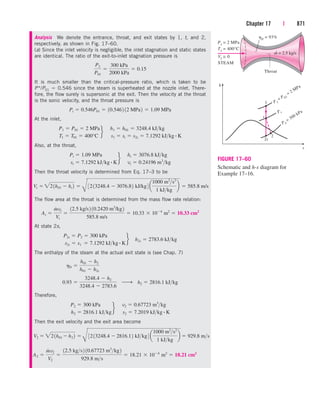
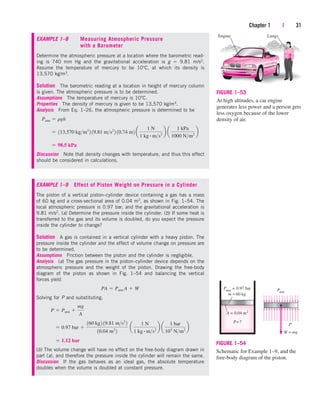
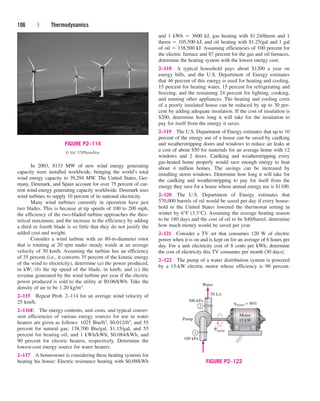
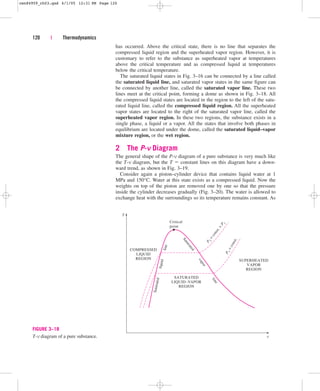
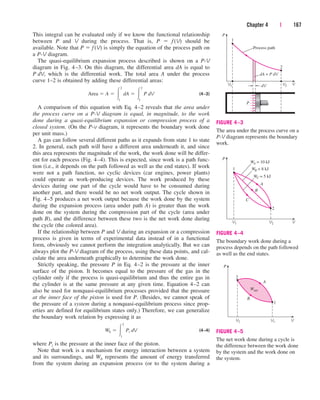
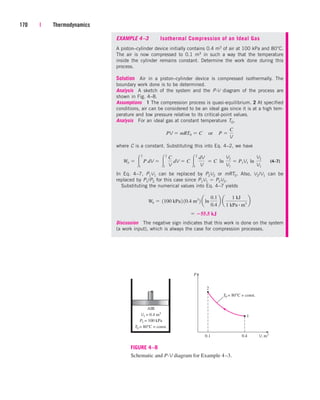
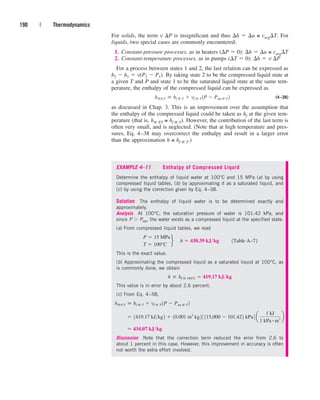
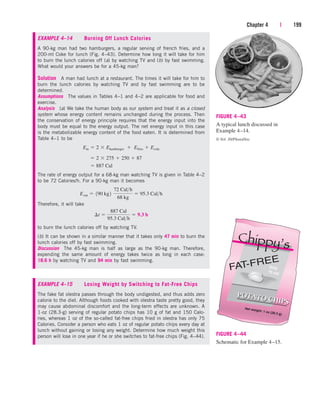
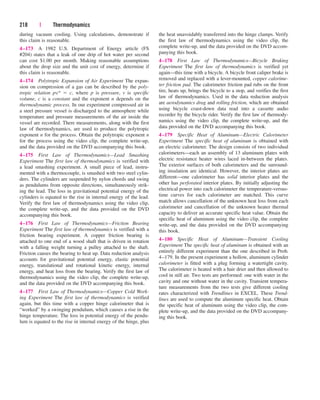
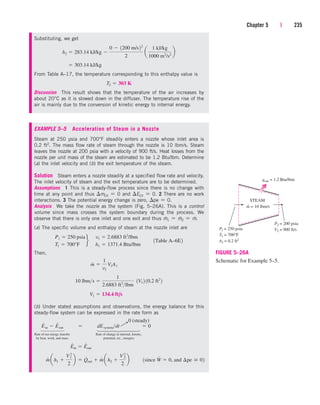
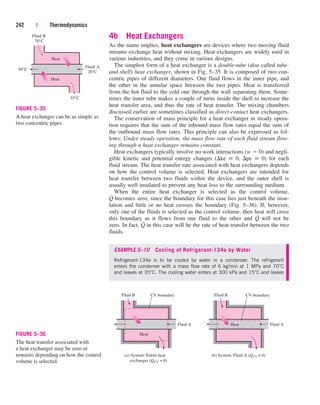
![It can also be expressed as
(3–19)
where videal RT/P. Obviously, Z 1 for ideal gases. For real gases Z can
be greater than or less than unity (Fig. 3–50). The farther away Z is from
unity, the more the gas deviates from ideal-gas behavior.
We have said that gases follow the ideal-gas equation closely at low pres-
sures and high temperatures. But what exactly constitutes low pressure or
high temperature? Is 100°C a low temperature? It definitely is for most
substances but not for air. Air (or nitrogen) can be treated as an ideal gas at
this temperature and atmospheric pressure with an error under 1 percent.
This is because nitrogen is well over its critical temperature (147°C) and
away from the saturation region. At this temperature and pressure, however,
most substances would exist in the solid phase. Therefore, the pressure or
temperature of a substance is high or low relative to its critical temperature
or pressure.
Z
vactual
videal
140 | Thermodynamics
Z
Z = 1 Z
1
= 1
1
IDEAL
GAS
REAL
GASES
FIGURE 3–50
The compressibility factor is unity for
ideal gases.
v, m3
/kg
T, °C
0
100
200
300
400
500
600
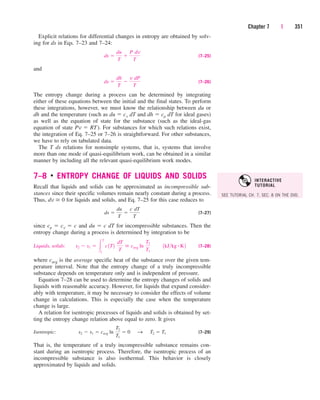
100
10
1
0.1
0.01
0.001
0.0
0.0
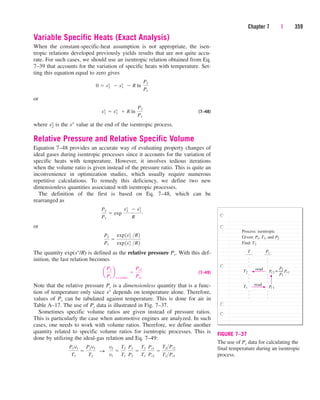
1.6
0.0
0.0
0.5
0.0
0.0
0.2
0.0
0.0
0.1
0.0
0.0
0.1
0.0
0.0
0.5
2.4
5.0
10.8
17.3
0.8
4.1
20.8
37.1
8.8
1.3
7.4
17.6
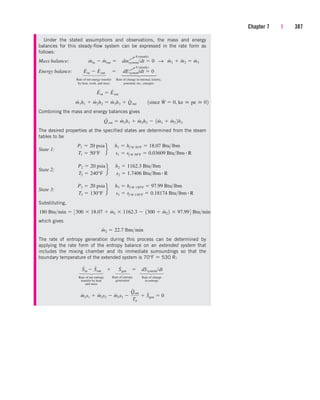
271.0
56.2
2.6
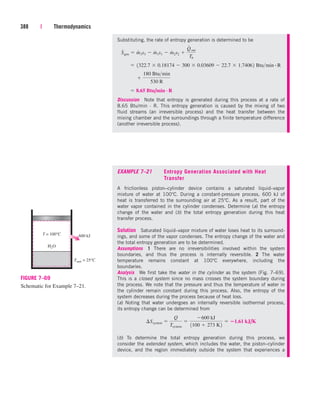
16.7
152.7
49.5
25.7
6.0
0.0
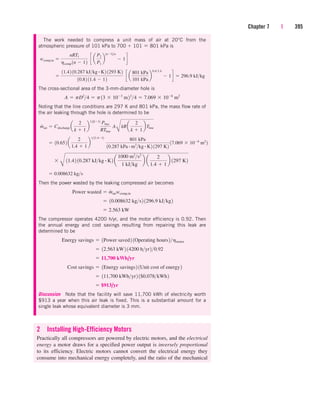
20 MPa
10 MPa
5 MPa
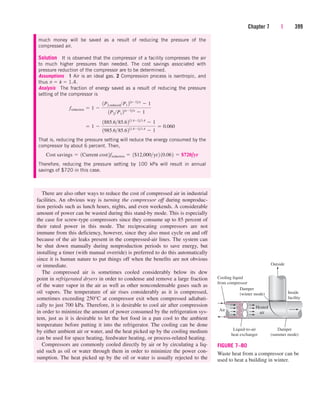
1 MPa
100 kPa
10 kPa
0.8 kPa
0.1
7.6
3
0
M
P
a
I D E A L G A S
0.0
FIGURE 3–49
Percentage of error
([|vtable videal|/vtable] 100)
involved in assuming steam to be an
ideal gas, and the region where
steam can be treated as an ideal gas
with less than 1 percent error.
cen84959_ch03.qxd 4/1/05 12:31 PM Page 140](https://image.slidesharecdn.com/engineeringthermodynamics-230915082801-f5cce7d4/85/Engineering-Thermodynamics-pdf-220-320.jpg)
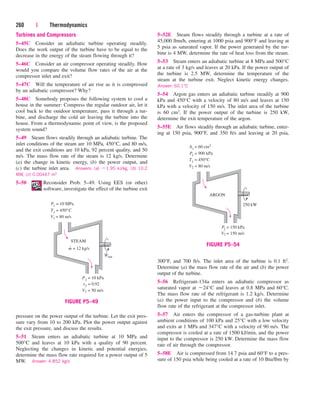
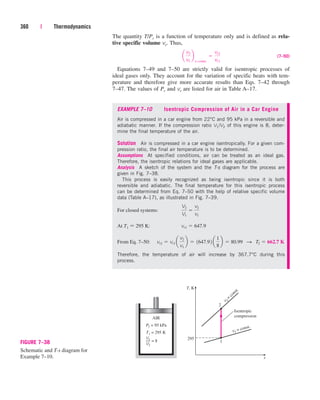
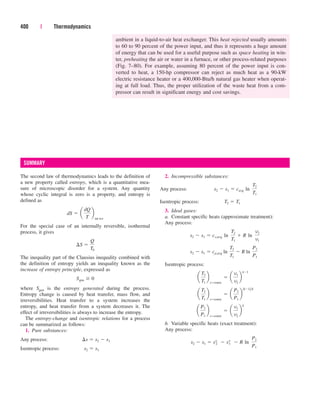
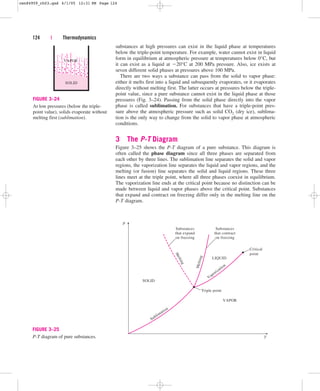
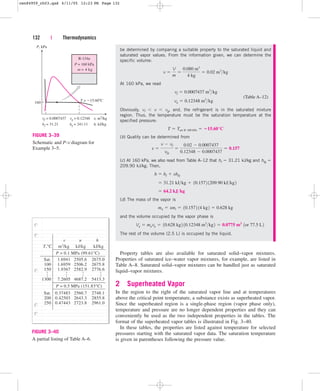
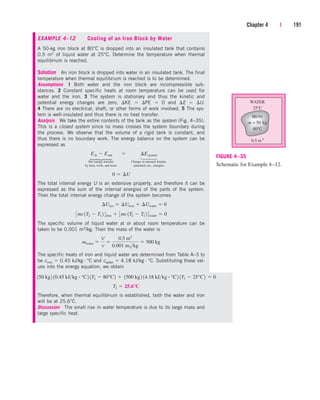
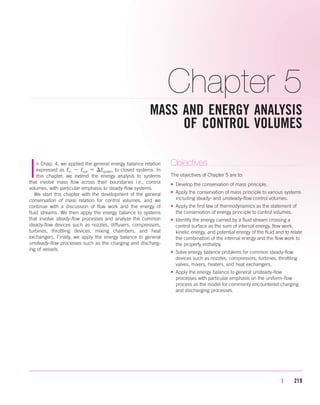
![Beattie-Bridgeman, and Benedict-Webb-Rubin equations of state is illus-
trated in Fig. 3–60. It is apparent from this figure that the Benedict-Webb-
Rubin equation of state is usually the most accurate.
Chapter 3 | 147
v, m3
/kmol
T, K
300
200
100
0
100
10
1
0.1
0.01
20.7%
14.1%
2.1%
11.6%
6.3%
1.2%
3.2%
0.1%
1.0%
0.4%
0.1%
0.4%
0.1%
0.0%
0.2%
0.0%
0.0%
0.0%
0.0%
0.0%
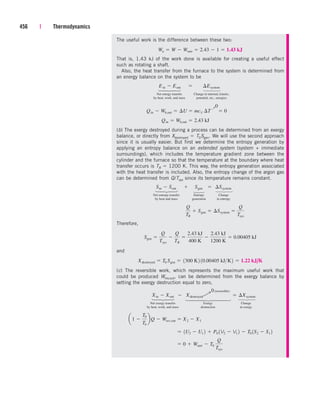
0.0%
0.0%
0.0%
0.0%
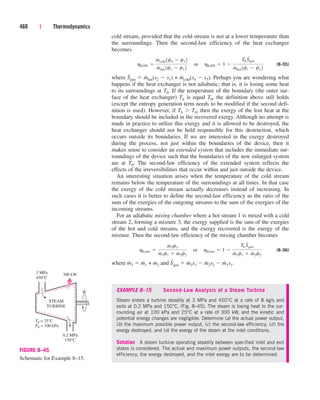
5.7%
59.3%
18.7%
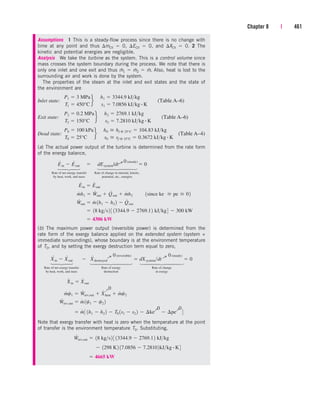
15.2%
74.5%
51.0%
7.9%
0.7%
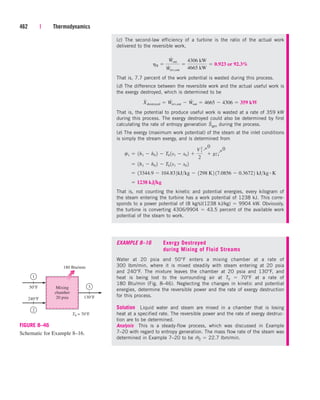
5.2%
5.2%
0.6%
3.7%
3.3%
0.4%
2.5% 1.6%
0.2%
1.3%
0.8%
0.1%
0.8%
0.4%
0.1%
0.3%
100%
100%
100%
0.9%
0.1%
0.1%
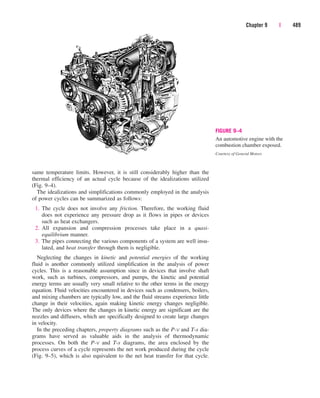
0.4%
0.1%
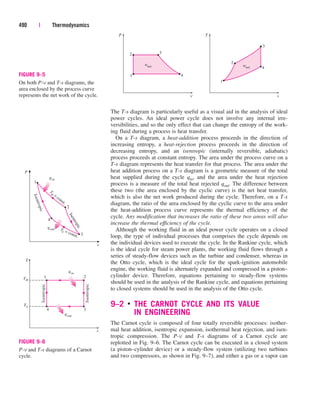
0.1%
0
.1
M
P
a
0
.2
M
P
a
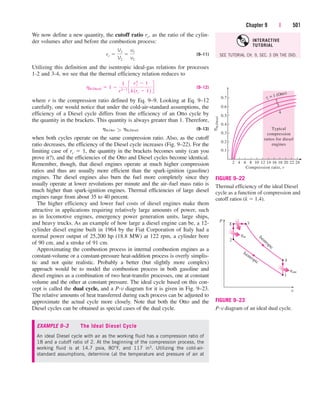
1
M
P
a
2
M
P
a
4
M
P
a
1
0
M
P
a
2
0
M
P
a
0
.
0
1
2
5
M
P
a
0.0%
0.0%
0.0%
0.0%
0.0%
0.0%
0.1%
0.0%
0.0%
0.5%
0.0%
0.0%
1.0%
0.1%
0.1%
1.9%
0.1%
0.1%
4.2%
0.1%
0.2%
4.7%
0.2%
0.2%
0.1%
0.0%
0.0%
0.1%
0.0%
0.0%
0.5%
0.0%
0.0%
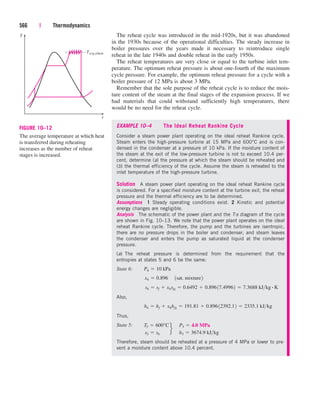
0.5%
0.1%
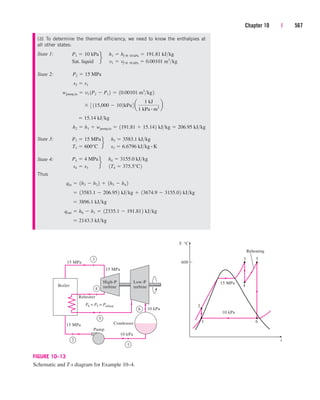
0.0%
1.1%
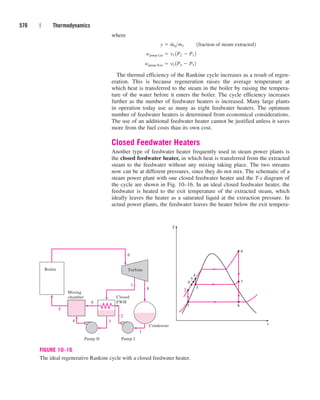
0.1%
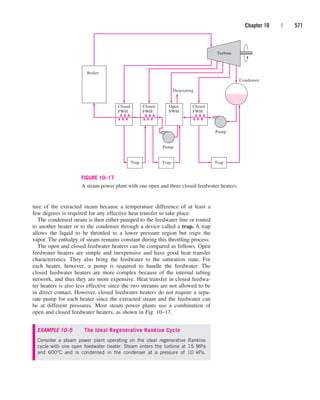
0.0%
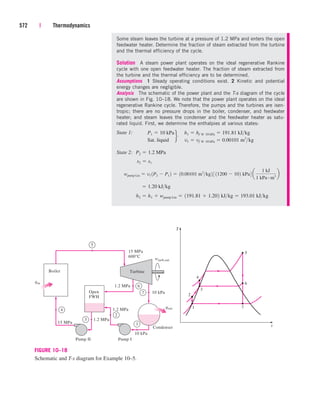
2.3%
0.1%
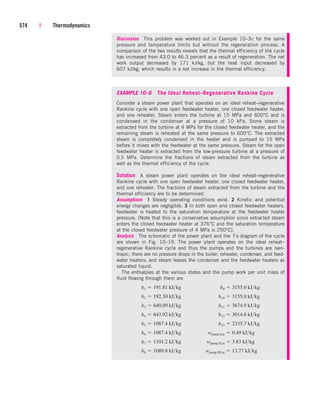
0.0%
5.3%
0.1%
0.1%
3.7%
0.1%
0.4%
1.2%
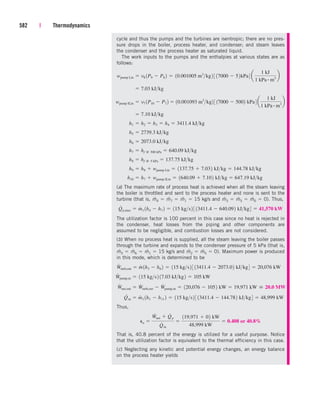
0.1%
0.1%
2.8%
0.1%
0.1%
6.7%
0.7%
0.1%
2.9%
0.3%
0.7%
Van der Waals (top)
Beattie-Bridgeman (middle)
Benedict-Webb-Rubin (bottom)
FIGURE 3–60
Percentage of error involved in various equations of state for nitrogen (% error [(|vtable vequation|)/vtable] 100).
EXAMPLE 3–13 Different Methods of Evaluating Gas Pressure
Predict the pressure of nitrogen gas at T 175 K and v 0.00375 m3/kg
on the basis of (a) the ideal-gas equation of state, (b) the van der Waals
equation of state, (c) the Beattie-Bridgeman equation of state, and (d) the
Benedict-Webb-Rubin equation of state. Compare the values obtained to the
experimentally determined value of 10,000 kPa.
Solution The pressure of nitrogen gas is to be determined using four differ-
ent equations of state.
cen84959_ch03.qxd 4/1/05 12:31 PM Page 147](https://image.slidesharecdn.com/engineeringthermodynamics-230915082801-f5cce7d4/85/Engineering-Thermodynamics-pdf-227-320.jpg)
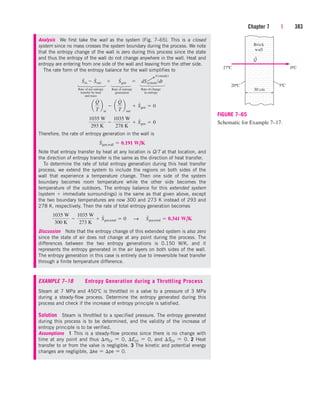
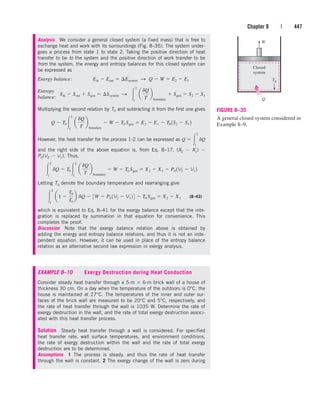
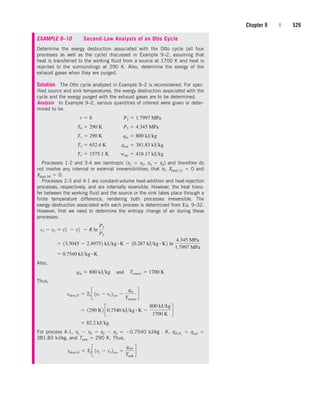
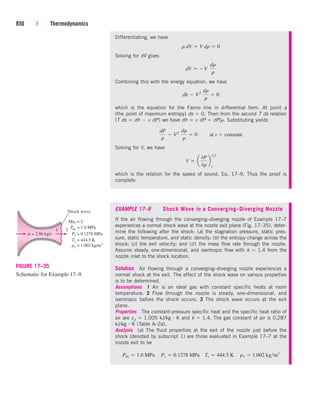
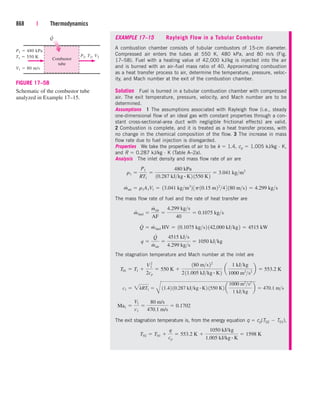
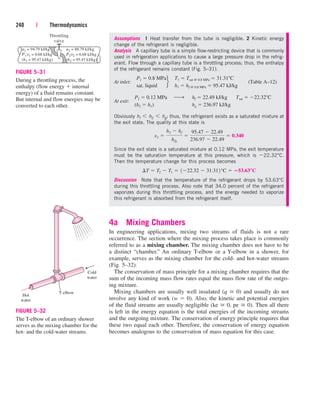
![238 | Thermodynamics
Analysis We take the turbine as the system. This is a control volume since
mass crosses the system boundary during the process. We observe that there
is only one inlet and one exit and thus m
.
1 m
.
2 m
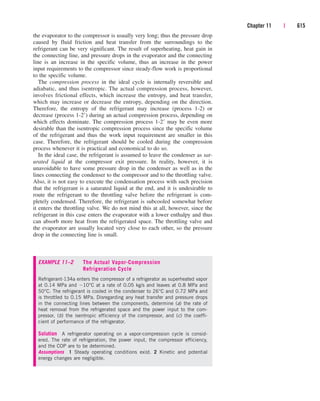
.
. Also, work is done by
the system. The inlet and exit velocities and elevations are given, and thus
the kinetic and potential energies are to be considered.
(a) At the inlet, steam is in a superheated vapor state, and its enthalpy is
At the turbine exit, we obviously have a saturated liquid–vapor mixture at
15-kPa pressure. The enthalpy at this state is
Then
(b) The energy balance for this steady-flow system can be expressed in the
rate form as
Rate of net energy transfer Rate of change in internal, kinetic,
by heat, work, and mass potential, etc., energies
Dividing by the mass flow rate m
.
and substituting, the work done by the turbine
per unit mass of the steam is determined to be
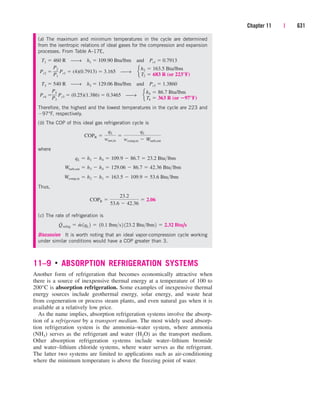
(c) The required mass flow rate for a 5-MW power output is
Discussion Two observations can be made from these results. First, the
change in potential energy is insignificant in comparison to the changes in
enthalpy and kinetic energy. This is typical for most engineering devices.
Second, as a result of low pressure and thus high specific volume, the steam
velocity at the turbine exit can be very high. Yet the change in kinetic energy
is a small fraction of the change in enthalpy (less than 2 percent in our
case) and is therefore often neglected.
m
#
W
#
out
wout
5000 kJ/s
872.48 kJ/kg
5.73 kg/s
[887.39 14.95 0.04] kJ/kg 872.48 kJ/kg
wout c 1h2 h1 2
V 2
2
V 1
2
2
g1z2 z1 2 d 1¢h ¢ke ¢pe2
m
#
ah1
V1
2
2
gz1 b W
#
out m
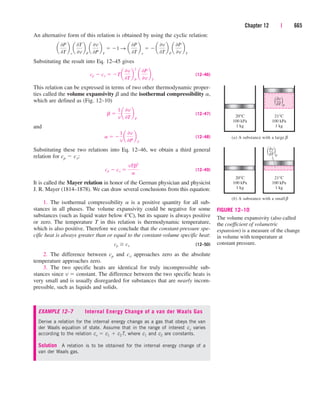
#
ah2
V2
2
2
gz2 b ¬¬1since Q
#
02
E
#
in E
#
out
E
#
in E
#
out dEsystemdt 0
¢pe g1z2 z1 2 19.81 ms2
2 3 16 102 m4 a
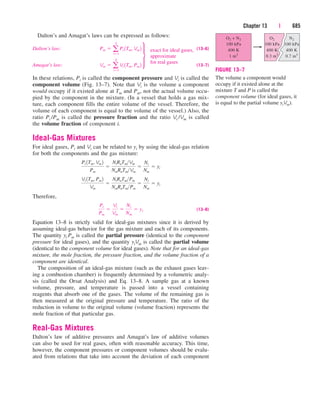
1 kJkg
1000 m2
s2
b 0.04 kJ/kg
¢ke
V2
2 V2
1
2
1180 ms22
150 ms22
2
¬a
1 kJkg
1000 m2
s2
b 14.95 kJ/kg
¢h h2 h1 12361.01 3248.42 kJkg 887.39 kJ/kg
h2 hf x2hfg [225.94 (0.9)(2372.3)] kJ/kg 2361.01 kJ/kg
P1 2 MPa
T1 400 C
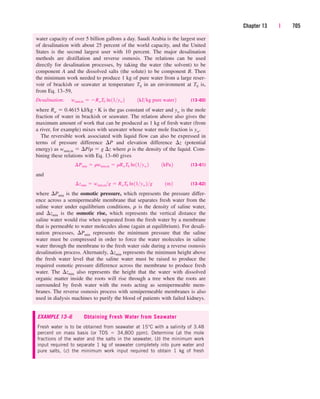
f h1 3248.4 kJ/kg (Table A–6)
0 (steady)
¡
⎫
⎪
⎪
⎪
⎬
⎪
⎪
⎪
⎭
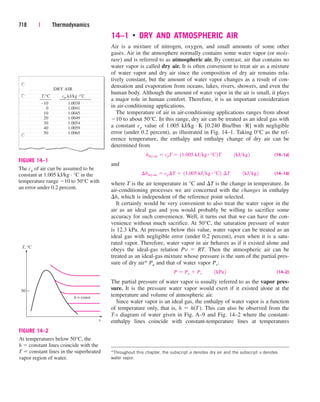
⎫
⎪
⎪
⎬
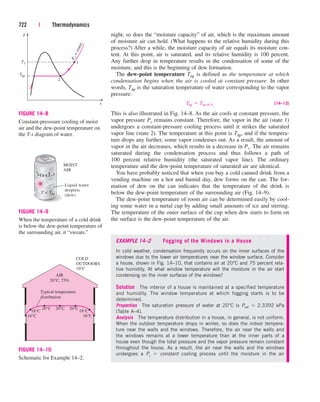
⎪
⎪
⎭
cen84959_ch05.qxd 4/25/05 3:00 PM Page 238](https://image.slidesharecdn.com/engineeringthermodynamics-230915082801-f5cce7d4/85/Engineering-Thermodynamics-pdf-318-320.jpg)
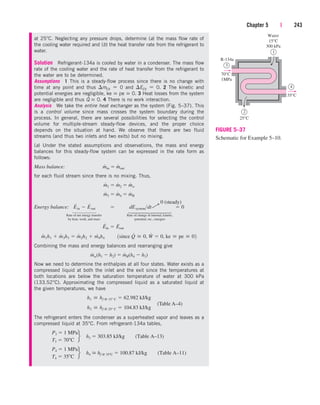
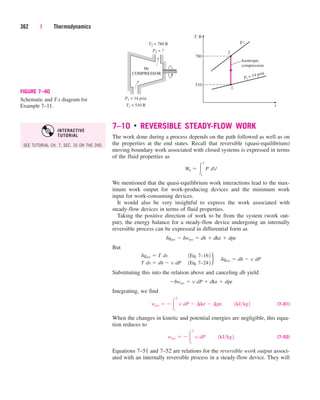
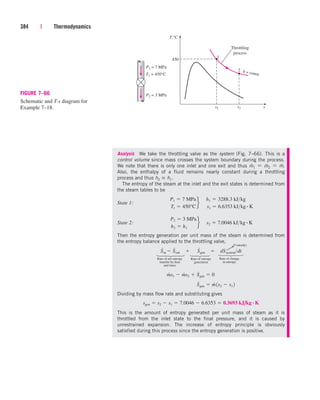
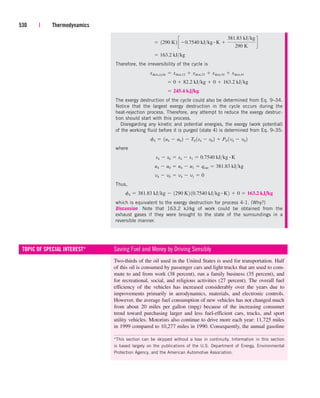
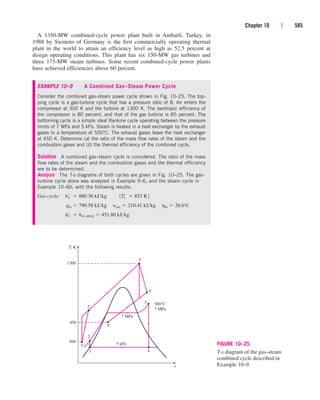
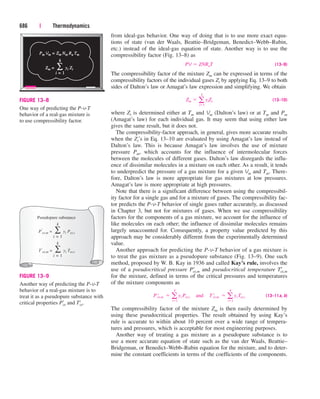
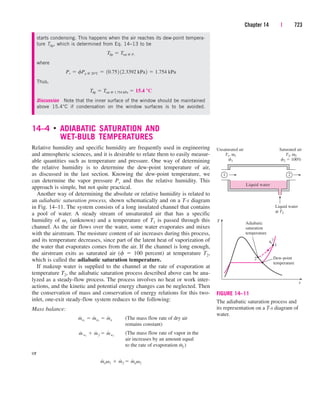
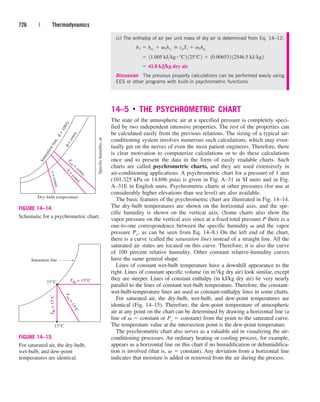
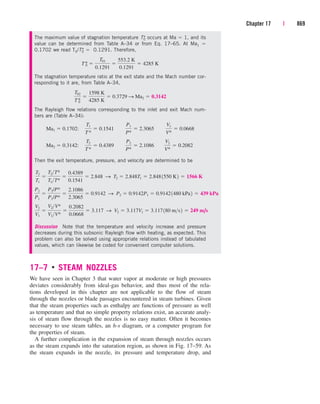
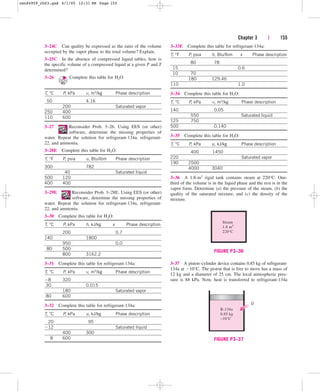
![Substituting, we find
(b) To determine the heat transfer from the refrigerant to the water, we have
to choose a control volume whose boundary lies on the path of heat transfer.
We can choose the volume occupied by either fluid as our control volume.
For no particular reason, we choose the volume occupied by the water. All
the assumptions stated earlier apply, except that the heat transfer is no
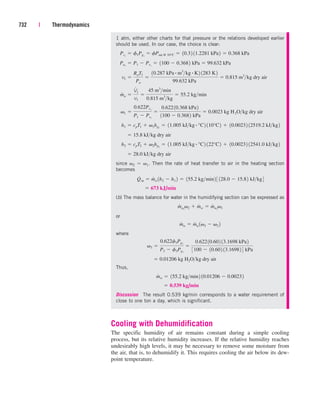
longer zero. Then assuming heat to be transferred to water, the energy bal-
ance for this single-stream steady-flow system reduces to
Rate of net energy transfer Rate of change in internal, kinetic,
by heat, work, and mass potential, etc., energies
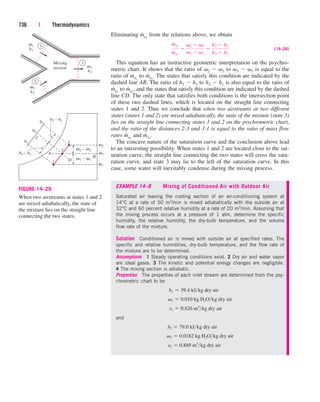
Rearranging and substituting,
Discussion Had we chosen the volume occupied by the refrigerant as the
control volume (Fig. 5–38), we would have obtained the same result for Q
.
R,out
since the heat gained by the water is equal to the heat lost by the refrigerant.
5 Pipe and Duct Flow
The transport of liquids or gases in pipes and ducts is of great importance in
many engineering applications. Flow through a pipe or a duct usually satis-
fies the steady-flow conditions and thus can be analyzed as a steady-flow
process. This, of course, excludes the transient start-up and shut-down peri-
ods. The control volume can be selected to coincide with the interior surfaces
of the portion of the pipe or the duct that we are interested in analyzing.
Under normal operating conditions, the amount of heat gained or lost by
the fluid may be very significant, particularly if the pipe or duct is long
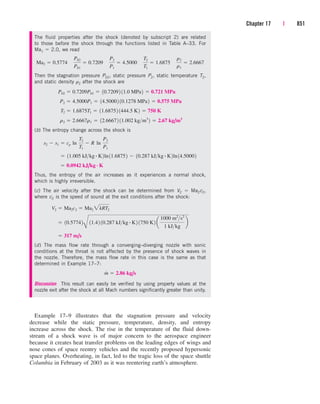
(Fig. 5–39). Sometimes heat transfer is desirable and is the sole purpose of
the flow. Water flow through the pipes in the furnace of a power plant, the
flow of refrigerant in a freezer, and the flow in heat exchangers are some
examples of this case. At other times, heat transfer is undesirable, and the
pipes or ducts are insulated to prevent any heat loss or gain, particularly
when the temperature difference between the flowing fluid and the sur-
roundings is large. Heat transfer in this case is negligible.
If the control volume involves a heating section (electric wires), a fan, or
a pump (shaft), the work interactions should be considered (Fig. 5–40). Of
these, fan work is usually small and often neglected in energy analysis.
¬ 1218 kJ/min
Q
#
w, in m
#
w 1h2 h1 2 129.1 kg/min2[1104.83 62.9822 kJ/kg]
Q
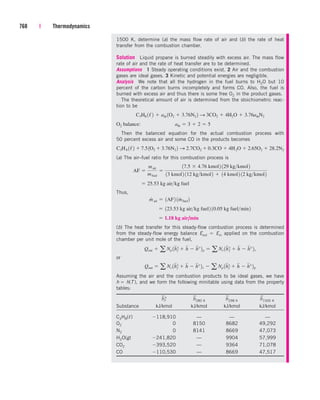
#
w, in m
#
wh1 m
#
wh2
E
#
in E
#
out
E
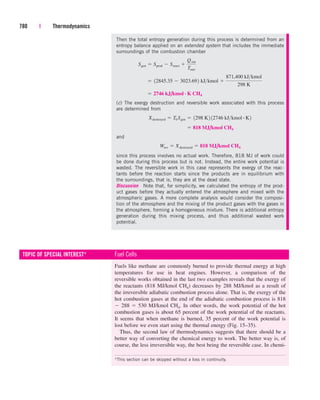
#
in E
#
out dEsystemdt 0
m
#
w 29.1 kg/min
m
#
w 162.982 104.832 kJ/kg 16 kg/min2[1100.87 303.852 kJ/kg]
244 | Thermodynamics
Q
.
.
w,in = QR,out
R-134a
Control volume
boundary
FIGURE 5–38
In a heat exchanger, the heat transfer
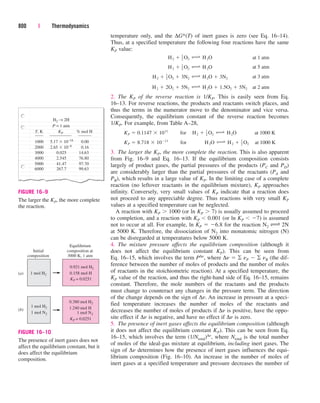
depends on the choice of the control
volume.
Surroundings 20°C
70°C
Hot fluid
Qout
.
FIGURE 5–39
Heat losses from a hot fluid flowing
through an uninsulated pipe or duct to
the cooler environment may be very
significant.
Control volume
Ẇe
Ẇsh
FIGURE 5–40
Pipe or duct flow may involve more
than one form of work at the same
time.
0 (steady)
¡
⎫
⎪
⎪
⎪
⎬
⎪
⎪
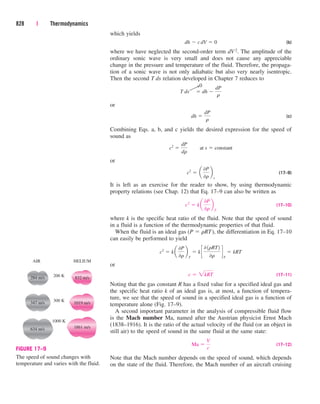
⎪
⎭
⎫
⎪
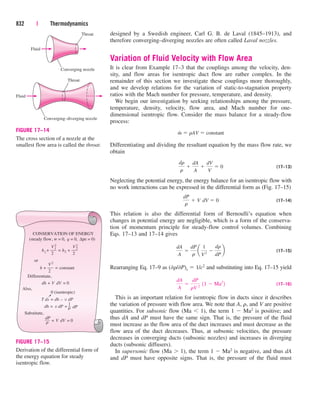
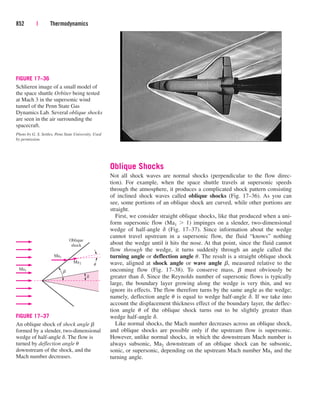
⎪
⎬
⎪
⎪
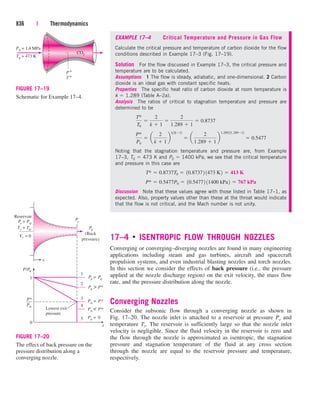
⎭
cen84959_ch05.qxd 4/25/05 3:01 PM Page 244](https://image.slidesharecdn.com/engineeringthermodynamics-230915082801-f5cce7d4/85/Engineering-Thermodynamics-pdf-324-320.jpg)