More Related Content
Similar to RestatementLIFO
Similar to RestatementLIFO (20)
RestatementLIFO
- 1. Restatement for Q4-07 LIFO Accounting Change
Unaudited
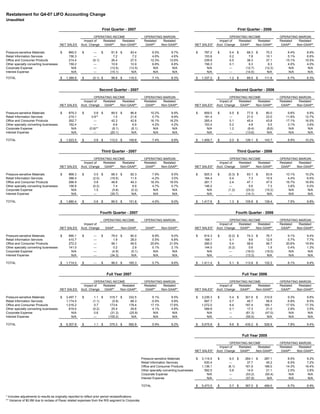
First Quarter - 2007 First Quarter - 2006
OPERATING INCOME OPERATING MARGIN OPERATING INCOME OPERATING MARGIN
Impact of Restated Restated Restated Restated Impact of Restated Restated Restated Restated
NET SALES Acct. Change GAAP* Non-GAAP* GAAP* Non-GAAP* NET SALES* Acct. Change GAAP* Non-GAAP* GAAP* Non-GAAP*
Pressure-sensitive Materials $ 860.0 $ --- $ 81.9 $ 83.4 9.5% 9.7% $ 787.2 $ 0.4 $ 66.3 $ 70.3 8.4% 8.9%
Retail Information Services 156.3 --- 7.2 7.2 4.6% 4.6% 153.8 0.2 7.8 10.1 5.1% 6.6%
Office and Consumer Products 214.4 (0.1) 26.4 27.0 12.3% 12.6% 239.9 0.5 36.3 37.1 15.1% 15.5%
Other specialty converting businesses 159.2 --- 10.9 10.9 6.8% 6.8% 156.3 0.1 6.3 6.3 4.0% 4.0%
Corporate Expense N/A --- (12.5) (12.5) N/A N/A N/A --- (12.7) (12.2) N/A N/A
Interest Expense N/A --- (15.1) N/A N/A N/A N/A --- (14.5) N/A N/A N/A
TOTAL $ 1,389.9 $ (0.1) $ 98.8 $ 116.0 7.1% 8.3% $ 1,337.2 $ 1.2 $ 89.5 $ 111.6 6.7% 8.3%
Second Quarter - 2007 Second Quarter - 2006
OPERATING INCOME OPERATING MARGIN OPERATING INCOME OPERATING MARGIN
Impact of Restated Restated Restated Restated Impact of Restated Restated Restated Restated
NET SALES Acct. Change GAAP* Non-GAAP* GAAP* Non-GAAP* NET SALES* Acct. Change GAAP* Non-GAAP* GAAP* Non-GAAP*
Pressure-sensitive Materials $ 879.3 $ 0.6 $ 89.5 $ 86.8 10.2% 9.9% $ 809.5 $ 0.5 $ 77.9 $ 80.0 9.6% 9.9%
Retail Information Services 219.1 0.9** 1.5 21.6 0.7% 9.9% 181.4 --- 21.0 23.0 11.6% 12.7%
Office and Consumer Products 262.7 --- 42.3 42.6 16.1% 16.2% 265.4 0.1 45.4 43.8 17.1% 16.5%
Other specialty converting businesses 162.4 --- 6.9 6.9 4.2% 4.2% 153.4 0.2 4.8 5.5 3.1% 3.6%
Corporate Expense N/A (0.9)** (8.1) (8.1) N/A N/A N/A 1.2 (9.4) (8.6) N/A N/A
Interest Expense N/A --- (20.1) N/A N/A N/A N/A --- (13.6) N/A N/A N/A
TOTAL $ 1,523.5 $ 0.6 $ 112.0 $ 149.8 7.4% 9.8% $ 1,409.7 $ 2.0 $ 126.1 $ 143.7 8.9% 10.2%
Third Quarter - 2007 Third Quarter - 2006
OPERATING INCOME OPERATING MARGIN OPERATING INCOME OPERATING MARGIN
Impact of Restated Restated Restated Restated Impact of Restated Restated Restated Restated
NET SALES Acct. Change GAAP* Non-GAAP* GAAP* Non-GAAP* NET SALES* Acct. Change GAAP* Non-GAAP* GAAP* Non-GAAP*
Pressure-sensitive Materials $ 868.3 $ 0.5 $ 68.3 $ 82.3 7.9% 9.5% $ 825.3 $ (0.3) $ 83.1 $ 83.9 10.1% 10.2%
Retail Information Services 388.4 (2.0) (16.5) 11.5 -4.2% 3.0% 164.4 0.4 7.3 10.9 4.4% 6.6%
Office and Consumer Products 266.9 0.8 48.8 49.3 18.3% 18.5% 281.7 2.4 47.1 47.5 16.7% 16.9%
Other specialty converting businesses 156.8 (0.2) 7.4 8.9 4.7% 5.7% 146.2 --- 5.6 7.3 3.8% 5.0%
Corporate Expense N/A 1.5 (5.8) (0.2) N/A N/A N/A (1.2) (23.2) (10.2) N/A N/A
Interest Expense N/A --- (35.7) N/A N/A N/A N/A --- (14.1) N/A N/A N/A
TOTAL $ 1,680.4 $ 0.6 $ 66.5 $ 151.8 4.0% 9.0% $ 1,417.6 $ 1.3 $ 105.8 $ 139.4 7.5% 9.8%
Fourth Quarter - 2007 Fourth Quarter - 2006
OPERATING INCOME OPERATING MARGIN OPERATING INCOME OPERATING MARGIN
Impact of Impact of Restated Restated Restated Restated
NET SALES Acct. Change GAAP Non-GAAP GAAP* Non-GAAP* NET SALES* Acct. Change GAAP* Non-GAAP* GAAP* Non-GAAP*
Pressure-sensitive Materials $ 890.1 $ --- $ 79.0 $ 80.0 8.9% 9.0% $ 814.3 $ (0.2) $ 74.3 $ 76.7 9.1% 9.4%
Retail Information Services 410.7 --- 1.9 28.0 0.5% 6.8% 168.1 0.1 9.6 12.9 5.7% 7.7%
Office and Consumer Products 272.2 --- 56.1 59.5 20.6% 21.9% 285.0 5.4 58.6 56.7 20.6% 19.9%
Other specialty converting businesses 141.0 --- 0.2 2.9 0.1% 2.1% 144.0 (0.2) 0.6 1.9 0.4% 1.3%
Corporate Expense N/A --- (4.9) (5.1) N/A N/A N/A --- (16.0) (16.0) N/A N/A
Interest Expense N/A --- (34.3) N/A N/A N/A N/A --- (13.3) N/A N/A N/A
TOTAL $ 1,714.0 $ --- $ 98.0 $ 165.3 5.7% 9.6% $ 1,411.4 $ 5.1 $ 113.8 $ 132.2 8.1% 9.4%
Full Year 2007 Full Year 2006
OPERATING INCOME OPERATING MARGIN OPERATING INCOME OPERATING MARGIN
Impact of Restated Restated Restated Restated Impact of Restated Restated Restated Restated
NET SALES Acct. Change GAAP* Non-GAAP* GAAP* Non-GAAP* NET SALES* Acct. Change GAAP* Non-GAAP* GAAP* Non-GAAP*
Pressure-sensitive Materials $ 3,497.7 $ 1.1 $ 318.7 $ 332.5 9.1% 9.5% $ 3,236.3 $ 0.4 $ 301.6 $ 310.9 9.3% 9.6%
Retail Information Services 1,174.5 (1.1) (5.9) 68.3 -0.5% 5.8% 667.7 0.7 45.7 56.9 6.8% 8.5%
Office and Consumer Products 1,016.2 0.7 173.6 178.4 17.1% 17.6% 1,072.0 8.4 187.4 185.1 17.5% 17.3%
Other specialty converting businesses 619.4 (0.2) 25.4 29.6 4.1% 4.8% 599.9 0.1 17.3 21.0 2.9% 3.5%
Corporate Expense N/A 0.6 (31.3) (25.9) N/A N/A N/A --- (61.3) (47.0) N/A N/A
Interest Expense N/A --- (105.2) N/A N/A N/A N/A --- (55.5) N/A N/A N/A
TOTAL $ 6,307.8 $ 1.1 $ 375.3 $ 582.9 5.9% 9.2% $ 5,575.9 $ 9.6 $ 435.2 $ 526.9 7.8% 9.4%
Full Year 2005
OPERATING INCOME OPERATING MARGIN
Impact of Restated Restated Restated Restated
NET SALES* Acct. Change GAAP* Non-GAAP* GAAP* Non-GAAP*
Pressure-sensitive Materials $ 3,114.5 $ 6.0 $ 264.1 $ 287.1 8.5% 9.2%
Retail Information Services 630.4 --- 37.7 45.2 6.0% 7.2%
Office and Consumer Products 1,136.1 (6.1) 161.9 186.0 14.3% 16.4%
Other specialty converting businesses 592.5 0.8 14.9 21.1 2.5% 3.6%
Corporate Expense N/A --- (53.2) (50.4) N/A N/A
Interest Expense N/A --- (57.9) N/A N/A N/A
TOTAL $ 5,473.5 $ 0.7 $ 367.5 $ 489.0 6.7% 8.9%
* Includes adjustments to results as originally reported to reflect prior period reclassifications.
** Variance of $0.9M due to reclass of Paxar related expenses from the RIS segment to Corporate.