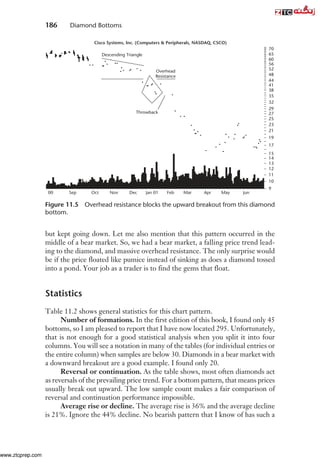
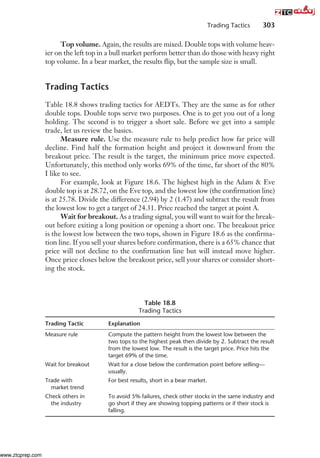
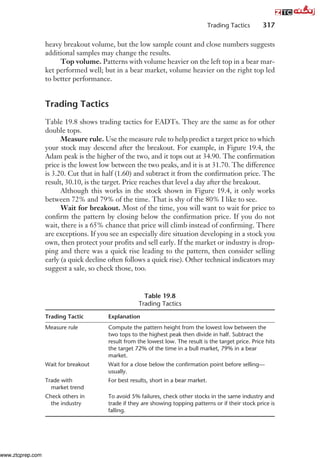
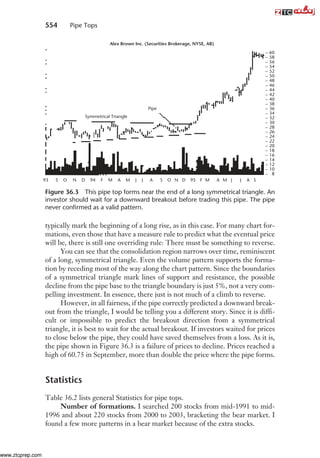
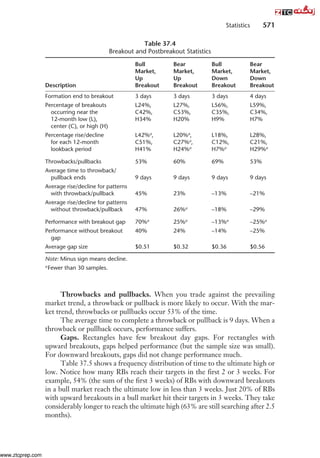
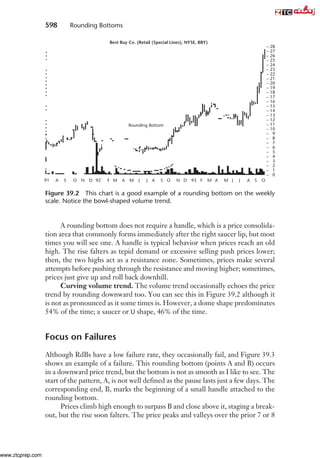
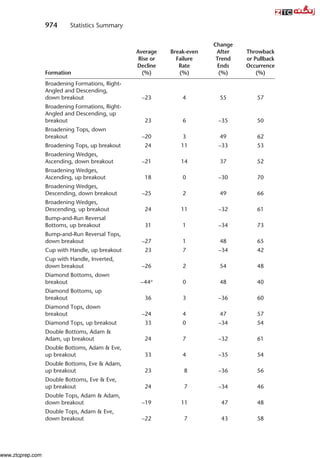
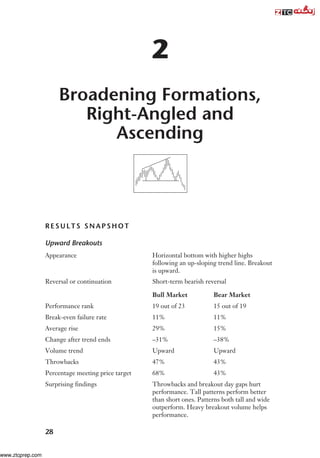
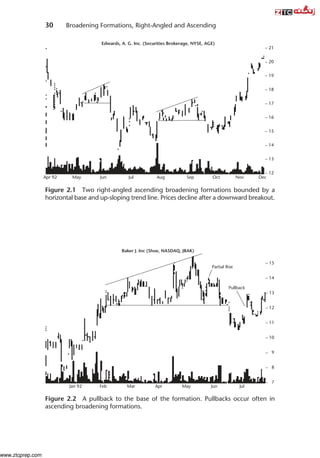
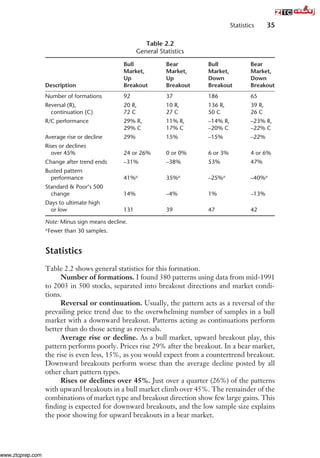
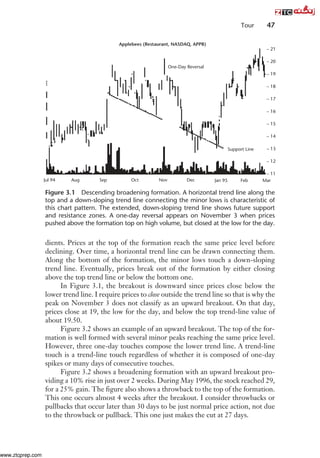
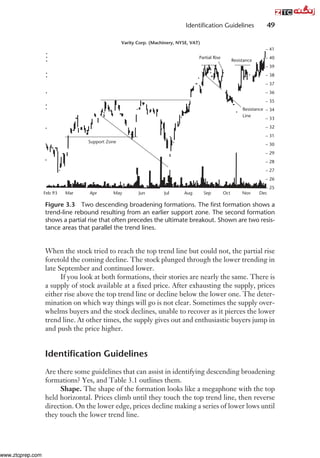
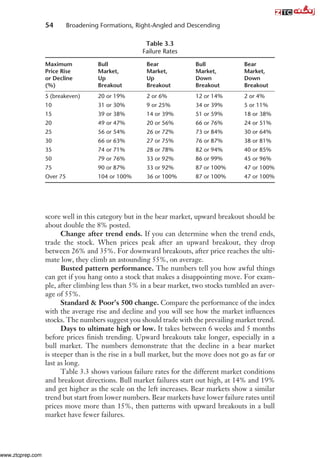
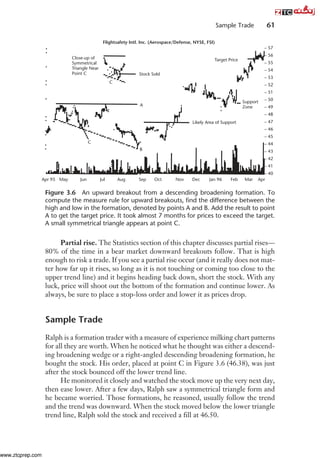
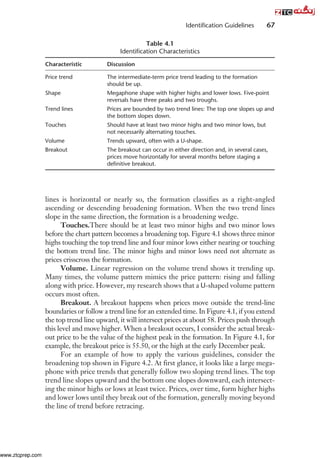
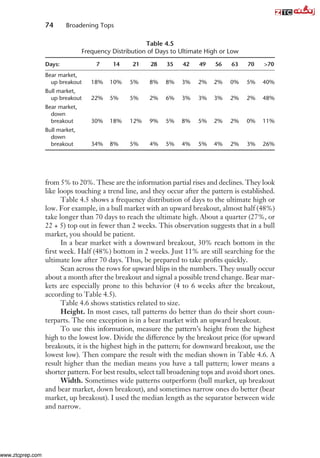
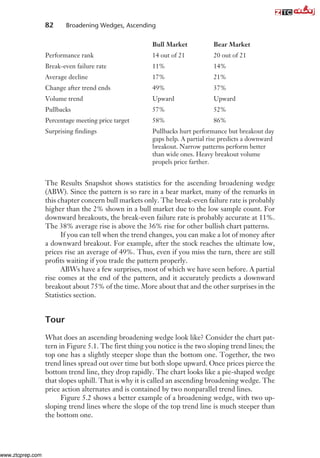
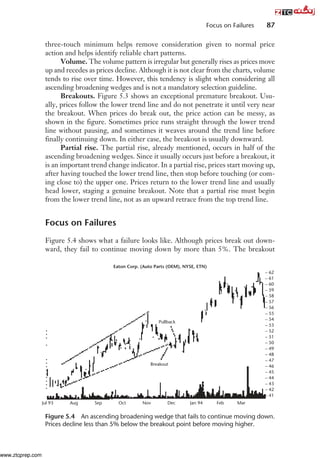
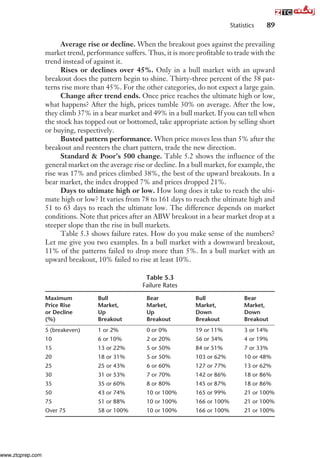
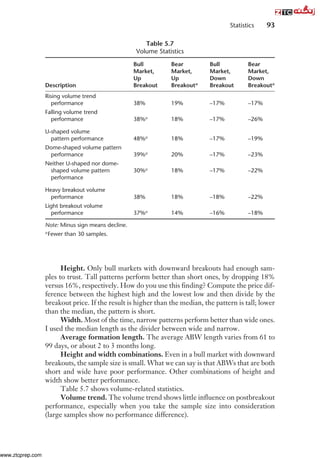
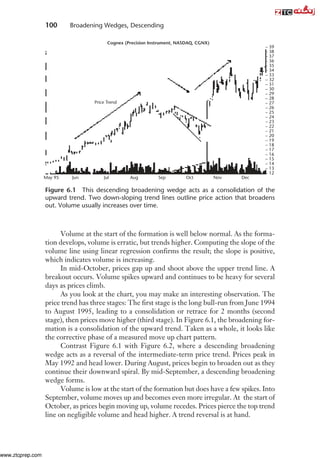
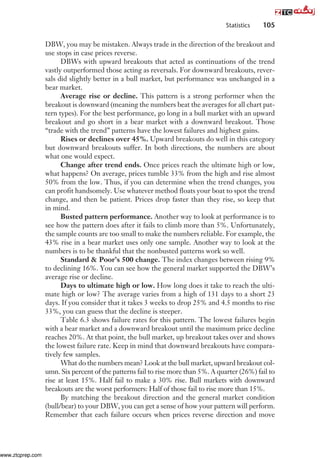
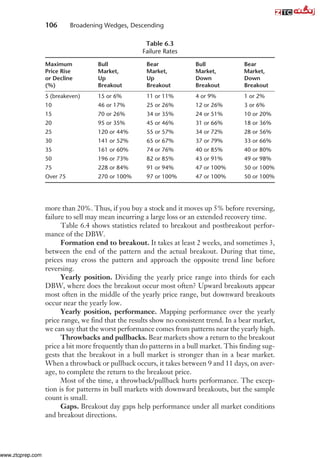
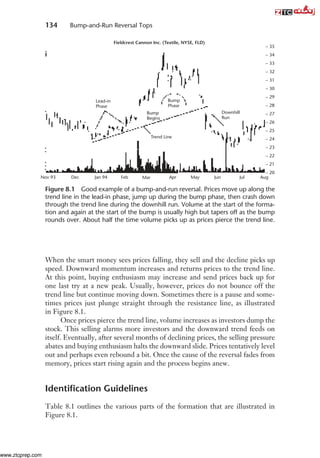
This document provides statistics and guidelines for identifying and analyzing broadening bottoms chart patterns. Broadening bottoms are middle-of-the-road performers with break-even failure rates around 10% except in bull markets when they are higher. Surprisingly, throwbacks hurt performance and tall, narrow patterns perform better than others. The document defines identification guidelines including a downward price trend, megaphone shape, and at least two minor highs and lows. It also notes statistics such as average rises/declines and failure rates in bull versus bear markets.


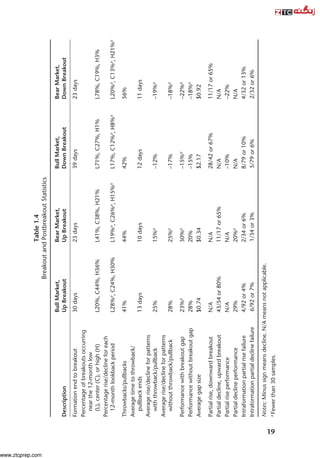


![It was 58 days wide, about half as wide as the median. Were the rims even? No
(bad). Clearly, she faced mixed technical evidence.
Patiently, she counted cards until the odds stacked in her favor. When
price closed below the right cup lip, she shorted the stock and received a fill at
7.90. The following day’s wide trading range bothered her, but the close was
in the middle of the intraday range (so it was not a one-day reversal). Price eased
down each day (but not quickly enough to suggest a sale), attempted a pullback
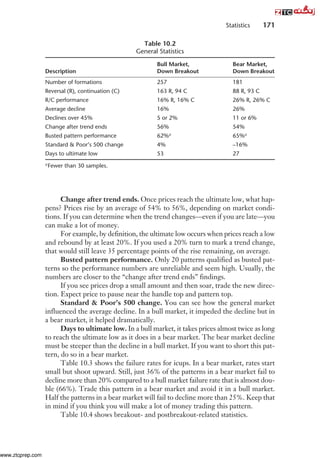
at the start of July, but soon continued lower. After a few weeks, she drew a trend
line down as shown in Figure 10.6.
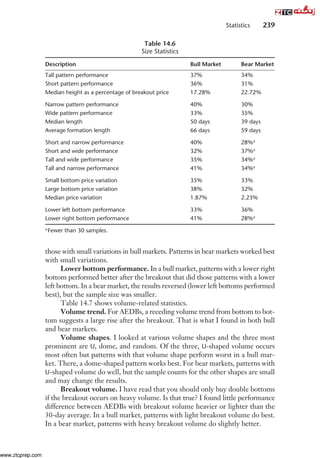
She measured the cup height then applied it to the right cup lip and found
that prices had declined below the target. Since only 15% of the patterns in a
bull market meet the target, she guessed the downside was limited. [Note: She
used the cup height, not the handle height, to find a price target]. So, she placed
a stop loss order at 6.10, just a few cents above the minor high in mid July (the
“Cup Target” in the figure points to just above her stop price).
After her shift ended each night at the casino, she logged onto the Web
and updated her position. When prices jumped upward in late July, the stop took
her out at 6.10. She made about 22% after commissions. The trend changed in
week six after the breakout, just as Table 10.5 warned.
Sample Trade 177
Inverted Cup Handle
A
B
Aug Sep Oct Nov
Jan 96 Feb Mar Apr May Jun Jul
Advanced Micro Devices, Inc (Semiconductor, NYSE, AMD)
12
Cup Target
Shorted
Covered
Trend Line
11
10
8
9
6
7
4
5
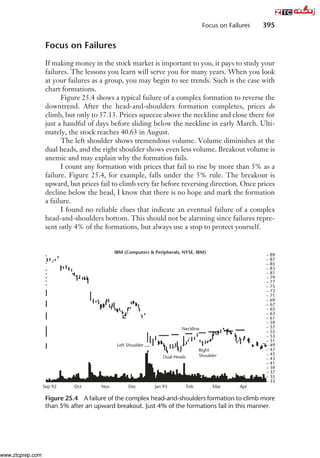
Figure 10.6 As described in the Sample Trade, Samantha traded this inverted
cup-with-handle by drawing a down-sloping trend line as a sell trigger. A stop-loss
order closed out her position automatically, though.
www.ztcprep.com](https://image.slidesharecdn.com/encyclopediaofchartpatterns1-230516161045-005068a4/85/Encyclopediaofchartpatterns-1-pdf-167-320.jpg)