Employees Relationship Management College project report.docx
1. A STUDY ON EMPLOYEE RELATIONSHIP MANAGEMENT IN NIKITA
CONTAINERS PRIVATE LIMITED
INTRODUCTION
MEANING:
Employee relationship management is an art, which effectively monitors and manages the
relation between individuals either of the same team or from different teams. Employee
relationship management helps in strengthening the bond among the employees and ensures that
each one is contented and enjoys a healthy relation with each other.
Employee relationship management includes various activities undertaken by the superiors
or the management to develop a healthy relation among the employees and extract the best out of
each team member.
An organization is a place to work and not a battlefield where employees would fight with
each other. One needs to treat his fellow workers well, understand each other’s expectations for a
healthy relationship and maximum output. The employees must be comfortable with each other
and work together as a team.
Importance of Employees Relations:
The ultimate goal of maintaining a healthy employee relationship is to make the company
successful. That’s why every company or industry should focus on building good employee
relationships between the staff. Some benefits of maintaining a healthy relationship are discussed
below.
• Loyal employees - Since there will be good communication between you and your employees,
they will frankly talk to you. Whenever, they will face any problem regarding work, salary or any
other staff member’s behavior, they will discuss it with you. Instead of leaving their job, they will
choose to talk to their boss. Once they discuss their issues with you, you can take the necessary
steps to solve them.
• Motivated employees - Everyone feels good when someone appreciates them or their work.
When you will appreciate your staff members for their work and behavior they will feel like you
2. respect them and their work. This will motivate them to increase their performance. Every day,
they will try to work more efficiently for the success of the company. As a result, your company
will reach new heights of success.
• Reduced conflicts between employees - Many times employees start arguments in the
workplace which create a negative impact on other employees also. If there will be better
communication between you and your staff members, any employee will choose to talk about the
problem instead of augmenting. They will choose discussion over fights. The staff members will
form a bond where they will listen to each other’s problems. As a result, there will be fewer or no
conflicts between the staff members.
• Forming a bond of trust - Trust is the base of anything. For example, will you hire a maid for
housekeeping if you feel she can’t be trusted? Surely, you will never hire her. Similarly, any
employee will not be able to work if he or she thinks their boss cannot be trusted. Therefore, build
a relationship of trust with your employees. Always try to be honest with them. If an employee
will trust their boss and fellow staff members, he or she will feel more comfortable. Your
employees will also maintain the bond of trust.
• Balance between work and personal life - These days, companies force their employees to
work so much that the employees feel depressed. Due to the unwanted workload, they are not able
to keep a balance between work and life. They don’t get time for their family, personal chores etc.
Due to this, their performance decreases. A healthy employee relationship means you give them
enough time for their personal life. You respect your employee’s needs.
• Professional workplace - The good communication skills of your employees will let them focus
on the work. They will not disturb other employees by initiating useless discussions. Every
employee will focus on completing the work on time. This will create a fully professional
atmosphere in the workplace.
3. BOARD AREA OF THE STUDY:
Employee relationship management is an element of human resources management that
focuses on building strong, positive relationships between employees and their managers. ERM is
the practice of maintaining desired employee-employer relationships. It is a part of human resource
management. The main goal of ERM is to build and maintain positive connections among
employees to ensure smooth business operations.
4. DOMAIN OF THE STUDY:
Domain of the study is the body of knowledge, skills or abilities being measured or
examined by a test, experiment or research study. A research would want a content domain to
cover all aspects of the subject area as well as be well-defined and objective.
The domain of the study for the topic of “Employee Relationship Management” typically
falls within the field of Human Resource Department.HR is the division of a business responsible
for finding, recruiting, screening, and training job applicants. HR department also handle employee
compensation, benefits, and terminations.
5. OBJECTIVES OF THE STUDY:
To identify the factors contributing for employee relationship management.
To find the impacts of employee relationship on workplace in Nikita Containers.
To examine the employee relationship between employees creative and management
performance.
6. SCOPE OF THE STUDY:
This study has covered the effectiveness and efficiency of Employee relationship
management on employee’s performance
To know their level of satisfaction on various facilities provided by the organization.
The research will rely on the organization for vital information as well as information from
primary source.
7. NEEDS OF THE STUDY:
The relationship between an employer and employee is a key deciding factor because it is
very important to have mutual trust.
To understand and manage employee relationships can lead to higher levels of job
satisfaction and engagement among team members.
To engage all the employees to be productive, committed to the project's goals, and willing
to contribute their best efforts.
8. LIMITATIONS OF THE STUDY:
There was insufficient time to collect and explore much information.
The employees are busy with their works, so they could not give enough time to fill up the
questionnaire.
Employees are not allowed to provide sensitive and depth information.
9. REVIEW OF LITERATURE:
Akrani (2011) the human relations approach viewed organization as a social system of
interpersonal and inter group relationships, which shows that having a work environment that
stimulates healthy and sustainable relationships amongst employees plays a vital role in enhancing
efficiency and effectiveness of the organization. The human relations approach arose as a reaction
to Taylor’s Scientific Management approach which suggested the development of standard
methods for performing tasks.
Muhammad Ikhlas Khan (2012), “The Impact of Training and Motivation on Performance
of Employees”. The study was did to identify the effect of certain factors on the employee’s 14
performance. The study found that there are two factors influencing employees performance that
are training and motivation in the organizations.
Roopali Bajaj, Shailni Sinha and Vineet Tiwari (2013), “Crucial Factors of Human
Resource Management for Good Employee Relations”- From this researcher it is found that there
is no unity and maintain a friendly attitude between every employee and between the management
and employees. The operative functions are crucial and has to improve in productivity in the
organization.
Dr. B. Devamaindhan (2014), “employer – employee relationship”- The objective of this
research is to have healthy relation is vital for the successful running of any business. 13 The
employer should know what the employee is facing the problems then that would be an obstacle
to achieve success in the business.
Dr.D. Xesha and Dr. K R Subramanian (2014), “The Impact of Employer Employee
Relationships on Business Growth”- The objective of the study is to know the employer employee
relationship and impact of organizational response. The researcher found that the organization has
to grow and survive in the current business environment they need to find resources to update
continuously their technologies and information needs.
10. Thomas Katua Ngui (2016), “Relationship between employee relations strategies and
performance of commercial banks in Kenya” The objective of this research is to scrutinize the
relationship amongst employee relation plans or strategies of employee relation along with the
execution of commercial banks. The researcher concludes that development and documentation of
commercial bank strategies and on the whole of the banks strategies has not linked to each other.
Richard Hannis Ansah (2018), “Importance of Employer Employee Relationship towards
the Growth of a Business”- The objective of this research is to present evidence based on the
information to readers on the importance of the Employer Employee relationship for the growth
of the business. Researcher found that the business owner shared a positive result that relationship
plays an important role towards businesses as they add up to the growth of the business.
Ugoani, John ( 2020), “Effective Delegation and Its Impact on Employee Performance” -
The results show that effective delegation provides psychological empowerment and a
collaborative, coordinated and comprehensive managerial technique for motivating and evaluating
employees over their performance.
Ali, B. J., & Anwar, G. (2021), “an Empirical Study of Employees’ Motivation and Its
Influence Job Satisfaction”. The study examines the relationship between the balance scorecard
perspectives and job satisfaction at banking sector. An Empirical Study of Employees’ Motivation
and its Influence Job Satisfaction - The results show that non-reward incentives have a better
impact on employee success because they encourage them to be more environmentally conscious.
Sahedur Rahman (2021), “Effect of Employee Relationship Management (ERM) on
Employee Performance”. The objective of the research is to examine the effects of ERM on
employee performance at banking sectors and to provide suggestions on how to implement ERM
in the organization. The organization has to implicate in the right way for the effective
performance.
11. RESEARCH METHODOLOGY
RESEARCH
Research means Careful Consideration of study regarding a particular concern or Problem
using scientific method. It involves Inductive and Deductive method. Inductive methods analyse
an Observed Event, while Deductive method verify the Observed Event.
RESEARCH METHODOLOGY
Research methodology is important because it helps you to plan and conduct your research
in a rigorous and systematic way. It also allows your readers to evaluate the validity and reliability
of your research results. Here are some definitions and examples of research methodology from
different sources.
RESEARCH DESIGN
“A research design is the arrangement of conditions for collection and analysis of data in a
manner that aims to combine relevance to the research purpose with economy in procedure.” In
fact, the research design is the conceptual structure within which research is conducted; it
constitutes the blueprint for the collection, measurement and analysis of data.”
SOURCES OF DATA COLLECTION
Primary Data Collection Method
PRIMARY DATA
Primary Data refers to the first hand data that has been for specify purpose by research, this
is collected from employees of Amcor Flexibles India Private Limited, Pondicherry.
POPULATION
Population in statistics means the whole of the information which comes under purview of
statistical investigation. A population may be finite according as the number of individuals in at a
finite in the organization. The population size is 300 in the organization.
12. SAMPLING DESIGN
A sample design is a definite plan for obtaining a sample from a given population. It refers
to the technique or the procedure the researcher would adopt in selecting items for the sample. It
is determined before data are collected.
SAMPLING
Sampling is a technique of selecting individual members or a subset of the population to
make statistical inference from them and estimate characteristics of hole population. Sample size
refers to the number of observations or participants included in a search study or survey. The
sample size is a crucial consideration in research as it affects the reliability and generalizability of
the findings. The sample size of the survey is consider as 100 members.
SAMPLE SIZE
Sample size refers to the number of observations or participants included in a search study
or survey. The sample size is a crucial consideration in research as it affects the reliability and
generalizability of the findings. The sample size of the survey is consider as 100 members.
SAMPLING METHOD
In this study Random Sampling are adopted.
QUESTIONNAIRE
A well-defined questionnaire that is used effectively can gather information on both overall
performance of the test system as information on specific components of the system. An objective
type questionnaire was carefully prepared and especially number. The questionnaire arranged in
proper order in accordance with the relevance.
STATISTICAL TOOLS
To arrange and interpret the collected data the following statistical tool were used
Percentage Analysis
Regression
Anova
13. PERCENTAGE METHOD
In percentage method, charts like bar chart, column chart, pie chart, doughnut charts are
used to graphically represent the results from percentage method of the questionnaires.
PERCENTAGE METHOD =
REGRESSION METHOD
A regression is a statistical technique that relates a dependent variable to one or more
independent variables.
𝒀 = 𝒇(𝑿 , 𝜷) + 𝒆
Y = Dependent variable
𝑓 = Function
X = Independent variable
𝛽 = Unknown parameters
e = error terms
ANOVA METHOD
ANOVA stands for Analysis of Variance. It is a statistical method used to analyze the
difference between the means of two or more groups.
F = MSB / MSE
MSB = Mean sum of squares between the groups
MSE = Mean squares of errors
NO.OF RESPONDENTS ANSWERED
TTOTAL NO.OF RESPONDENTS
X 100
14. COMPANY PROFILE
Nikita is committed to make a positive impact on the environment and its stakeholders,
including employees, customers, communities and others. We are working with non-profit
organizations in Chennai (AIM for SEVA) and Haridwar (Matriarchal Kanya Vidhya Peth) that
are involved in exemplary work in social welfare and education. As part of a CSR (Corporate
Social Responsibility) project with AIM for SEVA, Nikita Group has funded the construction of a
student home at Chikamatsu (Andhra Pradesh), located near the border of Andhra Pradesh and
Tamil Nadu in Chittoor district. The student home was inaugurated in August, 2014 and has the
capacity to house 30 boys on nearly 3000 square feet of built-up area. The Group is also actively
involved in the well-being of senior citizens who spend fag-end of their lifetime in the old age
homes. Ananda Old Age Home at Chennai is one among the well managed and decently run Old
Age Homes, where the Group has extended financial assistance for its day-to-day activities, and
Medical Camps for inmates.
Historical Background of NIKITA CONTAINERS PRIVATE LIMITED
Established in 1993, as a small unit for manufacturing aluminum tubes in Umberg on,
Gujarat, Nikita has come a long way. Today, the metal containers manufactured at Nikita are
employed for packaging diverse goods and supplied to customers all over the globe. Since then,
the company has grown steadily adding new clients and more units with state-of-the-art
infrastructure and capabilities. Today we are one of the largest Contract Manufacturers of Personal
Care products in India. The company has an annual turnover of INR 300 million and is poised on
a brisk growth path. Clarion Group has achieved USD 150 Million Sales in the year 2019-20, a
growth of 110% over a period of 5 Years. We’re delighted to be able to offer more than 25 years’
worth of experience in manufacturing personal care products from formulation to final label. Made
with high-grade raw materials, our containers meet international quality standards. Our product
range includes metal food containers, tin food containers, square and rectangular containers, round
containers, cookie containers, confectionery containers, talcum powder containers and custom and
decorative containers.
15. COMPANY NAME NIKITA CONTAINERS PVT LTD
NATURE OF BUSINESS Manufacture
BRANCHES 5
HEADQUARTERS Chennai
STATE All over India
SHARES COMPANY Non-government company
CLASS OF COMPANY Private
CIN U28129MH1993PTC071327
WEBSITE www.nikitaconatiners.in
VISION AND MISSION
VISSION
To Delivery perfect Packaging through innovative craftsmanship with high- quality
printing and manufacturing, with a focus on working towards a cleaner, greener planet.
MISSION
To offer value-added, high-quality products to the customer through best manufacturing
practices and a focus on continuous process improvements.
16. MACHINERY
All the Manufacturing industry machinery is a must at the same time manpower is very
important because the machine quickly completes the work but the employees are operating the
machinery. The Nikita containers industry is a TIN manufacturing industry they are various types
of machinery are available and they are given below
Gang slitter
Body maker
Semi – auto flanger
Printing machine synchronized with UV curing
40T Rhodes presses
PRODUCT PROFILE
Balms tin containers
Betel nuts tin containers
Beverages tin containers
Cakes tin containers
Candles tin containers
CD tin containers
Chocolates tin containers
Cookies tin containers
Cosmetics tin containers
Dry fruits tin containers
Flavors tin containers
Gifting tin containers
Jewellery tin containers
Money bank tin containers
Paints tin containers
Perfumes tin containers
17. DATA ANALYSIS & INTREPRETATION
1. Gender
S.No Sex No. of respondents Percentage
1. Male 60 60
2. Female 30 30
Total 100 100
INTERPRETATION
The above table shows that 60% of the respondents are male and 30% of the
respondent are female employees in the company. The majority 60% of the
employees are male.
60%
30%
Male
Female
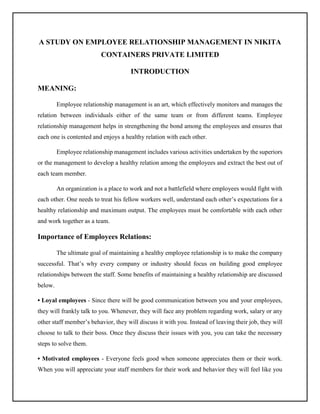
18. 2. Age group
S.No Options No. of respondents Percentage
1. 21-30 25 25
2. 31-40 20 20
3. 41-50 40 40
4. Above 50 years 15 15
Total 100 100
INTERPRETATION
The above table shows that 25% of the respondents are 21-30 years, 20% of
the respondents are 31-40 years, 40% of the respondents are 41-50 years and above
50 years are 15% of the respondents. The majority 40% of the employees are 41-50
years.
25%
20%
40%
15%
21-30
31-40
41-50
Above 50 years
19. 3. Salary
S.No Options No. of respondents Percentage
1. 20,000 – 30,000 66 66
2. 30,000 – 40,000 24 24
3. Above 40,000 10 10
Total 100 100
INTERPRETATION
The above table shows that 66% of the respondents get Rs. 20,000 – 30,000
of salary, 24% of the respondents get Rs. 30,000 – 40,000 of salary, 10% of the
respondents get above Rs. 40,000 of salary. The majority 66% of the employees get
Rs. 20,000 – 30,000 of salary.
66%
24%
10%
20,000 – 30,000
30,000 – 40,000
Above 40,000
20. 4. Marital Status
S.No Options No. of respondents Percentage
1. Married 60 60
2. Unmarried 40 40
Total 100 100
INTERPRETATION
The above table shows that 60% of the respondents are married and 40%
respondents are unmarried in the company. The majority 60% of the employees are
married.
60%
40%
Married
Unmarried
21. 5. Qualification
S.No Options No. of respondents Percentage
1. UG graduates 50 50
2. PG Graduates 10 10
3. Diploma 20 20
4. Other 20 20
Total 100 100
INTERPRETATION
The above table shows that 50% of the respondents are UG graduates, 10% of
the respondents are PG graduates, 20% of the respondents are Diploma and 20% of
the respondents are other category. The majority 50% of the employees are UG
graduates.
50%
10%
20%
20%
UG graduates
PG Graduates
Diploma
Other
22. 6. There is good communication between employees and managers in the company – do you
agree?
S.No Options No. of respondents Percentage
1. Strongly agree 30 30
2. Agree 40 40
3. Neutral 20 20
4. Disagree 5 5
5. Strongly disagree 5 5
Total 100 100
INTERPRETATION
The above table shows that 30% of the respondents strongly agree, 40% of
the respondents are agree, 20% of the respondents are neutral, 5% of the respondents
are disagree and 5% of the respondents strongly disagree. The majority 40% of the
respondents are agree to good communication in the company.
30%
40%
20%
5%
5%
Strongly agree
Agree
Neutral
Disagree
Strongly disagree
23. 7. Do you get good support from manager or supervisor for your work?
S.No Options No. of respondents Percentage
1. Strongly agree 20 20
2. Agree 25 25
3. Neutral 40 40
4. Disagree 5 5
5. Strongly disagree 10 10
Total 100 100
INTERPRETATION
The above table shows that 20% of the respondents strongly agree, 25% of
the respondents are agree, 40% of the respondents are neutral, 5% of the respondents
are disagree and 10% of the respondents strongly disagree. The majority 40% of the
respondents are neutral to get good support from their managers in the company.
20%
25%
40%
5%
10%
Strongly agree
Agree
Neutral
Disagree
Strongly disagree
24. 8. Does your supervisor actively listen to your suggestion and enables you to perform at your
best?
S.No Options No. of respondents Percentage
1. Strongly agree 10 10
2. Agree 10 10
3. Neutral 40 40
4. Disagree 15 15
5. Strongly disagree 25 25
Total 100 100
INTERPRETATION
The above table shows that 10% of the respondents strongly agree, 10% of
the respondents are agree, 40% of the respondents are neutral, 15% of the
respondents are disagree and 25% of the respondents strongly disagree. The majority
40% of the respondents are neutral that supervisor actively listen to their suggestion in the
company.
10%
10%
40%
15%
25% Strongly agree
Agree
Neutral
Disagree
Strongly disagree
25. 9. How would you describe relations between managers and employees in this organization?
S.No Options No. of respondents Percentage
1. Very good 21 21
2. Good 45 45
3. Neutral 20 20
4. Bad 10 10
5. Very bad 4 4
Total 100 100
INTERPRETATION
The above table shows that 21% of the respondents choose very good, 45%
of the respondents choose good, 20% of the respondents choose neutral, 10% of the
respondents choose bad and 4% of the respondents choose very bad. The majority
45% of the respondents choose good.
21%
45%
20%
10%
4%
Very good
Good
Neutral
Bad
Very bad
26. 10. Conflict is always a bad thing in organization – do you agree?
S.No Options No. of respondents Percentage
1. Strongly agree 45 45
2. Agree 27 27
3. Neutral 20 20
4. Disagree 4 4
5. Strongly disagree 4 4
Total 100 100
INTERPRETATION
The above table shows that 45% of the respondents strongly agree, 27% of
the respondents are agree, 20% of the respondents are neutral, 4% of the respondents
are disagree and 4% of the respondents strongly disagree. The majority 45% of the
respondents strongly agree.
45%
27%
20%
4%
4%
Strongly agree
Agree
Neutral
Disagree
Strongly disagree
27. 11. Should management take time out to get to know employees personality?
S.No Options No. of respondents Percentage
1. Strongly agree 20 20
2. Agree 35 35
3. Neutral 30 30
4. Disagree 10 10
5. Strongly disagree 5 5
Total 100 100
INTERPRETATION
The above table shows that 20% of the respondents strongly agree, 35% of
the respondents are agree, 30% of the respondents are neutral, 10% of the
respondents are disagree and 5% of the respondents strongly disagree. The majority
35% of the respondents are agree.
20%
35%
30%
10%
5%
Strongly agree
Agree
Neutral
Disagree
Strongly disagree
28. 12. A pleasant and cooperative workplace to work is needed.
S.No Options No. of respondents Percentage
1. Yes 100 100
2. No 0 0
Total 100 100
INTERPRETATION
The above table shows that 100% of the respondents prefer yes, 0% of the
respondents prefer no. The majority 100% of the respondents prefer yes.
100%
Percentage
Yes
29. 13. It is important to balance your work and personal life.
S.No Options No. of respondents Percentage
1. Yes 55 55
2. No 10 10
3. Neutral 35 35
Total 100 100
INTERPRETATION
The above table shows that 55% of the respondents prefer yes, 10% of the
respondents prefer no and 35% of the respondents prefer neutral. The majority 55%
of the respondents prefer yes.
55%
10%
35% Yes
No
Neutral
30. 14. Are you given necessary trainings to develop your skills required for your job role?
S.No Options No. of respondents Percentage
1. Yes 50 50
2. No 20 20
3. Neutral 30 30
Total 100 100
INTERPRETATION
The above table shows that 50% of the respondents prefer yes, 20% of
the respondents prefer no and 30% of the respondents prefer neutral. The majority
50% of the respondents prefer yes.
50%
20%
30%
Yes
No
Neutral
31. 15. Are you given opportunities to develop new skillsets apart from your job role?
S.No Options No. of respondents Percentage
1. Yes 70 70
2. No 30 30
Total 100 100
INTERPRETATION
The above table shows that 70% of the respondents prefer yes, 30% of the
respondents prefer no. The majority 70% of the respondents prefer yes.
70%
30%
Yes
No
32. 16. Level of satisfaction with the working culture of the organization.
S.No Options No. of respondents Percentage
1. Very satisfied 25 25
2. Satisfied 30 30
3. Neutral 23 23
4. Dissatisfied 16 16
5. Very dissatisfied 6 5
Total 100 100
INTERPRETATION
The above table shows that 25% of the respondents choose very satisfied, 30%
of the respondents are satisfied, 23% of the respondents are neutral, 16% of the
respondents are dissatisfied and 6% of the respondents choose very dissatisfied. The
majority 30% of the respondents are satisfied.
25%
30%
23%
16%
5%
Very satisfied
Satisfied
Neutral
Dissatisfied
Very dissatisfied
33. 17. Would you recommend this company as a great place to work?
S.No Options No. of respondents Percentage
1. Good 30 30
2. Neutral 57 57
3. Bad 13 13
Total 100 100
INTERPRETATION
The above table shows that 30% of the respondents prefer good, 57%
of the respondents prefer neutral and 13% of the respondents prefer bad. The
majority 57% of the respondents prefer neutral.
30%
57%
13%
Good
Neutral
Bad
34. 18. How satisfied are you working for the company?
S.No Options No. of respondents Percentage
1. Satisfied 60 60
2. Neutral 30 30
3. Dissatisfied 10 10
Total 100 100
INTERPRETATION
The above table shows that 60% of the respondents are satisfied, 30%
of the respondents are neutral and 10% of the respondents are dissatisfied. The
majority 60% of the respondents are satisfied.
60%
30%
10%
Satisfied
Neutral
Dissatisfied
35. 19. Would you recommend this company as a great place to work?
S.No Options No. of respondents Percentage
1. Yes 80 80
2. No 20 20
Total 100 100
INTERPRETATION
The above table shows that 80% of the respondents prefer yes, 20%of
the respondents prefer no. The majority 80% of the respondents prefer yes.
80%
20%
Yes
No
36. 20. How satisfied are you with the amount of involvement you have in decision making at this
workplace?
S.No Options No. of respondents Percentage
1. Highly satisfied 15 15
2. Satisfied 20 20
3. Neutral 35 35
4. Dissatisfied 20 20
5. Highly dissatisfied 10 10
Total 100 100
INTERPRETATION
The above table shows that 15% of the respondents are highly satisfied, 20%
of the respondents are satisfied, 35% of the respondents are neutral, 20% of the
respondents are dissatisfied and 10% of the respondents are highly dissatisfied. The
majority 35% of the respondents are neutral.
15%
20%
35%
20%
10%
Highly satisfied
Satisfied
Neutral
Dissatisfied
Highly dissatisfied
37. 21. Manager encourages employees to express their opinions in planning and implementing
the work.
S.No Options No. of respondents Percentage
1. Agree 55 55
2. Neutral 35 35
3. Disagree 10 10
Total 100 100
INTERPRETATION
The above table shows that 55% of the respondents are agree, 35% of the
respondents are neutral and 10% of the respondents are disagree. The majority 55%
of the respondents are agree.
55%
35%
10%
Agree
Neutral
Disagree
38. 22. Manager encourages employees to be creative in their work and bring new ideas.
S.No Options No. of respondents Percentage
1. Yes 85 85
2. Neutral 15 15
3. No 0 0
Total 100 100
INTERPRETATION
The above table shows that 85% of the respondents prefer yes, 15% of the
respondents are neutral and 0% of the respondents prefer no. The majority 85% of
the respondents prefer yes.
85%
15%
0%
Yes
Neutral
No
39. 23. Manager concerns the working procedures and gives employees freedom to choose tasks
because he trusts their opinions and decisions.
S.No Options No. of respondents Percentage
1. Strongly agree 12 12
2. Agree 36 36
3. Neutral 42 42
4. Disagree 10 10
5. Strongly disagree 0 0
Total 100 100
INTERPRETATION
The above table shows that 12% of the respondents strongly agree, 36% of
the respondents agree, 42% of the respondents are neutral, 10% of the respondents
disagree and 0% of the respondents are strongly disagree. The majority 42% of the
respondents are neutral.
12%
36%
42%
10%
0%
Strongly agree
Agree
Neutral
Disagree
Strongly disagree
40. 24. Does your manager effectively communicate the information you need to understand.
S.No Options No. of respondents Percentage
1. Yes 85 85
2. Neutral 15 15
3. No 0 0
Total 100 100
INTERPRETATION
The above table shows that 85% of the respondents prefer yes, 15% of the
respondents are neutral and 0% of the respondents prefer no. The majority 85% of
the respondents prefer yes.
85%
15%
0%
Yes
Neutral
No
41. 25. Overall rating of the company
S.No Options No. of respondents Percentage
1. 1 26 26
2. 2 37 37
3. 3 15 15
4. 4 12 12
5. 5 10 10
Total 100 100
INTERPRETATION
The above table shows that 26% of the respondents rate 1, 37% of the
respondents rate 2 and 15% of the respondents rate 3, 12% of the respondents rate
4, 10% of the respondents rate 5. The majority 37% of the respondents rate 2.
26%
37%
15%
12%
10%