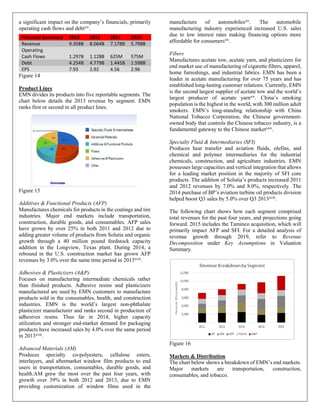
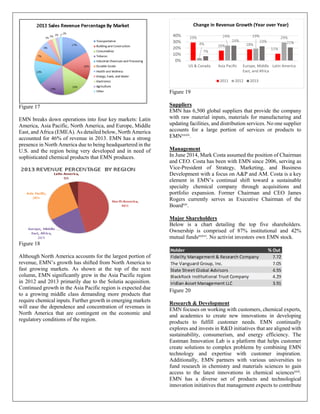
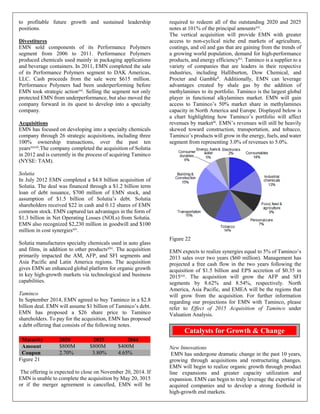
Eastman Chemical Company (EMN) is a global specialty chemicals company that produces advanced materials, chemicals, and fibers found in everyday products. EMN has 45 manufacturing sites in 16 countries and equity interests in joint ventures worldwide. It began as a chemicals supplier to Eastman Kodak in 1920 and became publicly traded in 1993. EMN focuses on shifting its sales towards specialty chemicals for stability as commodity products experience more volatility. Recent acquisitions have expanded EMN's product portfolio and capacity in high-growth markets. EMN is well positioned to acquire Taminco to boost its personal care, coatings, and oil and gas businesses.
Mercer Capital's Value Focus: Auto Dealer Industry | Mid-Year 2015Mercer Capital
Mercer Capital's Auto Dealer Industry newsletter provides perspective on valuation issues. Each newsletter also includes a macroeconomic trends, industry trends, and guideline public company metrics.
Mercer Capital's Value Focus: Auto Dealer Industry | Mid-Year 2014Mercer Capital
Mercer Capital's Auto Dealer Industry newsletter provides perspective on valuation issues. Each newsletter also includes a macroeconomic trends, industry trends, and guideline public company metrics.
The global high yield bond markets have witnessed sentiment to risk-off mode. This has since been partially significant growth and diversification over the last few years aided by the extraordinary monetary policy accommodation provided by central banks across the world. The unprecedented liquidity made available at record low yields has thus led to a significant pick up in both primary market and secondary market activity in the asset class. Banking disintermediation in Europe and regulatory changes in the financial sector further contributed to the deepening and diversification of the high yield bond markets even as emerging market issuances entered the fray.
In this backdrop, Aranca’s special report – High Yield Bonds - The Rise of the Fallen – examines how liquidity concerns have increased with changing regulatory environment, rising capital requirements and declining risk appetite leading to decreasing bond inventories at both banks and other dealers even as corporate bond issuances are at an all-time high.
Mercer Capital's Value Focus: Energy Industry | Q1 2021 | Region Focus: Eagle...Mercer Capital
Mercer Capital's Energy Industry newsletter provides perspective on valuation issues. Each newsletter also typically includes macroeconomic trends, industry trends, and guideline public company metrics.
Mercer Capital's Value Focus: Energy Industry | Q4 2020 | Region Focus: Appal...Mercer Capital
Mercer Capital's Energy Industry newsletter provides perspective on valuation issues. Each newsletter also typically includes macroeconomic trends, industry trends, and guideline public company metrics. This issue we focus on the Appalachian Basin.
The SVB Asset Management Economic Report, Q2 2017, is a review of and outlook on economic factors that impact global markets and business health.
In this edition, the team discusses the U.K.’s Article 50 notice and the FOMC’s current path towards normalization. The report also examines the Trump Administration’s first 100 days in office and current business sentiment.
Both domestic consumption (higher debt service and cost of living, slower pace of asset price appreciation, low real income gains) and capital expenditure (higher debt service, elevated current spending vis-à-vis GDP, weakening domestic demand, external uncertainties) is expected to ease off, with the fiscal impulse peaking, financial conditions tightening, and negative impact of prior dollar strength. This should taper labour market gains and keep inflation pressures benign. The extent of slowdown will be dependent upon the resiliency of private sector balance sheet and the subsequent impact on demand. It is imperative that the Fed stays ahead in managing overall debt servicing costs (short-run implications on demand; longer-run may short-circuit the feedback from demand to capital spending and future productivity), and limit the negative impact of policy on overall growth.
We like rates structurally, both on adequate valuations and as a hedge for risk assets, taking the under on the (largely) priced base case of a smooth 3 year (2018-2020) rate hiking cycle.
SPG Trend Advisors and its affiliate, Sage Policy Group, have made presentations on local and regional economies, the national economy, international and geopolitical issues and capital market events. We offer these presentations for our readers to gain additional information from our commentaries and further explanation of our analyses and forecasts.
Mercer Capital's Value Focus: Energy Industry | Q3 2020 | Region Focus : BakkenMercer Capital
Mercer Capital's Energy Industry newsletter provides perspective on valuation issues. Each newsletter also typically includes a macroeconomic trends, industry trends, and guideline public company metrics.
Forward guidance by central banks is no Panaceatutor2u
Central banks in recent months have experimented with ‘forward guidance’ – sending signals about the future path of monetary policy particularly in relation to interest rates – as a way of stabilising medium to longer run expectations in the markets and among businesses and consumers.
Using the data, explain two likely causes of the forecast of slower growth for the UK economy
Examine two difficulties facing economists when forecasting economic growth
EY Price Point: global oil and gas market outlook, Q319EY
The theme for this quarter is consistency: in the significant trends impacting prices, at least. The forces that impacted oil prices in the second quarter were the same as those that have impacted prices quarter after quarter for the past several years. Surging North American production counterbalanced by OPEC+ production cuts has kept prices in a fairly narrow range. The market has become remarkably resilient. For some time now, long-dated oil futures have traded at a price very close to the market’s view of the break-even price of unconventional oil in North America.
Mercer Capital's Value Focus: Auto Dealer Industry | Year-End 2014Mercer Capital
Mercer Capital's Auto Dealer Industry newsletter provides perspective on valuation issues. Each newsletter also includes a macroeconomic trends, industry trends, and guideline public company metrics.
Today’s Economic Landscape and What’s on the Other SideSavannah Whaley
SPG Trend Advisors is a boutique consultancy that provides global economic research for business and other decision makers. With fifty years combined experience between the principals, and through its website, SPG Trend Advisors provides insightful analysis and forecasting to prepare senior executives for tomorrows trends.
Quarterly analyst themes of oil and gas earnings, Q1 2022EY
Financial questions continued to attract the most attention of the analyst community, with major focus on how companies will respond to the war in Ukraine, elevated commodity prices and improved cash flows. Strategic questions focused on how the changing geopolitical environment will affect capital allocation in the short and long term. Operationally, all eyes were on the capacity of companies to step up asset utilization and bring new projects to market quickly. Explore the latest EY quarterly analysts themes.
SunTrust Chief Economist Gregory Miller Briefs Chamber Members on Economic Trends
Gregory Miller, chief economist at SunTrust Bank, gave the keynote address at the 2015 Economic Outlook Briefing presented by Town of Chapel Hill Economic Development, describing trends and the latest economic issues facing the nation and the region.
As SunTrust’s chief economist, Gregory Miller analyzes the U.S. and global economies and forecasts the U.S. national economy. He advises corporate and bank boards of directors, as well as making frequent presentations to SunTrust business and wealth management clients. He sits on committees charged with interest rate setting, corporate investment, and benefits policy. He is a policy advisor for Private Wealth and Corporate Investment Banking groups.
Mr. Miller comments frequently in business media, including CNBC News, Bloomberg News, Fox Business, Reuters, USA Today, Wall Street Journal, Financial Times, Blue Chip Financial Forecast, and other local news media platforms.
In addition to Miller’s economic forecast, Chamber President & CEO Aaron Nelson presented the results of the Chamber’s annual Economic Conditions Survey, an online survey that gauges our community’s thoughts on the current economy based on Chamber member response.
For more information, visit carolinachamber.org or contact Kristen Smith at (919) 357-9988.
###
The Chapel Hill-Carrboro (NC) Chamber of Commerce is a business leadership organization serving the greater Chapel Hill, NC community. The Chamber serves and supports the business interests of its more than 1,200 members and helps create a sustainable community where they can thrive. Chamber members employ more than 80,000 in the Research Triangle region.
The Deloitte M&A Index is a forward-looking indicator that forecasts future global M&A deal volumes and identifies the factors influencing conditions for dealmaking.
1. Company Overview
Eastman Chemical Company (NYSE: EMN) is a global
specialty chemical company producing a broad range of
advanced materials, chemicals, and fibers, found in a variety
of everyday products. EMN began business in 1920,
originally producing chemicals for Eastman Kodak
Company’s photographic business. It became a public
company on December 31, 1993. EMN now has 45
manufacturing sites in 16 countries, with their largest
headquarters in Kingsport, TN. EMN also has equity interest
in joint ventures that supply chemicals, plastics, and fibers
products to customers worldwide. Eastman is a large
supplier to end markets such as transportation, building and
construction, consumables and tobacco.
Stock Performance Highlights
52 Week High $90.55
52 Week Low $70.38
Beta 1.67
Average Daily Volume 1,426,610
Share Highlights
Market Capitalization $12.46B
Shares Outstanding 148.48M
Book Value per Share $26.04
EPS (ttm) $7.63
P/E Ratio 10.83
Dividend Yield 1.70%
Dividend Payout Ratio 20.0%
Company Performance Highlights
ROA 7.83%
ROE 28.43%
Sales $9.44B
• EMN continues to shift its sales and product mix
towards a greater focus on specialty chemicals. Since
commodity products experience higher volatility, EMN can
stabilize earnings through diversifying its portfolio to further
include greater amounts of non-cyclical specialty products.
• Strategic acquisitions in high growth markets have
provided EMN with opportunities for product innovations
and expanded capacity. Additionally, EMN is set to acquire
Taminco in Q2 2015, which will boost EMN’s growth in
personal care, coatings, and oil and gas markets. EMN can
utilize acquired companies’ expertise in highly specialized
industries.
• Through EMN’s mid-market size, they are able to
offer flexible and customized solutions for their customers,
while also remaining competitive with larger players in the
industry. EMN has the capital and innovative technologies
of a large company, but is able to create modifications to
existing products, meeting customer demands in unique
ways, unmatched by that of larger chemical companies.
• EMN’s Operating Cash Flows in 2013 were $1.3B.
Comparing Operating Cash Flows to Market Capitalization,
Eastman has the highest ratio of its competitors at 11.80%.
A continually strong Operating Free Cash Flow shows
EMN’s core operations are performing well and contributing
to overall company growth.
• EMN is focused on delivering sound returns to
investors. Over the past 5 years, EMN has delivered a return
of 229.03%, compared with the 5-year return of the S&P 500
of 93.03%. Management announced a $1 billion share
repurchase program to be put in place starting in 2014.
Year Stock Performance
Analysts
Maddison Miller
maddison-miller@uiowa.edu
JJ Ohlrich
john-ohlrich@uiowa.edu
Brad Stimple
bradley-stimple@uiowa.edu
Katelyn Wheeldon
katelyn-wheeldon@uiowa.edu
Current Price: $83.95
Target Price: $95.10-$103.54
Stabilization Through
Specialization
Krause Fund Research | Fall 2014
Materials
Eastman Chemical Company
NYSE: EMN
Recommendation: BUY
Figure 1
November 17, 2014
2. Through equity research, and both our intrinsic and relative
valuation, we issue Eastman Chemical Company (NYSE:
EMN) with a BUY rating. After 10 years of strategic
acquisitions to grow into a less cyclical specialized chemical
company, EMN holds leading market positions in 2/3 of its
products. In the future, EMN will experience growth derived
from utilizing the expertise of acquired companies and
growing capacity in high-growth niche markets. EMN is in
a unique position to acquire Taminco, the leader in
alkylamines manufacturing, in Q2 2015, adding value to
EMN’s AFI and A&P segments. EMN is poised to benefit
from higher construction activity and a rebounding
manufacturing industry. The opportunities to realize returns
from EMN’s exposure in niche markets will make the
company’s stock an ideal long-term investment for the
Krause Fund.
We believe there are six macroeconomic indicators that will
influence the future performance of EMN. These economic
drivers are Gross Domestic Product, Interest Rates, Price of
Oil, Price of Natural Gas, the Industrial Production Index,
and Housing Starts.
Gross Domestic Product
Gross Domestic Product (GDP) is an indicator of overall
economic health, representing the total dollar value of
all goods and services produced over a specific time
period, usually expressed as a quarter over quarter
growth percentage. After a lagging Q1 of -2.1% growth
due to harsh winter conditions, U.S. GDP grew by 3.5%
in Q3 2014, as indicated in the chart belowiv. We expect
U.S. GDP to grow 3.3% in the next six months due to a
rebounding labor market and decreased oil prices
influencing consumer spending. In the next 2-3 years,
we expect annual GDP growth of 3.0% due to continued
expansion stemming from heightened U.S. oil
production. The chemicals industry accounts for 2.1%
of GDP and is a cyclical industry, meaning earnings
follow changes in commodities (namely gas and oil) and
end-user demandxxxviii
. EMN’s major end markets
consist of the cyclical transportation, construction, and
consumables industries.
Figure 2
Interest Rates
Materials is a capital and research-intensive sector, and
many firms source capital through debtxli
. EMN is no
exception, with a debt-to-equity ratio of 1.17xxxvii
.
Interest rates have a direct impact on the purchasing and
financing decisions of companies. In a high interest rate
environment a company may refrain from issuing debt
due to higher borrowing costs, thus altering its capital
structure by lowering its debt-to-equity ratio. As interest
rates rise, GDP falls due to the multiplier effect from less
consumers and producers spending money on goods.
Additionally, higher rate levels impact EMN’s demand,
as the majority of EMN’s consumers are highly levered
capital-intensive manufacturing firms.
The Materials sector is currently experiencing
heightened levels of M&A activity, with acquiring
companies becoming highly levered to pay for
acquisitions. This increase in activity can be attributed
to the low interest rate environment enabling companies
to leverage themselves to pay for the acquisition of other
firms. The 10-year yield is an important rate that the
U.S. pays to investors to finance its debt, and is a
benchmark rate for firms seeking to issue debt. As of
November 17, 2014, the 10-year U.S. Treasury yield is
2.32% vii
.
Figure 3
Executive Summary
Economic Outlook
3. Yields are influenced by Federal Reserve monetary
policy. Yields increase when the Federal Reserve
increases its target for the Federal Funds Rate, an
overnight rate used by central banks to make loans to
one another. The Federal Funds rate is viewed as the
base rate of all other interest rates available to
borrowers. The Federal Reserve has been holding the
rate target at a low of 0.25% to encourage business
activity and spur recovery in the wake of the financial
crisis xxx. We expect that the Federal Reserve will begin
to normalize monetary policy starting with an increased
in the Federal Funds Rate target to 1.0% in Q2 2015,
assuming wage growth reaches an optimal level to raise
the inflation rate to the Federal Reserve’s 2.0% targetvii.
By the end of 2016, we predict the Federal Funds target
rate to approach 2.25%. Long-term we predict the U.S.
Treasury yield will approach 5.0% in correlation with
expected Federal Funds Rate increases. Based on this
assumption, we foresee lessening M&A activity in
chemical industry. As financing becomes more
expensive, companies will shift away from inorganic
growth, which requires higher levels of debt, and more
towards organic growth.
Price of Oil
Oil is a major component of EMN’s production costs,
comprising approximately 25.0% of raw materials input
costsxv. The price of oil is extremely volatile due to new
technological developments, political events, and global
economic performance.
The U.S. is currently the third largest oil producer and is
quickly catching up to Saudi Arabia, the second largest
producer. U.S. oil production is at a 30-year high, having
risen by 1 million barrels per day (bbl/d) for the past year
due to strong oil prices. However, this production boom has
led to excess supply and decreased oil prices. As of
November 17, 2014 West Texas Intermediate (WTI) was
$75.82/barrel, coming back from a four-year lowlviii
. U.S.
shale production reached 9 billion barrels per day bbl/d for
the first time since 1986lv
. Lower prices may lead to less
investment in U.S. shale in 2015xliii
. There is uncertainty
surrounding the amount of U.S. shale reserves and how long
they will be operational.
Moreover, OPEC faces challenges derived from prices
below $100/barrel, posing questions on whether they will cut
production to boost the price per barrel, or continue
operating at current levelsxxxiv
. We believe that OPEC will
cut its production after its meeting at the end of November.
Due to the increase in U.S. production, we foresee OPEC
becoming less of an influence on oil prices. Although OPEC
producing countries will likely cut production, we believe
the current surplus in supply will continue to increase in
2015 due to further increases in U.S. production. We agree
with the EIA outlook that forecasts U.S. oil production
reaching 9.4 bbl/d in 2015. We predict a slightly higher price
of $78/barrel by January 2015, assuming OPEC cuts output.
Within the next six months we see prices approaching
$80/barrel.
Figure 4
Price of Natural Gas
Natural gas demand is based upon commercial and
residential use. Natural gas experiences seasonality through
higher use in the winter months as a source of heat. The
Henry Hub spot price averaged $3.78/million British
Thermal Units (MMBtu) in October of 2014lv
. Natural gas
production is predicted to increase from 2.6 million bbl/d to
3.2 million bbl/d in 2015lv. We agree with the EIA that
natural gas prices will rise slightly to $3.97/MMBtu in Q1
2015 due lower expected global demand for heating and an
increase in production. Longer term, we predict a depressed
price until 2018.
Figure 5
Natural gas makes up 50% of EMN’s energy supplyxxiii
. If
U.S. liquid natural gas values rise relative to the price of oil,
EMN profitability would narrow due to EMN’s largest
facilities being equipped to operate using natural gas. In
fact, a change of $1 in natural gas prices would have an EPS
impact of $0.31lvii
. While other companies in the chemical
industry have shifted facility capabilities towards ethane, a
cheaper raw material, EMN continues production at their
current facilities, which only have the ability to process
propane. EMN is currently the only facility left on the U.S
4. Gulf Shores that is solely propane operated. The following
chart compares the volatility in propane vs. ethane marginsiii
.
Figure 6
Industrial Production Index
The Industrial Production Index (IPI) measures the output
and capacity utilization of the mining, manufacturing,
electric, and gas industries ixxx
. The IPI measures real output,
expressed as a percentage in the base year, which is currently
2007v
. The IPI can be an indicator of future inflation and can
define turning points in the business cyclev
. The IPI was at
104.9 for October 2014, down 0.1% from September 2014
but 4.0% above October 2013vi
. The slight decline can be
attributed to the decrease in capacity utilization from 79.2%
in September 2014 to 78.9%. Despite this minor recess,
capacity utilization has grown by 3.0% over the last 12
monthsvi
. We estimate that the IPI will have slightly
increased to 105.1 in two months due our belief that the U.S.
economy will continue to improve, resulting in greater
demand for manufactured goods. In the next six months we
foresee the index slightly lower at 103.4 because of Europe’s
low inflation causing U.S. exports to be more expensive,
leading to lower global demand for U.S. products. Almost
half of the output of the chemicals industry goes to U.S.
manufacturing for use as raw materials in production, while
the remaining output is exported globallyxxxviii
. The state of
the manufacturing industry impacts EMN’s earnings since
EMN’s demand is derived from its manufacturing
customers.
Figure 7
Housing Starts
A housing start is registered at the start of construction of a
new building intended primarily for residential useiv
.
Construction is EMN’s second largest end market,
comprising 16.0% of total sales revenuexiv
. EMN’s AFP
segment provides chemicals used in the manufacturing of
paint, which is driven by the amount of construction activity.
Housing starts dramatically declined from 2006 to 2008, and
are now seeing a pickup in activity. Housing starts have been
volatile as of recent. September 2014 housing starts
increased by 6.30% after an August decline of 12.80%iv. In
the coming months, we estimate that housing starts will
decline to a level of 800 due to the expectation of another
harsh winter similar to that of 2013. We foresee housing
starts increasing once again to a level of 1000 at the end of
Q2 2015 when building conditions will be more favorable.
We do not expect starts to increase to pre-2006 levels of an
average of 2000 each month before 2019.
Figure 8
Since the materials sector moves cyclically with the U.S
economy, a stronger economy provides opportunity for
growth within the materials sector. Given the current growth
rate of real GDP around 3.5%, the outlook for the material
sector is positiveiv
. Additionally, the Materials sector
reported the third highest earnings growth at 16.5%, further
enforcing the strength of the sectorviii. The S&P 500
Materials experiences growth in line with the broad S&P
500, with a 13.03% and 16.81% one year return respectively.
The following chart shows the historical prices of the indices
over the past five years.
Figure 9
The U.S. is seen as being in the middle of the Expansionary
(Mid) period of the business cycle and heading into the
contractionary (Late) period. Materials have historically
underperformed during the mid-period and over performed
during late period due to their ability to remain relatively
stable compared to other sectorsxxvii
. We believe that
Capital Markets Outlook
5. Materials will likely underperform until mid-2015 and begin
to over perform beginning in 2016.
Industry Overview
The materials industry can be broken down into the
following industry groups, according to the Global Industry
Classification Standard:
• Chemicals – Commodity Chemicals, Diversified
Chemicals, Fertilizers and Agricultural Chemicals,
Industrial Gases, and Specialty Chemicals
• Construction Materials
• Containers and Packaging – Metals and Glass
Containers, and Paper Packaging
• Metals and Mining – Aluminum, Diversified Metals and
Mining, Gold, Precious Metals and Minerals, and Steel
• Paper and Forest Products
The Materials sector makes up 3.5% of the S&P 500 Index,
as of November 17, 2014il.
Figure 10
Sub-Industry
Diversified chemicals is a sub-industry that focuses
operations on converting raw materials and/or feedstocks
derived from oil, natural gas, metals, materials, and air into
more valuable products used in industrial and consumer
marketsxxxviii
. This industry is currently in the mature
lifecycle stage because of the amount of consolidations
within the industry, consisting mainly of established firms
acquiring specialty firms as a way to gain market share.
Additionally, diversified chemicals is cyclical in nature due
to the cyclical nature of its main consumers in the
construction, automobiles, and industrial manufacturing
industries. The level of concentration in diversified
chemicals is low, with the top three players accounting for
less than 5.0% of total industry revenue thus far in 2014xxxviii
.
Diversified chemicals is a fragmented sub-industry
comprised of both large and small players that offer a variety
of products. EMN is considered a medium-size company
within the industry, as it competes against both niche
specialty companies and large commodity companies.
Product Lines
The diversified chemicals sub-industry is comprised of
commodities and specialty companies. Commodities are
characterized by having higher volume of capacity due to the
greater need for commodities across a broad range of
industries. Specialties have a focused market, resulting in
lesser demand and lower volume of capacity than
commoditiesxxxviii. Products are classified according to
consumer use into the following lines: petrochemicals,
plastics, chlor-alkalis, and fertilizers. Major end markets that
use chemical products include construction, automobiles,
agriculture, and industrial manufacturing.
Recent Trends and Developments
The diversified materials industry has witnessed increased
demand from emerging markets, heavy consolidation, and
stringent environmental regulation.
Emerging Markets
As the graph below indicates, by 2020 it is expected that the
percentage of global demand for chemicals will increase for
emerging markets, with a significant increase in demand
from China. Demand will increase in emerging markets due
to the growing middle class having greater purchasing
ability. Increased demand will cause an increase in the
production of consumer products that use chemicals as an
input. Many players, including EMN, are investing in and
moving production facilities abroad to capitalize on the
faster growth and lower costs associated with certain end
markets.
Figure 11
Consolidation
Since the global recession, there has been an upturn in
consolidation activity amongst industry players. EMN has
contributed to this activity by acquiring Solutia in 2012 and
engaging in numerous global joint ventures. When
companies merge they can create synergies that reduce
operating costs and achieve greater efficiencies in
procurement of materials and logisticsxxxviii. Consolidations
offer an alternative way to using capital to build large-scale
plants. A trend in the industry is to divest commodity
product lines and focus on more specialized high profit
margin segments. EMN did this in 2012, when it divested its
Performance Polymers division.
Government Regulation
The Chemicals industry is subject to strict rules regarding
greenhouse gas (GHG) emissions and toxic waste. Such
regulations include the Clean Air Act, Clean Water Act, and
Resource Conservation and Recovery Act. Chemical
41%
23% 20%
9% 7%
49%
20% 16%
8% 7%
0.0%
10.0%
20.0%
30.0%
40.0%
50.0%
60.0%
Percentageofglobal
chemicaldemand
2010 2020
Industry Analysis
6. producers have incurred major costs for compliance and to
develop strategies to reduce, treat, and dispose of hazardous
wastexxxviiii
. In fact, the industry has implemented the
Responsible Care Program to improve its image and avoid
further costly regulations. This initiative supports
continuous improvement in health, safety, and
environmental performance combined with transparent
shareholder communicationxxxi
. A commitment to the
program allows players to focus on continuous
improvements and avoid expensive disasters. Members in
compliance account for 90% of global chemical salesxxxi
.
EMN is a member of the program, and was named the 2013
Responsible Company of the Yearxiv.
Markets and Competition
To determine industry leaders it is pertinent to examine the
company’s capacity utilization, product mix, and research
and development (R&D) initiatives. Capacity utilization is
critical, as chemical companies have high fixed costs. Using
the most of capacity results in greater operational
efficiencies, as greater capacity usage brings a company
closer to its production potential. Major players in the
diversified chemicals industry offer a wide range of products
that can be used by a variety of end markets. Industry leaders
offer substitutable products, mitigating the chance that a
consumer will switch to a competitor due to lack of product
offeringsxxxviii. R&D is critical for continued growth of a
company, as current product lines can become overtaken by
competitors in the future. Leaders with stronger R&D
capabilities can develop sophisticated technology that allow
for strengthened sustainable operations in compliance with
governmental regulation. Furthermore, an important feature
of the industry is the relationships between
suppliers and consumers. The industry continues to create
innovative products to solve consumers’ complex problems
Consumers often need specialized products and work with
suppliers to create products that meet their needs. Leaders
with the greatest R&D capabilities are able to create such
customized solutions because they have the resources to
conduct research to determine viable options for consumers.
Below is a graph showing the 2013 R&D expense to sales
ratio. EMN is competitive compared to similar firms.
Figure 12
Porter’s Five Forces
1.) Industry Competition: STRONG due to commodity
inputs being available from limited sources. Competition is
cost-driven, leaders in the industry are those who can utilize
capacity and implement cost-saving strategies.
2.) Threat of New Entrants: WEAK due to the high start-up
costs associated with the capital-intensive nature of the
industry and high government regulation. Players need to
have significant amounts of capacity to remain competitive
with major players who utilize large capacities to create
economies of scale.
3.) Threat of Substitutes: WEAK due to chemicals being a
fundamental raw materials input of a variety of downstream
consumers. Further, buyers often require chemicals with
specific composition. If a choice exists among products, it is
likely that the same player manufactures them.
4.) Bargaining Power of Suppliers: MODERATE due to
reliance on commodities that are available through few
large-scale oil and gas and mining companies. However, raw
materials are undifferentiated and price is a major factor
when players choose a supplier.
5.) Bargaining Power of Consumers: MODERATE due to
the majority of customers being large firms with modest
negotiating and financial positions. However, the use of
long-term contracts deters consumers from incurring early
termination costs to switch suppliers.
Diversified Chemicals Leaders
The chart below shows a relative comparison of the leading
firms within the Diversified Chemicals sub-industry.
Figure 13
In terms of market capitalization, there exists a wide range
in the size of players. Market capitalizations differ due
differences in variety and types of products offered to
diverse end markets. DD and DOW have a strong focus on
agrichemicals, while EMN focuses more on plastics and
fibers.
In comparing P/E ratios, EMN appears to be cheaper relative
to its competitors. All players listed are slightly below the
industry average P/E ratio of 16.7 xxxvii. Similar P/E ratios
signal that the players are in the same life cycle stage and
have relatively similar growth expectations.
EMN, DOW, and CE have debt-to-equity ratios that are
higher than the industry average of 0.86xxxvii
. EMN’s debt-
to-equity ratio is significantly higher than its competitors,
2.06%
1.31%
3.06%
5.96%
2.48%
0.00%
1.00%
2.00%
3.00%
4.00%
5.00%
6.00%
7.00%
2013R&DExpensetoSales
Ratio
Mkt Cap P/E 15 D/E (mrq) ROE (ttm)
EMN $12.5B 9.7 1.17 28.43%
DD $64.41B 15.6 0.59 20.90%
DOW $59.96B 14.9 0.87 15.47%
ASH $7.99B 12.7 0.65 1.77%
CE $9.18B 10.7 0.90 52.35%
7. with the exception of CE. EMN is heavily levered as it has
been engaged in acquiring product lines and entire
companies and still has $985 million in debt from its Solutia
acquisition. EMN is exposed to greater interest rate risk than
less levered competitors with a larger proportion of equity
financing in their capital structure. EMN has emphasized
that it is committed to returning profits to shareholders
through repurchases and dividend payouts, which will shift
the debt-to-equity ratio and likely result in a lower cost of
borrowing.
There is a wide range of ROE amongst the players. The
industry average ROE is 20.9% xxxvii. With the exception of
CE and ASH, all players are in line with the industry
average. This is a signal that these leading players have the
capabilities to deliver solid returns to shareholders. We
anticipate EMN’s ROE will grow in the future as it uses its
innovative capabilities to develop products in new markets
that it has gained exposure to through recent acquisitions.
Sub-Industry Outlook
The U.S. economy is expected to continue its recovery
through projected growth of 3.1% in 2015xxxii. Growth
forecasts for the diversified chemicals industry are aligned
with U.S. growth projections. Industry revenue is expected
to grow at 3.1% annually through 2019 to $171.7
billionxxxviii. Lower energy prices will benefit the industry,
but players who act as suppliers to oil producers will
encounter challenges ahead if the price of oil drops below
what is needed for oil producers to remain profitable,
presumed to be $70/barrelxlvii
. Continued growth in
international demand will further focus players to diversify
into emerging markets. Demand in Asia will continue to be
greater than demand in developed countries.
Eastman Chemical Company (NYSE: EMN) is a global
specialty chemical company producing a broad range of
advanced materials, chemicals, and fibers. EMN products
can be found in a variety of everyday products, including
plastic packaging, automobile parts, food, clothing, and
tobacco. EMN began business in 1920, originally producing
chemicals for Eastman Kodak Company’s photographic
business. EMN became a public company on December 31,
1993. EMN is incorporated in Delaware and headquartered
in Kingsport, TN. EMN serves customers in over 100
countries through its 45 manufacturing sites in 16 countries.
The company is focused on growing capacity, expanding
distribution, and accessing high-growth end markets through
acquiring companies and establishing joint ventures. In
2012, EMN acquired the plastics company Solutia giving it
greater access to Asia and Latin America. EMN is currently
in negotiations to acquire Taminco, the world’s leading
producer of alkylamines. EMN will be able to further
develop its product mix by utilizing the niche industry
expertise of acquired companies while providing its own
innovative capabilities.
Corporate Strategy
EMN is focused on continuing to develop its business to
focus on high-value and diverse portfolio of specialty
products that can consistently deliver increased earnings and
free cash flows at rates greater than GDPxviii
. EMN seeks to
develop by concentrating on three core strategies relating to
innovation, productivity, and product portfolio.
Sustainable Innovation
Consumers are seeking ways to enhance performance and
durability while improving environmental and safety
characteristics. EMN is on track to meet its 2015 goal to have
2/3 of revenues from new product launches that are from
sustainability advantageous products. EMN currently stands
with 60% of new product revenue coming from products
meeting the sustainability standards. In 2013, EMN
introduced six new sustainably advantageous productsxxii
.
Productivity
EMN recognizes that its manufacturing processes require
significant amounts of energy, and is working to develop
more sustainable energy methods while growing capacity.
EMN is committed to reducing its energy intensity by 20%
and hazardous waste by 15% by 2020. EMN’s commitments
resulted in 2013 energy savings of more than $3 million. For
the third consecutive year, EMN was named an ENERGY
STAR Partner of the Year by the EPA.EMN is the only
chemical company to receive the award more than once xxxii
.
Product Portfolio
EMN currently has a leadership position in product lines that
generate 2/3 of its revenues, and strives to develop higher
leadership in both its remaining current and future lines xiv
.
EMN strives to expand its product portfolio through greater
expansion into specialty markets via acquisitions and joint
ventures, in addition to strong organic growth. Recent
acquisitions, including the acquiring of Commonwealth
Laminating & Coating, have allowed EMN to expand
product offerings and improve manufacturing efficiencies
while accessing the expertise of acquired companies.
Financial Summary
Through the Solutia acquisition, EMN has grown EPS to
levels that the company has never before experienced. 2013
EPS were $7.93, compared with the five year average of
$3.22. EMN continues to deliver returns to shareholders
through stock repurchases of $238 million in 2013 and
increasing cash dividends over the last three years. EMN’s
Board of Directors approved a $1 billion share buyback to
be fulfilled in the coming years. EMN’s debt-to-equity ratio
is higher than the industry at 1.17 due in part to $985 million
left in long-term borrowings related to the Solutia
acquisition in 2012. However, this high ratio should not raise
concern of EMN’s ability to make payments due to the
company’s strong operating cash flows of $1.3 billion. In
fact, EMN has historically repaid debt early, with early
repayments of over $500 million in 2010 and 2013. The
chart below highlights key financial metrics for the past four
years. It is apparent that the Solutia acquisition in 2012 had
Company Analysis
8. a significant impact on the company’s financials, primarily
operating cash flows and debtxiv
.
Figure 14
Product Lines
EMN divides its products into five reportable segments. The
chart below details the 2013 revenue by segment. EMN
ranks first or second in all product lines.
Figure 15
Additives & Functional Products (AFP)
Manufactures chemicals for products in the coatings and tire
industries. Major end markets include transportation,
construction, durable goods, and consumables. AFP sales
have grown by over 25% in both 2011 and 2012 due to
adding greater volume of products from Solutia and organic
growth through a 40 million pound feedstock capacity
addition in the Longview, Texas plant. During 2014, a
rebound in the U.S. construction market has grown AFP
revenues by 3.0% over the same time period in 2013xviii.
Adhesives & Plasticizers (A&P)
Focuses on manufacturing intermediate chemicals rather
than finished products. Adhesive resins and plasticizers
manufactured are used by EMN customers to manufacture
products sold in the consumables, health, and construction
industries. EMN is the world’s largest non-phthalate
plasticizer manufacturer and ranks second in production of
adhesives resins. Thus far in 2014, higher capacity
utilization and stronger end-market demand for packaging
products have increased sales by 4.0% over the same period
in 2013xviii
.
Advanced Materials (AM)
Produces specialty co-polyesters, cellulose esters,
interlayers, and aftermarket window film products to end
users in transportation, consumables, durable goods, and
health.AM grew the most over the past four years, with
growth over 39% in both 2012 and 2013, due to EMN
providing customization of window films used in the
manufacture of automobilesxiv
. The automobile
manufacturing industry experienced increased U.S. sales
due to low interest rates making financing options more
affordable for consumersxlv.
Fibers
Manufactures acetate tow, acetate yarn, and plasticizers for
end market use of manufacturing of cigarette filters, apparel,
home furnishings, and industrial fabrics. EMN has been a
leader in acetate manufacturing for over 75 years and has
established long-lasting customer relations. Currently, EMN
is the second largest supplier of acetate tow and the world’s
largest producer of acetate yarnxiv. China’s smoking
population is the highest in the world, with 300 million adult
smokers. EMN’s long-standing relationship with China
National Tobacco Corporation, the Chinese government-
owned body that controls the Chinese tobacco industry, is a
fundamental gateway to the Chinese marketxxiv
.
Specialty Fluid & Intermediaries (SFI)
Produces heat transfer and aviation fluids, olefins, and
chemical and polymer intermediaries for the industrial
chemicals, construction, and agriculture industries. EMN
possesses large capacities and vertical integration that allows
for a leading market position in the majority of SFI core
products. The addition of Solutia’s products increased 2011
and 2012 revenues by 7.0% and 8.0%, respectively. The
2014 purchase of BP’s aviation turbine oil products division
helped boost Q3 sales by 5.0% over Q3 2013xviii
.
The following chart shows how each segment comprised
total revenues for the past four years, and projections going
forward. 2015 includes the Taminco acquisition, which will
primarily impact AFP and SFI. For a detailed analysis of
revenue growth through 2019, refer to Revenue
Decomposition under Key Assumptions in Valuation
Summary.
Figure 16
Markets & Distribution
The chart below shows a breakdown of EMN’s end markets.
Major markets are transportation, construction,
consumables, and tobacco.
Financial Summary 2013 2012 2011 2010
Revenue 9.358B 8.064B 7.178B 5.798B
Operating
Cash Flows 1.297B 1.128B 625M 575M
Debt 4.254B 4.779B 1.445B 1.598B
EPS 7.93 2.92 4.56 2.96
9. Figure 17
EMN breaks down operations into four key markets: Latin
America, Asia Pacific, North America, and Europe, Middle
East, and Africa (EMEA). As detailed below, North America
accounted for 46% of revenue in 2013. EMN has a strong
presence in North America due to being headquartered in the
U.S. and the region being very developed and in need of
sophisticated chemical products that EMN produces.
Figure 18
Although North America accounts for the largest portion of
revenue, EMN’s growth has shifted from North America to
fast growing markets. As shown at the top of the next
column, EMN significantly grew in the Asia Pacific region
in 2012 and 2013 primarily due to the Solutia acquisition.
Continued growth in the Asia Pacific region is expected due
to a growing middle class demanding more products that
require chemical inputs. Further growth in emerging markets
will ease the dependence and concentration of revenues in
North America that are contingent on the economic and
regulatory conditions of the region.
Figure 19
Suppliers
EMN has 6,500 global suppliers that provide the company
with raw material inputs, materials for manufacturing and
updating facilities, and distribution services. No one supplier
accounts for a large portion of services or products to
EMNxxxiv.
Management
In June 2014, Mark Costa assumed the position of Chairman
and CEO. Costa has been with EMN since 2006, serving as
Vice-President of Strategy, Marketing, and Business
Development with a focus on A&P and AM. Costa is a key
element in EMN’s continual shift toward a sustainable
specialty chemical company through acquisitions and
portfolio expansion. Former Chairman and CEO James
Rogers currently serves as Executive Chairman of the
Boardxiv.
Major Shareholders
Below is a chart detailing the top five shareholders.
Ownership is comprised of 87% institutional and 42%
mutual fundsxxxvi
. No activist investors own EMN stock.
Figure 20
Research & Development
EMN focuses on working with customers, chemical experts,
and academics to create new innovations in developing
products to fulfill customer needs. EMN continually
explores and invests in R&D initiatives that are aligned with
sustainability, consumerism, and energy efficiency. The
Eastman Innovation Lab is a platform that helps customer
create solutions to complex problems by combining EMN
technology and expertise with customer inspiration.
Additionally, EMN partners with various universities to
fund research in chemistry and materials sciences to gain
access to the latest innovations in chemical sciencesxxii.
EMN has a diverse set of products and technological
innovation initiatives that management expects to contribute
29%
16% 18%
11%
4%
24% 19% 29%
7%
24% 23% 21%
0%
10%
20%
30%
40%
US & Canada Asia Pacific Europe, Middle
East, and Africa
Latin America
Change in Revenue Growth (Year over Year)
2011 2012 2013
10. to profitable future growth and sustained leadership
positions.
Divestitures
EMN sold components of its Performance Polymers
segment from 2006 to 2011. Performance Polymers
produced chemicals used mainly in packaging applications
and beverage containers. In 2011, EMN completed the sale
of its Performance Polymers segment to DAK Americas,
LLC. Cash proceeds from the sale were $615 million.
Performance Polymers had been underperforming before
EMN took strategic actionxxi. Selling the segment not only
protected EMN from underperformance, but also moved the
company forward in its quest to develop into a specialty
company.
Acquisitions
EMN has focused on developing into a specialty chemicals
company through 26 strategic acquisitions, including three
100% ownership transactions, over the past ten
yearsxxxiii
.The company completed the acquisition of Solutia
in 2012 and is currently in the process of acquiring Taminco
(NYSE: TAM).
Solutia
In July 2012 EMN completed a $4.8 billion acquisition of
Solutia. The deal was financed through a $1.2 billion term
loan of debt issuance, $700 million of EMN stock, and
assumption of $1.5 billion of Solutia’s debt. Solutia
shareholders received $22 in cash and 0.12 shares of EMN
common stock. EMN captured tax advantages in the form of
$1.3 billion in Net Operating Losses (NOLs) from Solutia.
EMN also recognized $2,230 million in goodwill and $100
million in cost synergiesxiv
.
Solutia manufactures specialty chemicals used in auto glass
and films, in addition to other productsxlvi
. The acquisition
primarily impacted the AM, AFP, and SFI segments and
Asia Pacific and Latin America regions. The acquisition
gives EMN an enhanced global platform for organic growth
in key high-growth markets via technological and business
capabilities.
Taminco
In September 2014, EMN agreed to buy Taminco in a $2.8
billion deal. EMN will assume $1 billion of Taminco’s debt.
EMN has proposed a $26 share price to Taminco
shareholders. To pay for the acquisition, EMN has proposed
a debt offering that consists of the following notes.
Figure 21
The offering is expected to close on November 20, 2014. If
EMN is unable to complete the acquisition by May 20, 3015
or if the merger agreement is cancelled, EMN will be
required to redeem all of the outstanding 2020 and 2025
notes at 101% of the principal amountsxvi
.
The vertical acquisition will provide EMN with greater
access to non-cyclical niche end markets of agriculture,
coatings, and oil and gas that are gaining from the trends of
a growing world population, demand for high-performance
products, and energy efficiencylvi
. Taminco is a supplier to a
variety of companies that are leaders in their respective
industries, including Halliburton, Dow Chemical, and
Procter and Gambleli
. Additionally, EMN can leverage
advantages created by shale gas by the addition of
methylamines to its portfolio. Taminco is the largest global
player in functional alkylamines market. EMN will gain
access to Taminco’s 50% market share in methylamines
capacity in North America and Europe. Displayed below is
a chart highlighting how Taminco’s portfolio will affect
revenues by marketiii
. EMN’s revenues will still be heavily
skewed toward construction, transportation, and tobacco.
Taminco’s products will grow in the energy, fuels, and water
segment from representing 3.0% of revenues to 5.0%.
Figure 22
EMN expects to realize synergies equal to 5% of Taminco’s
2013 sales over two years ($60 million). Management has
projected a free cash flow in the two years following the
acquisition of $1.5 billion and EPS accretion of $0.35 in
2015xxi. The acquisition will grow the AFP and SFI
segments by 8.62% and 8.54%, respectively. North
America, Asia Pacific, and EMEA will be the regions that
will grow from the acquisition. For further information
regarding our projections for EMN with Taminco, please
refer to Effect of 2015 Acquisition of Taminco under
Valuation Analysis.
New Innovations
EMN has undergone dramatic change in the past 10 years,
growing through acquisitions and restructuring changes.
EMN will begin to realize organic growth through product
line expansions and greater capacity utilization and
expansion. EMN can begin to truly leverage the expertise of
acquired companies and to develop a strong foothold in
high-growth end markets.
Maturity 2020 2025 2044
Amount $800M $800M $400M
Coupon 2.70% 3.80% 4.65%
Catalysts for Growth & Change
11. Commodity to Specialization
EMN predicts Commodities to comprise 13% of earnings
in 2014, which is a 4% decrease from 2010iii. Shifting focus
from commodity products to specialties provides an
opportunity for growth within EMN. As commodity
products experience higher volatility, EMN can stabilize
earnings through a more specialized approach. During
2008-2009 EMN earnings declined 40%, had EMN’s
portfolio in 2008 reflected EMN today, the decline would
have been only around 20%lvii.
Emerging Markets
EMN’s presence in emerging markets has increased over the
past five years due to strategic acquisitions and joint
ventures, most notably from Solutia. EMN will be the
world’s largest supplier of hydrogenated carbon resins after
the completion of its joint venture facility in China. China,
while currently underperforming in growth compared to
expectations, is still projected to grow at an annual rate of
over 7.0% in the next two yearsxxxii
. China’s growth over
developed nations allows EMN to capitalize on China’s
needs for construction and consumer durables.
Growth in Construction
The U.S. housing market is expected to grow by 8.0% in the
next five yearsxxx
. EMN is in a favorable position to
capitalize on such growth through its leadership in chemicals
used in paint and coating products in the AFP segment.
Investment Positives
• Acquiring Taminco will cause EMN to be less
cyclical than it has been historically due to
Taminco’s non-cyclical end markets for products
• Market has not fully accounted for EMN’s
progression toward a specialty company and still
views it as a primarily commodity company. EMN
has developed less of a reliance on its commodity
business and more of a focus on higher EBIT
margin businesses
• Strategic acquisitions have given EMN a strong
presence in high-growth emerging markets where
EMN can use its innovative capabilities to deliver
new products
• Diversified, mature company ahead of curve for
industry players only recently switching to a
specialty-focused business. EMN has been
strategically changing its business from a
commodity for past 10 years and has thus far been
successful.
• Historic ability to repay debt early
• Lower P/E than comparable firms
• Pullback in stock price from Kingsport shutdown
makes it an ideal time to buy and realize expected
returns
• Strong operating cash flows of $1.3 billion give
EMN opportunities to invest in R&D, pay
shareholders, and pay off debt
• Economies of scale
Investment Negatives
• Derived demand mainly from manufacturing,
particularly in the U.S., makes EMN’s demand
subject to changes in demand for industrial
products. Europe is experiencing low inflation,
making U.S. goods more expensive. This will
negatively impact industrial production in the U.S.
• Last remaining facility on the U.S Gulf Coast to
operate solely off of propane – higher cost of input
negatively impacts COGS and earnings compared
to competitors using lower cost inputs
• EMN is reliant on oil, natural gas, and feedstock
prices for inputs. Futures for crude oil and natural
gas are opposite of what is needed by EMN. The
spread between the Henry Hub spot price and WTI
crude is shrinking.
• Strict government regulations regarding
environmental emissions. It is likely that there will
be an increase in future costs to comply with stricter
regulations. However, EMN’s commitment to being
a leader in sustainable operations could potentially
mitigates their overall risk to changing government
regulations
• Disappointing outlook for China with growth
expected to be under 8.0%
• Currently almost 50% of sales come from North
America, namely U.S. giving EMN greater
exposure to risks associated with U.S. economic
wellbeing
• Expected increase in interest rates in coming years
• Volatile housing market
• Potential risk of not fulfilling acquisition of
Taminco
• Increased leverage enhancing risk of EMN
Valuation Summary
After extensive analysis of EMN, we have issued a BUY
recommendation under the belief that the stock is currently
undervalued. This recommendation is based on intrinsic
value outcomes of the discounted cash flow (DCF) model,
economic profit (EP) model, dividend discount model
(DDM), relative valuation P/E ratio, and the P/E growth
ratio. Our model estimates EMN’s stock price as of
November 17, 2014.
The DCF and EP yield identical intrinsic stock prices of
$98.76. The DDM yields an intrinsic stock price of $71.27.
The relative valuation gives a stock price between $103.54
and $117.99 based on the P/E ratio for 2014 and 2015, and
Investment Positives & Negatives
Valuation Summary
12. $83.82 and $95.10 based on the P/E growth ratio for 2014
and 2015.
Key Assumptions
Revenue Decomposition
We began our valuation by making critical assumptions
about the future growth of EMN. We projected revenues in
EMN’s AFP, A&P, AM, Fibers, and SFI segments through
2019 based on our short and long-term economic
assumptions, management guidance, and the impact of the
Taminco acquisition. We forecasted six years of revenue
under the assumption that EMN would reach steady long-
term growth of 3.24% in the year 2019. We feel that 2019
is an appropriate year to end our forecast period because
Taminco is the sole future acquisition in our forecast and
after the acquisition EMN will focus on organic growth
throughout the duration of our forecast period. By 2019,
EMN will have reached stable growth slightly above GDP
from organic growth, including adding capacity and
expanding product lines.
Due to the acquisition of Solutia, prior to 2012 EMN
reported earnings in four segments, varying slightly from the
current segments. Revenue by segment from 2010-2012 was
retrospectively applied to reflect the company’s new
reporting segments. In order to project future revenues, we
relied heavily on forward looking guidance from
management, overall economic outlook, future growth of the
chemical industry, and historical revenues by segment from
2010-2013. EMN experienced unique growth from 2012-
2013 due to the acquisition of Solutia. Revenue growth in
these years were not indicative of future growth, therefore
we utilized Q3 2014 revenues as a best predictor of the
company going forward. We determined 2014 revenues
represented a normalized growth that reflects the current
product portfolio. To help determine revenues for FY 2014,
we annualized EMN’s Q3 segment revenues. We then
projected organic growth rates for our forecast period. We
determined growth based on the following key assumptions
surrounding each segment:
Segment Assumptions
AFP • CAGR: 8.62% (4.6% without
acquisition)
• Housing market in U.S. growth of
8.0% from 2014 to 2019
• Growth in automobile manufacturing
of 4.9% in U.S. through 2019
A&P • CAGR: 4.5%
• Expansion into China through joint
venture that would make EMN
largest supplier of hydrogenated
carbon resins (used in products that
absorb liquids)
AM • CAGR: 4.4%
• Benefitting most from increased
R&D and EMN goal of 2/3 of new
products classified as sustainably
advantageous
• Continue to grow as leader through
gaining market share
Fibers • CAGR: 1.0%
• Maintain steady growth after
completion of new Chinese acetate
tow factory opens in 2014
• Smoking demand in China stays
stable in midst of economic growth
slowing through forecast horizon
SFI • CAGR: 8.54% (4.9% without
acquisition)
• Growth consistent with industrial
manufacturing output, which we
expect to rise in short-term
• Continued expansion of capacity and
use of R&D to introduce new
products through 2019
2015 revenues were then adjusted to reflect the acquisitions
of Taminco that is expected to close in May of 2015. See
Effect of 2015 Acquisition of Taminco for details regarding
assumptions made in the Taminco acquisition.
By 2019, we expect EMN to reach a steady state growth rate
of 3.24% reflecting predictions of overall economic growth
at that time. EMN remains committed to growing revenues
at a rate higher than GDP, therefore our CV growth rate
reflects a slightly higher growth rate than our predictions of
long term GDP growth of 3.0% xiv
. We project the company
to grow 4.80% in 2014 before 15.72% growth in 2015 due
to the Taminco acquisition. After 2015, we project revenues
at a slightly higher pre-acquisition level of 4.35% based on
the assumption that inorganic growth from the acquisition
will continue be realized in 2016. As the 2019 CV is
approached, we presumed revenue growth would begin to
reflect only organic growth. While EMN will continue to be
dependent on the economic health of the world, with heavy
influence from North America, revenue growth rates after
2016 will be less cyclical due to the non-cyclical behavior of
Taminco’s business model.
Critical Assumptions
Cost of goods sold (COGS) is projected as a percentage of
total revenue. EMN experienced higher profitability, and
lower COGS in 2013 as a result of managerial efforts to
enhance energy efficiency by 20% by 2020 and the
realization of synergies from the Solutia acquisition. Based
on more efficient operating strategies, lower oil prices, and
expected product integrations and synergies from
acquisitions we believe EMN will maintain a COGS lower
than the historical five-year average of 72.0%. However, we
believe COGS will increase from its 2013 historically low
level of 65.0% due to increased propane costs and Taminco’s
higher COGS level of 82.0%. Based on our assumptions, we
project COGS to be 69.0% of total revenue.
13. Gross property, plant, & equipment (PP&E) was projected
by management guidance of capital expenditures for 2014.
We determined PP&E by projecting capital expenditures at
EMN’s historical average of 6.50% of sales. We forecasted
depreciation expense by calculating a historical average of
8.20% of gross PP&E. Depreciation expense was then
added to accumulated depreciation. We then netted gross
PP&E with accumulated depreciation.
Amortization of intangible assets is forecasted at $79 million
each year. This was determined by consulting management
guidance surrounding the amortization of intangibles. We
are assuming no further purchases of intangibles beyond
2015 due to management guidance stating that amortization
of intangibles will be constant for the foreseeable future.
Stock repurchases are forecasted using management
guidance that $410 million in share repurchases will take
place in 2014, followed by $1 billion in the following years.
We estimate no share repurchases will take place in 2015 due
to the need of cash for the acquisition. EMN will then
repurchase a total of $1 billion worth of shares between 2016
and 2017.
Effect of 2015 Acquisition of Taminco
EMN is expected to complete the acquisition of Taminco in
May 2015. Our base forecast was made absent of the
acquisition. The following accounts were adjusted for the
acquisition:
Revenues
We assume the acquisition will increase base forecast
revenues by $1.4 billion. The incorporation of Taminco’s
portfolio will be most impactful to AFP and SFI, with
revenue increasing to a CAGR of 8.62% and 8.54%,
respectively, over the forecast horizon. Accounting for both
organic growth and additional revenue derived from
Taminco, we project growth of 15.72% in 2015.
Long-term Borrowings
Long term borrowings increased by $2 billion, to reflect the
debt needed to finance the transaction. Under the new capital
structure, EMN will maintain a debt to non-cash assets ratio
of 59.0%. This assumption of maintaining the 2015 capital
structure is conservative given the uncertainties surrounding
estimating the timing of the debt repayments.
Noncash Assets
As of September 30, 2014 Taminco’s noncash assets had a
book value of $1.879 billion. We have incorporated each
account balance with the respective EMN account. Any
account on Taminco’s balance sheet without an equivalent
EMN account has been aggregated into other current assets
and other noncurrent assets. These accounts are not material
in nature. We assume there will not be material changes in
Taminco’s balance sheet accounts between September 30,
2014 and Q2 2015.
Goodwill
Goodwill of $921 million is calculated as the difference
between the $2.8 billion value of the acquisition and the
$1.879 billion book value of Taminco’s assets as of
September 30, 2014. The $921 million is an addition to
EMN’s goodwill balance to arrive at an ending goodwill
balance of $4.025 billion.
Weighted Average Cost of Capital (WACC)
WACC is calculated by assuming a capital structure of
62.1% equity and 37.9% debt.
Cost of Equity
Our calculation of EMN’s cost of equity involved the use of
the Capital Asset Pricing Model (CAPM). We employed a
risk-free rate of 3.06%, equal to the 30-year U.S Treasury
bond yield as of November 17, 2014liv
. We feel the current
yield appropriately reflects the market’s future expectations
for the long-term and is highly liquid due to its high trade
volume. For the market risk premium, we use Damodaran’s
implied ERP as of November 1, 2014 of 5.32%x
. Finally, to
determine the 1.67 value of Beta, we first averaged the daily
and monthly raw Beta calculated for EMN by Bloomberg
over the past two years. We only consider the past two years
due to the acquisition of Solutia. We feel that the pre-
acquisition years do not accurately reflect the company’s
2013 risk level. Next, we unlevered the beta using EMN’s
2013 debt to equity ratio of 0.37, based on the book values
of debt and common stock. We then re-levered EMN’s beta
by calculating the anticipated the 2014 year-end debt to
equity ratio including the $2 billion debt issuance related to
the Taminco acquisition. This resulted in a debt to equity
ratio of 0.61. Based on these assumptions, EMN’s cost of
equity is 11.94%.
Cost of Debt
In determining the cost of EMN’s debt it is critical to stay
consistent with our long-term forecast horizon. Using
Bloomberg, we identified the yields on EMN’s outstanding
bond issuances with maturities near our 2019 CV. We then
averaged the yields on 2024 bonds, resulting in a 3.96% pre-
tax cost of debt. Using a marginal tax rate at 32.55%, EMN’s
after-tax cost of debt is 2.67%. We believe this is an
appropriate cost of debt based on EMN’s BBB credit
ratinglvi
.
Discounted Cash Flow and Economic Profit Model
After performing the DCF and EP model analysis, both
models yielded an identical intrinsic stock price of $98.76.
Based off of EMN’s current stock price as of November 17,
2014, we believe that EMN is undervalued by 15.0%. This
premium is driven by EMN’s ability to generate high levels
of operating and free cash flow from 2014-2019. The DCF
model and EP model rely on the value drivers of net
operating profit less adjusted taxes (NOPLAT) and invested
capital (IC). The increase in free cash flow is driven by
EMN’s revenue growth and ability to maintain its 2015
current cost structure.
14. We believe the intrinsic stock price determined by our DCF
and EP model provides to most probable intrinsic stock price
estimate. We believe EMN is currently undervalued because
of a recent restructuring and acquisition costs. Additionally,
EMN is experiencing a deflated price due to a low Q2
capacity utilization from the shutdown of a major plant.
Moreover, EMN continues to move away from commodity
products, allowing them to generate more stable returns. We
believe the market does not fully reflect EMN’s shift to a
more specialized product mix. Going forward, EMN will
begin to realize organic returns from its strategic acquisitions
of specialty chemical companies and product lines. The
value drivers in the DCF and EP models appropriately reflect
the future of EMN and therefore yield an intrinsic stock price
higher than EMN’s current market price.
Dividend Discount Model
Our dividend discount model produced an intrinsic stock
price of $71.27, indicating that EMN is currently overvalued
in the market and trading 17.8% higher than its intrinsic
value. This model relies heavily on our assumption that the
dividend payout ratio (DPR) would stay constant at EMN’s
historical average of 31.0% and EMN’s cash balance would
continue to allow for cash dividends to be paid.
Additionally, this model was impacted by the adjustment
made to the beta in our WACC calculation in order to reflect
the risk associated with the $2 billion debt issuance. As the
beta increased, EMN’s cost of equity rose to 11.94%.
Without the $2 billion debt issuance EMN’s cost of equity
would have been 10.88%. As EMN’s cost of equity rose, the
intrinsic stock price of the company decreased. The
dividend discount model is not reflective of the true intrinsic
value of EMN because it relies more on EMN’s cost of
equity, and does not appropriately reflect EMN’s ability to
create future value.
Relative P/E and PEG Valuation
To perform a relative valuation of EMN, we began by
identifying chemical companies that have a product portfolio
similar to EMN’s, which consists of a diverse product mix
composed primarily of specialized chemicals. Additionally,
we focused consideration on the comparable company’s
market capitalization. Although DOW and DD are
significantly larger than EMN by market capitalization, we
feel it is important to include them in the relative valuation
of EMN due to their leading positions in the chemical
industry. The following companies, listed below with their
respective market capitalization, were used in EMN’s
relative valuation:
1. Ashland Inc. (ASH) $8.0B
2. Celanese Corporation (CE) $9.18B
3. Dupont (DD) $64.0B
4. Dow Chemical Company (DOW) $59.96B
5. Huntsman Corporation (HUN) $ 6.29B
EMN’s relative P/E ratio resulted in an implied stock price
range of $103.54 to $117.99, while EMN’s PEG ratio
analysis resulted in a stock price range of $83.82 to $95.10.
We used 2014 and 2015 estimated EPS for each company,
and five-year estimated growth rates. We felt that the PEG
ratio was a good valuation metric because EMN’s five- year
estimated growth is comparable to similar companies in the
industry. Over the forecast horizon, we predict that EMN
will begin to primarily grow organically. As EMN reaches
2019, we believe its P/E ratio will increase slightly due to a
heavier focus on R&D in creating new products and capacity
additions at existing facilities. EMN’s relative valuation
provides the highest stock price, at a 19.0% premium to its
current stock price, solidifying our belief that EMN is
currently undervalued.
Sensitivity Analysis
A sensitivity analysis simultaneously changes two variables
used in the model to measure the effect that such change has
on the intrinsic stock price. Our model includes six
sensitivity tables, measuring change across the following
scenarios: beta and risk free rate, COGS as a percent of sales
and CV growth, equity risk premium and CV ROIC, cost of
debt and tax rate, and WACC and CV growth.
Beta & Risk Free Rate
The calculation of EMN’s cost of equity was done using the
CAPM. The risk free rate and beta are two of the main
components of the CAPM. Changes to these variables can
cause a significant change in the cost of equity. Differing
values of beta and the risk free rate cause significant changes
in EMN’s intrinsic value due to beta changing the volatility
and risk of the company and the risk free rate changing the
risk premium. Our calculation of EMN’s beta used in the
forecast period involved un-levering and re-levering to
account for our assumption that EMN’s capital structure
would be heavily weighted toward debt during the forecast
horizon. In the sensitivity analysis, we wanted to include
EMN’s current capital structure beta of 1.47 to compare to
the beta used in our forecast cost of equity of 1.67. The risk
free rate used in EMN’s analysis is the current yield on the
30-year treasury, which changes with market expectations of
risk. The treasury yield will respond accordingly to a change
in the Federal Funds Rate, which we predict to increase by
Q2 2015. Long-term, we predict the 10-year treasury to near
5.0%, which will also increase the 30-year treasury.
COGS & CV Growth
In this pair we looked at the COGS as a percent of sales
(COGS/Sales) compared to the CV Growth. COGS/Sales
has one of the greatest impacts on the intrinsic stock price of
EMN. By increasing the COGS/Sales by just .05%, the
intrinsic value of the stock decreases by approximately
5.4%, holding the CV growth rate constant. An increase in
COGS reflects the impact that a shift in raw material costs
can have on the overall profitability of the company. Within
the next five years, EMN’s could experience a higher COGS
for various reasons, however we see the following factors to
be the most likely:
• Higher operating costs due to inefficiencies with
Taminco acquisition
• Increase in natural gas and propane volatility, impacting
profit margins due to EMN facilities on the U.S Gulf
15. Shore demanding propane as raw material that cannot be
substituted
• OPEC cutting production, driving oil prices back up
In this sensitivity table we also looked at the CV growth rate
used in our continuing value assumption. Since our CV
growth rate is tied with GDP growth of the economy, we
examined a bull and a bear case scenario. If the economy
begins to slow in 2019 below our 3.0% prediction, EMN’s
intrinsic value decreases. If the CV growth rate decreases
the company will generate less revenues in the future, and
thus will be less valuable. The stock price is less sensitive
to the CV growth rate then it is to COGS/Sales, but is critical
to examine both because the CV growth rate reflects the
overall health of the economy and outlook for EMN.
Equity Risk Premium & CV ROIC
The next sensitivity table constructed compares at the equity
risk premium applied in our WACC calculation and the CV
ROIC. We employed the most recent equity risk premium
calculated by Damodaran. The equity risk premium
calculates the expected return on the market compared to the
risk free rate. As the equity risk premium decreases, the
intrinsic value of the stock increases. A decrease in the
equity risk premium decreases EMN’s overall cost of equity,
decreasing EMN’s WACC. With a lower WACC, future
values are discounted at a lower rate giving the company
more value. We wanted to capture a larger range to account
for the variations surrounding the equity risk premium
calculation. A less than 0.20% point movement in the equity
risk premium produces a $4 shift in the intrinsic stock price.
We also looked at the CV ROIC growth rate. The CV ROIC
growth rate would move based on how much NOPLAT
EMN is generating, as well as their invested capital levels.
The more profitable EMN is, the higher their ROIC value
will be (as long as they are operating at an ROIC level
greater than their WACC). Profitability could be attributed
to higher sales volumes or lower COGS. The higher ROIC
the company can generate in the long run, the higher their
valuation. The lowest ROIC EMN has generated in the past
five years was 12.76%. It is important to monitor the equity
risk premium as it relates to the WACC and ROIC, because
if the WACC falls below ROIC, the company will begin to
destroy value for any investments made.
Cost of Debt & Tax Rate
The WACC is calculated using the after-tax cost of debt,
hence changes in the tax rate directly affect the cost of debt
and the WACC. EMN’s lowest tax rate in the past 10 years
was 24%, so a lower bound value of 25.35% replicates the
impact that such a low rate would have on EMN’s price. The
higher bound value of the cost of debt (4.65%) represents the
rate on EMN’s latest bond issuance for 2044 bonds.
Including this value in the analysis represents what would
happen if the company were to become riskier by defaulting
or taking on too much debt. This risk is slightly mitigated by
accounting for the tax shield associated with debt. However,
the riskier the firm, the higher its WACC. An observation
from comparing the cost of debt and tax rate is that the higher
the tax rate and higher the cost of debt, the lower the price
due to greater tax expense and risk.
WACC & CV Growth
The final sensitivity table compares WACC to the CV
growth. The WACC is the rate used to discount FCF and EP
to reach a present value. Due to the 2015 acquisition of
Taminco and increased levels of debt, the WACC of EMN
lowered as EMN moved to a capital structure of a higher D/E
ratio. Since debt is a cheaper source of financing, the WACC
decreased slightly. Prior to the debt issuance, EMN had a
WACC of 8.74%. The current WACC of 8.43% reflects the
change in capital structure, as well as the increased risk level
reflected in a higher beta. As WACC increases, the intrinsic
stock price of the company decreases. A 10 basis point
movement in the WACC creates around a 3.0% movement
in the intrinsic stock price. As discussed earlier, CV growth
aligns closely with the overall growth of the economy.
Important Disclaimer
This report was created by students enrolled in the Security
Analysis (6F:112) class at the University of Iowa. The report
was originally created to offer an internal investment
recommendation for the University of Iowa Krause Fund and
its advisory board. The report also provides potential
employers and other interested parties an example of the
students’ skills, knowledge and abilities. Members of the
Krause Fund are not registered investment advisors, brokers
or officially licensed financial professionals. The investment
advice contained in this report does not represent an offer or
solicitation to buy or sell any of the securities mentioned.
Unless otherwise noted, facts and figures included in this
report are from publicly available sources. This report is not
a complete compilation of data, and its accuracy is not
guaranteed. From time to time, the University of Iowa, its
faculty, staff, students, or the Krause Fund may hold a
financial interest in the companies mentioned in this report.
Sources
i
Ashland Corporation. Ashland 2013 Annual Report. Ashland.
2014. Print.
ii
BBC. China’s Economy Shows More Signs of Weakness.
BBC. 13 Nov. 2014. Web.
<http://www.bbc.com/news/business-30032808 >
iii
Begleiter, David, Ramanan Sivalingam, Jermaine Brown.
Investor Day Delivers Now It’s Time to Deliver the Earnings.
Deutsche Bank Market Research. 7 Nov. 2014. Print.
iv
Bloomberg. GDP Economic Calendar. Bloomberg. 18 Oct.
2014. Web.< http://www.bloomberg.com/markets/economic-
calendar/ >
v
Bloomberg. Industrial Production Index Economic Calendar.
Bloomberg. 16 Oct. 2014. Web.
<http://www.bloomberg.com/markets/economic-calendar/ >
vi
Board of Governors of the Federal Reserve. Industrial
Production and Capacity Utilization. 17 Nov. 2014. Web.
<http://www.federalreserve.gov/releases/g17/current/default.ht
m >
vii
Board of Governors of the Federal Reserve. Selected Daily
Interest Rates. Federal Reserve Website. 14 Nov. 2014. Web.
<http://www.federalreserve.gov/releases/h15/update/ >
16. viii
Butters, John. FactSet Earnings Insight. FactSet. 14 Nov.
2014. Print.
ix
Celanese. Celanese <2013 Annual Report. Celanese. 2014.
Print.
x
Damodaran, Aswath. Implied Equity Risk Premium.
Damodaran Online. 17 Nov. 2014. Web.
<http://pages.stern.nyu.edu/~adamodar/ >
xi
Dow Chemical. Dow 2013 Annual Report. Dow Chemical.
2014. Print.
xii
Eastman Chemical Company. Eastman 2011 Annual Report.
2012. Print.
xiii
Eastman Chemical Company. Eastman 2012 Annual Report.
2013. Print.
xiv
Eastman Chemical Company. Eastman 2013 Annual Report.
Eastman Chemical. 2014. Print.
xv
Eastman Chemical Company. Eastman 2013 Databook.
Eastman Chemical. 2014. Print.
xvi
Eastman Chemical Company. Eastman Announces Offering.
Eastman Corporate Website. 10 Nov. 2014. Web.
<http://www.eastman.com/Company/News_Center/2014/Page
s/Eastman_Announces_Offering_of_Notes_due_2020_2025_a
nd_due_2044.aspx >
xvii
Eastman Chemical Company. Eastman Announces Second-
Quarter. 2014 Financial Results. Eastman Corporate Website.
28 July 2014. Web.
<www.eastman.com/Company/News_Center/2014/Pages/East
man_Announces_Second_Quarter_2014_Financial_Results.as
px >
xviii
Eastman Chemical Company. Eastman Announces Third-
Quarter Financial Results. 30 Oct. 2014. Web.
<http://www.eastman.com/Company/News_Center/2014/Page
s/Eastman_Announces_Third-
Quarter_2014_Financial_Results.aspx >
xix
Eastman Chemical Company. Eastman Corporate Overview.
Eastman Chemical Corporate Website. 2014. Web.. <
www.eastman.com >
xx
Eastman Chemical Company. Eastman Plasticizer Expansion
Complete. Yahoo Finance. 18 Sept. 2014. Web.
<http://finance.yahoo.com/news/eastman-plasticizer-
expansion-complete-123302511.html>
xxi
Eastman Chemical Company. Eastman to Acquire Taminco
in $2.8 Billion Transaction. Eastman Corporate Website. 11
Sept. 2014. Web.
<http://www.eastman.com/Company/News_Center/2014/Page
s/Eastman-to-Acquire-Taminco-in-$2.8-Billion-
Transaction.asp >
xxii
Eastman Chemical Company. 2014 Sustainability Report.
Eastman Chemical. June 2014. Print.
xxiii
The Economist. Deflation, deflated. The Economist. 10
Nov. 2014. Web.
<http://www.economist.com/blogs/freeexchange/2014/11/chin
as-
economy?zid=306&ah=1b164dbd43b0cb27ba0d4c3b12a5e22
7 >
xxiv
The Economist. Tobacco Industry: Government Coughers.
The Economist. 1 May 2014. Web.
<http://www.economist.com/news/china/21597958-smoking-
course-kill-100m-chinese-people-century-will-latest-anti-
smoking>
xxv
EI du Pont de Nemours. Du Pont 2013 Annual Report. EI
du Pont de Nemours. 2014. Print.
xxvi
FactSet. World Motor Vehicles. FactSet. 2014. Web. 20
Sept. 2014.
xxvii
Fidelity. Materials Sector Overview. Fidelity. Web.
<https://eresearch.fidelity.com/eresearch/markets_sectors/sect
ors/sectors_in_market.jhtml?tab=learn§or=15 >
xxviii
FRED. St. Louis Federal Reserve.
< http://research.stlouisfed.org/fred2/ >
ixxx
IBISWorld. Industrial Production Index. IBISWorld. Sept.
2014. Web.
<http://clients1.ibisworld.com/reports/us/bed/default.aspx?enti
d=4098 >
xxx
IBISWorld. Yield on 10-year Treasury Note. IBISWorld.
Sept. 2014. Web. <
http://clients1.ibisworld.com/reports/us/bed/default.aspx?entid
=97>
xxxi
International Council of Chemical Associations.
Responsible Care. ICCA. Web. <http://www.icca-
chem.org/en/Home/Responsible-care/ >
xxxii
International Monetary Fund. World Economic Outlook:
Legacies, Clouds, Uncertainties. International Monetary Fund.
Oct. 2014. Print.
xxxiii
MarketLine. Eastman Chemical Company. MarketLine. 26
Sept. 2014. Print.
xxxiv
MarketWatch. Airgas Named Global Supplier of
Excellence for 2013 by Eastman Chemical Company. 31 July
2013. Web. <http://www.marketwatch.com/story/airgas-
named-global-supplier-of-excellence-for-2013-by-eastman-
chemical-company-2014-07-31 >
xxxv
Mergent, Inc. Eastman Chemical Company Overview.
Mergent, Inc. 19 Sept. 2014. Print.
xxxvi
Morningstar. Eastman Chemical Co. Ownership.
Morningstar. Web.
<http://investors.morningstar.com/ownership/shareholders-
overview.html?t=EMN®ion=usa&culture=en-US >
xxxvii
MSN Money. Eastman Chemical. MSN. Web. <
http://www.msn.com/en-us/money/stockdetails/fi-
126.1.EMN.NYS?symbol=EMN&form=PRFIHQ>
xxxviii
Muir, Christopher. S&P Industry Surveys: Chemicals.
S&P Capital IQ. May 2014. Print.
ixl
NC State News. NC State Signs Innovative Research
Agreement with Eastman Chemical Company. NC State
News. 10 Sept. 2012. Web. <http://news.ncsu.edu/2012/09/nc-
state-signs-innovative-research-agreement-with-eastman-
chemical-company/>
xl
Nyitray, Brent. Consumer Sentiment Improves in September
– Good News for Mall REITs. Market Realist. 15 Sept. 2014.
Web. <http://marketrealist.com/2014/09/consumer-sentiment-
improves-september-good-mall-
reits/?utm_source=yahoo&utm_medium=feed&utm_content=
graph-1&utm_campaign=consumer-sentiment-improves-
september-good-mall-reits#101124>
xli
O’Reilly, Richard. S&P Industry Surveys: Specialty
Chemicals. S&P Capital IQ. 2 Oct. 2003. Print.
xlii
Reuters. Eastman Chemical to Buy Taminco for $1.8
Billion. Yahoo Finance. 11 Sept. 2014. Web..<
http://finance.yahoo.com/news/eastman-chemical-acquire-
taminco-corp-150251501.html >
xliii
Reuters. Low Oil Prices to Bite Into 2015 US Shale
Growth. CNBC. 12 Nov. 2014. Web.
<http://www.cnbc.com/id/102175914 >
17. xliv
Reuters. Oil in Worst Weekly Losing Streak in 28 Years.
CNBC. 14 Nov. 2014. Web.
<http://www.cnbc.com/id/102184284 >
xlv
Ruiz, Brandon. Automobile and Engine Parts Manufacturing
in the US. IBISWorld. July 2014.
<http://clients1.ibisworld.com.proxy.lib.uiowa.edu/reports/us/i
ndustry/industryoutlook.aspx?entid=816 >
xlvi
S&P Capital IQ. Eastman Chemical Company. McGraw
Hill Financial. 8 Nov. 2014. Print.
xlvii
S&P Net Advantage. Eastman Chemical. 2014. Web.
<http://www.netadvantage.standardandpoors.com.proxy.lib.ui
owa.edu/NASApp/NetAdvantage/cp/companyFinancials.do >
xlviii
Schwartz, Nelson, Clifford Krauss, Dionne Searcey.
Sliding Oil and Gas Prices Give Americans More Money to
Spend. The New York Times. 13 Nov. 2014. Web.
<http://www.nytimes.com/2014/11/14/business/economy/lowe
r-oil-prices-give-a-lift-to-the-american-economy.html?_r=1 >
il
Seeking Alpha. Updated S&P Sector Weightings. Seeking
Alpha. 17 July 2014. Web.
<http://seekingalpha.com/article/2319245-updated-s-and-p-
500-sector-weightings >
l
Stynes, Tess. Eastman Chemical Profit Rises 11%. Wall
Street Journal. 28 July 2014. Web.
<http://online.wsj.com/articles/eastman-chemical-profit-rises-
11-1496585028>
li
Taminco Corp. 2013 Annual Report. Taminco Corp. 2014.
Print.
lii
ThomsonONE. EMN Company Overview. ThomsonONE.
2014. Print.
liii
Transparency Market Research. Specialty Chemicals
Market. Transparency Market Research. 2014. Web.
<http://www.transparencymarketresearch.com/specialty-
chemicals-market.html>
liv
U.S. Department of Treasury. Daily Treasury Yield Curve
Rates. 17 Nov. 2014. Web.
<http://www.treasury.gov/resource-center/data-chart-
center/interest-rates/Pages/TextView.aspx?data=yield >
lv
U.S. Energy Information Administration. Short-Term Energy
Outlook. EIA. Nov. 2014. Print.
lvi
Zacks Equity Research. Eastman Chemical Offering $2B
Notes to Fund Taminco Buy. Zacks Equity Research. 11 Nov.
2014. Web. <
http://www.zacks.com/stock/news/153735/eastman-chemical-
offering-2b-notes-to-fund-taminco-buy>
lvii
Zekauskas, Jeffrey, Ben Richardson, Silke Kueck, Youyou
Yan. Eastman Chemical Company: Building a Base. J.P.
Morgan. 3 Nov. 2014. Print.
lviii
Zhou, Morning. Crude Oil Falls to 4-Year Low as OPEC
Seen as Resisting Cut. Bloomberg Businessweek. 13 Nov.
2014. Web. < http://www.businessweek.com/news/2014-11-
13/brent-extends-drop-to-4-year-low-as-opec-seen-resisting >
Figure 1: MSN Money
Figure 2: Bloomberg
Figure 3: IBISWorld
Figure 4: NASDAQ
Figure 5:U.S. Energy Information Association
Figure 6:UBS Market Research
Figure 7: St. Louis Federal Reserve
Figure 8: Bloomberg
Figure 9: U.S. Spindices
Figure 10: SeekingAlpha
Figure 11: Statista
Figure 12: Self-Generated, 2013 Annual Reports
Figure 13: Self-Generated, Yahoo Finance
Figure 14: Self-Generatd, Eastman Chemical 2013 Annual
Report
Figure 15:ThompsonOne
Figure 16: Self-Generated, Eastman Chemical 2013 Annual
Report
Figure 17: Self-Generated, Eastman Chemical 2013 Annual
Report
Figure 18: Self-Generated, Eastman Chemical 2013 Annual
Report
Figure 19:Self-Generated, Eastman Chemical 2013 Annual
Report.
Figure 20: S&P Net Advantage
Figure 21:Self-Generated, Zacks
Figure 22: Deutsche Bank Market Research
18. Eastman Chemical (EMN)
Key Assumptions of Valuation Model
Ticker Symbol EMN
Current Share Price 83.95
Fiscal Year End Dec. 31
Pre-Tax Cost of Debt 3.96%
Beta 1.67
Risk-Free Rate 3.06%
Equity Risk-Premium 5.32%
CV Growth of NOPLAT 7.94%
Marginal Tax Rate 32.55%
CV Growth Rate 3.24%
CV ROIC 15.05%
Number of shares 149.08
WACC 8.43%
CV ROE 21.08%