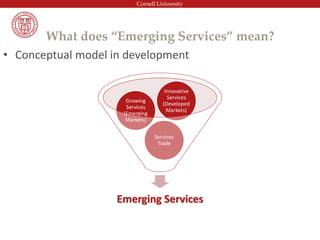
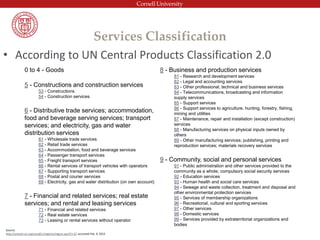
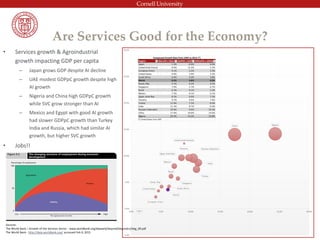
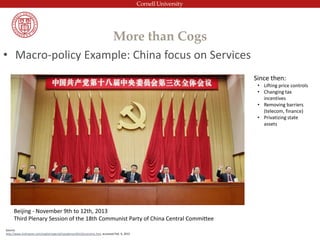
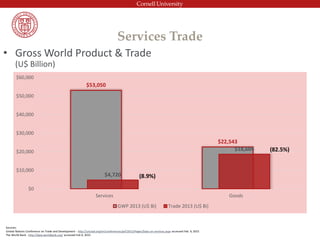
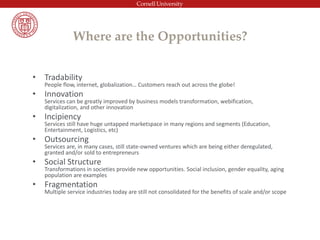
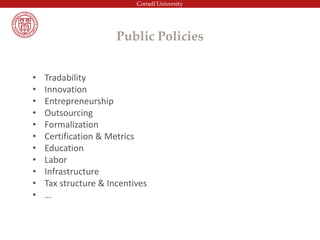
Presented March 19th, 2015 at
Cornell Institute for Public Affairs – CIPA Colloquium
Humberto Ribeiro
Visiting Scholar
Prof. Lourdes Casanova
Academic Supervisor
Emerging Markets Institute
S.C. Johnson Graduate School of Management
Emerging Services
What are Services
• An intangible product/commodity that satisfies wants or needs
• Economic activities that produce time, place, form, or psychological utilities
• Economic activities that transforms goods and talent into well-being
Services
Intangible
Perishable
Variable
(Inconsistently
Unique)
Customer
driven
(Involvement)
Inseparable
Customer and Service
Provider CAN be
separated in all
TRADABLE ServicesSources:
Service Management: An Integrated Approach to Supply Chain Management and Operations – Cengiz Haksever, Barry Render (FT Press, 2013)
World Trade Organization – Services Profile 2014
What does “Emerging Services” mean?
• Conceptual model in development
Emerging Services
Services
Trade
Growing
Services
(Emerging
Markets)
Innovative
Services
(Developed
Markets)
Services Classification
• According to UN Central Products Classification 2.0
0 to 4 - Goods
5 - Constructions and construction services
53 - Constructions
54 - Construction services
6 - Distributive trade services; accommodation,
food and beverage serving services; transport
services; and electricity, gas and water
distribution services
61 - Wholesale trade services
62 - Retail trade services
63 - Accommodation, food and beverage services
64 - Passenger transport services
65 - Freight transport services
66 - Rental services of transport vehicles with operators
67 - Supporting transport services
68 - Postal and courier services
69 - Electricity, gas and water distribution (on own account)
7 - Financial and related services; real estate
services; and rental and leasing services
71 - Financial and related services
72 - Real estate services
73 - Leasing or rental services without operator
8 - Business and production services
81 - Research and development services
82 - Legal and accounting services
83 - Other professional, technical and business services
84 - Telecommunications, broadcasting and information
supply services
85 - Support services
86 - Support services to agriculture, hunting, forestry, fishing,
mining and utilities
87 - Maintenance, repair and installation (except construction)
services
88 - Manufacturing services on physical inputs owned by
others
89 - Other manufacturing services; publishing, printing and
reproduction services; materials recovery services
9 - Community, social and personal services
91 - Public administration and other services provided to the
community as a whole; compulsory social security services
92 - Education services
93 - Human health and social care services
94 - Sewage and waste collection, treatment and disposal and
other environmental protection services
95 - Services of membership organizations
96 - Recreational, cultural and sporting services
97 - Other services
98 - Domestic services
99 - Services provided by extraterritorial organizations and
bodies
Source:
http://unstats.un.org/unsd/cr/registry/regcst.asp?Cl=25 accessed Feb. 9, 2015
Are Services Good for the Economy?
• Services growth & Agroindustrial
growth impacting GDP per capita
– Japan grows GDP despite AI decline
– UAE modest GDPpC growth despite high
AI growth
– Nigeria and China high GDPpC growth
while SVC grow stronger than AI
– Mexico and Egypt with good AI growth
had slower GDPpC growth than Turkey
India and Russia, which had similar AI
growth, but higher SVC growth
• Jobs!!
Sources:
The World Bank – Growth of the Services Sector - www.worldbank.org/depweb/beyond/beyondco/beg_09.pdf
The World Bank - http://data.worldbank.org/ accessed Feb 9, 2015
More than Cogs
• Macro-policy Example: China focus on Services
Beijing - November 9th to 12th, 2013
Third Plenary Session of the 18th Communist Party of China Central Committee
Since then:
• Lifting price controls
• Changing tax
incentives
• Removing barriers
(telecom, finance)
• Privatizing state
assets
Source:
http://www.xinhuanet.com/english/special/cpcplenum2013/economic.htm accessed Feb. 9, 2015
The Three Dimensions
Emerging Services
• For Everyone
– Individual Services
• From glasses to cups to watches to family appliances
– Governmental Services
• Security, Governance, Public Services
– Supply-chain Services (Embedded)
• Productivity, Efficiency
• A Few Current Keywords
– Smart Cities
– Web of Things
– Industrial Internet
Innovative Services
• Country Ranking by Services GDP
2013 GDP (U$) and % of Services in Total GDP
Growing Services
13,030,848,507,621 United States 77.7
4,259,214,832,234 China 46.1
3,600,205,894,102 Japan 73.2
2,552,647,894,726 Germany 68.4
2,202,659,980,513 France 78.5
2,120,309,409,660 United Kingdom 79.2
1,599,561,105,479 Italy 74.4
1,556,616,771,858 Brazil 69.3
1,293,245,463,560 Canada 70.8
1,253,477,601,515 Russian Federation 59.8
1,103,675,069,588 Australia 70.7
1,070,273,977,423 India 57.0
1,029,325,784,676 Spain 73.9
778,094,185,755 Mexico 61.7
771,063,947,171 Korea, Rep. 59.1
647,625,653,675 Netherlands 75.9
529,747,757,203 Turkey 64.4
504,193,516,455 Switzerland 73.6
421,457,420,276 Sweden 72.7
402,385,064,284 Belgium 76.7
393,728,559,445 Argentina 64.6
346,252,184,253 Indonesia 39.9
333,673,550,988 Poland 63.5
301,266,127,238 Austria 70.3
297,486,232,263 Nigeria 57.0
295,548,640,124 Norway 57.7
281,338,666,667 Saudi Arabia 37.6
254,536,876,154 Denmark 75.8
254,114,793,663 Hong Kong SAR, China 92.7
245,545,335,972 South Africa 70.0
223,026,560,001 Singapore 74.9
214,463,349,292 Colombia 56.7
199,610,988,057 Greece 82.4
188,345,686,198 Finland 70.5
184,311,640,524 Venezuela, RB 42.1
176,091,811,495 Thailand 45.5
174,251,065,656 Portugal 76.7
172,535,565,252 Ireland 74.3
169,855,256,780 Chile 61.3
167,144,555,484 Iran, Islamic Rep. 45.3
162,244,252,422 United Arab Emirates 40.3
157,152,559,586 Malaysia 50.2
156,846,715,989 Philippines 57.7
134,905,921,329 Kazakhstan 58.2
128,316,876,809 New Zealand 69.1
126,734,704,090 Czech Republic 60.7
125,976,667,833 Egypt, Arab Rep. 46.3
124,987,538,541 Pakistan 53.8
111,139,339,441 Ukraine 62.6
104,374,532,217 Peru 51.6
Source: The World Bank - http://data.worldbank.org/ accessed Feb 9, 2015
• Hints
– Franchising
– Infrastructure (Energy, Telecom, Logistics, Sewage)
– Family Needs (Insurance, Healthcare, Education)
– Family Desires (Tourism, TV content, Web access)
Growing Services
Source: The World Bank - http://data.worldbank.org/ accessed Feb 9, 2015
Services Trade
• Growth & Facts
Source: United Nations Conference on Trade and Development - http://unctad.org/en/conferences/gsf/2013/Pages/Data-on-services.aspx accessed Feb. 9, 2015
1995: WTO
2001: China @WTO
1994:
Commercial
Internet
2008: Global
Financial Crisis
1998: Y2K Bug
& Offshoring
1989:
Berlin Wall
1986:
Perestroika
Major Tradable
Services in 2013:
Travel = U$ 1,200 Bi
Transport = U$ 906 Bi
Financial = U$ 335 Bi
Royalties = U$ 310 Bi
IT Serv. = U$ 285 Bi
Commun.= U$ 120 Bi
Construct = U$ 120 Bi
Insurance = U$ 105 Bi
Services Trade
• Gross World Product & Trade
(U$ Billion)
$53,050
$22,543
$4,720
$18,604
$0
$10,000
$20,000
$30,000
$40,000
$50,000
$60,000
Services Goods
GWP 2013 (U$ Bi) Trade 2013 (U$ Bi)
Sources:
United Nations Conference on Trade and Development - http://unctad.org/en/conferences/gsf/2013/Pages/Data-on-services.aspx accessed Feb. 9, 2015
The World Bank - http://data.worldbank.org/ accessed Feb 9, 2015
(8.9%)
(82.5%)
Moving Forward
Emerging Services
Where are the Opportunities?
• Tradability
People flow, internet, globalization… Customers reach out across the globe!
• Innovation
Services can be greatly improved by business models transformation, webification,
digitalization, and other innovation
• Incipiency
Services still have huge untapped marketspace in many regions and segments (Education,
Entertainment, Logistics, etc)
• Outsourcing
Services are, in many cases, still state-owned ventures which are being either deregulated,
granted and/or sold to entrepreneurs
• Social Structure
Transformations in societies provide new opportunities. Social inclusion, gender equality, aging
population are examples
• Fragmentation
Multiple service industries today are still not consolidated for the benefits of scale and/or scope
Public Policies
• Tradability
• Innovation
• Entrepreneurship
• Outsourcing
• Formalization
• Certification & Metrics
• Education
• Labor
• Infrastructure
• Tax structure & Incentives
• …
Thank You!

Emerging Services - CIPA Colloquium - Cornell University

  • 1.
    Presented March 19th,2015 at Cornell Institute for Public Affairs – CIPA Colloquium Humberto Ribeiro Visiting Scholar Prof. Lourdes Casanova Academic Supervisor Emerging Markets Institute S.C. Johnson Graduate School of Management Emerging Services
  • 2.
    What are Services •An intangible product/commodity that satisfies wants or needs • Economic activities that produce time, place, form, or psychological utilities • Economic activities that transforms goods and talent into well-being Services Intangible Perishable Variable (Inconsistently Unique) Customer driven (Involvement) Inseparable Customer and Service Provider CAN be separated in all TRADABLE ServicesSources: Service Management: An Integrated Approach to Supply Chain Management and Operations – Cengiz Haksever, Barry Render (FT Press, 2013) World Trade Organization – Services Profile 2014
  • 3.
    What does “EmergingServices” mean? • Conceptual model in development Emerging Services Services Trade Growing Services (Emerging Markets) Innovative Services (Developed Markets)
  • 4.
    Services Classification • Accordingto UN Central Products Classification 2.0 0 to 4 - Goods 5 - Constructions and construction services 53 - Constructions 54 - Construction services 6 - Distributive trade services; accommodation, food and beverage serving services; transport services; and electricity, gas and water distribution services 61 - Wholesale trade services 62 - Retail trade services 63 - Accommodation, food and beverage services 64 - Passenger transport services 65 - Freight transport services 66 - Rental services of transport vehicles with operators 67 - Supporting transport services 68 - Postal and courier services 69 - Electricity, gas and water distribution (on own account) 7 - Financial and related services; real estate services; and rental and leasing services 71 - Financial and related services 72 - Real estate services 73 - Leasing or rental services without operator 8 - Business and production services 81 - Research and development services 82 - Legal and accounting services 83 - Other professional, technical and business services 84 - Telecommunications, broadcasting and information supply services 85 - Support services 86 - Support services to agriculture, hunting, forestry, fishing, mining and utilities 87 - Maintenance, repair and installation (except construction) services 88 - Manufacturing services on physical inputs owned by others 89 - Other manufacturing services; publishing, printing and reproduction services; materials recovery services 9 - Community, social and personal services 91 - Public administration and other services provided to the community as a whole; compulsory social security services 92 - Education services 93 - Human health and social care services 94 - Sewage and waste collection, treatment and disposal and other environmental protection services 95 - Services of membership organizations 96 - Recreational, cultural and sporting services 97 - Other services 98 - Domestic services 99 - Services provided by extraterritorial organizations and bodies Source: http://unstats.un.org/unsd/cr/registry/regcst.asp?Cl=25 accessed Feb. 9, 2015
  • 5.
    Are Services Goodfor the Economy? • Services growth & Agroindustrial growth impacting GDP per capita – Japan grows GDP despite AI decline – UAE modest GDPpC growth despite high AI growth – Nigeria and China high GDPpC growth while SVC grow stronger than AI – Mexico and Egypt with good AI growth had slower GDPpC growth than Turkey India and Russia, which had similar AI growth, but higher SVC growth • Jobs!! Sources: The World Bank – Growth of the Services Sector - www.worldbank.org/depweb/beyond/beyondco/beg_09.pdf The World Bank - http://data.worldbank.org/ accessed Feb 9, 2015
  • 6.
    More than Cogs •Macro-policy Example: China focus on Services Beijing - November 9th to 12th, 2013 Third Plenary Session of the 18th Communist Party of China Central Committee Since then: • Lifting price controls • Changing tax incentives • Removing barriers (telecom, finance) • Privatizing state assets Source: http://www.xinhuanet.com/english/special/cpcplenum2013/economic.htm accessed Feb. 9, 2015
  • 7.
  • 8.
    • For Everyone –Individual Services • From glasses to cups to watches to family appliances – Governmental Services • Security, Governance, Public Services – Supply-chain Services (Embedded) • Productivity, Efficiency • A Few Current Keywords – Smart Cities – Web of Things – Industrial Internet Innovative Services
  • 9.
    • Country Rankingby Services GDP 2013 GDP (U$) and % of Services in Total GDP Growing Services 13,030,848,507,621 United States 77.7 4,259,214,832,234 China 46.1 3,600,205,894,102 Japan 73.2 2,552,647,894,726 Germany 68.4 2,202,659,980,513 France 78.5 2,120,309,409,660 United Kingdom 79.2 1,599,561,105,479 Italy 74.4 1,556,616,771,858 Brazil 69.3 1,293,245,463,560 Canada 70.8 1,253,477,601,515 Russian Federation 59.8 1,103,675,069,588 Australia 70.7 1,070,273,977,423 India 57.0 1,029,325,784,676 Spain 73.9 778,094,185,755 Mexico 61.7 771,063,947,171 Korea, Rep. 59.1 647,625,653,675 Netherlands 75.9 529,747,757,203 Turkey 64.4 504,193,516,455 Switzerland 73.6 421,457,420,276 Sweden 72.7 402,385,064,284 Belgium 76.7 393,728,559,445 Argentina 64.6 346,252,184,253 Indonesia 39.9 333,673,550,988 Poland 63.5 301,266,127,238 Austria 70.3 297,486,232,263 Nigeria 57.0 295,548,640,124 Norway 57.7 281,338,666,667 Saudi Arabia 37.6 254,536,876,154 Denmark 75.8 254,114,793,663 Hong Kong SAR, China 92.7 245,545,335,972 South Africa 70.0 223,026,560,001 Singapore 74.9 214,463,349,292 Colombia 56.7 199,610,988,057 Greece 82.4 188,345,686,198 Finland 70.5 184,311,640,524 Venezuela, RB 42.1 176,091,811,495 Thailand 45.5 174,251,065,656 Portugal 76.7 172,535,565,252 Ireland 74.3 169,855,256,780 Chile 61.3 167,144,555,484 Iran, Islamic Rep. 45.3 162,244,252,422 United Arab Emirates 40.3 157,152,559,586 Malaysia 50.2 156,846,715,989 Philippines 57.7 134,905,921,329 Kazakhstan 58.2 128,316,876,809 New Zealand 69.1 126,734,704,090 Czech Republic 60.7 125,976,667,833 Egypt, Arab Rep. 46.3 124,987,538,541 Pakistan 53.8 111,139,339,441 Ukraine 62.6 104,374,532,217 Peru 51.6 Source: The World Bank - http://data.worldbank.org/ accessed Feb 9, 2015
  • 10.
    • Hints – Franchising –Infrastructure (Energy, Telecom, Logistics, Sewage) – Family Needs (Insurance, Healthcare, Education) – Family Desires (Tourism, TV content, Web access) Growing Services Source: The World Bank - http://data.worldbank.org/ accessed Feb 9, 2015
  • 11.
    Services Trade • Growth& Facts Source: United Nations Conference on Trade and Development - http://unctad.org/en/conferences/gsf/2013/Pages/Data-on-services.aspx accessed Feb. 9, 2015 1995: WTO 2001: China @WTO 1994: Commercial Internet 2008: Global Financial Crisis 1998: Y2K Bug & Offshoring 1989: Berlin Wall 1986: Perestroika Major Tradable Services in 2013: Travel = U$ 1,200 Bi Transport = U$ 906 Bi Financial = U$ 335 Bi Royalties = U$ 310 Bi IT Serv. = U$ 285 Bi Commun.= U$ 120 Bi Construct = U$ 120 Bi Insurance = U$ 105 Bi
  • 12.
    Services Trade • GrossWorld Product & Trade (U$ Billion) $53,050 $22,543 $4,720 $18,604 $0 $10,000 $20,000 $30,000 $40,000 $50,000 $60,000 Services Goods GWP 2013 (U$ Bi) Trade 2013 (U$ Bi) Sources: United Nations Conference on Trade and Development - http://unctad.org/en/conferences/gsf/2013/Pages/Data-on-services.aspx accessed Feb. 9, 2015 The World Bank - http://data.worldbank.org/ accessed Feb 9, 2015 (8.9%) (82.5%)
  • 13.
  • 14.
    Where are theOpportunities? • Tradability People flow, internet, globalization… Customers reach out across the globe! • Innovation Services can be greatly improved by business models transformation, webification, digitalization, and other innovation • Incipiency Services still have huge untapped marketspace in many regions and segments (Education, Entertainment, Logistics, etc) • Outsourcing Services are, in many cases, still state-owned ventures which are being either deregulated, granted and/or sold to entrepreneurs • Social Structure Transformations in societies provide new opportunities. Social inclusion, gender equality, aging population are examples • Fragmentation Multiple service industries today are still not consolidated for the benefits of scale and/or scope
  • 15.
    Public Policies • Tradability •Innovation • Entrepreneurship • Outsourcing • Formalization • Certification & Metrics • Education • Labor • Infrastructure • Tax structure & Incentives • …
  • 16.