Classification of Pumps
Classificationof Pumps
RECIPROCATING
POSITIVE DISPLACEMENT
ROTARY JET PERIPHERAL
SINGLE STAGE MULTI-STAGE RADIAL FLOW MIXED FLOW AXIAL FLOW
SELF-PRIMING NON SELF-PRIMING VOLUTE DIFFUSER
SINGLE VOLUTE DOUBLE VOLUTE
SINGLE SUCTION DOUBLE SUCTION
CLOSED SEMI-OPEN OPEN IMPELLER
SINGLE STAGE MULTI-STAGE
SELF-PRIMING NON SELF-PRIMING SUBMERGED
CENTRIFUGAL
KINETIC
PUMP
Not discussed in
this training module.
5.
PUMP TECHNOLOGY –GLOSSARY OF TERMS
PUMP TECHNOLOGY – GLOSSARY OF TERMS
• ABSOLUTE PRESSURE – The pressure above absolute
zero, equal to barometric pressure plus gauge pressure
Absolute
Pressure
Barometric
Pressure
Gauge
Pressure
Atmospheric
Pressure
Pressure Above Atmospheric
Barometric
Pressure
Absolute
Pressure
Vacuum
Atmospheric
Pressure
Pressure below Atmospheric
6.
PUMP TECHNOLOGY –GLOSSARY OF TERMS
PUMP TECHNOLOGY – GLOSSARY OF TERMS
• AFFINITY LAWS – the mathematical relationship between
flow rate, head, power & speed of centrifugal pump
• CAVITATION – is a term given to the formation of vapour
bubbles (cavities) in areas of low pressure & their
subsequent collapse upon reaching regions of higher
pressure. Usually results in a noisy pump and severe erosion
damage.
• DISCHARGE HEAD – is the static level of the final free
surface of the liquid relative to the pump suction centreline
• DRY RUNNING – pump put into operation without being
filled with fluid.
7.
BEST EFFICIENCY POINT(BEP)
BEST EFFICIENCY POINT (BEP) – is the ideal operating point for a pump, where the power
– is the ideal operating point for a pump, where the power
going in is the closest to the power coming out & the pump shaft experiences the least amount of
going in is the closest to the power coming out & the pump shaft experiences the least amount of
vibration.
vibration.
8.
CHARACTERISTIC CURVE
CHARACTERISTIC CURVE- is a graphical display showing the pump
- is a graphical display showing the pump
performance
performance under varying conditions of flow & head. It can be refer as
under varying conditions of flow & head. It can be refer as
Performance Curve
Performance Curve
9.
PUMP TECHNOLOGY –GLOSSARY OF TERMS
PUMP TECHNOLOGY – GLOSSARY OF TERMS
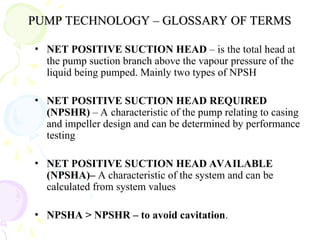
• FLOW RATE – is the external fluid flow delivered by a
pump per unit of time Usually expressed in litres per second
(l/s) or cubic metres per hour (m3/h)
• GAUGE PRESSURE - is the pressure measured by a
gauge. The pressure reading is above atmospheric pressure.
• HEAD – a measure of the energy in a particular fluid
expressed in the context of the length of column of that fluid
that the energy will support. It is usual express head in
metres of liquid being pumped (m)
• PRESSURE – An expression of the force per unit area
within a medium. It is another form of energy within the
fluid and is often expressed in kilopascals( kPa)
10.
PUMP TECHNOLOGY –GLOSSARY OF TERMS
PUMP TECHNOLOGY – GLOSSARY OF TERMS
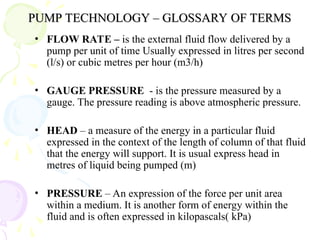
• NET POSITIVE SUCTION HEAD – is the total head at
the pump suction branch above the vapour pressure of the
liquid being pumped. Mainly two types of NPSH
• NET POSITIVE SUCTION HEAD REQUIRED
(NPSHR) – A characteristic of the pump relating to casing
and impeller design and can be determined by performance
testing
• NET POSITIVE SUCTION HEAD AVAILABLE
(NPSHA)– A characteristic of the system and can be
calculated from system values
• NPSHA > NPSHR – to avoid cavitation.
11.
PUMP TECHNOLOGY –GLOSSARY OF TERMS
PUMP TECHNOLOGY – GLOSSARY OF TERMS
• SHUT OFF HEAD – Shown on the characteristic curve and represents the head
condition at zero flow.
Shut
Off
Head
Head
Casing
The prime purposeof the casing is to energy from the fluid leaving the
impeller into useful pressure energy. The design of the casing is of
equal importance to that of the impeller. There are two types of
casing design
1. Volute
2. Guide Vane ( Diffuser)
29.
The double volutedesign is actually two single
volute designs combined together.
Although this drawing does not show it clearly,
the total throat area of the two volutes is the
same as the single volute design.
Double volute pumps were created to eliminate
most of the radial thrust caused by operating off
the pump's best efficiency point (BEP).
The single volute pump impeller will
deflect either 60° or 240° from the
cut water depending upon which side
of the pump's best efficiency point
(BEP) you are operating.
Closed Impeller: suitablefor clean liquids (max 0,1% solids).
- Very fine powder can lock impeller and wear ring.
-Some solids can cross the impeller, but long parts clog it immediately.
-No AIR if possible. – Very low NPSH.
Open Impeller: suitable for dirty liquids or containing gas and air. Solids
can cross the impeller, but they cannot be abrasive. Wearing ruine
adjustment between impeller and wearing plate. So performances
decrease a lot. Very good with gas and air. Offen used in flotation plants
(max. 10% air). Very low NPSH . Performance are about 5 – 10% lower
than closed impeller.
Channel Impeller: suitable for dirty liquids containing solids that can
cross the impeller. Fine powder don’t lock the impeller because tolerances
between impeller and wear ring is higher than in closed impellers. Not
suitable with long solid parts. Very good NPSH .
Vortex Impeller: suitable for dirty liquids containing big solid parts, also
long pieces like part of plastic bags. Gas and air can be conveyed without
problem. No problem with “soft” abrasive . Attention: very abrasive parts
must be pumped with special pumps.
Determination of SystemHead
Determination of System Head
Every centrifugal pump installation will have its own unique set of
operating conditions. To determine the correct pump selection, it is
necessary to calculate the system resistance at rated capacity and
various flow rates above and below the rated capacity. This
involves:-
1) Static head on suction and discharge side of pump
2) Pressure difference in suction and discharge reservoirs
(if applicable)
3) Entrance & Exit losses
4) Friction losses in pipes and fittings
56.
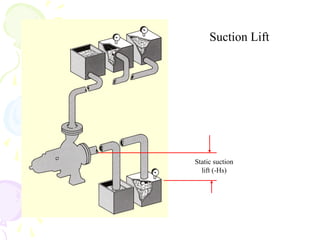
STATIC HEAD
STATIC HEAD
•Static head exists in the system as a result of the
physical positions of the suction reservoir and the
discharge reservoir.
• The vertical height difference between the free
surfaces of the suction and discharge reservoir is a
measure of the static head
Friction Loss
Friction Loss
•Friction losses will vary with pumping capacity and
need to be calculated for the system of pipes and
fittings to be used in the installation
• Different sizes of pipes and different pipe materials
display different friction loss characteristics
• These characteristics can be obtained from
tabulations in Industry reference books
62.
• Section 1
-Head loss tables for various pipe
sizes and materials
(Pg 9-102)
• Section 2
- Head loss through various fittings
- Friction losses for viscous liquids
- Flow through orifices and nozzles
- Worked Examples
(Pg 105 – 151)
PUMP INDUSTRY AUSTRALIA FRICTION HANDBOOK
1.Total length ofpipe in system is
suction: 1.5m
discharge: 380m
total: 1.5 + 380 = 381.5m
For a flow of 15 L/s through 100 mm of schedule 40 pipe:
Pipe friction loss = 3.19 m/100 m of pipe (Table A3)
The head loss due to pipe friction will be:
f
h = 381.5 x 3.19
100
= 12.17m
SOLUTION
68.
2. The resistancecoefficient for the various fittings in the system as obtained from the
tables for 100 mm schedule 40 pipe will be:
Suction
Standard 90 degree flanged elbow (Section 2.1.2) K = 0.51
Hinged disc foot valve (Section 2.1.3) K = 1.28
Discharge
Standard 90 degree flanged elbow (Section 2.1.2) K = 0.51
Flanged swing check valve (Section 2. 1.3) K = 0.85
Gate valve (Section 2 .1.2) K = 0.14
Sudden enlargement at exit (Section 2.1.5) K = 1.00
The total resistance coefficient for the fittings on the pump suction and discharge and
sudden enlargement at exit will be:
K = 0.51 x 3 + 1.28 + 0.85 + 0.14 + 1.0
K= 4.8
For a flow of 15 L/s through 100 mm of schedule 40 pipe.
0.17
2g
V2
The head loss due to fittings in the system will be:
0.82m
0.17
4.8
2g
v
k
h
2
f
Velocity head = m (Table A3)
69.
3. The totalsystem head is equal to the sum of the total static head and
the head losses due to friction in pipes and fittings.
i.e. H = 80 + 12.17 + 0.82
= 93m
70.
Pump Performance Curves
PumpPerformance Curves
Plotting the variation of the Head (H) with Flow
(Q) at a constant speed is called the pump
characteristic or Pump Performance Curve.
A complete pump performance curve would
include efficiency and power curves for the
capacity range of the pump.
71.
Performance Curves
Performance Curves
Howdo we obtain performance curves?
The hydraulic properties are determined by testing at
a constant speed with a dynamometer while the Head
(H) and Flow (Q) are altered by throttling the
discharge valve.
By plotting the points of flow against head for the
various positions of the discharge valve, a Head/Flow
(HQ) curve is obtained.
This curve gives us the fundamental hydraulic
performance of a pump at a nominated speed
72.
Performance Curve
Performance Curve
Ifthe power is simultaneously measured with the
dynamometer for the various discharge valve openings,
the Power (P) and Efficiency () points can be calculated
and plotted on the curve.
The Net Positive Suction Head Required (NPSHR) curve
can be determined by laboratory testing and can also be
included to show the suction capabilities of the pump at
various rates of flow.
75.
Pump Selection Guide
PumpSelection Guide
1. For required duty make preliminary pump selection using
selection (tombstone) charts. Decide on 2900 rpm or 1450
rpm
2. Go to individual performance curve for more detail
3. Select impeller diameter, determine kW requirement of
driver and check suction capability of pump (take into
account density & viscosity where applicable)
Pump Selection Guidecont’d
Pump Selection Guide cont’d
4. Select material of construction for liquid being pumped
(check material charts for liquids other than water)
5. Check maximum working pressure & temperature does not
exceed
• Casing material limitation
• Mechanical seal or packed gland limitation
6. Check maximum allowable suction pressure does not exceed
mechanical seal or packed gland limitation
Effect of changeof Speed
Effect of change of Speed
The Affinity Laws:
A. Flow directly proportional to speed:
2
1
2
1
N
N
Q
Q
B. Total head proportional to speed squared:
2
2
1
2
1
]
[
N
N
H
H
C. Power proportional to speed cubed:
3
2
1
2
1
]
[
N
N
P
P
81.
Example of speedchange:
A pump running at 3000 r.p.m. is capable of 12 l/s at 60m head and
requires 18.5 kw. What is equivalent duty at 2700 r.p.m.?
l/s
8
.
10
3000
2700
12
1
2
1
2
N
N
Q
Q
m
6
.
48
3000
2700
60
2
2
1
2
1
2 ]
[
]
[
N
N
H
H
kw
49
.
13
3000
2700
5
.
18
3
3
1
2
1
2 ]
[
]
[
N
N
P
P
83.
Effect of changeof Impeller Diameter
Effect of change of Impeller Diameter
A similar law governs the performance obtained for impeller
turn downs.
A. Flow directly proportional to impeller diameter:
2
1
2
1
D
D
Q
Q
B. Total head proportional to impeller diameter squared:
2
2
1
2
1
]
[
D
D
H
H
C. Power proportional to impeller diameter cubed:
3
2
1
2
1
]
[
D
D
P
P
84.
Example of impellerchange:
A pump running at 3000 r.p.m. is capable of 12 l/s at 60m head and requires
18.5 kw. What is equivalent duty if the impeller was reduced from 350mm to
300mm diameter.?
l/s
28
.
10
350
300
12
1
2
1
2
D
D
Q
Q
m
08
.
44
350
300
60
2
2
1
2
1
2 ]
[
]
[
D
D
H
H
kw
65
.
11
350
300
5
.
18
3
3
1
2
1
2 ]
[
]
[
D
D
P
P
87.
When one pumpis discharging into the suction of an
identical pump, they deliver the same amount & each pump
adds energy to the liquid by increasing its pressure.
For series operation the combined performance curve is
obtained by adding vertically the heads at the same flow
rate.
Pumps in Series
Pumps in Series
89.
A multistage pump
isa good example
of pumps segments
operating in series.
Top section of the
curve shows H-Q of
combined pump
Bottom section of
curve shows
•Efficiency
•Power absorbed
on a per stage basis
90.
When two ormore pumps discharge simultaneously into a
common delivery line.
For parallel operation the combined performance curve is
obtained by adding horizontally the flow rates at the same
heads.
Pumps in Parallel
Pumps in Parallel
92.
NPSH
Net Positive SuctionHead is a method of
defining pump suction conditions that allow us
to predict whether cavitation will occur in a
particular pump under given suction conditions.
The NPSHA (of the system) needs to be
evaluated and compared with the NPSHR of the
pump under consideration.
NPSH is usually expressed in linear terms - metres
93.
NPSHA must begreater than NPSHR
(a safety margin of 0.5 m should be observed)
94.
v
s H
H
NPSHA
v
s
H
H= Total Absolute Suction Head at Pump Suction
= Vapour Head of Pumped Liquid
Cavitation
Cavitation is theformation & subsequent collapse of
vapour bubbles in the liquid flow & is one of the most
significant causes of pump performance &
maintenance problems.
The pressure at the eye of the impeller must be
sufficient to maintain the fluid being pumped in its
liquid state. For this reason it is important to know the
properties of the fluid being pumped and particularly
it’s vapour pressure at the pumping temperature.
99.
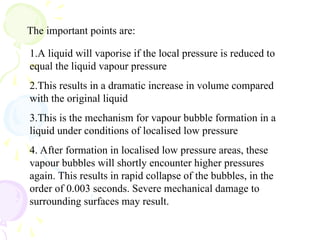
The important pointsare:
1.A liquid will vaporise if the local pressure is reduced to
equal the liquid vapour pressure
2.This results in a dramatic increase in volume compared
with the original liquid
3.This is the mechanism for vapour bubble formation in a
liquid under conditions of localised low pressure
4. After formation in localised low pressure areas, these
vapour bubbles will shortly encounter higher pressures
again. This results in rapid collapse of the bubbles, in the
order of 0.003 seconds. Severe mechanical damage to
surrounding surfaces may result.
106.
AVOIDING CAVITATION
AVOIDING CAVITATION
•Ensure NPSHA is greater than NPSHR for all
pump operating conditions
• Check properties of liquid pumped at pumping
temperature. Re-check the vapour pressure at
this temperature
• Remedies for cavitation problems are not
simple and are often expensive to apply
107.
EFFECT OF LIQUIDpH value of pump material selection
EFFECT OF LIQUID pH value of pump material selection
pH Values
Neutral Alklinity
Acidity
pH 7 14
0
• Sour
•Turns blue litmus paper red
•Releases hydrogen upon
contact with various metals
• Slimy and bitter
• Turns red litmus paper blue
• Absorbs carbon dioxide
Soapy Water
Lemon Juice
108.
pH Value &Materials of Construction
pH Value & Materials of Construction
pH Value Material of Construction
0 - 4 Corrosion resistant alloy steels
4 - 6 All Bronze
6 - 8 Bronze fitted/ Standard Construction
8 - 10 All Iron
10 - 14 Corrosion resistant alloys
109.
VISCOSITY
VISCOSITY
• Viscosity meansresistance to internal shear
of the liquid. The higher the viscosity the
less easy the liquid is to pour. It is normally
measured in centistokes or SSU.
• Viscosity of most liquids varies with
temperature, at higher temperature, the
viscosity reduces.
• Higher viscous fluids (above 3000SSU) are
best handled with a positive displacement
pump.
110.
• Using acentrifugal pump to handle viscous
fluids affects the following pump
characteristics :
– Reduction in capacity
– Reduction in head
– Increase in power
– Decrease in pump efficiency
VISCOSITY
VISCOSITY
111.
In the viscositycorrection tables the following
In the viscosity correction tables the following
units are used
units are used
• Qvis – Viscous Capacity (m3/h)
• Hvis – Viscous Head (m)
• ηvis – Viscous Efficiency (%)
• Pvis – Viscous Power
• Qw – Water Capacity (m3/h)
• Hw – Water Head (m)
• ηw -Water Efficiency (%)
• SG – Density of Liquid
• Cq - Capacity Correction Factor
• Ch –Head Correction Factor
• Cn –Efficiency Correction Factor
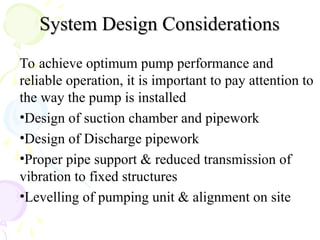
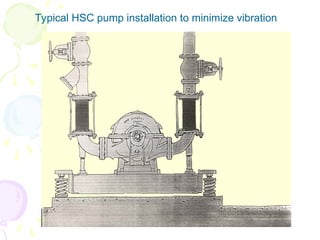
System Design Considerations
SystemDesign Considerations
To achieve optimum pump performance and
reliable operation, it is important to pay attention to
the way the pump is installed
•Design of suction chamber and pipework
•Design of Discharge pipework
•Proper pipe support & reduced transmission of
vibration to fixed structures
•Levelling of pumping unit & alignment on site
Pre-commissioning Checklist
Stage 1
1.Ensure that driver is isolated, coupling & pipe flanges
disconnected
2. Check base is level, anchored & grouted into position
3. Check pump & driver are firmly attached to base
4. Check suction & discharge pipework is aligned to pump flanges
& correctly supported. PIPEWORK LOADS MUST NOT BE
TRANSMITTED TO PUMP FLANGES
5. Inspect both suction & discharge pipework & ensure both are
free of installation debris
6. Turn pump by hand to ensure free rotation
7. Check coupling alignment
128.
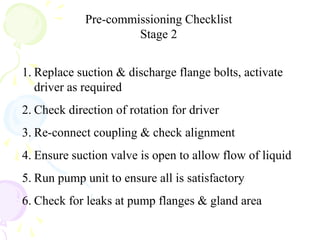
Pre-commissioning Checklist
Stage 2
1.Replace suction & discharge flange bolts, activate
driver as required
2. Check direction of rotation for driver
3. Re-connect coupling & check alignment
4. Ensure suction valve is open to allow flow of liquid
5. Run pump unit to ensure all is satisfactory
6. Check for leaks at pump flanges & gland area
Australian Standard forPump Performance Testing
Rotodynamic Pumps
AS2417 – 1980 (standard shown on most curves used in Australia). This code was
equivalent to ISO 2548 and both have been superseded
Current Australian Standard:– AS2417 - 2001
Current ISO Standard :– ISO 9906 – 1999 (identical to AS2417 - 2001)
AS2417 – 2001 AS2417 - 1980
Grade 1 Class A
Grade 2 Class B
Annex A Class C
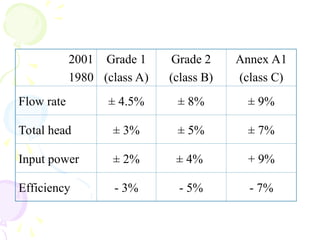
140.
2001
1980
Grade 1
(class A)
Grade2
(class B)
Annex A1
(class C)
Flow rate ± 4.5% ± 8% ± 9%
Total head ± 3% ± 5% ± 7%
Input power ± 2% ± 4% + 9%
Efficiency - 3% - 5% - 7%
Pump Power InputMeasurement
1.Electrical method – using motor of
known efficiency
2.Torque method – using a torque
meter/dynamometer
149.
Speed of RotationMeasurements
1.Direct indicating tachometer
2.Tachometric alternator/dynamo
3.Optical or magnetic counter
4.Stroboscope
150.
Even the bestpump can give trouble
Even the best pump can give trouble
• Pumps are selected based on nominated
conditions of service at the design stage.
However, these conditions are not always met on
site
• Trouble-shooting may need to be undertaken if
the pump is not performing to expectations
• Careful observation of all system parameters will
verify if the pump is operating at the design
condition.
152.
Trouble shooting
Trouble shooting
•Ifpossible, have pump test curve available. This should be an
accurate prediction of performance
•Fit good quality pressure gauges to suction and discharge pipework
close to pump flanges.
•Have tachometer available to verify pump speed
•Have multimeter available to measure motor voltage and current
By taking a few measurements, it should be possible to determine
the pump operating point and compare it with the design conditions.
153.
Trouble Shooting
No Dischargeor Insufficient Discharge:
1. Pump not primed properly – re-prime and repeat operation
2. Speed too low – driver speed is incorrect
3. System head too high – system head has been incorrectly
calculated.
4. Wrong direction of rotation – change driver DOR if possible
5. Impeller plugged – open pump and check impeller vanes are not
blocked
6. Insufficient NPSHA – Pump may be cavitating
7. Strainer clogged – remove strainer and clean
8. Impeller damaged – repair or replace impeller
154.
Trouble Shooting
Trouble Shooting
InsufficientPressure:
1. Speed too low – check speed of driver is correct
2. System head to low – pump operating point below design point.
Re-check system calculations.
3. Air entrapment – vent all air for the system. Recheck intake
submergence, and eliminate the possibility of leaks
4. Impeller damaged – repair or replace
5. Wrong direction of rotation – reverse DOR of driver if possible
6. Impeller diameter too small – fit larger impeller or increase driver
speed if possible
155.
Trouble Shooting
Trouble Shooting
Excessivepower:
1. Speed higher than that used for pump selection - Recheck
calculations. Adjust speed to suit actual conditions
2. System head is higher than rated (axial & mixed pumps) – pump
may be operating in high kW zone near closed valve
3. Specific gravity or viscosity of fluid is higher than used in
calculations for power. Re-check power calculations
4. Impeller binding due to misalignment – rotate pump by hand; re-
check alignment
5. Bent shaft causing binding on bearings- replace shaft
6. Pump operating point is not in accordance with design and too far
to right of BEP – recheck system head calculations.
156.
Trouble Shooting
Excessive noise:
1.Loose or broken parts of the driver
2. Loose pump parts
3. Pump mounting not sufficiently rigid
4. Driver running too fast
5. Blocked strainer or pump partially or completely obstructed
6. Bent shaft or shaft misalignment
7. Lubrication failure
8. Insufficient submergence causing air entrainment or trapped air in
suction line
9. Pump over-discharging or inadequate NPSHA causing cavitation
157.
Sealing Problems
One ofthe most common problems
experienced with centrifugal pumps is
seal leakage.
1. Packed gland
2. Mechanical seals
#35 Standard seal
Show rotating & stationary elements
§ display – welded bellows balanced seal
§ display – multi spring
Point out springs
§ display – cartridge
Seal manufacturers selling this option as a change over arrangements.
Lets look at common seal problems
§ next slide
#66 Problem
Referring to the illustration, a pump takes water from a sump and delivers it through 380 m of 100 mm diameter schedule 40 steel pipe. The suction pipe is 100 mm vertical, 1.5 m long and includes a hinged disc foot valve and a standard 90 degree flanged elbow. The discharge line includes two standard 90 degree flanged elbows, a flanged swing check valve and an open gate valve.
We need to find the total system head when the rate of flow is 15 L/s and the total static head on the pump is 80 m.
§ Next slide
#69 Display
§ Display answer
Lets see you work this one out
§ next slide
#71 How do we obtain performance curves??????
§ Display – Hydraulic properties…..
§ Display – By plotting……….
§ Display - This is …………..
§ Next slide
#72 § Display – If the power ……
§ Display – The NPSH …..
Lets see a typical curve
§ Next slide
#73 Tabulated form of results from test showing:
§ Display – client details, measuring instruments, duty, pump
size, speed, power, driver details
§ Display – Tabulated results for various flow conditions.
§ Display – signature for tester & witness
Taking this information a specific performance curve is produced
for the client.
§ Next slide
#74 This is the result - The client pays a premium for this detail.
§ Display – duty point shown and all relevant details are
graphically displayed using the points from the tabulated chart.
§ Display – Notice that a speed curve is shown.
As the pump was tested with its own motor (which is common)
then the speed is displayed.
Note the variation over the envelope. It is important to be
aware of the motor speed at the various load conditions as the
pump manufacturer usually tests pumps with a fixed speed
dynamometer so the speed is constant (i.e. 1450 rpm).
A low kw rating motor has a full load speed of less than
1450 rpm (say 1420 rpm) – what will this do……
§ Next slide
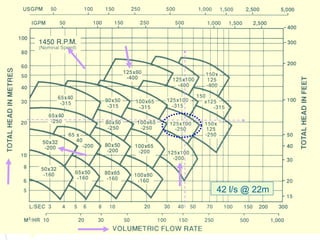
#76 § Display – shows flow, head & speed
§ Display – shows various pump sizes
As you can see this graph shows the bare minimum details for
any pump size, its primary use is to show the H/Q envelope for
each pump so this graph is our first point of reference when
given a pump duty. This enables us to PRESELECT a pump
– lets demonstrate.
§ Display – lets say we are looking at pumping water with a
duty of…
§ Display – first the flow
§ Display – next the head
§ Display – where they intersect we have our proposed
pump size.
The next step is to go to the individual pump curve…….
§ Next slide
#77 § Display - OK so here’s our individual curve 125 x 100 – 250 at 1450 rpm
We talked about the pump H/Q envelope – this it (use mouse to show)
flow 0 – 65 l/s & heads from 16 – 27 metres
Notice we have different impeller diameters shown.
Max imp 278 mm min imp 222 mm. These are set by the manufacturer and a
pump can generally operate within this envelope subject to certain conditions
which we will discuss as we go along.
The manufacturer usually supplies a stock pump with a full (max) diameter
impeller as standard & charges extra to trim the impeller to meet a given
duty. If the pump is specifically built for a client , then the impeller would be
trimmed to suit that duty. If an agent had a standard pump & it required an
impeller trim, then you would need to ensure this is done before sending it to
your client. There can be serious consequences if this is not checked &
approved before sending to your client. We will discuss some of these
shortly.
OK back to our duty
§ Display – Duty was……
§ Display - first flow then head
We can see duty point is in between 278 & 264 diameters. Suggest 273 mm
You can nominate an impeller diameter anywhere between min & max.
What else can we see…
Power is 11 kw – so use 15 kw motor – check end of curve?? Notice curve
shows max power of 14.63 with max impeller so 15kw will be OK
What else…… Efficiency is 80.5%
Under most conditions that is all you need to select a pump & driver. Simple
The basic shape of the H/Q curve is typical for a radial flow impeller
Lets look at the results of a performance test
§ Next slide
#82 § Display - This is a various speed curve for a
125 x 100 – 200 pump
§ Display – It shows curves at different speeds instead of
different impeller diameters
Lets look at other types of curves….
§ Next slide
#85 § Display - This shows curve for 125 x 100 – 250
§ Display – shows flow
§ Display – shows head
§ Display – speed
§ Display – H/Q curve with different imp diameters
§ Display – Power curves
§ Display – Efficiency
§ Display – NPSHR
A pump manufacturer has a range of pump sizes so to assist in
easy selection they produce a graph showing the range of sizes
at a common speed.
This is commonly called a tombstone chart –
§ Next slide
#86 OK lets look at a different interpretation of a performance curve.
§ Display - This is a much bigger pump 400 – 300 – 500 at
970 rpm
You still have H/Q curves for various impeller diameters shown
You have efficiency curves shown
§ Display - You have power curves shown also individual
power curves with nominated impeller diameters.
You also have an NPSHR curve
The basic shape of this H/Q curve is typical for a mixed
flow impeller.
§ Next slide
#89 This display is of a vertical multistage pump showing additional
impeller stages
§ Display – from 3 to max of 16 stages.
§ Display – The power curve shown is for 1 impeller so has to be
multiplied by the required number of impellers. Usually this style
of pump is priced complete with the required motor, but much
larger flow multistage pumps are not & often only one curve
is shown.
§ Display – What does the different line density mean for
the curves…….
The heavy line is the preferred operating parameters for the
pump.
§ Next slide
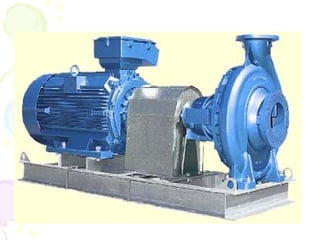
#123 Lets look at a complete pump set.
§ display – spacer
§ display – element - This only works if a spacer type coupling is used.
What advantages does this give
§ display – spring mounts - common in air-conditioning plants to cut down vibration & noise.
§ next slide
#130 Let just look at couplings for a moment
§ display – What used to be the standard – cone ring coupling
§ display - standard spacer coupling with flexible member both ends
§ display – for large kw drivers flex one end solid other.
§ display - components in today’s common coupling
flex member, driver/driven end
§ next slide
#158 Lets look at a stuffing box with a standard packed gland arrangement
Packed gland is the oldest form of seal & is still widely used today. They are easy to maintain & do not fail suddenly.
§ display – shaft sleeve – what purpose
§ display – lantern ring – purpose
§ display – packing – purpose
§ display – gland plate – purpose
Does a gland leak – how much
Does require constant adjustment & if tightened too much will burn shaft or sleeve.
Position of lantern ring
Deep stuffing box for higher operating pressures.
When operating above 70 M preference is then for mechanical seals
§ next slide
#159 Lets look at a shaft sleeve
§ display – 1st sleeve with packing shown.
Note – gap for position of lantern ring.
Many grades of packing available for many applications.
§ display – sleeve – shows wear
You can see where lantern ring was located.
Sleeves can be loose fit on shaft & held in position by impeller & driven by key, or “glued” on shaft.
In repairs depending on condition sleeves can be difficult to remove & often have to be heated & cut off.
Lets look at some other types of gland arrangements.
§ next slide
#160 View of stuffing box with standard type seal fitted.
§ display – spring sleeve used to compress seal & drive it.
§ display – mechanical seal
§ display – gasket
§ display – seal plate
Uses internal flush to seal. Sometimes an external connection from discharge into stuffing
Discuss cyclone separators
Standard seal suitable for low temperatures & low suction/discharge pressures – discuss
Lets look at some options
§ next slide
#161 § display - Wear track wider than narrow seal face
CAUSES:
Miscentering of stationary type seal
Radial shaft runout (bearing problem)
Shaft deflection/wobble during operation
§ display - Even/uneven wear track
CAUSES:
Even wear on a seal face usually indicates - Good contact between the mating seal rings
Uneven wear on a seal face indicates -
Distortion of the seal ring due to over tightening, clamping, or excessive pressure
Distortion due to insufficient gland support
Misaligned seal rings in a split seal
Improperly stress relieved component
§ display - Centered or miscentered
CAUSES: Centered seal face wear track indicates -
Properly centered seal and good equipment operation Miscentered seal face wear track indicates -
Miscentered seal (rotary type) during installation
Equipment condition - Radial runout
Equipment operation - Off curve, vibration
#162 § display - Chipping on outside/inside diameter
CAUSES:
Faces opening/flashing - Operating near vapour point
Vibration
Cavitation - Equipment operation
Products hardening and setting-up
Over pressurization
§ display - Scoring or erosion
CAUSES:
Rebuilding seal in dirty environment
Faces opening/flashing/vibration/distortion of the seal face due to temperature and pressure
Minerals found in the fluid film between the seal faces
§ display - Coking or crystallized product
CAUSES:
Excessive temperatures (both)
Dirty or contaminated fluid (coking)
Operating outside of the temperature envelope of the fluid (both)
Small clearances in the seal chamber
Pump cooling jacket not efficient
Fluid evaporation between the seal faces (crystallization)


![Effect of change of Speed
Effect of change of Speed
The Affinity Laws:
A. Flow directly proportional to speed:
2
1
2
1
N
N
Q
Q
B. Total head proportional to speed squared:
2
2
1
2
1
]
[
N
N
H
H
C. Power proportional to speed cubed:
3
2
1
2
1
]
[
N
N
P
P
](https://image.slidesharecdn.com/pumpbasictraining-251005131832-e6a83be5/85/Electromechanical-works-PUMP-BASIC-TRAINING-80-320.jpg)
![Example of speed change:
A pump running at 3000 r.p.m. is capable of 12 l/s at 60m head and
requires 18.5 kw. What is equivalent duty at 2700 r.p.m.?
l/s
8
.
10
3000
2700
12
1
2
1
2
N
N
Q
Q
m
6
.
48
3000
2700
60
2
2
1
2
1
2 ]
[
]
[
N
N
H
H
kw
49
.
13
3000
2700
5
.
18
3
3
1
2
1
2 ]
[
]
[
N
N
P
P](https://image.slidesharecdn.com/pumpbasictraining-251005131832-e6a83be5/85/Electromechanical-works-PUMP-BASIC-TRAINING-81-320.jpg)

![Effect of change of Impeller Diameter
Effect of change of Impeller Diameter
A similar law governs the performance obtained for impeller
turn downs.
A. Flow directly proportional to impeller diameter:
2
1
2
1
D
D
Q
Q
B. Total head proportional to impeller diameter squared:
2
2
1
2
1
]
[
D
D
H
H
C. Power proportional to impeller diameter cubed:
3
2
1
2
1
]
[
D
D
P
P
](https://image.slidesharecdn.com/pumpbasictraining-251005131832-e6a83be5/85/Electromechanical-works-PUMP-BASIC-TRAINING-83-320.jpg)
![Example of impeller change:
A pump running at 3000 r.p.m. is capable of 12 l/s at 60m head and requires
18.5 kw. What is equivalent duty if the impeller was reduced from 350mm to
300mm diameter.?
l/s
28
.
10
350
300
12
1
2
1
2
D
D
Q
Q
m
08
.
44
350
300
60
2
2
1
2
1
2 ]
[
]
[
D
D
H
H
kw
65
.
11
350
300
5
.
18
3
3
1
2
1
2 ]
[
]
[
D
D
P
P](https://image.slidesharecdn.com/pumpbasictraining-251005131832-e6a83be5/85/Electromechanical-works-PUMP-BASIC-TRAINING-84-320.jpg)