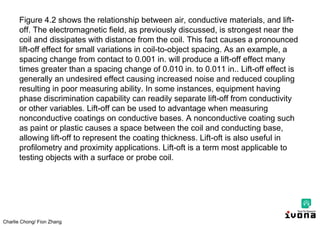
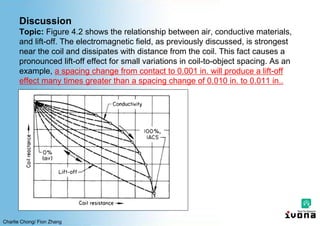
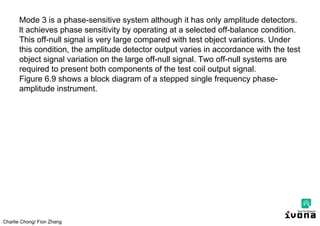
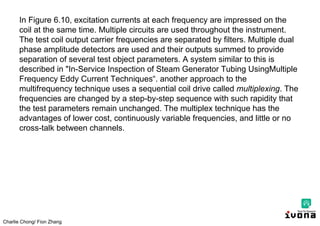
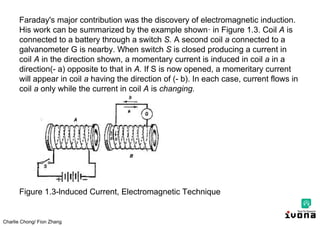
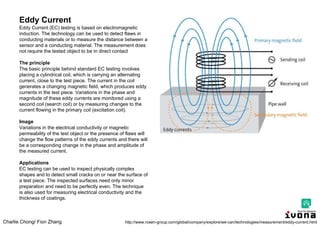
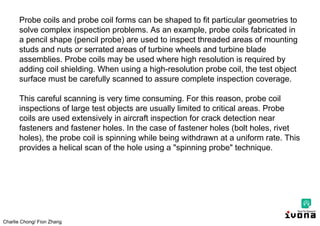
The document provides an in-depth study guide on eddy current testing principles, emphasizing the foundational concepts of magnetism and electromagnetism as it relates to the testing process. Key historical contributions by scientists such as Faraday and Maxwell are discussed, alongside the mechanisms of electromagnetic induction and the generation of eddy currents in conducting materials. Additionally, it outlines the mathematical relationships governing eddy currents, including current density and standard depth of penetration in test objects.


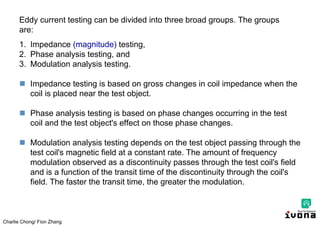
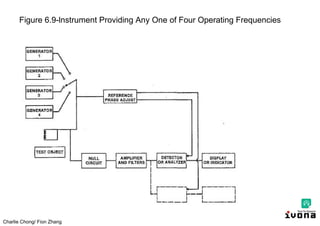
![Charlie Chong/ Fion Zhang
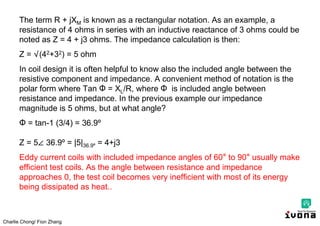
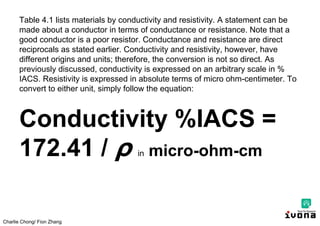
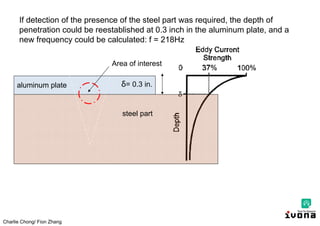
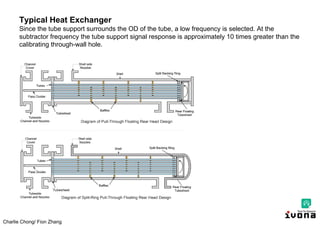
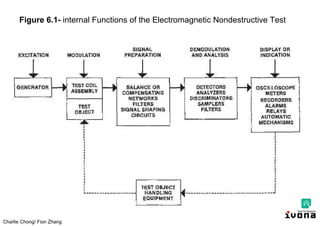
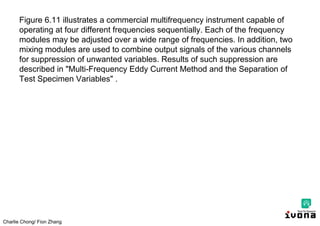
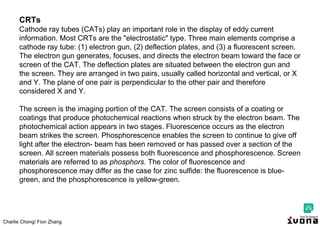
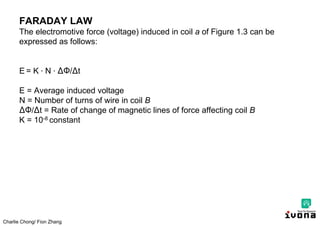
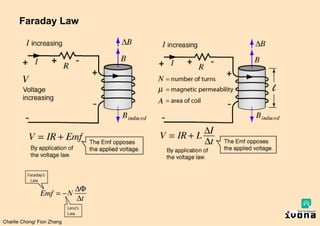
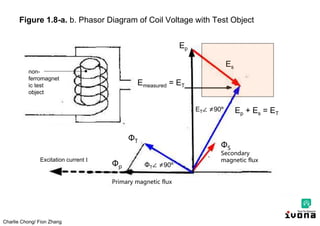
Faraday Law
Increasing current in a coil of wire will generate a counter emf which opposes the current.
Applying the voltage law allows us to see the effect of this emf on the circuit equation. The fact
that the emf always opposes the change in current is an example of Lenz's law. The relation of
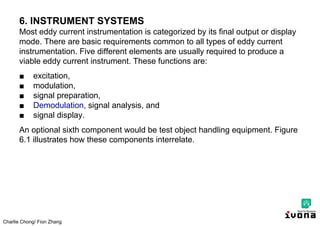
this counter emf to the current is the origin of the concept of inductance. The inductance of a coil
follows from Faraday's law.
Since the magnetic field of a solenoid is:
B = μNI ∙ (l -1)
Thus:
E = - NA ∙∆B/ ∆t, becomes;
E = - N A ∙∆ [μNI (l -1)] / ∆t
E = - NAμN ∙(l -1) ∙ ∆I/∆t
for L = N2Aμ (l -1)
E = -L ∆I/∆t #
E ∝ ∆ Ф/ ∆t (Faraday Law)
E = - N ∆Ф/ ∆t
Ф = BA
B = flux density
A = Area under the influence of B
For a fixed area and changing
current, Faraday's law becomes:
E = - N ∆Ф/ ∆t = -N ∆BA/ ∆t
for Ф = BA
http://hyperphysics.phy-astr.gsu.edu/hbase/magnetic/indcur.html](https://image.slidesharecdn.com/electromagnetictestingasntleveliiis-240820135150-696c0f8e/85/Electromagnetic_Testing_ASNT_Level_III_S-pdf-25-320.jpg)


![Charlie Chong/ Fion Zhang
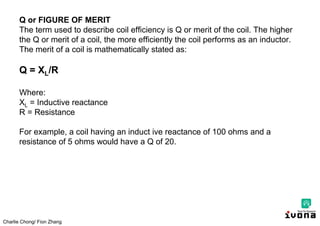
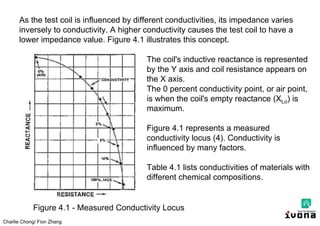
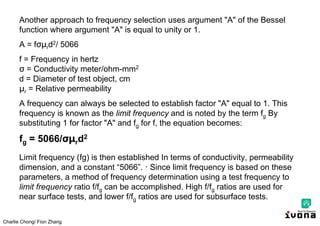
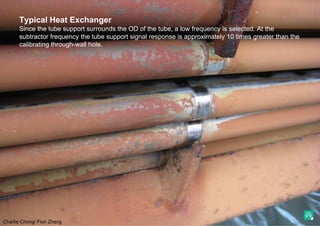
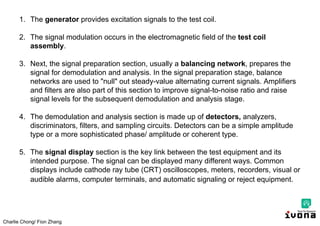
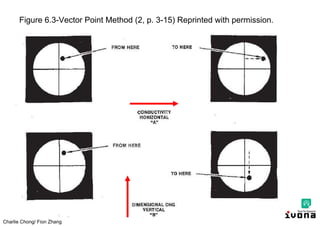
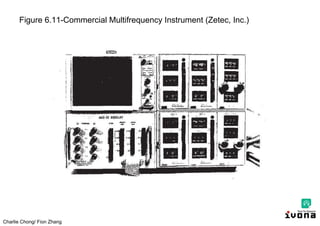
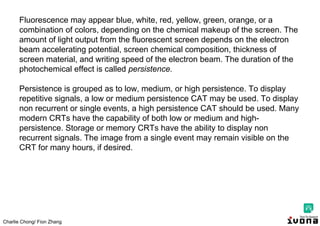
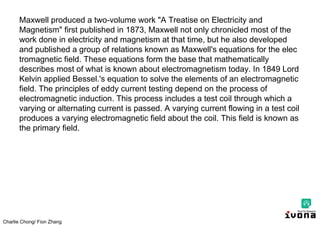
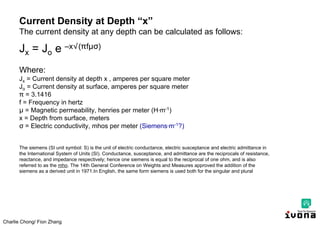
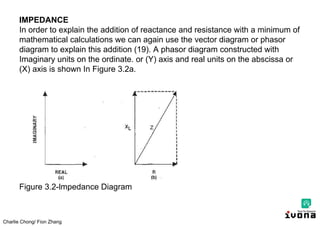
Substituting Inductive reactance (XL) and resistance (R) we can find the
resultant of the vector addition of XL and R. This resultant vector Z is known
as impedance. Impedance is the total opposition to current flow. Further
observation of Figure 3.2b reveals XL, R, and Z appear to form the sides of a
right triangle. The mathematical solution of right triangles states the square of
the hypotenuse is equal to the sum of the squares of the other two sldes, or
c2 = a2 + b2 , substituting the Z, R & XL, the equation becomes
Z2 = R2 + XL
2
Z = √(R2 + XL
2)
Let's try an example. What is the impedance of a coil having an inductance of
100 microhenries and a resistance of 5 ohms and being operated at 200
kilohertz? First we must convert inductance to inductive reactance and then,
by vector addition, combine inductive reactance and resistance to obtain the
impedance.
Z = [ 52 + (2 ∙200 ∙103 ∙100 ∙10-6)2]0.5
Z = 125.76 Ohm](https://image.slidesharecdn.com/electromagnetictestingasntleveliiis-240820135150-696c0f8e/85/Electromagnetic_Testing_ASNT_Level_III_S-pdf-134-320.jpg)