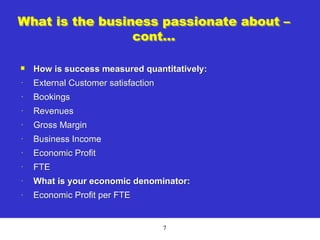
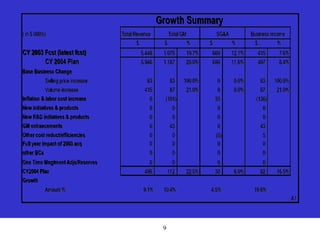
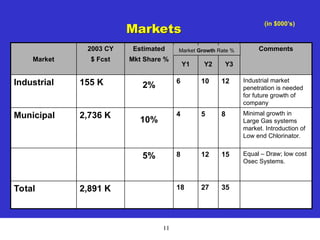
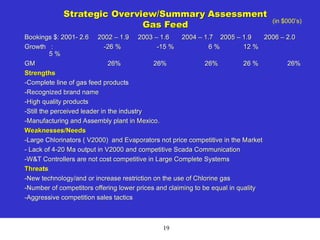
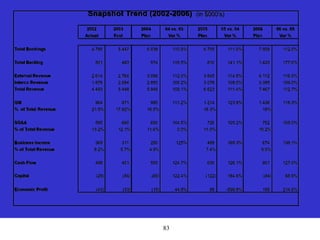
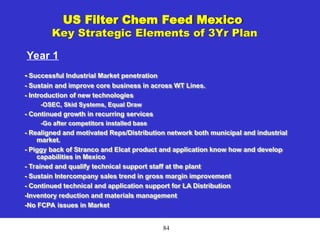
US Filter Chem Feed Mexico
Annual Plan Review
2004 - 2006
CONFIDENTIAL
Date: Sept 10, 2003
Location: Mexico
2
USFilter Chem Feed Mexico
Three Year Plan
2004-2006
 Good to Great Recap
 Growth Summary
 Strategic Overview and Bookings
 Business Income and Drivers
 Capital and Cash Flow
 Key Metrics and Economic Profit
 Risks and Opportunities
 Summary
3
Good to Great Recap
4
“The Bus”
 What did you do in 2003 to get the right people on bus – and
in the right seats:
-Replaced CNC operators with CNC Set Up and Operate capable
candidates.
-Jacinto Buitron in Quality Assurance ( Outside Consultant).
-Replacement of 3 people: Traffic, Purchasing & Production Planning.
- How is your bus set-up for 2003/2004:
-Hire National Sales Manager to focus on Sales Structure and Selling
Disciplines and increment Sales.
-Hire Assistant Controller to free A. Cigarroa in Operations Management
-Continue to upgrade positions across functional departments to insure
succession planning and high qualified personnel.
-Technical Services
-Sales & Customer Service
-Manufacturing & Assembly Areas and Warehouse
5
Brutal Facts
 What are the brutal facts in your business:
- Deal with FCPA in the Market Place
- Economic and political instability
- Overall Lack of knowledge of the market and potential market
- Rep & Distribution Network and Routes to Market needs to be restructured
- Minimal participation in Industrial Market
- Markets are highly competitive – low price driven
- Perceived as a High Priced equipment provider
 How are you addressing these facts:
- Hire National Sales Manager
- Additional Product and Application Training Schedule for 03 and 04 in applications
and equipment
- Invest in Market research – Up Grade position
- Maintain current position in dealing with FCPA issues
- Development & implementation of “Culture of Discipline”
6
What is the business passionate about?
 What is your business passionate about:
- Local Integration of Chem Feed technologies and systems for
producing gas feed and chemical dosing equipment.
- Assembly and machining high quality parts for CFG products.
 Can you be the best in the world at it:
- YES, continued development of internal tools and
procedures and personnel in both application and technical
expertise in Chemical dosing systems.
- Under W&T Vineland guidance and technical support,
continued implementation of rapid manufacturing
methodology and culture.
7
What is the business passionate about –
cont…
 How is success measured quantitatively:
- External Customer satisfaction
- Bookings
- Revenues
- Gross Margin
- Business Income
- Economic Profit
- FTE
- What is your economic denominator:
- Economic Profit per FTE
8
“Culture of Discipline”
 What is your culture of discipline:
• Lacking of consistent performance and steady sustainable improvement.
• On a fire drill basis in conducting business
 What will change in 2003/2004
Drive “Culture of Discipline” in the organization
-
Stick and comply to our promises
-
Listen to the customer and make the necessary changes.
Maintain and improve dealing with our colleagues and co workers with
respect and dignity
-
Internal Bureaucracy is our enemy-Remove all non value added
activities
-
The “stop doing list” has been defined – IMPLEMENT Changes
9
Growth Summary
( in $ 000's) Total Revenue Total GM SG&A Business Income
$ $ % $ % $ %
CY 2003 Fcst (latest fcst) 5,448 1,075 19.7% 660 12.1% 415 7.6%
CY 2004 Plan 5,946 1,187 20.0% 690 11.6% 497 8.4%
Base Business Change
Selling price increase 83 83 100.0% 0 0.0% 83 100.0%
Volume increase 415 87 21.0% 0 0.0% 87 21.0%
Inflation & labor cost increase 0 (101) 35 (136)
New initiatives & products 0 0 0 0
New R&D initiatives & products 0 0 0 0
GM enhancements 0 43 0 43
Other cost reduct/efficiencies 0 0 (5) 5
Full year impact of 2003 acq 0 0 0 0
0 0 0 0
One Time Mngtment Adjs/Reserves 0 0 0 0
CY2004 Plan 498 112 22.5% 30 6.0% 82 16.5%
Growth
Amount % 9.1% 10.4% 4.5% 19.8%
A1
Product & headcount transfer to / from
other BCs
10
Strategic Overview and Bookings
11
Markets
(in $000’s)
35
27
18
2,891 K
Total
Equal – Draw; low cost
Osec Systems.
15
12
8
5%
Minimal growth in
Large Gas systems
market. Introduction of
Low end Chlorinator.
8
5
4
2,736 K
Municipal
Industrial market
penetration is needed
for future growth of
company
12
10
6
155 K
Industrial
Comments
Rate %
Y3
Growth
Y2
Market
Y1
Estimated
Mkt Share %
2003 CY
$ Fcst
Market
Market Growth Rate %
10%
2%
12
Strengths
Strengths ( W&T) Benefit Brought to Customers &
Market
Manufacturing Facility in Mexico Closer to customer. Identified as a
Mexican company
Well-known W&T Name/Trademark Experience and local Technical
service support
Service, project engineering,
capabilities
Provide total package to customer
Extensive Installation Base Well-known product in the industry
ISO 9000 Certification Confidence of customers
13
Weaknesses
Weaknesses Actions to Offset or to Mitigate
Weaknesses
Distribution Network is weak and not
performing to potential.
Re-Structure and eliminate non performers.
Low participation on Industrial Market
and Opportunities
Develop new market channels and
distribution/Rep Network.
Continued Economical Instability in the
country
Focus on Long term relationships with key
and new accounts
Profiled as a company with high prices
in a highly competitive dosing systems.
Drive application engineering to develop
applicable solutions to meet customer
demands and specs.
Slow to commercialize new products Implement dedicated focus and Resources
to trial and a[[lications
Sales Organization struggles to think
“outside the box”.
More Focused sales channels with new
National Sales Manager
14
Bookings Product Line Summary (in $000's)
2001 Actual 2002 Actual 2003 Fcst 2003 Plan 2004 Plan 2005 Plan 2006 Plan
Product Line $ GM % $ GM % $ GM % $ GM % $ GM % $ GM % $
Gas Feed 2,689 26.0% 1,934 26.0% 1,590 26.0% 1,434 26.0% 1,751 26.0% 1,850 26.0% 2,080
Liquid Feed 2,631 15.0% 2,219 10.0% 3,088 10.9% 2,653 12.5% 3,244 11.0% 3,550 11.6% 3,950
Service 67 58.2% 200 60.0% 180 60.0% 200 60.0% 200 60.0% 210 60.0% 250
Machining 219 15.0% 224 14.0% 233 15.0% 505 15.0% 257 15.0% 257 15.0% 275
Instrumentation/analizer/controller 100 26.0% 181 26.0% 247 22.0% 296 26.0% 275 22.0% 295 22.0% 320
Vareameter 69 15.0% 96 18.6% 90 22.0% 142 24.5% 100 22.0% 110 22.0% 120
Skid Systems 396 20.0% 0 0
Chloropac 430 20.0% 180 14.2% 180
Dry and Liquid Preparation 20 22.0% 214 20.0% 46 22.0% 80 22.0% 110
OSEC 90 21.3% 90 21.3% 120
Water champ 30 22.0% 33 22.0% 36
UV 20 22.0% 20 22.0% 33
Pressure Gauges 25 22.0% 30 22.0% 35
0 0
0 0
0 0
0 0
Aftermarket (If reported as a product line) 0 0 0 0 0 0 0
Total (all including Spares & Interco) 5,775 20.8% 4,854 19.4% 5,448 17.8% 6,270 19.5% 6,038 18.2% 6,705 18.3% 7,509
Total % Growth -16% 12% 29% 11% 11% 12%
Interco in Total 2,497 10.0% 2,046 8.0% 2,557 6.9% 2,310 9.0% 2,700 7.9% 2,739 8.0% 2,821
Interco as % of Total 43.2% 42.2% 46.9% 36.8% 44.7% 40.9% 37.6%
Spares in Total 723 40.0% 670 27.8% 1,211 40.0% 1,938 40.0% 853 40.0% 950 40.0% 1,080
Spares as % of Total 12.5% 13.8% 22.2% 30.9% 14.1% 14.2% 14.4%
Industrial in Total 0 85 20.0% 155 21.0% 155 20.0% 704 21.0% 790 21.0% 910
Industrial as % of Total 0.0% 1.8% 2.8% 2.5% 11.7% 11.8% 12.1%
Municipal in Total 2,555 26.0% 2,053 28.0% 1,525 18.2% 1,867 11.0% 1,781 22.3% 2,226 20.8% 2,698
Municipal as % of Total 44.2% 42.3% 28.0% 29.8% 29.5% 33.2% 35.9%
15
Industrial Bookings - External (in $000's)
2001 2002 2003 2004 2005 2006
By Region By Region
Capital
Domestic 0 0 0 0 0 0
Asia 0 0 0 0 0 0
Latin America 0 85 155 704 790 910
Europe 0 0 0 0 0 0
ROW 0 0 0 0 0 0
Aftermarket & Service 0 0 0 50 60 70
Total Industrial 0 85 155 754 850 980
By Market
Capital
Automotive 0 0 0 0 0 0
BioPharm 0 0 0 136 157 182
Chemical/CPI 0 0 0 0 0 0
Food & Beverage 0 0 0 0 0 0
Metal Finishing 0 0 0 0 0 0
Microelectronics 0 0 0 0 0 0
Oil & Gas 0 0 0 0 0 0
Petrochemical/HPI 0 85 155 159 180 207
Power 0 0 0 408 453 0
Primary Metals 0 0 0 0 0 521
Pulp & Paper 0 0 0 0 0 0
Other 0 0 0 0 0 0
Aftermarket & Service 0 0 0 50 60 70
Total Industrial 0 85 155 754 850 980
B1
16
2001 2002 2003 2004 2005 2006
By Region
Capital
East 0 0 0 0 0 0
Central 0 0 0 0 0 0
West 0 0 0 0 0 0
Total Domestic 0 0 0 0 0 0
Asia 0 0 0 0 0 0
Latin America 2,739 2,079 1,916 1,781 2,226 2,698
Europe 0 0 0 0 0 0
ROW 0 0 0 0 0 0
Total Capital 2,739 2,079 1,916 1,781 2,226 2,698
Aftermarket & Service 723 670 811 803 890 1,010
Total Municipal 3,462 2,749 2,727 2,584 3,116 3,708
B1
Municipal Bookings - External (in $000's)
17
2001 2002 2003 2004 2005 2006
Systems 2,497 1,961 2,565 2,700 2,739 2,821
Service 0 0 0 0 0 0
Other 0 0 0 0 0 0
Total USF 2,497 1,961 2,565 2,700 2,739 2,821
VWS - Asia 0 0 0 0 0 0
VWS - Europe 0 0 0 0 0 0
VWS - Latin America 0 0 0 0 0 0
VWS - ROW 0 0 0 0 0 0
Total Intercompany 2,497 1,961 2,565 2,700 2,739 2,821
B1
Intercompany Bookings (in $000's)
18
2001 2002 2003 2004 2005 2006
Pr
Industrial Capital
Thru Indus S&M 0 0 0 0 0 0
BC's direct/Own 0 0 0 0 0 0
International 0 85 155 704 790 910
Total Indus Capital 0 85 155 704 790 910
% Change Yr over YR 82.4% 354.2% 12.2% 15.2%
Municipal Capital
Thru Muni S&M 0 0 0 0 0 0
BC's direct/Own 0 0 0 0 0 0
International 2,739 2,079 1,916 1,781 2,226 2,698
Total Muni Capital 2,739 2,079 1,916 1,781 2,226 2,698
% Change Yr over Yr -24.1% -7.8% -7.0% 25.0% 21.2%
Aftermarket & Service 723 670 811 853 950 1,080
% Change Yr over Yr -7.3% 21.0% 5.2% 11.4% 13.7%
Total External 3,462 2,834 2,882 3,338 3,966 4,688
Intercompany 2,497 1,961 2,565 2,700 2,739 2,821
% Change Yr over Yr -21.5% 30.8% 5.3% 1.4% 3.0%
Total Bookings 5,959 4,795 5,447 6,038 6,705 7,509
% Change Yr over Yr -19.5% 13.6% 10.9% 11.0% 12.0%
B1
Bookings Summary (in $000's)
19
Strategic Overview/Summary Assessment
Gas Feed
Bookings $: 2001- 2.6 2002 – 1.9 2003 – 1.6 2004 – 1.7 2005 – 1.9 2006 – 2.0
Growth : -26 % -15 % 6 % 12 %
5 %
GM 26% 26% 26% 26 % 26%
Strengths
-Complete line of gas feed products
-Recognized brand name
-High quality products
-Still the perceived leader in the industry
-Manufacturing and Assembly plant in Mexico.
Weaknesses/Needs
-Large Chlorinators ( V2000) and Evaporators not price competitive in the Market
- Lack of 4-20 Ma output in V2000 and competitive Scada Communication
-W&T Controllers are not cost competitive in Large Complete Systems
Threats
-New technology/and or increase restriction on the use of Chlorine gas
-Number of competitors offering lower prices and claiming to be equal in quality
-Aggressive competition sales tactics
(in $000’s)
20
Strategic Overview/Summary Assessment
Gas Feed
Opportunities
-Latin America and Mexico requirement for inexpensive disinfection equipment such as S2K
-Industrial market penetration with Packaged Systems
-Municipal opportunities in Complete packaged systems
-Cost savings opportunities
-Equal Draw introduccion
Key Priorities for next 1-3 years
-Continue offering value engineering to reduce cost and provide more price competitive
-Avalon Project Realization
-Less expensive automatic control arrangement
-Continued development of Inexpensive container mounted low-end chlorinator
21
Strategic Overview/Summary Assessment
Liquid Feed
Bookings $: 2001- 2.6 2002 – 2.2 2003 – 3.0 2004 – 3.2 2005 – 3.5 2006 – 3.9
Growth : -15 % 36 % 6 % 9 % 11 %
GM%: 10% 10.9 % 11 % 11.6%
12%
Strengths
-Robust and high quality products
-Most plant operators are somewhat familiar with the products
-Ability to package with other Chem Feed equipment
Weaknesses/Needs
-High price, most customer look for the bottom line only.
-We are not a full pump company
-Limited pump ranges and capacities.
-Lack of Higher pressure Pump arrangement.
-Lack of competitive accessories ( W&T product range)
Threats
-Pump manufacturers offer wide ranges pumps at aggressive, lower prices
-Distribution network do not promote the sale of our pump due to limited ranges
and capacities.
(in $ MM’s)
22
Strategic Overview/Summary Assessment
Liquid Feed
Opportunities
-Pumps skid packages
-Industrial sales penetration
Key Priorities for next 1-3 years
-Continue reduce cost Encore and Chemtube pumps
-Streamline accessories lines with more competitive pricing and current technology
-Automatic control options at lower cost.
23
Strategic Overview/Summary Assessment
Analyzers/Controller
Bookings $: 2001- 100 2002 - 181 2003 - 247 2004 - 275 2005 - 295 2006 – 320
Growth : 81 % 36 % 11% 7 % 8%
GM%: 26% 22% 22% 22% 22 %
Strengths
-Comprehensive line of chlorine residual analyzer and control systems
-Recognized brand name
Weaknesses/Needs
-Lack of non-chlorine measurement capability
-PCU/SCU Controllers too expensive
-Technical support for RACOD product
Threats
-Increased competition from ATI ( Acutec Supplier)
-Reduced use of chlorine in WW applications
-High Cost of micro analyzer
-Private level suppliers selling in same market such as Acutec 35
(in $000’s)
24
Strategic Overview/Summary Assessment
Analyzers/Controller
Opportunities
-TMS 561 Turbidimeter
-Reagentless chlorine measurement
Key Priorities for next 1-3 years
-Develop multi-parameter analyzer
-Provide internet enabled communications capability
-New generation of low cost controllers
25
Strategic Overview/Summary Assessment
Domestic Mexico
Bookings $: 2001- 3.2 2002 – 2.8 2003 – 2.9 2004 – 3.3 2005 – 3.9 2006 – 4.7
Growth : -12 % 3.5 % 13 % 18 %
20%
GM%: 27.6% 27.6% 27.6% 27.9 % 28.0%
Strengths
-Local plant
-Committed with Chem Feed products
-Weaknesses/Needs
-Lack of knowledge of Chem Feed products besides Wallace & Tiernan
-Distribution and rep network mainly focus on W&T
-Lack on application knowledge in other Chem Feed technologies
-Improve Vineland lead times
Threats
-Aggressive competition tactics on W&T side
-Performance issues with current distribution network
-Flat down trending gas market.
(in $ MM’s)
26
Strategic Overview/Summary Assessment
Domestic Mexico
Opportunities
-Waste water funding and new projects
-Industrial market penetration
-Local Intercompany sales activities
-Introduction of new products
Key Priorities for next 1-3 years
-Training in application knowledge for all Chem Feed products
-New sales territories and regions for both Industrial and Municipal Markets
-Development of application knowledge
27
Strategic Overview/Summary Assessment
Intercompany Mexico
Bookings $: 2001- 2.5 2002 – 2.0 2003 – 2.5 2004 – 2.7 2005 – 2.7 2006 – 2.8
Growth : -25 % 25 % 11 % 12 %
12%
GM%: 8% 6.9% 7.9% 8% 8.5%
Strengths
-Local plant
-Committed with Chem Feed products
-Weaknesses/Needs
-Lack of knowledge of Chem Feed products besides Wallace & Tiernan
-Distribution and rep network mainly focus on W&T
-Lack on application knowledge in other Chem Feed technologies
Threats
-Aggressive competition tactics on W&T side
-Performance issues with current distribution network
-Flat down trending gas market.
(in $ MM’s)
28
Strategic Overview/Summary Assessment
Intercompany Mexico
Opportunities
-Waste water funding and new projects
-Industrial market penetration
-Local Intercompany sales activities
-Introduction of new business
Key Priorities for next 1-3 years
-Training in application knowledge for all Chem Feed products
-New sales territories and regions for both Industrial and Municipal Markets
-Development of application knowledge
29
Business Income and Drivers
30
2001 2002 2003 Fcst 2004 CAGR
Product Line
1 Gas Feed 2,689 1,888 1,590 1,751 -13.3%
% growth -29.8% -15.8% 10.1%
2 Liquid Feed 134 397 764 801 81.5%
% growth 196.3% 92.4% 4.8%
3 Service 219 150 180 108 -21.0%
% growth -31.5% 20.0% -40.0%
4 Instrumentation/analizer/controller 100 277 247 275 40.1%
% growth 176.6% -10.7% 11.3%
5 Vareameter 69 96 90 100 13.2%
% growth 39.1% -6.3% 11.1%
6 Dry and Liquid Preparation 0 0 20 46
% growth 130.0%
7 OSEC 0 0 0 90
% growth
8 Water champ 0 0 0 30
% growth
9 UV 0 0 0 20
% growth
10 Pressure Gauges 0 0 0 25
% growth
11 0 0 0 0
% growth
12 0 0 0 0
% growth
13 0 0 0 0
% growth
14 0 0 0 0
% growth
15 0 0 0 0
% growth
Aftermarket & Service 0 0 0 0
% growth
Intercompany 2,497 2,046 2,557 2,700 2.6%
% growth -18.1% 25.0% 5.6%
Total 5,708 4,854 5,448 5,946 1.4%
% growth -15.0% 12.2% 9.1%
B3
Revenue by Product Line (in $000's)
31
Summary of Key Financial Drivers & Assumptions - 2004
Revenue (by Product Line if applicable)

market share (from base/existing business): 2% or 56K

New business: 359K or 5.1% in Industrial Market with W&T Products

price increases: 83K for 2% price increases, excluding Intercompany Prices

new products:

Low Cost OSEC and Equal - Draw
 Skid Systems manufacturing in Mexico
 Introduction of Chem Feed Technologies (Chloropac, OSEC)
 New Industrial reps Network
 Restructure Municipal network
(Summary of Change – 498K and 9.1% change vs. 2003 forecast
Key Plans and Success Factors (to make the above happen)
Note – beginning backlog = $482K (8.1% of planned FY
revenue)
32
2004 Opening backlog 482
Quarter
Q1 2004 482 1,181 917 1,399 65.5%
Q2 2004 0 1,544 1,619 1,619 100.0%
Q3 2004 0 1,666 1,696 1,696 100.0%
Q4 2004 0 1,647 1,686 1,686 100.0%
Total 482 6,038 5,918 6,400 92.5%
2004 Ending Backlog 574
B2
2004 Book to Bill Analysis - Revenue
Revenue from Opening
Backlog
2004 Bookings by
Quarter
Revenue from 2004
Bookings
Total 2004 Plan
Revenue
Book to Bill
Ratio %
33
US Filter Chem Feed Mexico
Major Projects in Year 1 Shipment Plan
(in $000’s)
Project Name Value GM $ Timing issues
CNA Pericos $ 500.0 $ 85.0 Q2-Q3 Large Gas Feed System-Highly Competitive
IMP / Pemex $ 150.0 $ 22.5 Q2 Automation of Cooling Towers
DEGREMONT-SLP $ 120.0 $ 18.0 Q3 Large Gas Feed System-Highly Competitive
ICA-FD / PEMEX $ 500.0 50.0 Q3 Automation of Cooling Towers
1,270.0
$ 175.5
$
34
New Products Built into Year 1 Plan (in $000’s)
Product Timing Revenue$ Gross Margin $
Equal Draw Q3 $ 30.0 4.5
Low End OSEC Q3,Q4 $ 90.0 13.5
TOTAL $ 120.0 $ 18.0
35
Key Components of Cost of Sales
2002 Actual 2003 Fcst 2004 Plan
Materials 2,350 3,091 3,374
Labor & Overhead:
Manufacturing 482 526 567
Engineering 189 206 222
Field Service 56 61 64
Other 544 593 640
Less: Absorption (1,271) (1,386) (1,492)
(Over) / Under Absorption 0 0 0
C3
36
Comments Regarding Key components
of Cost of Sales
 Maintain and continue driving down Materials cost
 Take advantage of Corporate Purchasing initiatives.
 Continued implementation of Manufacturing
Improvement Programs such as point of use stock,
family of products machining, cost reduction,
procurement savings and set up reduction)
 Design Centers yielding forecast cost reduction
37
CY2004
2002 2003 Q1 Q2 Q3 Q4
Direct Labor
MFG 28 30 30 30 30 30
ENG - - - - - -
Field Service 3 3 3 3 3 3
Materials - - - - - -
Other - Domestic sales 5 5 5 5 5 5
Other - List - - - - - -
Total Direct 36 38 38 38 38 38
Indirect Labor
MFG 11 13 13 13 13 13
ENG 1 1 1 1 1 1
Field Service - - - - - -
Materials 5 5 5 5 5 5
Other - List - - - - - -
Total Indirect 17 19 19 19 19 19
Total COGS 53 57 57 57 57 57
E1
COGS Headcount Trend Total
38
Comments Regarding COGS Headcount
Trend
 Headcount flat in Indirect labor in Manufacturing areas,
just replacement.
 Strong management of indirect manufacturing
expenses.
39
Gross Margin Summary (in 000's)
Product Line 2002 Actual 2003 Fcst 2004 Plan
$ GM % $ GM % $ GM %
Gas Feed 538 28.5% 463 29.1% 510 29.1%
Liquid Feed 115 29.0% 228 29.9% 239 29.9%
Service 92 61.0% 110 61.0% 66 61.0%
Instrumentation/analizer/controller 75 27.0% 67 27.0% 74 27.0%
Vareameter 26 27.0% 24 27.1% 27 27.0%
Dry and Liquid Preparation 0 5 27.5% 12 27.0%
OSEC 0 0 24 27.0%
Water champ 0 0 8 27.0%
UV 0 0 5 27.0%
Pressure Gauges 0 0 7 27.0%
0 0 0
0 0 0
0 0 0
0 0 0
0 0 0
Aftermarket (if reported as a product line) 0 0 0
Intercompany 170 176 213
Total Product/Project GM 1,015 1,074 1,187
Less:
Warranty 24 52 0
Over/Under Absorption 0 0 0
Obsolete Inventory 49 152 207
Total Gross Margin 942 870 980
40
2004 Book to Bill Analysis - G/M
Gross Margin in 2004 Opening backlog 86
Quarter
Margin from
Opening
G/M from 2004
Bookings
Total 2004
Plan G/M Book to Bill Ratio %
Q1 2004 86 215 99 185 53.7%
Q2 2004 0 281 263 263 100.0%
Q3 2004 0 303 290 290 100.0%
Q4 2004 0 300 287 287 100.0%
Total 86 1,099 994 1,080 92.1%
G/M in 2004 Ending Backlog 105
B2
G/M in 2004 Bookings
by Quarter
41
G/M and SG&A discussion can (and
should) be supplemental by Product Line
P&L (such as High Purity, ES & EP&S for
PWS) and/or location P&L (such as HPD
Spain and HPD US)
42
Summary of Key Financial Drivers & Assumptions – 2004
Gross Margin
- Expected Inflation 5% 101K negative impact (Salaries increases and Utilities
increases)
-Procurement saving 0.5% or 21.5K GM improvement positive impact
- Cost reduction program 0.5% or 21.5K GM improvement positive impact
- Price increases 2% or 83K GM Improvement positive impact.
- Increase Volume in Industrial market 87K Favorable variance
 Continue to drive Materials cost reduction process

Continue Cost reduction program
 Improve overall operations and manufacturing processes

Design Centers yielding forecast cost reductions
-
-
-
-
Gross Margin increases $112K and GM 10.4% vs. 2003 fcst
Key Plans and Success Factors
43
US Filter Chem Feed Mexico
Margin Enhancements
Built into Year 1 of the Plan
(in $000’s)
Description
$ %
Value engineering -
Material pricing improvement - 21.5K 0.5%
Price Increases - 83 K 2%
Cost reduction Program 21.5K 0.5%
Other
Other
Total $126K 3%
GM Improvement
44
US Filter Chem Feed Mexico
Key Issues, Activities and Objectives – 2004
Manufacturing

Set-up & Run time reduction from 19% to 15%

Automate the load of machines and reports of
production<<MCD>>(Manufacturing data collection)

Implement SMED (Single Minute Exchange of Die).
Implement kaizen groups

Reduce scrap level from 0.6% to 0.5%

Increase CNC efficiency from 82% to 86%

Reduce costs of tools by 15%

Automate the Pumps capacity test

Carry out benefit-cost study to paint pcs in house
45
US Filter Chem Feed Mexico
Key Issues, Activities and Objectives – 2004
Manufacturing

Extend the stock in point of use for all equipments assembled in
Mexico

Development of new sub-assemblies and equipments in Mexico

Analyze of labeling by Bar code process

New design for packing of kits

New layout for spares and raw materials warehouse

Prepare the project of justification for a new small truck

Maintain cycle count accuracy @99%
46
US Filter Chem Feed Mexico
Key Issues, Activities and Objectives - 2004
Engineering

Continued with cost Reduction program 0.5% of Total Gross
Margin improvement

Continue increasing machined Parts Activity

Implement 5’S in all manufacturing areas.

Implement Kaizen groups and activities

BOM´s accuracy from 98% to 100%

Carry out project of re-location of raw materials warehouse near
of CNC area.
47
US Filter Chem Feed Mexico
Key Issues, Activities and Objectives - 2004
Materials

Reduction of inventory by 143K

Material Cost Savings at 3-4% on total material procurement
spend in 2004 (not including Interco purchases) increase 0.5%
GM

Better utilization and use of MRP system and implementation
APICS techniques

Maintain on-time Deliveries to >98% and sustain improvements
in deliveries performance to meet customer expectations

Evaluate new alternatives for traffic reducing costs and transit
times
48
Actual Forecast Budget
2002 2003 2004
External Revenue 2,614 2,764 3,096
Total Revenue 4,493 5,448 5,946
($ in 000's)
Commissions 0 0 0
S&M other 204 171 162
Total S&M 204 171 162
R&D 0 0 0
G&A 391 489 528
Total Operating Expense 595 660 690
Commissions (% External Revenue) 0.0% 0.0% 0.0%
% of Total Revenue
S&M Other 4.5% 3.1% 2.7%
Total S&M 4.5% 3.1% 2.7%
R&D 0.0% 0.0% 0.0%
G&A 8.7% 9.0% 8.9%
Total Operating Expense 13.2% 12.1% 11.6%
C1
Operating Expense Summary
49
CY2004
2002 2003 Q1 Q2 Q3 Q4
Sales & Marketing - 1 1 1 1 1
R&D - - - - - -
Finance 4 5 5 5 5 5
IT 1 1 1 1 1 1
HR 1 1 1 1 1 1
All Other Admin 1 1 1 1 1 1
Total SG&A 7 9 9 9 9 9
(Include FTE and Temps by classification)
E1
Operating Expense Headcount Trend
50
US Filter Chem Feed Mexico
Summary of Key Financial Drivers & Assumptions - 2004
Sales & Marketing (excl commissions & allocation)
- Favorable impact for Miguel Torres expenses by 80K
- Hire new sales manager unfavorable variance by 70K
- Net impact favorable by 10K
-
 Take advantage of other CFG BC´s for savings.
- Increase sales in Industrial Market with the same investment.
-
-
-
-
Initiatives in plan to trend % lower
(Summary of Change vs. prior year – (10K) vs 03 forecast
51
US Filter Chem Feed Mexico
Key Issues, Activities and Objectives - 2004
Sales

Hire new sales Manager

Recover lost market/restructure current Municipal Rep and
distribuiton netework

Focus on Core Products and Services as baseline for Business
growth

Set up and organize the distribution network for industrial sector

Increase Field Technical Services & Spare sales

Continue with the development complete packages at a
competitive position

Preparation & Specialization on new products for market
development

Develop Key – Account ( Pemex, CFE) management position
52
US Filter Chem Feed Mexico
Key Issues, Activities and Objectives - 2004
Marketing

Participation regional tradeshows maintaining our presence into the market,

Create loyal customers providing complete satisfaction

Create new strategies in order to protect the investment and promote the
development of applications offering Integral solutions to the customer.

Reconfiguration and improvement of website

Continue to have available in Spanish language data and information on
products and technologies

Support the training program of new and existing products.

Development a marketing plan to lean the sales plan in the introduction into
industrial market

Evaluate competitors and market trends
53
US Filter Chem Feed Mexico
Key Issues, Activities and Objectives - 2004
Research & Development

Continued to feed information to design centers for local
products and Marketing needs.
54
US Filter Chem Feed Mexico
Summary of Key Financial Drivers & Assumptions - 2004
G&A
- Inflation 5%, impact 25K negative including professional fees and salaries
and Fringes.
- New assistant controller salaries and fringes $20K
- Reduce IT miscellaneous expenses by 5K Favorable
 Budget Management
 Control Headcount
 Marketing and IT expenses management
 Preserve cost control mentality.
-
Initiatives in plan to trend % lower
(G&A Increase $40K and 7.3% vs 2003 Fcst, as a percentage of Total this
represent a decrease from 9.0% to 8.9%)
55
US Filter Chem Feed Mexico
Key Issues, Activities and Objectives – 2004
Finance

Hire an Assistant Controller

Development of long term strategies plans in which Sales,
Manufacturing and Finance play a key role in the realization of
business objectives.

Implementation of Internal Audit in key departments such as
Accounts Payables and Purchasing, Accounts Receivables and
Shipping, Treasury and Cost Department.

Develop automatic Financial details report to improve end month
reporting to corporate from 5 to 4 days.

Implement best Corporate and Local accounting Practices.

Be part of the success of the plan.
56
US Filter Chem Feed Mexico
Key Issues, Activities and Objectives - 2004
Information Technology

Improve and promote the use of the web page as a sales tool. (E-
business inclusion)

Continue IT personnel training

Install Service, Finance and Production applications created by
VW, using Oracle database

Create a continuous training plan for all internal personnel in
order keep them updated

Give support to all departments to improve all operational taks
57
US Filter Chem Feed Mexico
Key Issues, Activities by Functional Area – Other - 2004

Maintain and to continue with the goal of "0" Serious Injuries

Continue with the training of the personnel in Safety and Health
topics.

Human Resources to improve performance on recruitment,
orientation, employee performance monitoring, activities,
committee, etc. to be consistent with corporate policy.

Maintain ISO 9000 Certification

Maintain Quality and Certified Vendor with government entities
such as PEMEX & CFE

Implementation of a program to improve the quality system
efficiency and reporting.
58
Headcount Trend
Dic-02 Mar-03 Jun-03 Sep-03 Dic-03 Mar-04 Jun-04 Sep-04 Dic-04
Mfg 39 40 43 45 43 43 43 43 43
Eng 1 1 1 1 1 1 1 1 1
Field Service 3 3 3 3 3 3 3 3 3
Materials 5 5 5 5 5 5 5 5 5
Other - Domestic Side 5 5 5 5 5 5 5 5 5
Other - List - - - - - - - - -
Total COGS 53 54 57 59 57 57 57 57 57
SG&A
Sales & Marketing - - - - 1 1 1 1 1
R&D - - - - - - - - -
Finance 4 4 4 4 5 5 5 5 5
IT 1 1 1 1 1 1 1 1 1
HR 1 1 1 1 1 1 1 1 1
All Other Admin 1 1 1 1 1 1 1 1 1
Total SG&A 7 7 7 7 9 9 9 9 9
Total 60 61 64 66 66 66 66 66 66
Revenue p/FTE 75 19 20 19 24 21 25 26 26
Bus Income p/FTE 5 (0) 0 1 4 0 1 2 2
EP p/FTE (2) (2) (1) (0) 2 (1) 0 1 1
E1
Cost of Sales
Departments
59
2002 Actual 2003 Plan 2003 Actu3 2004 Plan
Backlog (end of month) 501 665 493 -25.9% -1.7% 574 16.5%
Bookings 4,795 6,043 5,447 -9.9% 13.6% 6,038 10.9%
Revenue
External - capital & other 2,614 2,899 2,450 -15.5% -6.3% 2,288 -6.6%
External - Aftermarket & Service 0 655 314 -52.0% 808 157.2%
Total External 2,614 3,554 2,764 -22.2% 5.7% 3,096 12.0%
Intercompany 1,879 2,310 2,684 16.2% 42.8% 2,850 6.2%
Total 4,493 5,863 5,448 -7.1% 21.3% 5,946 9.1%
Project/Product Gross Margin
External - capital 821 1,239 166 -86.6% -79.7% 558 235.3%
External - Aftermarket & Service 0 391 120 -69.4% 404 237.2%
Total External 821 1,630 286 -82.4% -65.1% 962 236.1%
Intercompany 142 199 789 295.9% 453.6% 225 -71.5%
Total 1,037 1,829 1,075 -41.2% 3.7% 1,187 10.4%
Other cost of sales - (EXP)/Income
Warranty 24 0 52 116.1% 0 -100.0%
Other (Frt, obsol, etc) 49 0 152 214.1% 207 35.9%
Over/under absorption 0 688 0 -100.0% 0
Gross Margin 964 1,141 870 -23.7% -9.7% 980 12.6%
Gross Margin %
Std External - capital 31% 43% 7% 24% 259.1%
Std External - aftermarket 60% 38% 50% 31.1%
Total External 31% 46% 10% 31% 200.1%
I/C 8% 9% 29% 8% -73.1%
Total 21% 19% 16% 16% 138.2%
Operating Exp (income)
External Commissions 0 42 0 -100.0% 0
% Total revenue 0.0% 0.7% 0.0% 0.0%
BC Selling & Marketing 204 180 171 -5.1% -16.2% 162 -5.3%
R&D 0 0 0 0
G&A 391 453 489 8.0% 25.1% 528 8.0%
Total operating expense 595 633 660 4.3% 10.9% 690 4.5%
% total revenue 13% 11% 12% 12%
Business Income (loss) 369 508 210 -58.7% -43.1% 290 38.0%
% total revenue 8% 9% 4% 5%
C1
P&L Summary
% Var vs.
03 Plan
% Var 02 to
03 Fcst
% Var 03 Fcst
to 04 Plan
60
P&L Summary (if applicable) excluding Product Transfers
2002 Actual 2003 Plan 2003 Actu3 2004 Plan
Backlog (end of month) 501 665 493 -25.9% -1.7% 574 16.5%
Bookings 4,795 6,043 5,447 -9.9% 13.6% 6,038 10.9%
Revenue
External - capital & other 2,614 2,899 2,450 -15.5% -6.3% 2,288 -6.6%
External - Aftermarket & Service 0 655 314 -52.0% 808 157.2%
Total External 2,614 3,554 2,764 -22.2% 5.7% 3,096 12.0%
Intercompany 1,879 2,310 2,684 16.2% 42.8% 2,850 6.2%
Total 4,493 5,863 5,448 -7.1% 21.3% 5,946 9.1%
Project/Product Gross Margin
External - capital 821 1,239 166 -86.6% -79.7% 558 235.3%
External - Aftermarket & Service 0 391 120 -69.4% 404 237.2%
Total External 821 1,630 286 -82.4% -65.1% 962 236.1%
Intercompany 142 199 789 295.9% 453.6% 225 -71.5%
Total 1,037 1,829 1,075 -41.2% 3.7% 1,187 10.4%
Other cost of sales - (EXP)/Income
Warranty 24 0 52 116.1% 0 -100.0%
Other (Frt, obsol, etc) 49 0 152 214.1% 207 35.9%
Over/under absorption 0 688 0 -100.0% 0
Gross Margin 964 1,141 870 -23.7% -9.7% 980 12.6%
Gross Margin %
Std External - capital 31% 43% 7% -84% -78% 24% 259.1%
Std External - aftermarket #¡DIV/0! 60% 38% -36% #¡DIV/0! 50% 31.1%
Total External 31% 46% 10% -77% -67% 31% 200.1%
I/C 8% 9% 29% 241% 288% 8% -73.1%
Total 21% 19% 16% 16% 138.2%
Operating Exp (income)
External Commissions 0 42 0 -100.0% 0
% Total revenue 0.0% 0.7% 0.0% 0.0%
BC Selling & Marketing 204 180 171 162
R&D 0 0 0 0
G&A 391 453 489 8.0% 25.1% 528 8.0%
Total operating expense 595 633 660 4.3% 10.9% 690 4.5%
% total revenue 13% 11% 12% 12%
Business Income (loss) 369 508 210 -58.7% -43.1% 290 38.0%
% total revenue 8% 9% 4% 5%
C1
% Var vs.
03 Plan
% Var 02 to
03 Fcst
% Var 03
Fcst to 04
Plan
61
Quarterly P&L
Q1 Q2 Q3 Q4 Total
Revenue
CY2002 Actual 1,021 1,170 1,041 1,260 4,493
CY2003 Fcst 1,135 1,249 1,285 1,576 5,448
CY2004 Plan 1,399 1,619 1,696 1,686 5,946
CY2004 % of Total 24% 27% 29% 28% 100%
Gross Margin
CY2002 Actual 186 212 206 270 964
CY2003 Fcst 137 178 219 312 870
CY2004 Plan 185 263 290 287 980
CY2004 % of Total 19% 27% 30% 29% 100%
Operating Expense
CY2002 Actual 140 141 150 164 595
CY2003 Fcst 146 164 156 170 660
CY2004 Plan 174 174 174 174 690
CY2004 % of Total 25% 25% 25% 25% 100%
Business Income
CY2002 Actual 46 71 56 106 369
CY2003 Fcst (8) 14 63 142 210
CY2004 Plan 12 90 117 113 290
CY2004 % of Total 4% 31% 40% 39% 100%
C1
62
Comparison of CY2004
Prior Yr Plan vs. Current Yr Plan
2004 Variance
External Revenue 3,096 3,881 (785) 79.8%
Interco Revenue 2,850 2,525 325 112.9%
Total Revenue 5,946 6,406 (460) 92.8%
GM 980 1,281 (301) 76.5%
% of Total Revenue 16.5% 20.0% -3.5%
SG&A 690 664 26 103.9%
% of Total Revenue 11.6% 10.4% 1.2%
EBITA 290 617 (327) 47.0%
% of Total Revenue 4.9% 9.6% -4.8%
C1
F/(U) %
Proposed As of
August 2003 As of August 2002
63
US Filter Chem Feed Mexico
2004 vs. Prior Year
Summary of Change in Business
Income
 Revenue – Increase of $498K or 9.1% vs 2003 forecast
 GM Increase 10.4% - GM 112K over 2003 forecast
 SGA
$ Increase - 30K
% Increase - 4.5%
Decrease % of Total revenue -0.5%
 Bus Income change
Increase of 79K over 2003 fcst
Increase of 25.4% over 2003 forecast
Increase % of Total revenue 1%
64
Capital and Cash Flow
65
Capital - 2003
*In Order of Priority
Major Projects* 000's Benefit / Need
Building improvements 10 Health and safety compliance
Machinery and Equipment 33 Fourth axis for CNC Machine and Tooling & Fixtures ( Cost Reduction)
Replace offices chairs. 11 Replace all old chair for safety compliance
All Other
Total 54
2003 Budget 141
2003 Forecast 54
2003 Depreciation 142 F1
66
Capital - 2004
*In Order of Priority
Major Projects* 000's Benefit / Need
Air Conditioned Unit 29 Health and safety compliance
Tools and Fixtures 27 Machines and Tooling & Fixtures ( Cost Reduction)
QC Measuring Tools 10 ISO Certification Process
All Other
Total 66
2003 Budget 141
2003 Forecast 54
2003 Depreciation 142 F1
67
Capital - 2005 + 2006
*In Order of Priority
Major Projects* 2005 000's 2006 000's Benefit / Need
CNC Machine 96 48 Increase capacity to meet intercompan
Tools and Fixtures 10
Building improvements 19
Tools and Fixtures 7 7
QC Measuring Tools 10 10
All Other
Total 122 84
2003 Budget 141
2003 Forecast 54
2003 Depreciation 142 F1
68
Cash Flow Summary
(in $000's) 2002 Actual 2003 Plan 2003 Actu 3 2004 Plan
EBITA 369 508 211 290
Depreciation 163 182 142 166
"Working Capital"
Accounts & other recievables (net) (171) 9 132 88
Inventory (net) 150 321 340 243
CEEB & BEEC, net 0 0 0 0
Accounts payable & O/S checks (57) 81 75 (63)
Cash paid for restructuring 0 0 0 0
Other accrued liabilities 0 1 0 0
Income Tax (123) (108) (106) (133)
Other working capital 321 4 (54) (25)
Total Working Capital 120 309 387 110
Capital spending (29) (141) (54) (66)
Project expenditures 0 0 0 0
Proceeds from project financing 0 0 0 0
Proceeds from F/A disposal 0 0 0 0
Fixed asset transfers 0 0 0 0
Acquisitions 0 0 0 0
Divestitures 0 0 0 0
Debt 0 0 0 0
Interest 0 0 0 0
Other (125) 0 (285) 0
Net Change, I/C, & Cash Accounts 498 858 401 500
G1
69
Summary of Key Financial Drivers & Assumptions - 2004
Cash Flow
 EBITDA $ 456K
 External A/R change - Decrease by 88K

Revenue to be invoiced at December.
 Inventory change: 243K Reduction

Strong management on inventory and expect to reduce in slow movement inventory
 Capital $ change: 66K spending

Manage spending for health and safety issues only
 Other major item /change net impact in payables and intercompany receivables

Manage Ico payables according receivables
 Other major item /change
 Meet EBITA plan.
 Improve inventory management
 Continue to drive improve collections
 Continue to improve management of payables
(Summary of Change –Total Cash Flow: $500)
Key Plans and Success Factors
70
Balance Sheet, Key Metrics and
Economic Profit
71
Key Metrics
(in $000's)
Dic-02 Mar-03 Jun-03 Sep-03 Dic-03 Mar-04 Jun-04 Sep-04 Dic-04
Inventory
Raw Material 2,001 1,844 1,862 1,859 1,827 1,827 1,827 1,827 1,827
WIP 479 524 502 384 384 375 366 357 348
Finished Goods 347 357 347 328 328 328 328 328 328
Total (gross) 2,827 2,724 2,710 2,570 2,538 2,529 2,520 2,511 2,502
Sys - DSI 262 249 231 229 199 181 159 154 153
Customer Accounts
A/R 641 583 640 642 471 382 567 283 383
CEEB 0 0 0 0 0 0 0 0 0
BECE 0 0 0 0 0 0 0 0 0
Sys - Total DSO 59 101 99 97 54 54 52 50 48
A/R aging (%)
0-30 66.0% 54.0% 44.0% 54.0% 66.0% 70.0% 72.0% 80.0% 70.0%
31-60 23.0% 17.0% 28.0% 27.0% 25.0% 25.0% 26.0% 19.0% 12.0%
61-90 1.0% 4.0% 11.0% 19.0% 9.0% 5.0% 2.0% 1.0% 18.0%
90+ 10.0% 25.0% 17.0% 0.0% 0.0% 0.0% 0.0% 0.0% 0.0%
Retention $ 0 0 0 0 0 0 0 0 0
% of A/R 0.0% 0.0% 0.0% 0.0% 0.0% 0.0% 0.0% 0.0% 0.0%
Sys-DPO 52 73 80 64 59 60 60 60 58
Sys CCC 269 278 249 261 194 175 151 144 143
H1
72
Key Initiatives To Improve Balance Sheet – add additional pages if
needed
 A/R
- Continue drive collection with aggressive strategies to improve collections
 Inventory
- Continue drive to improve cycle count procedures
-Improve MRP techniques in driving increase in Inventory turns.
-Continue pushing intercompany and local possibilities to move slow inventory
- Inventory reserves- Outside Auditor position
 CEEB & BECE
- Align Terms and Conditions with Country Standards
73
Economic Profit
2004 Plan
2002 Act 2003 Plan 2003 Actu 3 Q1 Q2 Q3 Q4 Total
Business Income 369 508 311 73 73 73 73 290
Capital Charge (412) (382) (344) (78) (78) (76) (74) (305)
Economic Profit (43) 126 (33) (5) (5) (3) (2) (15)
Capital Charge
Manageable Assets (*)
Accounts Receivable 489 343 513 286 318 357 319 320
Other receivables 0 0 0 0 0 0 0 0
Cost in excess earnings & billings 0 0 0 0 0 0 0 0
Inventory (Net) 2,659 2,537 2,450 2,258 2,248 2,273 2,253 2,258
Other current assets 41 67 43 23 5 4 4 9
Fixed Assets (net) 1,677 1,644 1,601 1,652 1,613 1,562 1,511 1,584
Other intangibles (net, exclude GW 12/00) 0 0 0 0 0 0 0 0
Other long term assets 0 0 0 0 0 0 0 0
Accts payable & outstanding checks (545) (684) (795) (899) (787) (697) (481) (716)
Accrued expenses (196) (88) (322) (171) (251) (433) (598) (363)
BECE 0 0 0 0 0 0 0 0
Other current liabilities (3) 0 (52) (45) (45) (45) (45) (45)
Subtotal 4,122 3,819 3,438 3,104 3,102 3,021 2,963 3,047
Adjustments: 0 0 0 0 0 0 0 0
Total Manageable Assets 4,122 3,819 3,438 3,104 3,102 3,021 2,963 3,047
Average Manageable Assets 4,122 3,819 3,438 3,104 3,102 3,021 2,963 3,047
Capital Charge (10% Full Year) 412 382 344 78 78 76 74 305
I1
74
Summary Economic Profit
Economic Profit
2003 Forecast $-33K
2004 Plan $ -15K
Explanation of major variances:

1. Earnings
- Increase in Business Income by 25%
-
-

2. Capital Charge
- Improve inventory reduction
- Fixed Assets flat
- Expect to maintain same capital charge than 2003 forecast, increasing
Economic profit for EBITA increase.
-AR Reduction by 88K
75
2004 Plan
Dic-02 Dic-03 Q1 Q2 Q3 Q4 Total
Doubtful accounts
Balance sheet (66) (66) (66) (66) (66) (66) (66)
P&L Charge 18 0 0 0 0 0 0
Inventory reserve
Balance sheet (201) (333) (385) (437) (489) (540) (540)
P&L Charge 18 47 52 52 52 52 207
Warranty
Balance sheet 4 38 38 38 38 38 38
P&L Charge 4 34 0 0 0 0 0
Restructure
Balance sheet 0 0 0 0 0 0 0
P&L Charge 0 0 0 0 0 0 0
Accrued job cost
Balance sheet 33 6 6 6 0 0 0
Accrued legal
Balance sheet 0 0 0 0 0 0 0
P&L Charge 0 0 0 0 0 0 0
Accrued Professional Fees
Balance sheet 0 0 0 0 0 0 0
Reserve Summary (in $000's)
76
USFilter Chem Feed Mexico
Reserve Summary Comments – Upside & Downside
Upsides
Downsides
- External Auditors adjustment that could have important affectation to P&L
- Low revenues for the year, that could reduce reserve
-
- Obsolete inventory reserve is accrued by 1% of total revenues
- External Auditor position
-
-
-
-
- Corporate reserve creation for Inventory
-
Key Assumptions and Success Factors
77
Risks and Opportunities
78
US Filter Chem Feed Mexico
Risk / Opportunity Assessment – Year 2004
Upsides
Downsides
-Continued frozen allocation of budgets
-FCPA Issues
-Slow down in sales during transition to new reps.
-Exchange rate Fluctuation
-Continued Aggressive competition tactics-
- Implement and Development Industrial Distribution Network
-Introduction of additional Chem Feed technologies
-Re-alignment distributions network for Industrial and Municipal Market
-Aggressively back on track with inventory reduction
-Avalon Project realization and Development Centers yielding forecasted cost reductions
- Government stability and country economic growth
-Continued Mexican price list development
-Regional Waste Water funding- Monterrey
-DF Projects
-Selling of slow moving raw materials
Key Assumptions and Success Factors
79
US Filter Chem Feed Mexico
Key Non-Controllable Events or Activities
that may Influence the Plan

Economic slow down
Economic slow down

FCPA Issues
FCPA Issues

Exchange rate fluctuation

Economic and Governmental policies changes

Competition aggressiveness due to flat Large Systems in

municipal market
municipal market

FCPA issues
FCPA issues

Economic slow down
Economic slow down

Exchange rate fluctuation

Economic and Governmental policies changes
Year 1
Year 2
80
Potential Acquisition, Strategic Alliance,
JV, etc. (not built into plan)
81
CONFIDENTIAL
Potential Acquisition, Strategic Alliance, JV,etc.
Targets
(not to be built into plan)
(in $000’s)
Product Revenue Strategic Fit Timing
82
Summary
83
2002 2003 2004 04 vs. 03 2005 05 vs. 04 2006 06 vs. 05
Actual Fcst Plan Var % Plan Var % Plan Var %
Total Bookings 4,795 5,447 6,038 110.9% 6,705 111.0% 7,509 112.0%
Total Backlog 501 493 574 116.5% 810 141.1% 1,433 177.0%
External Revenue 2,614 2,764 3,096 112.0% 3,545 114.5% 4,112 116.0%
Interco Revenue 1,879 2,684 2,850 106.2% 3,078 108.0% 3,355 109.0%
Total Revenue 4,493 5,448 5,946 109.1% 6,623 111.4% 7,467 112.7%
GM 964 971 980 111.2% 1,214 123.9% 1,436 118.3%
% of Total Revenue 21.5% 17.82% 16.5% 18.3% 19%
SG&A 595 660 690 104.5% 726 105.2% 762 105.0%
% of Total Revenue 13.2% 12.1% 11.6% 0.0% 11.0% 10.2%
Business Income 369 311 290 125% 488 168.3% 674 138.1%
% of Total Revenue 8.2% 5.7% 4.9% 7.4% 9.0%
Cash Flow 498 401 500 124.7% 630 126.1% 801 127.0%
Capital (29) (54) (66) 122.4% (122) 184.6% (84) 68.6%
Economic Profit (43) (33) (15) 44.8% 88 -599.8% 189 214.6%
Snapshot Trend (2002-2006) (in $000's)
84
US Filter Chem Feed Mexico
Key Strategic Elements of 3Yr Plan
- Successful Industrial Market penetration
- Sustain and improve core business in across WT Lines.
- Introduction of new technologies
-OSEC, Skid Systems, Equal Draw
- Continued growth in recurring services
-Go after competitors installed base
- Realigned and motivated Reps/Distribution network both municipal and industrial
market.
- Piggy back of Stranco and Elcat product and application know how and develop
capabilities in Mexico
- Trained and qualify technical support staff at the plant
- Sustain Intercompany sales trend in gross margin improvement
- Continued technical and application support for LA Distribution
-Inventory reduction and materials management
-No FCPA issues in Market
Year 1
85
US Filter Chem Feed Mexico
Key Strategic Elements of 3Yr Plan
Year 2 & 3
-New and motivated reps and Distribution network
- Regionally and National both Industrial and Municipal
- Industrial installed base
- Product and technology specialist in Chem Feed areas.
- Go after competitors installed base
-Inventory reduction and materials management
86
US Filter Chem Feed Mexico
Strategic Overview/Summary Assessments
Overall Issues and Priorities Summary
2004
- Successful Industrial Market penetration
- Sustain core business in Gas Feed.
- Introduction of new technologies
-OSEC, Skid Systems
- Continued growth in recurring services
-Go after competitors installed base
- Realigned and motivated reps/Distribution network both municipal and industrial market.
- Piggy back of Stranco and Elcat product and application know how and develop capabilities in Mexico
- Trained and qualify technical support staff at the plant
- Sustain Intercompany sales trend in gross margin improvement
- Continued technical and application support for LA Distribution
- Inventory reduction and materials management
2-5 Years
- New and motivated reps and Distribution network
- Regionally and National both Industrial and Municipal
- Industrial installed base
- Product and technology specialist in Chem Feed areas.
- Go after competitors installed base.
87
Conclusion
88
Systems Group Deliverables for meeting
with Andy Seidel and VE Paris
89
2003 Summary
 Highlights 2003 P&L vs Plan variance

Revenues at 87% of plan, shortfall in Domestic Market

Gross Margin 3.5% below plan as a % of total revenues but 349K below
plan.

SG&A at Plan

EBITA of 211K vs 540K of plan variance of 39% below plan mainly driven
by Domestic revenues shortfall
 Highlights 2003 cash flow vs Plan variance

Cash Flow of 400K vs 900K of plan variance of 55% or 500K below plan
driven by EBITA shortfall
 Highlight 2003 metrics and EP vs Plan variance

EP of -220K vs 146 positive planned, driven by EBITA shortfall by 332K
90
2004 summary
 State the assumptions how 2004 P&L will be achieved

Strong management of Domestic sales side, will hire new Sales
manager to drive focus and sales network
 State the assumptions how 2004 cash flow will be
achieved

Strong Inventory management and new strategies to improve
Domestic and Intercompany collections
 State the assumptions how 2004 metrics and EP will be
achieved

Focus on EBITA and Inventory management will secure EP will
be achieved

El Plan -Anual Definitivo_USF-México.ppt

  • 1.
    US Filter ChemFeed Mexico Annual Plan Review 2004 - 2006 CONFIDENTIAL Date: Sept 10, 2003 Location: Mexico
  • 2.
    2 USFilter Chem FeedMexico Three Year Plan 2004-2006  Good to Great Recap  Growth Summary  Strategic Overview and Bookings  Business Income and Drivers  Capital and Cash Flow  Key Metrics and Economic Profit  Risks and Opportunities  Summary
  • 3.
  • 4.
    4 “The Bus”  Whatdid you do in 2003 to get the right people on bus – and in the right seats: -Replaced CNC operators with CNC Set Up and Operate capable candidates. -Jacinto Buitron in Quality Assurance ( Outside Consultant). -Replacement of 3 people: Traffic, Purchasing & Production Planning. - How is your bus set-up for 2003/2004: -Hire National Sales Manager to focus on Sales Structure and Selling Disciplines and increment Sales. -Hire Assistant Controller to free A. Cigarroa in Operations Management -Continue to upgrade positions across functional departments to insure succession planning and high qualified personnel. -Technical Services -Sales & Customer Service -Manufacturing & Assembly Areas and Warehouse
  • 5.
    5 Brutal Facts  Whatare the brutal facts in your business: - Deal with FCPA in the Market Place - Economic and political instability - Overall Lack of knowledge of the market and potential market - Rep & Distribution Network and Routes to Market needs to be restructured - Minimal participation in Industrial Market - Markets are highly competitive – low price driven - Perceived as a High Priced equipment provider  How are you addressing these facts: - Hire National Sales Manager - Additional Product and Application Training Schedule for 03 and 04 in applications and equipment - Invest in Market research – Up Grade position - Maintain current position in dealing with FCPA issues - Development & implementation of “Culture of Discipline”
  • 6.
    6 What is thebusiness passionate about?  What is your business passionate about: - Local Integration of Chem Feed technologies and systems for producing gas feed and chemical dosing equipment. - Assembly and machining high quality parts for CFG products.  Can you be the best in the world at it: - YES, continued development of internal tools and procedures and personnel in both application and technical expertise in Chemical dosing systems. - Under W&T Vineland guidance and technical support, continued implementation of rapid manufacturing methodology and culture.
  • 7.
    7 What is thebusiness passionate about – cont…  How is success measured quantitatively: - External Customer satisfaction - Bookings - Revenues - Gross Margin - Business Income - Economic Profit - FTE - What is your economic denominator: - Economic Profit per FTE
  • 8.
    8 “Culture of Discipline” What is your culture of discipline: • Lacking of consistent performance and steady sustainable improvement. • On a fire drill basis in conducting business  What will change in 2003/2004 Drive “Culture of Discipline” in the organization - Stick and comply to our promises - Listen to the customer and make the necessary changes. Maintain and improve dealing with our colleagues and co workers with respect and dignity - Internal Bureaucracy is our enemy-Remove all non value added activities - The “stop doing list” has been defined – IMPLEMENT Changes
  • 9.
    9 Growth Summary ( in$ 000's) Total Revenue Total GM SG&A Business Income $ $ % $ % $ % CY 2003 Fcst (latest fcst) 5,448 1,075 19.7% 660 12.1% 415 7.6% CY 2004 Plan 5,946 1,187 20.0% 690 11.6% 497 8.4% Base Business Change Selling price increase 83 83 100.0% 0 0.0% 83 100.0% Volume increase 415 87 21.0% 0 0.0% 87 21.0% Inflation & labor cost increase 0 (101) 35 (136) New initiatives & products 0 0 0 0 New R&D initiatives & products 0 0 0 0 GM enhancements 0 43 0 43 Other cost reduct/efficiencies 0 0 (5) 5 Full year impact of 2003 acq 0 0 0 0 0 0 0 0 One Time Mngtment Adjs/Reserves 0 0 0 0 CY2004 Plan 498 112 22.5% 30 6.0% 82 16.5% Growth Amount % 9.1% 10.4% 4.5% 19.8% A1 Product & headcount transfer to / from other BCs
  • 10.
  • 11.
    11 Markets (in $000’s) 35 27 18 2,891 K Total Equal– Draw; low cost Osec Systems. 15 12 8 5% Minimal growth in Large Gas systems market. Introduction of Low end Chlorinator. 8 5 4 2,736 K Municipal Industrial market penetration is needed for future growth of company 12 10 6 155 K Industrial Comments Rate % Y3 Growth Y2 Market Y1 Estimated Mkt Share % 2003 CY $ Fcst Market Market Growth Rate % 10% 2%
  • 12.
    12 Strengths Strengths ( W&T)Benefit Brought to Customers & Market Manufacturing Facility in Mexico Closer to customer. Identified as a Mexican company Well-known W&T Name/Trademark Experience and local Technical service support Service, project engineering, capabilities Provide total package to customer Extensive Installation Base Well-known product in the industry ISO 9000 Certification Confidence of customers
  • 13.
    13 Weaknesses Weaknesses Actions toOffset or to Mitigate Weaknesses Distribution Network is weak and not performing to potential. Re-Structure and eliminate non performers. Low participation on Industrial Market and Opportunities Develop new market channels and distribution/Rep Network. Continued Economical Instability in the country Focus on Long term relationships with key and new accounts Profiled as a company with high prices in a highly competitive dosing systems. Drive application engineering to develop applicable solutions to meet customer demands and specs. Slow to commercialize new products Implement dedicated focus and Resources to trial and a[[lications Sales Organization struggles to think “outside the box”. More Focused sales channels with new National Sales Manager
  • 14.
    14 Bookings Product LineSummary (in $000's) 2001 Actual 2002 Actual 2003 Fcst 2003 Plan 2004 Plan 2005 Plan 2006 Plan Product Line $ GM % $ GM % $ GM % $ GM % $ GM % $ GM % $ Gas Feed 2,689 26.0% 1,934 26.0% 1,590 26.0% 1,434 26.0% 1,751 26.0% 1,850 26.0% 2,080 Liquid Feed 2,631 15.0% 2,219 10.0% 3,088 10.9% 2,653 12.5% 3,244 11.0% 3,550 11.6% 3,950 Service 67 58.2% 200 60.0% 180 60.0% 200 60.0% 200 60.0% 210 60.0% 250 Machining 219 15.0% 224 14.0% 233 15.0% 505 15.0% 257 15.0% 257 15.0% 275 Instrumentation/analizer/controller 100 26.0% 181 26.0% 247 22.0% 296 26.0% 275 22.0% 295 22.0% 320 Vareameter 69 15.0% 96 18.6% 90 22.0% 142 24.5% 100 22.0% 110 22.0% 120 Skid Systems 396 20.0% 0 0 Chloropac 430 20.0% 180 14.2% 180 Dry and Liquid Preparation 20 22.0% 214 20.0% 46 22.0% 80 22.0% 110 OSEC 90 21.3% 90 21.3% 120 Water champ 30 22.0% 33 22.0% 36 UV 20 22.0% 20 22.0% 33 Pressure Gauges 25 22.0% 30 22.0% 35 0 0 0 0 0 0 0 0 Aftermarket (If reported as a product line) 0 0 0 0 0 0 0 Total (all including Spares & Interco) 5,775 20.8% 4,854 19.4% 5,448 17.8% 6,270 19.5% 6,038 18.2% 6,705 18.3% 7,509 Total % Growth -16% 12% 29% 11% 11% 12% Interco in Total 2,497 10.0% 2,046 8.0% 2,557 6.9% 2,310 9.0% 2,700 7.9% 2,739 8.0% 2,821 Interco as % of Total 43.2% 42.2% 46.9% 36.8% 44.7% 40.9% 37.6% Spares in Total 723 40.0% 670 27.8% 1,211 40.0% 1,938 40.0% 853 40.0% 950 40.0% 1,080 Spares as % of Total 12.5% 13.8% 22.2% 30.9% 14.1% 14.2% 14.4% Industrial in Total 0 85 20.0% 155 21.0% 155 20.0% 704 21.0% 790 21.0% 910 Industrial as % of Total 0.0% 1.8% 2.8% 2.5% 11.7% 11.8% 12.1% Municipal in Total 2,555 26.0% 2,053 28.0% 1,525 18.2% 1,867 11.0% 1,781 22.3% 2,226 20.8% 2,698 Municipal as % of Total 44.2% 42.3% 28.0% 29.8% 29.5% 33.2% 35.9%
  • 15.
    15 Industrial Bookings -External (in $000's) 2001 2002 2003 2004 2005 2006 By Region By Region Capital Domestic 0 0 0 0 0 0 Asia 0 0 0 0 0 0 Latin America 0 85 155 704 790 910 Europe 0 0 0 0 0 0 ROW 0 0 0 0 0 0 Aftermarket & Service 0 0 0 50 60 70 Total Industrial 0 85 155 754 850 980 By Market Capital Automotive 0 0 0 0 0 0 BioPharm 0 0 0 136 157 182 Chemical/CPI 0 0 0 0 0 0 Food & Beverage 0 0 0 0 0 0 Metal Finishing 0 0 0 0 0 0 Microelectronics 0 0 0 0 0 0 Oil & Gas 0 0 0 0 0 0 Petrochemical/HPI 0 85 155 159 180 207 Power 0 0 0 408 453 0 Primary Metals 0 0 0 0 0 521 Pulp & Paper 0 0 0 0 0 0 Other 0 0 0 0 0 0 Aftermarket & Service 0 0 0 50 60 70 Total Industrial 0 85 155 754 850 980 B1
  • 16.
    16 2001 2002 20032004 2005 2006 By Region Capital East 0 0 0 0 0 0 Central 0 0 0 0 0 0 West 0 0 0 0 0 0 Total Domestic 0 0 0 0 0 0 Asia 0 0 0 0 0 0 Latin America 2,739 2,079 1,916 1,781 2,226 2,698 Europe 0 0 0 0 0 0 ROW 0 0 0 0 0 0 Total Capital 2,739 2,079 1,916 1,781 2,226 2,698 Aftermarket & Service 723 670 811 803 890 1,010 Total Municipal 3,462 2,749 2,727 2,584 3,116 3,708 B1 Municipal Bookings - External (in $000's)
  • 17.
    17 2001 2002 20032004 2005 2006 Systems 2,497 1,961 2,565 2,700 2,739 2,821 Service 0 0 0 0 0 0 Other 0 0 0 0 0 0 Total USF 2,497 1,961 2,565 2,700 2,739 2,821 VWS - Asia 0 0 0 0 0 0 VWS - Europe 0 0 0 0 0 0 VWS - Latin America 0 0 0 0 0 0 VWS - ROW 0 0 0 0 0 0 Total Intercompany 2,497 1,961 2,565 2,700 2,739 2,821 B1 Intercompany Bookings (in $000's)
  • 18.
    18 2001 2002 20032004 2005 2006 Pr Industrial Capital Thru Indus S&M 0 0 0 0 0 0 BC's direct/Own 0 0 0 0 0 0 International 0 85 155 704 790 910 Total Indus Capital 0 85 155 704 790 910 % Change Yr over YR 82.4% 354.2% 12.2% 15.2% Municipal Capital Thru Muni S&M 0 0 0 0 0 0 BC's direct/Own 0 0 0 0 0 0 International 2,739 2,079 1,916 1,781 2,226 2,698 Total Muni Capital 2,739 2,079 1,916 1,781 2,226 2,698 % Change Yr over Yr -24.1% -7.8% -7.0% 25.0% 21.2% Aftermarket & Service 723 670 811 853 950 1,080 % Change Yr over Yr -7.3% 21.0% 5.2% 11.4% 13.7% Total External 3,462 2,834 2,882 3,338 3,966 4,688 Intercompany 2,497 1,961 2,565 2,700 2,739 2,821 % Change Yr over Yr -21.5% 30.8% 5.3% 1.4% 3.0% Total Bookings 5,959 4,795 5,447 6,038 6,705 7,509 % Change Yr over Yr -19.5% 13.6% 10.9% 11.0% 12.0% B1 Bookings Summary (in $000's)
  • 19.
    19 Strategic Overview/Summary Assessment GasFeed Bookings $: 2001- 2.6 2002 – 1.9 2003 – 1.6 2004 – 1.7 2005 – 1.9 2006 – 2.0 Growth : -26 % -15 % 6 % 12 % 5 % GM 26% 26% 26% 26 % 26% Strengths -Complete line of gas feed products -Recognized brand name -High quality products -Still the perceived leader in the industry -Manufacturing and Assembly plant in Mexico. Weaknesses/Needs -Large Chlorinators ( V2000) and Evaporators not price competitive in the Market - Lack of 4-20 Ma output in V2000 and competitive Scada Communication -W&T Controllers are not cost competitive in Large Complete Systems Threats -New technology/and or increase restriction on the use of Chlorine gas -Number of competitors offering lower prices and claiming to be equal in quality -Aggressive competition sales tactics (in $000’s)
  • 20.
    20 Strategic Overview/Summary Assessment GasFeed Opportunities -Latin America and Mexico requirement for inexpensive disinfection equipment such as S2K -Industrial market penetration with Packaged Systems -Municipal opportunities in Complete packaged systems -Cost savings opportunities -Equal Draw introduccion Key Priorities for next 1-3 years -Continue offering value engineering to reduce cost and provide more price competitive -Avalon Project Realization -Less expensive automatic control arrangement -Continued development of Inexpensive container mounted low-end chlorinator
  • 21.
    21 Strategic Overview/Summary Assessment LiquidFeed Bookings $: 2001- 2.6 2002 – 2.2 2003 – 3.0 2004 – 3.2 2005 – 3.5 2006 – 3.9 Growth : -15 % 36 % 6 % 9 % 11 % GM%: 10% 10.9 % 11 % 11.6% 12% Strengths -Robust and high quality products -Most plant operators are somewhat familiar with the products -Ability to package with other Chem Feed equipment Weaknesses/Needs -High price, most customer look for the bottom line only. -We are not a full pump company -Limited pump ranges and capacities. -Lack of Higher pressure Pump arrangement. -Lack of competitive accessories ( W&T product range) Threats -Pump manufacturers offer wide ranges pumps at aggressive, lower prices -Distribution network do not promote the sale of our pump due to limited ranges and capacities. (in $ MM’s)
  • 22.
    22 Strategic Overview/Summary Assessment LiquidFeed Opportunities -Pumps skid packages -Industrial sales penetration Key Priorities for next 1-3 years -Continue reduce cost Encore and Chemtube pumps -Streamline accessories lines with more competitive pricing and current technology -Automatic control options at lower cost.
  • 23.
    23 Strategic Overview/Summary Assessment Analyzers/Controller Bookings$: 2001- 100 2002 - 181 2003 - 247 2004 - 275 2005 - 295 2006 – 320 Growth : 81 % 36 % 11% 7 % 8% GM%: 26% 22% 22% 22% 22 % Strengths -Comprehensive line of chlorine residual analyzer and control systems -Recognized brand name Weaknesses/Needs -Lack of non-chlorine measurement capability -PCU/SCU Controllers too expensive -Technical support for RACOD product Threats -Increased competition from ATI ( Acutec Supplier) -Reduced use of chlorine in WW applications -High Cost of micro analyzer -Private level suppliers selling in same market such as Acutec 35 (in $000’s)
  • 24.
    24 Strategic Overview/Summary Assessment Analyzers/Controller Opportunities -TMS561 Turbidimeter -Reagentless chlorine measurement Key Priorities for next 1-3 years -Develop multi-parameter analyzer -Provide internet enabled communications capability -New generation of low cost controllers
  • 25.
    25 Strategic Overview/Summary Assessment DomesticMexico Bookings $: 2001- 3.2 2002 – 2.8 2003 – 2.9 2004 – 3.3 2005 – 3.9 2006 – 4.7 Growth : -12 % 3.5 % 13 % 18 % 20% GM%: 27.6% 27.6% 27.6% 27.9 % 28.0% Strengths -Local plant -Committed with Chem Feed products -Weaknesses/Needs -Lack of knowledge of Chem Feed products besides Wallace & Tiernan -Distribution and rep network mainly focus on W&T -Lack on application knowledge in other Chem Feed technologies -Improve Vineland lead times Threats -Aggressive competition tactics on W&T side -Performance issues with current distribution network -Flat down trending gas market. (in $ MM’s)
  • 26.
    26 Strategic Overview/Summary Assessment DomesticMexico Opportunities -Waste water funding and new projects -Industrial market penetration -Local Intercompany sales activities -Introduction of new products Key Priorities for next 1-3 years -Training in application knowledge for all Chem Feed products -New sales territories and regions for both Industrial and Municipal Markets -Development of application knowledge
  • 27.
    27 Strategic Overview/Summary Assessment IntercompanyMexico Bookings $: 2001- 2.5 2002 – 2.0 2003 – 2.5 2004 – 2.7 2005 – 2.7 2006 – 2.8 Growth : -25 % 25 % 11 % 12 % 12% GM%: 8% 6.9% 7.9% 8% 8.5% Strengths -Local plant -Committed with Chem Feed products -Weaknesses/Needs -Lack of knowledge of Chem Feed products besides Wallace & Tiernan -Distribution and rep network mainly focus on W&T -Lack on application knowledge in other Chem Feed technologies Threats -Aggressive competition tactics on W&T side -Performance issues with current distribution network -Flat down trending gas market. (in $ MM’s)
  • 28.
    28 Strategic Overview/Summary Assessment IntercompanyMexico Opportunities -Waste water funding and new projects -Industrial market penetration -Local Intercompany sales activities -Introduction of new business Key Priorities for next 1-3 years -Training in application knowledge for all Chem Feed products -New sales territories and regions for both Industrial and Municipal Markets -Development of application knowledge
  • 29.
  • 30.
    30 2001 2002 2003Fcst 2004 CAGR Product Line 1 Gas Feed 2,689 1,888 1,590 1,751 -13.3% % growth -29.8% -15.8% 10.1% 2 Liquid Feed 134 397 764 801 81.5% % growth 196.3% 92.4% 4.8% 3 Service 219 150 180 108 -21.0% % growth -31.5% 20.0% -40.0% 4 Instrumentation/analizer/controller 100 277 247 275 40.1% % growth 176.6% -10.7% 11.3% 5 Vareameter 69 96 90 100 13.2% % growth 39.1% -6.3% 11.1% 6 Dry and Liquid Preparation 0 0 20 46 % growth 130.0% 7 OSEC 0 0 0 90 % growth 8 Water champ 0 0 0 30 % growth 9 UV 0 0 0 20 % growth 10 Pressure Gauges 0 0 0 25 % growth 11 0 0 0 0 % growth 12 0 0 0 0 % growth 13 0 0 0 0 % growth 14 0 0 0 0 % growth 15 0 0 0 0 % growth Aftermarket & Service 0 0 0 0 % growth Intercompany 2,497 2,046 2,557 2,700 2.6% % growth -18.1% 25.0% 5.6% Total 5,708 4,854 5,448 5,946 1.4% % growth -15.0% 12.2% 9.1% B3 Revenue by Product Line (in $000's)
  • 31.
    31 Summary of KeyFinancial Drivers & Assumptions - 2004 Revenue (by Product Line if applicable)  market share (from base/existing business): 2% or 56K  New business: 359K or 5.1% in Industrial Market with W&T Products  price increases: 83K for 2% price increases, excluding Intercompany Prices  new products:  Low Cost OSEC and Equal - Draw  Skid Systems manufacturing in Mexico  Introduction of Chem Feed Technologies (Chloropac, OSEC)  New Industrial reps Network  Restructure Municipal network (Summary of Change – 498K and 9.1% change vs. 2003 forecast Key Plans and Success Factors (to make the above happen) Note – beginning backlog = $482K (8.1% of planned FY revenue)
  • 32.
    32 2004 Opening backlog482 Quarter Q1 2004 482 1,181 917 1,399 65.5% Q2 2004 0 1,544 1,619 1,619 100.0% Q3 2004 0 1,666 1,696 1,696 100.0% Q4 2004 0 1,647 1,686 1,686 100.0% Total 482 6,038 5,918 6,400 92.5% 2004 Ending Backlog 574 B2 2004 Book to Bill Analysis - Revenue Revenue from Opening Backlog 2004 Bookings by Quarter Revenue from 2004 Bookings Total 2004 Plan Revenue Book to Bill Ratio %
  • 33.
    33 US Filter ChemFeed Mexico Major Projects in Year 1 Shipment Plan (in $000’s) Project Name Value GM $ Timing issues CNA Pericos $ 500.0 $ 85.0 Q2-Q3 Large Gas Feed System-Highly Competitive IMP / Pemex $ 150.0 $ 22.5 Q2 Automation of Cooling Towers DEGREMONT-SLP $ 120.0 $ 18.0 Q3 Large Gas Feed System-Highly Competitive ICA-FD / PEMEX $ 500.0 50.0 Q3 Automation of Cooling Towers 1,270.0 $ 175.5 $
  • 34.
    34 New Products Builtinto Year 1 Plan (in $000’s) Product Timing Revenue$ Gross Margin $ Equal Draw Q3 $ 30.0 4.5 Low End OSEC Q3,Q4 $ 90.0 13.5 TOTAL $ 120.0 $ 18.0
  • 35.
    35 Key Components ofCost of Sales 2002 Actual 2003 Fcst 2004 Plan Materials 2,350 3,091 3,374 Labor & Overhead: Manufacturing 482 526 567 Engineering 189 206 222 Field Service 56 61 64 Other 544 593 640 Less: Absorption (1,271) (1,386) (1,492) (Over) / Under Absorption 0 0 0 C3
  • 36.
    36 Comments Regarding Keycomponents of Cost of Sales  Maintain and continue driving down Materials cost  Take advantage of Corporate Purchasing initiatives.  Continued implementation of Manufacturing Improvement Programs such as point of use stock, family of products machining, cost reduction, procurement savings and set up reduction)  Design Centers yielding forecast cost reduction
  • 37.
    37 CY2004 2002 2003 Q1Q2 Q3 Q4 Direct Labor MFG 28 30 30 30 30 30 ENG - - - - - - Field Service 3 3 3 3 3 3 Materials - - - - - - Other - Domestic sales 5 5 5 5 5 5 Other - List - - - - - - Total Direct 36 38 38 38 38 38 Indirect Labor MFG 11 13 13 13 13 13 ENG 1 1 1 1 1 1 Field Service - - - - - - Materials 5 5 5 5 5 5 Other - List - - - - - - Other - List - - - - - - Total Indirect 17 19 19 19 19 19 Total COGS 53 57 57 57 57 57 E1 COGS Headcount Trend Total
  • 38.
    38 Comments Regarding COGSHeadcount Trend  Headcount flat in Indirect labor in Manufacturing areas, just replacement.  Strong management of indirect manufacturing expenses.
  • 39.
    39 Gross Margin Summary(in 000's) Product Line 2002 Actual 2003 Fcst 2004 Plan $ GM % $ GM % $ GM % Gas Feed 538 28.5% 463 29.1% 510 29.1% Liquid Feed 115 29.0% 228 29.9% 239 29.9% Service 92 61.0% 110 61.0% 66 61.0% Instrumentation/analizer/controller 75 27.0% 67 27.0% 74 27.0% Vareameter 26 27.0% 24 27.1% 27 27.0% Dry and Liquid Preparation 0 5 27.5% 12 27.0% OSEC 0 0 24 27.0% Water champ 0 0 8 27.0% UV 0 0 5 27.0% Pressure Gauges 0 0 7 27.0% 0 0 0 0 0 0 0 0 0 0 0 0 0 0 0 Aftermarket (if reported as a product line) 0 0 0 Intercompany 170 176 213 Total Product/Project GM 1,015 1,074 1,187 Less: Warranty 24 52 0 Over/Under Absorption 0 0 0 Obsolete Inventory 49 152 207 Total Gross Margin 942 870 980
  • 40.
    40 2004 Book toBill Analysis - G/M Gross Margin in 2004 Opening backlog 86 Quarter Margin from Opening G/M from 2004 Bookings Total 2004 Plan G/M Book to Bill Ratio % Q1 2004 86 215 99 185 53.7% Q2 2004 0 281 263 263 100.0% Q3 2004 0 303 290 290 100.0% Q4 2004 0 300 287 287 100.0% Total 86 1,099 994 1,080 92.1% G/M in 2004 Ending Backlog 105 B2 G/M in 2004 Bookings by Quarter
  • 41.
    41 G/M and SG&Adiscussion can (and should) be supplemental by Product Line P&L (such as High Purity, ES & EP&S for PWS) and/or location P&L (such as HPD Spain and HPD US)
  • 42.
    42 Summary of KeyFinancial Drivers & Assumptions – 2004 Gross Margin - Expected Inflation 5% 101K negative impact (Salaries increases and Utilities increases) -Procurement saving 0.5% or 21.5K GM improvement positive impact - Cost reduction program 0.5% or 21.5K GM improvement positive impact - Price increases 2% or 83K GM Improvement positive impact. - Increase Volume in Industrial market 87K Favorable variance  Continue to drive Materials cost reduction process  Continue Cost reduction program  Improve overall operations and manufacturing processes  Design Centers yielding forecast cost reductions - - - - Gross Margin increases $112K and GM 10.4% vs. 2003 fcst Key Plans and Success Factors
  • 43.
    43 US Filter ChemFeed Mexico Margin Enhancements Built into Year 1 of the Plan (in $000’s) Description $ % Value engineering - Material pricing improvement - 21.5K 0.5% Price Increases - 83 K 2% Cost reduction Program 21.5K 0.5% Other Other Total $126K 3% GM Improvement
  • 44.
    44 US Filter ChemFeed Mexico Key Issues, Activities and Objectives – 2004 Manufacturing  Set-up & Run time reduction from 19% to 15%  Automate the load of machines and reports of production<<MCD>>(Manufacturing data collection)  Implement SMED (Single Minute Exchange of Die). Implement kaizen groups  Reduce scrap level from 0.6% to 0.5%  Increase CNC efficiency from 82% to 86%  Reduce costs of tools by 15%  Automate the Pumps capacity test  Carry out benefit-cost study to paint pcs in house
  • 45.
    45 US Filter ChemFeed Mexico Key Issues, Activities and Objectives – 2004 Manufacturing  Extend the stock in point of use for all equipments assembled in Mexico  Development of new sub-assemblies and equipments in Mexico  Analyze of labeling by Bar code process  New design for packing of kits  New layout for spares and raw materials warehouse  Prepare the project of justification for a new small truck  Maintain cycle count accuracy @99%
  • 46.
    46 US Filter ChemFeed Mexico Key Issues, Activities and Objectives - 2004 Engineering  Continued with cost Reduction program 0.5% of Total Gross Margin improvement  Continue increasing machined Parts Activity  Implement 5’S in all manufacturing areas.  Implement Kaizen groups and activities  BOM´s accuracy from 98% to 100%  Carry out project of re-location of raw materials warehouse near of CNC area.
  • 47.
    47 US Filter ChemFeed Mexico Key Issues, Activities and Objectives - 2004 Materials  Reduction of inventory by 143K  Material Cost Savings at 3-4% on total material procurement spend in 2004 (not including Interco purchases) increase 0.5% GM  Better utilization and use of MRP system and implementation APICS techniques  Maintain on-time Deliveries to >98% and sustain improvements in deliveries performance to meet customer expectations  Evaluate new alternatives for traffic reducing costs and transit times
  • 48.
    48 Actual Forecast Budget 20022003 2004 External Revenue 2,614 2,764 3,096 Total Revenue 4,493 5,448 5,946 ($ in 000's) Commissions 0 0 0 S&M other 204 171 162 Total S&M 204 171 162 R&D 0 0 0 G&A 391 489 528 Total Operating Expense 595 660 690 Commissions (% External Revenue) 0.0% 0.0% 0.0% % of Total Revenue S&M Other 4.5% 3.1% 2.7% Total S&M 4.5% 3.1% 2.7% R&D 0.0% 0.0% 0.0% G&A 8.7% 9.0% 8.9% Total Operating Expense 13.2% 12.1% 11.6% C1 Operating Expense Summary
  • 49.
    49 CY2004 2002 2003 Q1Q2 Q3 Q4 Sales & Marketing - 1 1 1 1 1 R&D - - - - - - Finance 4 5 5 5 5 5 IT 1 1 1 1 1 1 HR 1 1 1 1 1 1 All Other Admin 1 1 1 1 1 1 Total SG&A 7 9 9 9 9 9 (Include FTE and Temps by classification) E1 Operating Expense Headcount Trend
  • 50.
    50 US Filter ChemFeed Mexico Summary of Key Financial Drivers & Assumptions - 2004 Sales & Marketing (excl commissions & allocation) - Favorable impact for Miguel Torres expenses by 80K - Hire new sales manager unfavorable variance by 70K - Net impact favorable by 10K -  Take advantage of other CFG BC´s for savings. - Increase sales in Industrial Market with the same investment. - - - - Initiatives in plan to trend % lower (Summary of Change vs. prior year – (10K) vs 03 forecast
  • 51.
    51 US Filter ChemFeed Mexico Key Issues, Activities and Objectives - 2004 Sales  Hire new sales Manager  Recover lost market/restructure current Municipal Rep and distribuiton netework  Focus on Core Products and Services as baseline for Business growth  Set up and organize the distribution network for industrial sector  Increase Field Technical Services & Spare sales  Continue with the development complete packages at a competitive position  Preparation & Specialization on new products for market development  Develop Key – Account ( Pemex, CFE) management position
  • 52.
    52 US Filter ChemFeed Mexico Key Issues, Activities and Objectives - 2004 Marketing  Participation regional tradeshows maintaining our presence into the market,  Create loyal customers providing complete satisfaction  Create new strategies in order to protect the investment and promote the development of applications offering Integral solutions to the customer.  Reconfiguration and improvement of website  Continue to have available in Spanish language data and information on products and technologies  Support the training program of new and existing products.  Development a marketing plan to lean the sales plan in the introduction into industrial market  Evaluate competitors and market trends
  • 53.
    53 US Filter ChemFeed Mexico Key Issues, Activities and Objectives - 2004 Research & Development  Continued to feed information to design centers for local products and Marketing needs.
  • 54.
    54 US Filter ChemFeed Mexico Summary of Key Financial Drivers & Assumptions - 2004 G&A - Inflation 5%, impact 25K negative including professional fees and salaries and Fringes. - New assistant controller salaries and fringes $20K - Reduce IT miscellaneous expenses by 5K Favorable  Budget Management  Control Headcount  Marketing and IT expenses management  Preserve cost control mentality. - Initiatives in plan to trend % lower (G&A Increase $40K and 7.3% vs 2003 Fcst, as a percentage of Total this represent a decrease from 9.0% to 8.9%)
  • 55.
    55 US Filter ChemFeed Mexico Key Issues, Activities and Objectives – 2004 Finance  Hire an Assistant Controller  Development of long term strategies plans in which Sales, Manufacturing and Finance play a key role in the realization of business objectives.  Implementation of Internal Audit in key departments such as Accounts Payables and Purchasing, Accounts Receivables and Shipping, Treasury and Cost Department.  Develop automatic Financial details report to improve end month reporting to corporate from 5 to 4 days.  Implement best Corporate and Local accounting Practices.  Be part of the success of the plan.
  • 56.
    56 US Filter ChemFeed Mexico Key Issues, Activities and Objectives - 2004 Information Technology  Improve and promote the use of the web page as a sales tool. (E- business inclusion)  Continue IT personnel training  Install Service, Finance and Production applications created by VW, using Oracle database  Create a continuous training plan for all internal personnel in order keep them updated  Give support to all departments to improve all operational taks
  • 57.
    57 US Filter ChemFeed Mexico Key Issues, Activities by Functional Area – Other - 2004  Maintain and to continue with the goal of "0" Serious Injuries  Continue with the training of the personnel in Safety and Health topics.  Human Resources to improve performance on recruitment, orientation, employee performance monitoring, activities, committee, etc. to be consistent with corporate policy.  Maintain ISO 9000 Certification  Maintain Quality and Certified Vendor with government entities such as PEMEX & CFE  Implementation of a program to improve the quality system efficiency and reporting.
  • 58.
    58 Headcount Trend Dic-02 Mar-03Jun-03 Sep-03 Dic-03 Mar-04 Jun-04 Sep-04 Dic-04 Mfg 39 40 43 45 43 43 43 43 43 Eng 1 1 1 1 1 1 1 1 1 Field Service 3 3 3 3 3 3 3 3 3 Materials 5 5 5 5 5 5 5 5 5 Other - Domestic Side 5 5 5 5 5 5 5 5 5 Other - List - - - - - - - - - Total COGS 53 54 57 59 57 57 57 57 57 SG&A Sales & Marketing - - - - 1 1 1 1 1 R&D - - - - - - - - - Finance 4 4 4 4 5 5 5 5 5 IT 1 1 1 1 1 1 1 1 1 HR 1 1 1 1 1 1 1 1 1 All Other Admin 1 1 1 1 1 1 1 1 1 Total SG&A 7 7 7 7 9 9 9 9 9 Total 60 61 64 66 66 66 66 66 66 Revenue p/FTE 75 19 20 19 24 21 25 26 26 Bus Income p/FTE 5 (0) 0 1 4 0 1 2 2 EP p/FTE (2) (2) (1) (0) 2 (1) 0 1 1 E1 Cost of Sales Departments
  • 59.
    59 2002 Actual 2003Plan 2003 Actu3 2004 Plan Backlog (end of month) 501 665 493 -25.9% -1.7% 574 16.5% Bookings 4,795 6,043 5,447 -9.9% 13.6% 6,038 10.9% Revenue External - capital & other 2,614 2,899 2,450 -15.5% -6.3% 2,288 -6.6% External - Aftermarket & Service 0 655 314 -52.0% 808 157.2% Total External 2,614 3,554 2,764 -22.2% 5.7% 3,096 12.0% Intercompany 1,879 2,310 2,684 16.2% 42.8% 2,850 6.2% Total 4,493 5,863 5,448 -7.1% 21.3% 5,946 9.1% Project/Product Gross Margin External - capital 821 1,239 166 -86.6% -79.7% 558 235.3% External - Aftermarket & Service 0 391 120 -69.4% 404 237.2% Total External 821 1,630 286 -82.4% -65.1% 962 236.1% Intercompany 142 199 789 295.9% 453.6% 225 -71.5% Total 1,037 1,829 1,075 -41.2% 3.7% 1,187 10.4% Other cost of sales - (EXP)/Income Warranty 24 0 52 116.1% 0 -100.0% Other (Frt, obsol, etc) 49 0 152 214.1% 207 35.9% Over/under absorption 0 688 0 -100.0% 0 Gross Margin 964 1,141 870 -23.7% -9.7% 980 12.6% Gross Margin % Std External - capital 31% 43% 7% 24% 259.1% Std External - aftermarket 60% 38% 50% 31.1% Total External 31% 46% 10% 31% 200.1% I/C 8% 9% 29% 8% -73.1% Total 21% 19% 16% 16% 138.2% Operating Exp (income) External Commissions 0 42 0 -100.0% 0 % Total revenue 0.0% 0.7% 0.0% 0.0% BC Selling & Marketing 204 180 171 -5.1% -16.2% 162 -5.3% R&D 0 0 0 0 G&A 391 453 489 8.0% 25.1% 528 8.0% Total operating expense 595 633 660 4.3% 10.9% 690 4.5% % total revenue 13% 11% 12% 12% Business Income (loss) 369 508 210 -58.7% -43.1% 290 38.0% % total revenue 8% 9% 4% 5% C1 P&L Summary % Var vs. 03 Plan % Var 02 to 03 Fcst % Var 03 Fcst to 04 Plan
  • 60.
    60 P&L Summary (ifapplicable) excluding Product Transfers 2002 Actual 2003 Plan 2003 Actu3 2004 Plan Backlog (end of month) 501 665 493 -25.9% -1.7% 574 16.5% Bookings 4,795 6,043 5,447 -9.9% 13.6% 6,038 10.9% Revenue External - capital & other 2,614 2,899 2,450 -15.5% -6.3% 2,288 -6.6% External - Aftermarket & Service 0 655 314 -52.0% 808 157.2% Total External 2,614 3,554 2,764 -22.2% 5.7% 3,096 12.0% Intercompany 1,879 2,310 2,684 16.2% 42.8% 2,850 6.2% Total 4,493 5,863 5,448 -7.1% 21.3% 5,946 9.1% Project/Product Gross Margin External - capital 821 1,239 166 -86.6% -79.7% 558 235.3% External - Aftermarket & Service 0 391 120 -69.4% 404 237.2% Total External 821 1,630 286 -82.4% -65.1% 962 236.1% Intercompany 142 199 789 295.9% 453.6% 225 -71.5% Total 1,037 1,829 1,075 -41.2% 3.7% 1,187 10.4% Other cost of sales - (EXP)/Income Warranty 24 0 52 116.1% 0 -100.0% Other (Frt, obsol, etc) 49 0 152 214.1% 207 35.9% Over/under absorption 0 688 0 -100.0% 0 Gross Margin 964 1,141 870 -23.7% -9.7% 980 12.6% Gross Margin % Std External - capital 31% 43% 7% -84% -78% 24% 259.1% Std External - aftermarket #¡DIV/0! 60% 38% -36% #¡DIV/0! 50% 31.1% Total External 31% 46% 10% -77% -67% 31% 200.1% I/C 8% 9% 29% 241% 288% 8% -73.1% Total 21% 19% 16% 16% 138.2% Operating Exp (income) External Commissions 0 42 0 -100.0% 0 % Total revenue 0.0% 0.7% 0.0% 0.0% BC Selling & Marketing 204 180 171 162 R&D 0 0 0 0 G&A 391 453 489 8.0% 25.1% 528 8.0% Total operating expense 595 633 660 4.3% 10.9% 690 4.5% % total revenue 13% 11% 12% 12% Business Income (loss) 369 508 210 -58.7% -43.1% 290 38.0% % total revenue 8% 9% 4% 5% C1 % Var vs. 03 Plan % Var 02 to 03 Fcst % Var 03 Fcst to 04 Plan
  • 61.
    61 Quarterly P&L Q1 Q2Q3 Q4 Total Revenue CY2002 Actual 1,021 1,170 1,041 1,260 4,493 CY2003 Fcst 1,135 1,249 1,285 1,576 5,448 CY2004 Plan 1,399 1,619 1,696 1,686 5,946 CY2004 % of Total 24% 27% 29% 28% 100% Gross Margin CY2002 Actual 186 212 206 270 964 CY2003 Fcst 137 178 219 312 870 CY2004 Plan 185 263 290 287 980 CY2004 % of Total 19% 27% 30% 29% 100% Operating Expense CY2002 Actual 140 141 150 164 595 CY2003 Fcst 146 164 156 170 660 CY2004 Plan 174 174 174 174 690 CY2004 % of Total 25% 25% 25% 25% 100% Business Income CY2002 Actual 46 71 56 106 369 CY2003 Fcst (8) 14 63 142 210 CY2004 Plan 12 90 117 113 290 CY2004 % of Total 4% 31% 40% 39% 100% C1
  • 62.
    62 Comparison of CY2004 PriorYr Plan vs. Current Yr Plan 2004 Variance External Revenue 3,096 3,881 (785) 79.8% Interco Revenue 2,850 2,525 325 112.9% Total Revenue 5,946 6,406 (460) 92.8% GM 980 1,281 (301) 76.5% % of Total Revenue 16.5% 20.0% -3.5% SG&A 690 664 26 103.9% % of Total Revenue 11.6% 10.4% 1.2% EBITA 290 617 (327) 47.0% % of Total Revenue 4.9% 9.6% -4.8% C1 F/(U) % Proposed As of August 2003 As of August 2002
  • 63.
    63 US Filter ChemFeed Mexico 2004 vs. Prior Year Summary of Change in Business Income  Revenue – Increase of $498K or 9.1% vs 2003 forecast  GM Increase 10.4% - GM 112K over 2003 forecast  SGA $ Increase - 30K % Increase - 4.5% Decrease % of Total revenue -0.5%  Bus Income change Increase of 79K over 2003 fcst Increase of 25.4% over 2003 forecast Increase % of Total revenue 1%
  • 64.
  • 65.
    65 Capital - 2003 *InOrder of Priority Major Projects* 000's Benefit / Need Building improvements 10 Health and safety compliance Machinery and Equipment 33 Fourth axis for CNC Machine and Tooling & Fixtures ( Cost Reduction) Replace offices chairs. 11 Replace all old chair for safety compliance All Other Total 54 2003 Budget 141 2003 Forecast 54 2003 Depreciation 142 F1
  • 66.
    66 Capital - 2004 *InOrder of Priority Major Projects* 000's Benefit / Need Air Conditioned Unit 29 Health and safety compliance Tools and Fixtures 27 Machines and Tooling & Fixtures ( Cost Reduction) QC Measuring Tools 10 ISO Certification Process All Other Total 66 2003 Budget 141 2003 Forecast 54 2003 Depreciation 142 F1
  • 67.
    67 Capital - 2005+ 2006 *In Order of Priority Major Projects* 2005 000's 2006 000's Benefit / Need CNC Machine 96 48 Increase capacity to meet intercompan Tools and Fixtures 10 Building improvements 19 Tools and Fixtures 7 7 QC Measuring Tools 10 10 All Other Total 122 84 2003 Budget 141 2003 Forecast 54 2003 Depreciation 142 F1
  • 68.
    68 Cash Flow Summary (in$000's) 2002 Actual 2003 Plan 2003 Actu 3 2004 Plan EBITA 369 508 211 290 Depreciation 163 182 142 166 "Working Capital" Accounts & other recievables (net) (171) 9 132 88 Inventory (net) 150 321 340 243 CEEB & BEEC, net 0 0 0 0 Accounts payable & O/S checks (57) 81 75 (63) Cash paid for restructuring 0 0 0 0 Other accrued liabilities 0 1 0 0 Income Tax (123) (108) (106) (133) Other working capital 321 4 (54) (25) Total Working Capital 120 309 387 110 Capital spending (29) (141) (54) (66) Project expenditures 0 0 0 0 Proceeds from project financing 0 0 0 0 Proceeds from F/A disposal 0 0 0 0 Fixed asset transfers 0 0 0 0 Acquisitions 0 0 0 0 Divestitures 0 0 0 0 Debt 0 0 0 0 Interest 0 0 0 0 Other (125) 0 (285) 0 Net Change, I/C, & Cash Accounts 498 858 401 500 G1
  • 69.
    69 Summary of KeyFinancial Drivers & Assumptions - 2004 Cash Flow  EBITDA $ 456K  External A/R change - Decrease by 88K  Revenue to be invoiced at December.  Inventory change: 243K Reduction  Strong management on inventory and expect to reduce in slow movement inventory  Capital $ change: 66K spending  Manage spending for health and safety issues only  Other major item /change net impact in payables and intercompany receivables  Manage Ico payables according receivables  Other major item /change  Meet EBITA plan.  Improve inventory management  Continue to drive improve collections  Continue to improve management of payables (Summary of Change –Total Cash Flow: $500) Key Plans and Success Factors
  • 70.
    70 Balance Sheet, KeyMetrics and Economic Profit
  • 71.
    71 Key Metrics (in $000's) Dic-02Mar-03 Jun-03 Sep-03 Dic-03 Mar-04 Jun-04 Sep-04 Dic-04 Inventory Raw Material 2,001 1,844 1,862 1,859 1,827 1,827 1,827 1,827 1,827 WIP 479 524 502 384 384 375 366 357 348 Finished Goods 347 357 347 328 328 328 328 328 328 Total (gross) 2,827 2,724 2,710 2,570 2,538 2,529 2,520 2,511 2,502 Sys - DSI 262 249 231 229 199 181 159 154 153 Customer Accounts A/R 641 583 640 642 471 382 567 283 383 CEEB 0 0 0 0 0 0 0 0 0 BECE 0 0 0 0 0 0 0 0 0 Sys - Total DSO 59 101 99 97 54 54 52 50 48 A/R aging (%) 0-30 66.0% 54.0% 44.0% 54.0% 66.0% 70.0% 72.0% 80.0% 70.0% 31-60 23.0% 17.0% 28.0% 27.0% 25.0% 25.0% 26.0% 19.0% 12.0% 61-90 1.0% 4.0% 11.0% 19.0% 9.0% 5.0% 2.0% 1.0% 18.0% 90+ 10.0% 25.0% 17.0% 0.0% 0.0% 0.0% 0.0% 0.0% 0.0% Retention $ 0 0 0 0 0 0 0 0 0 % of A/R 0.0% 0.0% 0.0% 0.0% 0.0% 0.0% 0.0% 0.0% 0.0% Sys-DPO 52 73 80 64 59 60 60 60 58 Sys CCC 269 278 249 261 194 175 151 144 143 H1
  • 72.
    72 Key Initiatives ToImprove Balance Sheet – add additional pages if needed  A/R - Continue drive collection with aggressive strategies to improve collections  Inventory - Continue drive to improve cycle count procedures -Improve MRP techniques in driving increase in Inventory turns. -Continue pushing intercompany and local possibilities to move slow inventory - Inventory reserves- Outside Auditor position  CEEB & BECE - Align Terms and Conditions with Country Standards
  • 73.
    73 Economic Profit 2004 Plan 2002Act 2003 Plan 2003 Actu 3 Q1 Q2 Q3 Q4 Total Business Income 369 508 311 73 73 73 73 290 Capital Charge (412) (382) (344) (78) (78) (76) (74) (305) Economic Profit (43) 126 (33) (5) (5) (3) (2) (15) Capital Charge Manageable Assets (*) Accounts Receivable 489 343 513 286 318 357 319 320 Other receivables 0 0 0 0 0 0 0 0 Cost in excess earnings & billings 0 0 0 0 0 0 0 0 Inventory (Net) 2,659 2,537 2,450 2,258 2,248 2,273 2,253 2,258 Other current assets 41 67 43 23 5 4 4 9 Fixed Assets (net) 1,677 1,644 1,601 1,652 1,613 1,562 1,511 1,584 Other intangibles (net, exclude GW 12/00) 0 0 0 0 0 0 0 0 Other long term assets 0 0 0 0 0 0 0 0 Accts payable & outstanding checks (545) (684) (795) (899) (787) (697) (481) (716) Accrued expenses (196) (88) (322) (171) (251) (433) (598) (363) BECE 0 0 0 0 0 0 0 0 Other current liabilities (3) 0 (52) (45) (45) (45) (45) (45) Subtotal 4,122 3,819 3,438 3,104 3,102 3,021 2,963 3,047 Adjustments: 0 0 0 0 0 0 0 0 Total Manageable Assets 4,122 3,819 3,438 3,104 3,102 3,021 2,963 3,047 Average Manageable Assets 4,122 3,819 3,438 3,104 3,102 3,021 2,963 3,047 Capital Charge (10% Full Year) 412 382 344 78 78 76 74 305 I1
  • 74.
    74 Summary Economic Profit EconomicProfit 2003 Forecast $-33K 2004 Plan $ -15K Explanation of major variances:  1. Earnings - Increase in Business Income by 25% - -  2. Capital Charge - Improve inventory reduction - Fixed Assets flat - Expect to maintain same capital charge than 2003 forecast, increasing Economic profit for EBITA increase. -AR Reduction by 88K
  • 75.
    75 2004 Plan Dic-02 Dic-03Q1 Q2 Q3 Q4 Total Doubtful accounts Balance sheet (66) (66) (66) (66) (66) (66) (66) P&L Charge 18 0 0 0 0 0 0 Inventory reserve Balance sheet (201) (333) (385) (437) (489) (540) (540) P&L Charge 18 47 52 52 52 52 207 Warranty Balance sheet 4 38 38 38 38 38 38 P&L Charge 4 34 0 0 0 0 0 Restructure Balance sheet 0 0 0 0 0 0 0 P&L Charge 0 0 0 0 0 0 0 Accrued job cost Balance sheet 33 6 6 6 0 0 0 Accrued legal Balance sheet 0 0 0 0 0 0 0 P&L Charge 0 0 0 0 0 0 0 Accrued Professional Fees Balance sheet 0 0 0 0 0 0 0 Reserve Summary (in $000's)
  • 76.
    76 USFilter Chem FeedMexico Reserve Summary Comments – Upside & Downside Upsides Downsides - External Auditors adjustment that could have important affectation to P&L - Low revenues for the year, that could reduce reserve - - Obsolete inventory reserve is accrued by 1% of total revenues - External Auditor position - - - - - Corporate reserve creation for Inventory - Key Assumptions and Success Factors
  • 77.
  • 78.
    78 US Filter ChemFeed Mexico Risk / Opportunity Assessment – Year 2004 Upsides Downsides -Continued frozen allocation of budgets -FCPA Issues -Slow down in sales during transition to new reps. -Exchange rate Fluctuation -Continued Aggressive competition tactics- - Implement and Development Industrial Distribution Network -Introduction of additional Chem Feed technologies -Re-alignment distributions network for Industrial and Municipal Market -Aggressively back on track with inventory reduction -Avalon Project realization and Development Centers yielding forecasted cost reductions - Government stability and country economic growth -Continued Mexican price list development -Regional Waste Water funding- Monterrey -DF Projects -Selling of slow moving raw materials Key Assumptions and Success Factors
  • 79.
    79 US Filter ChemFeed Mexico Key Non-Controllable Events or Activities that may Influence the Plan  Economic slow down Economic slow down  FCPA Issues FCPA Issues  Exchange rate fluctuation Exchange rate fluctuation  Economic and Governmental policies changes Economic and Governmental policies changes  Competition aggressiveness due to flat Large Systems in Competition aggressiveness due to flat Large Systems in  municipal market municipal market  FCPA issues FCPA issues  Economic slow down Economic slow down  Exchange rate fluctuation Exchange rate fluctuation  Economic and Governmental policies changes Economic and Governmental policies changes Year 1 Year 2
  • 80.
    80 Potential Acquisition, StrategicAlliance, JV, etc. (not built into plan)
  • 81.
    81 CONFIDENTIAL Potential Acquisition, StrategicAlliance, JV,etc. Targets (not to be built into plan) (in $000’s) Product Revenue Strategic Fit Timing
  • 82.
  • 83.
    83 2002 2003 200404 vs. 03 2005 05 vs. 04 2006 06 vs. 05 Actual Fcst Plan Var % Plan Var % Plan Var % Total Bookings 4,795 5,447 6,038 110.9% 6,705 111.0% 7,509 112.0% Total Backlog 501 493 574 116.5% 810 141.1% 1,433 177.0% External Revenue 2,614 2,764 3,096 112.0% 3,545 114.5% 4,112 116.0% Interco Revenue 1,879 2,684 2,850 106.2% 3,078 108.0% 3,355 109.0% Total Revenue 4,493 5,448 5,946 109.1% 6,623 111.4% 7,467 112.7% GM 964 971 980 111.2% 1,214 123.9% 1,436 118.3% % of Total Revenue 21.5% 17.82% 16.5% 18.3% 19% SG&A 595 660 690 104.5% 726 105.2% 762 105.0% % of Total Revenue 13.2% 12.1% 11.6% 0.0% 11.0% 10.2% Business Income 369 311 290 125% 488 168.3% 674 138.1% % of Total Revenue 8.2% 5.7% 4.9% 7.4% 9.0% Cash Flow 498 401 500 124.7% 630 126.1% 801 127.0% Capital (29) (54) (66) 122.4% (122) 184.6% (84) 68.6% Economic Profit (43) (33) (15) 44.8% 88 -599.8% 189 214.6% Snapshot Trend (2002-2006) (in $000's)
  • 84.
    84 US Filter ChemFeed Mexico Key Strategic Elements of 3Yr Plan - Successful Industrial Market penetration - Sustain and improve core business in across WT Lines. - Introduction of new technologies -OSEC, Skid Systems, Equal Draw - Continued growth in recurring services -Go after competitors installed base - Realigned and motivated Reps/Distribution network both municipal and industrial market. - Piggy back of Stranco and Elcat product and application know how and develop capabilities in Mexico - Trained and qualify technical support staff at the plant - Sustain Intercompany sales trend in gross margin improvement - Continued technical and application support for LA Distribution -Inventory reduction and materials management -No FCPA issues in Market Year 1
  • 85.
    85 US Filter ChemFeed Mexico Key Strategic Elements of 3Yr Plan Year 2 & 3 -New and motivated reps and Distribution network - Regionally and National both Industrial and Municipal - Industrial installed base - Product and technology specialist in Chem Feed areas. - Go after competitors installed base -Inventory reduction and materials management
  • 86.
    86 US Filter ChemFeed Mexico Strategic Overview/Summary Assessments Overall Issues and Priorities Summary 2004 - Successful Industrial Market penetration - Sustain core business in Gas Feed. - Introduction of new technologies -OSEC, Skid Systems - Continued growth in recurring services -Go after competitors installed base - Realigned and motivated reps/Distribution network both municipal and industrial market. - Piggy back of Stranco and Elcat product and application know how and develop capabilities in Mexico - Trained and qualify technical support staff at the plant - Sustain Intercompany sales trend in gross margin improvement - Continued technical and application support for LA Distribution - Inventory reduction and materials management 2-5 Years - New and motivated reps and Distribution network - Regionally and National both Industrial and Municipal - Industrial installed base - Product and technology specialist in Chem Feed areas. - Go after competitors installed base.
  • 87.
  • 88.
    88 Systems Group Deliverablesfor meeting with Andy Seidel and VE Paris
  • 89.
    89 2003 Summary  Highlights2003 P&L vs Plan variance  Revenues at 87% of plan, shortfall in Domestic Market  Gross Margin 3.5% below plan as a % of total revenues but 349K below plan.  SG&A at Plan  EBITA of 211K vs 540K of plan variance of 39% below plan mainly driven by Domestic revenues shortfall  Highlights 2003 cash flow vs Plan variance  Cash Flow of 400K vs 900K of plan variance of 55% or 500K below plan driven by EBITA shortfall  Highlight 2003 metrics and EP vs Plan variance  EP of -220K vs 146 positive planned, driven by EBITA shortfall by 332K
  • 90.
    90 2004 summary  Statethe assumptions how 2004 P&L will be achieved  Strong management of Domestic sales side, will hire new Sales manager to drive focus and sales network  State the assumptions how 2004 cash flow will be achieved  Strong Inventory management and new strategies to improve Domestic and Intercompany collections  State the assumptions how 2004 metrics and EP will be achieved  Focus on EBITA and Inventory management will secure EP will be achieved