This presentation poster infographic delves into the multifaceted impacts of globalization through the lens of Nike, a prominent global brand. It explores how globalization has reshaped Nike's supply chain, marketing strategies, and cultural influence worldwide, examining both the benefits and challenges associated with its global expansion.
PPrreesseenntteedd bbyy:: GGrroouupp 66
GGlloobbaalliizzaattiioonn
o f
PP
oo
ll
yy
ee
ss
tt
ee
rr
RR
uu
bb
bb
ee
rr
EE
tt
hh
yy
ll
ee
nn
ee
VV
ii
nn
yy
ll
AA
cc
ee
tt
aa
tt
ee
GG
ee
nn
uu
ii
nn
ee
LL
ee
aa
tt
hh
ee
rr
SS
yy
nn
tt
hh
ee
tt
ii
cc
LL
ee
aa
tt
hh
ee
rr
CC
oo
tt
tt
oo
nn
C
o
u
n
t
r
i
e
s
I
n
v
o
l
v
e
d
Ni
k
e
h
a
s
m
o
r
e
t
h
a
n
7
0
0
s
h
o
p
s
i
n
c
o
n
t
r
a
c
t
w
i
t
h
w
o
r
l
d
w
i
d
e,
w
h
e
r
e
i
n
t
h
e
i
r
offi
c
e
s
a
n
d
i
n
d
e
p
e
n
d
e
n
t
fa
c
t
o
r
y
o
u
t
l
e
t
s
a
r
e
fo
u
n
d
w
i
t
h
i
n
t
h
e
p
r
e
m
i
s
e
s
of
ap
p
r
o
x
i
m
a
t
e
l
y
4
5
c
o
u
n
t
r
i
e
s.
AAuussttrraalliiaa
China
India
IInnddoonneessiiaa
TThhaaiillaanndd
TTuurrkkeeyy
USA
VViieettnnaamm
NNiikkee SSuuppppllyy CChhaaiinn
RRuubbbbeerr,, FFaabbrriicc
aanndd ootthheerr rraaww
mmaatteerriiaallss
Shoe
MMaannuuffaaccttuurriinngg
aanndd AAsssseemmbbllyy
MMaarrkkeettiinngg
SSppoorrttiinngg ggooooddss,,
ddeevveellooppmmeenntt
aanndd SShhooee ssttoorreess
OOnnlliinnee,, CCaattaalloogg
aanndd ootthheerr rreettaaiill
NNiikkee bbrraannddeedd
shoes
PPrroodduucctt
ddeevveellooppmmeenntt
CCuussttoommeerr nneeeeddss//wwaannttss ffeeeeddbbaacckk
NNiikk
Nike Supply Chain
Globalization of Nike
Nike Manufacturing Process
Rubber Materials Nike
Ethylene Vinyl Acetate Nike
Genuine Leather Nike
Synthetic Leather Nike
Cotton in Nike Apparel
Nike Shops Worldwide
Nike Manufacturing Countries
Cold Cement Assembly Nike
3D Printing Nike Shoes
Nike Product Development
Nike Marketing Strategies
Nike Customer Feedback
Nike Distribution Centers
Automation in Nike Manufacturing
Nike Consumer Direct Acceleration
Nike Logistics and Transport
how to sell pi coins in South Korea profitably.DOT TECH
Yes. You can sell your pi network coins in South Korea or any other country, by finding a verified pi merchant
What is a verified pi merchant?
Since pi network is not launched yet on any exchange, the only way you can sell pi coins is by selling to a verified pi merchant, and this is because pi network is not launched yet on any exchange and no pre-sale or ico offerings Is done on pi.
Since there is no pre-sale, the only way exchanges can get pi is by buying from miners. So a pi merchant facilitates these transactions by acting as a bridge for both transactions.
How can i find a pi vendor/merchant?
Well for those who haven't traded with a pi merchant or who don't already have one. I will leave the telegram id of my personal pi merchant who i trade pi with.
Tele gram: @Pi_vendor_247
#pi #sell #nigeria #pinetwork #picoins #sellpi #Nigerian #tradepi #pinetworkcoins #sellmypi
BYD SWOT Analysis and In-Depth Insights 2024.pptxmikemetalprod
Indepth analysis of the BYD 2024
BYD (Build Your Dreams) is a Chinese automaker and battery manufacturer that has snowballed over the past two decades to become a significant player in electric vehicles and global clean energy technology.
This SWOT analysis examines BYD's strengths, weaknesses, opportunities, and threats as it competes in the fast-changing automotive and energy storage industries.
Founded in 1995 and headquartered in Shenzhen, BYD started as a battery company before expanding into automobiles in the early 2000s.
Initially manufacturing gasoline-powered vehicles, BYD focused on plug-in hybrid and fully electric vehicles, leveraging its expertise in battery technology.
Today, BYD is the world’s largest electric vehicle manufacturer, delivering over 1.2 million electric cars globally. The company also produces electric buses, trucks, forklifts, and rail transit.
On the energy side, BYD is a major supplier of rechargeable batteries for cell phones, laptops, electric vehicles, and energy storage systems.
How to get verified on Coinbase Account?_.docxBuy bitget
t's important to note that buying verified Coinbase accounts is not recommended and may violate Coinbase's terms of service. Instead of searching to "buy verified Coinbase accounts," follow the proper steps to verify your own account to ensure compliance and security.
5 Tips for Creating Standard Financial ReportsEasyReports
Well-crafted financial reports serve as vital tools for decision-making and transparency within an organization. By following the undermentioned tips, you can create standardized financial reports that effectively communicate your company's financial health and performance to stakeholders.
Financial Assets: Debit vs Equity Securities.pptxWrito-Finance
financial assets represent claim for future benefit or cash. Financial assets are formed by establishing contracts between participants. These financial assets are used for collection of huge amounts of money for business purposes.
Two major Types: Debt Securities and Equity Securities.
Debt Securities are Also known as fixed-income securities or instruments. The type of assets is formed by establishing contracts between investor and issuer of the asset.
• The first type of Debit securities is BONDS. Bonds are issued by corporations and government (both local and national government).
• The second important type of Debit security is NOTES. Apart from similarities associated with notes and bonds, notes have shorter term maturity.
• The 3rd important type of Debit security is TRESURY BILLS. These securities have short-term ranging from three months, six months, and one year. Issuer of such securities are governments.
• Above discussed debit securities are mostly issued by governments and corporations. CERTIFICATE OF DEPOSITS CDs are issued by Banks and Financial Institutions. Risk factor associated with CDs gets reduced when issued by reputable institutions or Banks.
Following are the risk attached with debt securities: Credit risk, interest rate risk and currency risk
There are no fixed maturity dates in such securities, and asset’s value is determined by company’s performance. There are two major types of equity securities: common stock and preferred stock.
Common Stock: These are simple equity securities and bear no complexities which the preferred stock bears. Holders of such securities or instrument have the voting rights when it comes to select the company’s board of director or the business decisions to be made.
Preferred Stock: Preferred stocks are sometime referred to as hybrid securities, because it contains elements of both debit security and equity security. Preferred stock confers ownership rights to security holder that is why it is equity instrument
<a href="https://www.writofinance.com/equity-securities-features-types-risk/" >Equity securities </a> as a whole is used for capital funding for companies. Companies have multiple expenses to cover. Potential growth of company is required in competitive market. So, these securities are used for capital generation, and then uses it for company’s growth.
Concluding remarks
Both are employed in business. Businesses are often established through debit securities, then what is the need for equity securities. Companies have to cover multiple expenses and expansion of business. They can also use equity instruments for repayment of debits. So, there are multiple uses for securities. As an investor, you need tools for analysis. Investment decisions are made by carefully analyzing the market. For better analysis of the stock market, investors often employ financial analysis of companies.
What price will pi network be listed on exchangesDOT TECH
The rate at which pi will be listed is practically unknown. But due to speculations surrounding it the predicted rate is tends to be from 30$ — 50$.
So if you are interested in selling your pi network coins at a high rate tho. Or you can't wait till the mainnet launch in 2026. You can easily trade your pi coins with a merchant.
A merchant is someone who buys pi coins from miners and resell them to Investors looking forward to hold massive quantities till mainnet launch.
I will leave the telegram contact of my personal pi vendor to trade with.
@Pi_vendor_247
Seminar: Gender Board Diversity through Ownership NetworksGRAPE
Seminar on gender diversity spillovers through ownership networks at FAME|GRAPE. Presenting novel research. Studies in economics and management using econometrics methods.
how to sell pi coins effectively (from 50 - 100k pi)DOT TECH
Anywhere in the world, including Africa, America, and Europe, you can sell Pi Network Coins online and receive cash through online payment options.
Pi has not yet been launched on any exchange because we are currently using the confined Mainnet. The planned launch date for Pi is June 28, 2026.
Reselling to investors who want to hold until the mainnet launch in 2026 is currently the sole way to sell.
Consequently, right now. All you need to do is select the right pi network provider.
Who is a pi merchant?
An individual who buys coins from miners on the pi network and resells them to investors hoping to hang onto them until the mainnet is launched is known as a pi merchant.
debuts.
I'll provide you the Telegram username
@Pi_vendor_247
when will pi network coin be available on crypto exchange.DOT TECH
There is no set date for when Pi coins will enter the market.
However, the developers are working hard to get them released as soon as possible.
Once they are available, users will be able to exchange other cryptocurrencies for Pi coins on designated exchanges.
But for now the only way to sell your pi coins is through verified pi vendor.
Here is the telegram contact of my personal pi vendor
@Pi_vendor_247
Pensions and housing - Pensions PlayPen - 4 June 2024 v3 (1).pdf
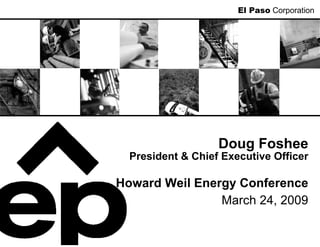
el paso 2E961AE6-D8CD-4328-9657-89A97FED03C0_Howard_Weil_032409
1. El Paso Corporation
Doug Foshee
President & Chief Executive Officer
Howard Weil Energy Conference
March 24, 2009
2. Cautionary Statement
Regarding Forward-looking Statements
This presentation includes certain forward-looking statements and projections. The company has made every reasonable effort to ensure that the
information and assumptions on which these statements and projections are based are current, reasonable, and complete. However, a variety of factors
could cause actual results to differ materially from the projections, anticipated results or other expectations expressed in this release, including, without
limitation, changes in unaudited and/or unreviewed financial information; our ability to meet our 2009 debt maturities; volatility in, and access to, the
capital markets; our ability to implement and achieve our objectives in our 2009 plan, including achieving our earnings and cash flow targets; the effects of
any changes in accounting rules and guidance; our ability to meet production volume targets in our Exploration and Production segment; our ability to
comply with the covenants in our various financing documents; our ability to obtain necessary governmental approvals for proposed pipeline and E&P
projects and our ability to successfully construct and operate such projects; the risks associated with recontracting of transportation commitments by our
pipelines; regulatory uncertainties associated with pipeline rate cases; actions by the credit rating agencies; the successful close of our financing
transactions; our ability to close asset sales, as well as transactions with partners on one or more of our expansion projects that are included in the plan
on a timely basis; credit and performance risk of our lenders, trading counterparties, customers, vendors and suppliers ;changes in commodity prices and
basis differentials for oil, natural gas, and power; our ability to obtain targeted cost savings in our businesses; inability to realize anticipated synergies
and cost savings on a timely basis or at all; general economic and weather conditions in geographic regions or markets served by the company and its
affiliates, or where operations of the company and its affiliates are located, including the risk of a global recession and negative impact on natural gas
demand; the uncertainties associated with governmental regulation; political and currency risks associated with international operations of the company
and its affiliates; competition; and other factors described in the company's (and its affiliates') Securities and Exchange Commission filings. While the
company makes these statements and projections in good faith, neither the company nor its management can guarantee that anticipated future results will
be achieved. Reference must be made to those filings for additional important factors that may affect actual results. The company assumes no obligation
to publicly update or revise any forward-looking statements made herein or any other forward-looking statements made by the company, whether as a
result of new information, future events, or otherwise.
Certain of the production information in this presentation include the production attributable to El Paso’s 49 percent interest in Four Star Oil & Gas
Company (“Four Star”). El Paso’s Supplemental Oil and Gas disclosures, which are included in its Annual Report on Form 10-K, reflect its proportionate
share of the proved reserves of Four Star separate from its consolidated proved reserves. In addition, the proved reserves attributable to its proportionate
share of Four Star represent estimates prepared by El Paso and not those of Four Star.
Cautionary Note to U.S. Investors—The United States Securities and Exchange Commission permits oil and gas companies, in their filings with the SEC, to
disclose only proved reserves that a company has demonstrated by actual production or conclusive formation tests to be economically and legally
producible under existing economic and operating conditions. We use certain terms in this presentation that the SEC's guidelines strictly prohibit us from
including in filings with the SEC. U.S. Investors are urged to consider closely the disclosures regarding proved reserves in this presentation and the
disclosures contained in our Form 10-K for the year ended December 31, 2007, File No. 001-14365, available by writing; Investor Relations, El Paso
Corporation, 1001 Louisiana St., Houston, TX 77002. You can also obtain this form from the SEC by calling 1-800-SEC-0330.
Non-GAAP Financial Measures
This presentation includes certain Non-GAAP financial measures as defined in the SEC’s Regulation G. More information on these Non-GAAP financial
measures, including EBIT, EBITDA, and the required reconciliations under Regulation G, are set forth in this presentation or in the appendix hereto. El
Paso defines Resource Potential or Resource Inventory as subsurface volumes of oil and natural gas the company believes may be present and eventually
recoverable. The company utilizes a net, geologic risk mean to represent this estimated ultimate recoverable amount.
2
3. Our Purpose
El Paso Corporation provides
natural gas and related energy
products in a safe, efficient, and
dependable manner
3
4. Our Vision & Values
the place to work
the neighbor to have
the company to own
4
5. Meeting Challenges,
Preserving Opportunities
Today Longer-Term
Raised liquidity to Delivering pipeline
$3.3 billion backlog
On-time, on-budget
Reduced capital
thoughtfully Preserving E&P
inventory
Reviewing capital
and financing options Improving credit metrics
continuously
Manage to commodity
price environment
Attractive hedges
5
6. 2009 Financial Targets
$ Billions, Except EPS
EPS*: $0.85–$1.05
EBIT* total: $2.0–$2.3
Pipelines: $1.4; E&P: $0.8–$0.9
EBITDA*: $3.1–$3.3
Pipelines: $1.8; E&P: $1.4–$1.6
Cash flow from operations: $1.7–$2.0
Capex: $2.7–$3.1
Pipelines: $1.7; E&P: $0.9–$1.3
Note: 2009 Plan assumes natural gas price of $5.00 per MMBtu (NYMEX) and oil prices of $40.00 per Bbl (WTI)
6
*Excludes MTM changes on hedge derivatives and includes cash proceeds on settlements based on Plan prices
8. Liquidity Outlook
$ Billions
$0.2
$0.9
$1.9
$0.2
$2.7–
$1.1 $3.1
$2.2 $1.2–
$1.6
E&P Capex
12/31/08 YTD Net OCF Remaining May Dividends Capex YE
Financings Asset Maturity & Minority Liquidity
& Asset Sales Interest
Sales
Ample liquidity for 2009
Note: Forecast assumes most of $500 MM LC facility replaced and EPEP $300 MM facility renewed 8
9. Premier Pipeline Franchise
Tennessee
Wyoming Gas Pipeline
Colorado
Interstate
Interstate Gas
Cheyenne
Mojave
Plains Pipeline
Pipeline
Southern
Natural Gas
Elba Island
El Paso
LNG
Natural Gas
Mexico
Gulf LNG Florida Gas
Ventures
Transmission (50%)
(50%)
19% of total U.S. interstate pipeline mileage
26 Bcf/d capacity (15% of total U.S.)
19 Bcf/d throughput (30% of gas delivered to U.S. consumers)
Source: El Paso Corporation 2008 data
Note: Includes El Paso Corporation and El Paso Pipeline Partners, L.P. 9
10. Committed Growth Backlog:
Large & Profitable
~$8 billion capex; construct at 7x run rate EBITDA
Ruby Pipeline
$3 Billion TGP Concord
TGP 300 Line Project
2011 $21 MM
$750 MM
1.3–1.5 Bcf/d Nov 2009
2011 30 MMcf/d
290 MMcf/d
WIC System Expansion
$71 MM
2010–2011 Elba Expansion III & Elba
320 MMcf/d Express
CIG Totem Storage
$1.1 Billion
$154 MM (100%)
2010–2014
WIC Piceance Lateral July 2009
8.4 Bcf / 0.9 Bcf/d & 1.2 Bcf/d
$62 MM 200 MMcf/d
4Q 2009
220 MMcf/d
SNG Cypress Phase III
$86 MM
2011
CIG Raton 2010
160 MMcf/d
Expansion
$146 MM
2Q 2010
SNG South System III/
TGP Carthage
130 MMcf/d
SESH Phase II
Expansion
$352 MM / $69 MM
$39 MM
2011–2012
May 2009
Gulf LNG 370 MMcf/d / 350 MMcf/d
100 MMcf/d
$1+ Billion (100%)
2011
El Paso Pipeline Partners, LP FGT Phase VIII
6.6 Bcf / 1.3 Bcf/d
Expansion
$2.4 Billion (100%)
El Paso Pipeline 2011
800 MMcf/d
Note: As of February 26, 2009; El Paso Pipeline Partners owns 25% of SNG & 40% of CIG 10
11. Financing the Pipeline Backlog
$ Billions
$1.3
$7.8
$1.0
$1.3
$2.4
$1.8
Gulf LNG/
Backlog Spent to Date 2009 Funded Remaining 2010-2013
Expected FGT Capital Ruby Remaining
Financing Backlog
Backlog expected to generate
$1.2 billion of incremental EBITDA*
*EBITDA run-rate on proportional basis 11
12. Construction Risk Management
El Paso Capital
($ Billions) Steel Construction
Elba Expansion Fixed-Price EPC Contract
$ 1.1
Elba Express Fixed Unit-Priced
Gulf LNG (50%) Fixed-Price EPC Contract
$ 0.5
Ruby Fixed Incentive-Based
$ 3.0
FGT Phase VIII (50%) Fixed Unit-Priced
$ 1.2
TGP 300 Line Fixed Negotiating
$ 0.8
Backlog has been significantly de-risked
12
13. Pipeline Outlook
Stability from demand-based revenues
Highly focused on execution of project backlog
Significant risk mitigation in place
Committed to grow El Paso Pipeline Partners
$3.0 B NOL offsets potential gains on drop downs
Selectively review future opportunities
Mitigate potential financing and steel costs
13
14. Top 10 Domestic Independent
Nile
Delta
Brazil
Egypt
Rio de
Janeiro
Brazil Egypt
2 significant development Onshore conventional
projects exploration
Additional exploration 1.05 MM net acres
potential First drilling January 09
Domestic
Low to medium-risk repeatable
plays
98% drilling success rate
Growing unconventional inventory
Note: Based on 2008 data except Egypt acres include January 2009 transaction with RWE 14
15. Exploration & Production
Significant progress in 2008
595 Bcfe of reserves adds in 20081
195% domestic reserve replacement ratio2
27% inventory growth in 2008
$0.9 B–$1.3 B capital for 2009
Focused on: value creation, inventory preservation,
low-risk programs
Highly flexible capital plan
725–815 MMcfe/d production3
1Prior to revisions; does not include Four Star
2Prior to price-related revisions; does not include Four Star
3 Includes Four Star
15
16. Improving Domestic Reserve Metrics
Reserve Replacement Costs Reserve Replacement Ratio
(RRC, $/Mcfe) (RRR)
255%
$3.26
$3.92
195%
$3.22
$2.87 129%
109%
2006 2007 2008 2006 2007 2008
Reflects acquisitions
Note: 2008 RRC and RRR do not include price revisions. Prior years RRC and RRR include proved reserves
additions, acquisitions, price, and performance revisions. Results do not include Four Star 16
17. 2009 Capital Program
Focused on Lower-Risk Programs
$0.9 billion–$1.3 billion
Capital Spending ($ MM)
capital program
Flexible capital program $1,742
focusing on value creation
$1,300
Increased focus on low-risk
programs with significant
inventory and repeatability
Haynesville
Cotton Valley Horizontal
Altamont Oil
2008 2009
Black Warrior CBM
International completing Central Western TGC
development of Camarupim GOM Intl Acq.
17
18. Preserving Significant Resource
Inventory*
Additional shale gas potential (Raton, Haynesville)
Upside
International exploration success
Potential
3.5 Tcfe 6.6 Tcfe unrisked non-proved resources
Risked
2.8 Tcfe risked unconventional and low risk
Unproved
Infill drilling (Raton CBM, Altamont oil)
Inventory
Heavily weighted to U.S. Onshore (75%)
2.5 Tcfe
Proved 645 Bcfe Proved Undeveloped Reserves
Reserves R/P of 8.6
* As of 12/31/08 and includes interest in Four Star 18
19. Improving Results in Arklatex Program
Haynesville Shale
(currently producing 27 MMcfe/d
as of February 21, 2009)
120 4,000
4 Wells Producing IP (MMcfe/d)
3,500
Spud to First Sales (Days)
100
Miller Land Co 10H #1 4.5 3,000
80
Travis Lynch GU #4-H 8.0
$/Lateral Ft.
2,500
RF Gamble 24H #1 14.6 60 2,000
Blake 10H #1 20.3 1,500
40
1,000
20
2009 Activity 500
Spud in March: Hamilton 12H #1 and 0 0
Miller Travis R.F. Blake
Annette Green 22H #1 Land Co. Lynch Gamble 10H #1
10H #1 GU #4-H 24H #1
J R Gamble will TD in March with
first sales in April Drilling Completion $/Lateral Ft.
2–4 rigs running during 2009
19
20. Arklatex
Production
AK (MMcfe/d)
200
Vacherie Dome/
150
Bear Creek
100
TX
Minden/SE 151
147
126
Brachfield 50
LA
0
Holly/Bethany 2006 2007 2008
Longstreet/Logansport
Program Statistics: Value Upside:
1,170 operating wells
Cotton Valley Horizontal
75% avg. WI
Haynesville
10 years R/P
Infill drilling
342 PUD locations
180 Bcfe PUD reserves
561 non-proven locations
989 Bcfe unrisked non-proven resource potential
579 Bcfe risked non-proven resource potential
20
Note: Production volumes have been adjusted for divestitures and for the effects of hurricanes
21. Raton Basin
CO Production
(MMcfe/d)
80
60
Vermejo Park Ranch 40
76
75
76
20
0
NM
2006 2007 2008
Program Statistics: Value Upside:
944 operating wells Niobrara potential
100% avg. WI 606 M net fee and mineral acres
20.5 years R/P
297 PUD locations
211 Bcfe PUD reserves
612 non-proven locations
184 Bcfe unrisked non-proven resource potential
151 Bcfe risked non-proven resource potential
21
22. Brazil to Become a
Meaningful Contributor
Pinaúna (100%)
Environmental permitting has
slowed pace
15–20 MBOE/d peak production
Brazil
Copaiba Well (18%)
Drilled, tested and currently evaluating
Rio de
Janeiro
Camarupim (24%)
50–60 MMcfe/d peak rate
Tot Well (35%)
First production 2Q 2009
Drilled and
currently
evaluating
22
23. E&P Outlook
2009 capital program focused on
low-risk, value-adding programs
Plan is highly flexible
Capital pace slowed while seeking to
capture lower service costs
Preserving inventory while advancing
key programs
23
24. 2009 Hedge Positions
Full-Year 2009
151 TBtu
Ceiling Average cap $14.97/MMBtu
8 TBtu
143 TBtu
168 TBtu
2009 Gas $7.33
$15.41
$9.10
fixed price
ceiling
floor
Balance at
176 TBtu
Market Price
Average floor $9.02/MMBtu
Floor
1.5 MMBbls
2009 Oil1 $45.00
fixed price
~75% of domestic natural gas2; gas hedges valued at $730 MM as of 12/31/08
$110/Bbl oil swaps monetized for $186 MM
Note: See full Production-related Derivative Schedule in Appendix
1Reflects positions after monetization of oil swaps
2Includes proportionate share of Four Star equity volumes
24
25. 2010 Hedge Positions
Positions as of March 3, 2009
45 TBtu
Ceiling Average cap $7.88/MMBtu
41.7 TBtu 19.8 TBtu 24.7 TBtu Balance at
2010 Gas $7.00 $9.45 $6.61 Market Price
floor ceiling fixed price
Floor 66 TBtu
Average floor $6.86/MMBtu
25
Note: See full Production-related Derivative Schedule in Appendix
26. Focus Going Forward
Execute on committed pipeline backlog
On time/budget
Majority of capital risk has been mitigated
Create value at E&P
Flexible capital expenditures
Preserve inventory of opportunities
Be prepared for low-price scenario in
2010 and 2011
26
27. El Paso Corporation
Doug Foshee
President & Chief Executive Officer
Howard Weil Energy Conference
March 24, 2009
29. Disclosure of Non-GAAP
Financial Measures
The SEC’s Regulation G applies to any public disclosure or release of material information that includes a non-
GAAP financial measure. In the event of such a disclosure or release, Regulation G requires (i) the presentation of
the most directly comparable financial measure calculated and presented in accordance with GAAP and (ii) a
reconciliation of the differences between the non-GAAP financial measure presented and the most directly
comparable financial measure calculated and presented in accordance with GAAP. The required presentations and
reconciliations are attached. Additional detail regarding non-GAAP financial measures can be reviewed in El Paso’s
full operating statistics, which will be posted at www.elpaso.com in the Investors section.
El Paso uses the non-GAAP financial measure “earnings before interest expense and income taxes” or “EBIT” to
assess the operating results and effectiveness of the company and its business segments. The company defines
EBIT as net income (loss) adjusted for (i) items that do not impact its income (loss) from continuing operations,
such as extraordinary items and discontinued operations; (ii) income taxes; and (iii) interest and debt expense. The
company excludes interest and debt expense so that investors may evaluate the company’s operating results
without regard to its financing methods or capital structure. EBITDA is defined as EBIT excluding depreciation,
depletion and amortization. El Paso’s business operations consist of both consolidated businesses as well as
investments in unconsolidated affiliates. As a result, the company believes that EBIT, which includes the results of
both these consolidated and unconsolidated operations, is useful to its investors because it allows them to
evaluate more effectively the performance of all of El Paso’s businesses and investments.
El Paso believes that the non-GAAP financial measures described above are also useful to investors because these
measurements are used by many companies in the industry as a measurement of operating and financial
performance and are commonly employed by financial analysts and others to evaluate the operating and financial
performance of the company and its business segments and to compare the operating and financial performance
of the company and its business segments with the performance of other companies within the industry.
These non-GAAP financial measures may not be comparable to similarly titled measurements used by other
companies and should not be used as a substitute for net income, earnings per share or other GAAP operating
measurements.
29
32. Committed Projects In-Service Timeline
$ Billions 2009 2010 2011 & Beyond
WIC Piceance Elba III Phase A Ruby
TGP Carthage Elba Express WIC System Expansion
TGP Concord CIG Raton 2010 TGP 300 Line Project
CIG Totem (50%) FGT Phase VIII (50%)
Gulf LNG (50%)
Elba III Phase B
SNG South System III
SNG SESH Phase II
Cypress III
Net project cost $0.2 $1.1 $6.5
Note: $ in each column represents total costs for each project, shown in year placed in service (actual spend over
multiple years). WIC is owned by El Paso Pipeline Partners 32
33. YE 2008 Reserves
Bcfe
582 Approx.
3.0 Tcfe at
$7/$70
299
2851
5602
3,109 2,547
YE 2007 Extensions & Production Purchases & Revisions YE 2008
Discoveries Sales
Commodity Prices Henry Hub WTI
YE07 $6.80/MMbtu $95.98/Bbl
YE08 $5.71/MMbtu $44.60/Bbl
Note: Includes proportionate share of Four Star equity volumes
1Includes (303) Bcfe of sales and 18 Bcfe of acquisitions
33
2Includes (490) Bcfe of price-related revisions and (70) Bcfe of performance-related revisions
36. Non-GAAP Reconciliation
2009 EBIT & EBITDA
$ Billions, Except EPS
EBITDA 3.1–3.3
Less: DD&A 1.0-1.1
EBIT 2.0–2.3
Less: Interest 1.0
Less: Taxes 0.4 – 0.5
Net Income 0.6–0.8
EPS $0.85–$1.05
Note: Numbers may not foot due to rounding 36
37. Altamont
Production
WY
(MMcfe/d)
UT
40
30
Altamont-Bluebell 20
32
26
23
10
0
2006 2007 2008
Program Statistics: Value Upside:
323 operating wells Workovers and recompletions
87% avg. WI Secondary recovery
4.7 years R/P
0 PUD locations
0 Bcfe PUD reserves (due to price)
318 non-proven locations
473 Bcfe unrisked non-proven resource potential
430 Bcfe risked non-proven resource potential
37
38. Black Warrior Basin (Unconventional)
Production
Short Creek
(MMcfe/d)
70
60
White Oak Creek 50
Jefferson
40
30 59
64 62
AL 20
10
0
Blue Creek West
2006 2007 2008
Tuscaloosa
Program Statistics: Value Upside:
1,066 operating wells Lateral extension
87% avg. WI Infill potential
15.5 R/P
178 PUD locations
54 Bcfe PUD reserves
342 non-proved locations
57 Bcfe unrisked resource potential
57 Bcfe risked resource potential
38
39. Texas Gulf Coast
Upper Gulf
Coast
Production
Wilcox
(MMcfe/d)
250
200
Yegua &
ST Wilcox
Hackberry 217
150
196
100
180
50
Vicksburg Frio
0
2006 2007 2008
Program Statistics: Value Upside:
1,216 operating wells Ongoing field studies / reviews
76% avg. WI Proprietary 3-D seismic coverage
5.0 R/P Low capital efficiencies ($ per Mcfe/d)
High rate of return
90 PUD locations
77 Bcfe PUD reserves
285 non-proved locations
1,343 Bcfe unrisked non-proven resource potential
463 Bcfe risked non-proven resource potential
39
Note: Production volumes have been adjusted for divestitures and for the effects of hurricanes
40. Gulf of Mexico / SLA
Program Statistics:
109 operating wells
68% avg. WI
3.3 R/P
Production
0 PUD locations
Production
0 Bcfe PUD reserves (due to price)
(MMcfe/d)
(MMcfe/d)
150
92 non-proved locations
937 Bcfe unrisked resource potential 100
431 Bcfe risked resource potential
135
111 125
50
Value Upside:
Exploration success 0
Ongoing studies
2006 2007 2008
Proprietary internal seismic reprocessing
40
Note: Production volumes have been adjusted for divestitures and for the effects of hurricanes
41. Reconciliation of
Pro Forma Production Volumes—YTD
Equivalents (MMcfe/d)
2006 2007 2008
Less: Less: Less:
Domestic Domestic Domestic Add:
Add: Assets Pro Add: Assets Pro Add: Assets Hurricane Pro
Reported Peoples Sold Forma* Reported Peoples Sold Forma* Reported Peoples Sold Impact Forma*
Central 214 15 15 214 227 22 14 235 238 – 2 – 236
Western 132 11 6 137 147 6 5 148 154 – – – 154
TGC 187 40 47 180 213 23 40 196 225 – 10 2 217
GOM/SLA 174 2 65 111 191 1 57 135 114 – 12 23 125
International 24 – – 24 14 – – 14 11 – – – 11
Total Consolidated 731 68 133 666 792 52 116 728 742 – 24 25 743
Proportionate share of Four Star 67 – – 67 70 – – 70 74 – – – 74
Total with Four Star 798 68 133 733 862 52 116 798 816 – 24 25 817
41
*Excludes volumes from domestic assets sold in 2008 and adjusts volumes for the effects of the hurricanes in 2008 and assumes full year of Peoples volumes in 2007
42. Reconciliation of Onshore Central Division
Pro Forma Production Volumes—YTD
Equivalents (MMcfe/d)
2006 2007 2008
Less: Less: Less:
Domestic Domestic Domestic Add:
Add: Assets Pro Add: Assets Pro Add: Assets Hurricane Pro
Reported Peoples Sold Forma* Reported Peoples Sold Forma* Reported Peoples Sold Impact Forma*
Arklatex 122 13 9 126 135 20 8 147 152 – 1 – 151
Black Warrior 64 – – 64 62 – – 62 59 – – – 59
Mid Continent 28 2 6 24 30 2 6 26 27 – 1 – 26
Total 214 15 15 214 227 22 14 235 238 – 2 – 236
*Excludes volumes from domestic assets sold in 2008 and adjusts volumes for the effects of the hurricanes in 2008 and assumes full year of Peoples volumes in 2007
42