Effect of particle size of selected composite spices on storability of fried meat

This document summarizes a study that investigated the effect of particle size of selected composite spices on the storability of fried meat. Beef strips were marinated with spices (garlic, onion, ginger) of different particle sizes (250, 300, 500 μm) and deep fried. The untreated and treated samples were stored under ambient, refrigeration, and freezing temperatures. Results showed that spice particle size significantly affected the protein, fat, ash, moisture, and carbohydrate content of the meat during storage. Samples marinated with 250 μm spices had the lowest microbial growth and oxidative rancidity. The study concluded that smaller particle sizes of combined spices have a synergistic effect in inhibiting microbial growth and oxidation, thereby improving the storage stability of

Recommended
Recommended
More Related Content
What's hot
What's hot (13)
Similar to Effect of particle size of selected composite spices on storability of fried meat
Similar to Effect of particle size of selected composite spices on storability of fried meat (20)
More from fstdesk.com
More from fstdesk.com (11)
Recently uploaded
Recently uploaded (20)
Effect of particle size of selected composite spices on storability of fried meat
- 1. Vol. 13(1) pp. 1-9, January 2019 DOI: 10.5897/AJFS2018.1756 Article Number: 92DB93359777 ISSN: 1996-0794 Copyright ©2019 Author(s) retain the copyright of this article http://www.academicjournals.org/AJFS African Journal of Food Science Full Length Research Paper Effect of particle size of selected composite spices on storability of fried meat Musa Omotayo Jimoh* , Taiwo Olufemi Olurin and Oluwatosin Omolara Salako Department of Chemical and Food Sciences, College of Natural and Applied Sciences, Bells University of Technology, Ota, Nigeria. Received 17 September, 2018; Accepted 13 November, 2018 Meat is a good source of many nutrients and protein in the human diet. In this study, strips of marinated beef were deep fried in oil, packaged and stored under three storage conditions. The study was carried out to determine the proximate composition, oxidative and microbial stability of meat sample marinated with spices of different particle sizes (250, 300 and 500 μm). The untreated sample was compared with marinated samples and stored under ambient, refrigeration and freezing temperatures. The results showed that spice particle size affected protein, fat and ash content of the meat during storage at p<0.01 while the effect on moisture content and carbohydrate was at p<0.001. Samples marinated with 250 μm had the lowest microbial growth (6.0 × 10 4 ) and lowest oxidative rancidity value (0.40). Combined spices give a synergistic effect which is more potent in the inhibition of microbial growth and oxidative rancidity. Key words: Particle size, storage, meat, proximate, microbial, oxidation. INTRODUCTION Meat is one of man’s most important sources of high quality protein, vitamins, minerals and other nutrients (Heinz and Hautzinger, 2007). The basic composition of meat varies between types and cut. This has direct influence on the quality attributes of the final product after processing. Owing to the spoilage potential of meat, many preservation techniques are being employed in improving its keeping quality and shelf life. Meat is often processed using a range of traditional methods such as salting, drying, cooking, smoking, marinating, or combination of these operations (Collignan et al., 2001). Spices such as ginger, garlic, pepper, turmeric, cinnamon, cloves, pimento, rosemary are seed, root, fruit, bark, berry, bud or vegetable substances primarily used for flavouring, colouring or preserving food (Feng and Liu, 2011). Apart from these attributes, studies have also shown that they have some medicinal attributes (P’erez- D’iaz and Mcfeeters, 2010). Many spices have been reported to have natural antimicrobial and anti-oxidation attributes and these account for the reason why they are used for the preservation of meat which is particularly susceptible to spoilage (Fenwick and Hanley, 2011). The use of natural spices as a preservative in meat has proved to be a better and safer alternative to the use of chemicals such as nitrites (Santas et al., 2010). Globally, plant extracts are employed for their antimicrobial, *Corresponding author. E-mail: omotayojimoh50@yahoo.com. Author(s) agree that this article remain permanently open access under the terms of the Creative Commons Attribution License 4.0 International License
- 2. 2 Afr. J. Food Sci. antifungal and antiviral properties (Mahesh and Satish, 2008). It is known that more than 400,000 species of tropical flowering plants have medicinal properties and this has made traditional medicine cheaper than modern medicine (P’erez-D’iaz and Mcfeeters, 2010). Frying is one of the oldest and common cooking methods used in preparing food with favourable sensory properties including a typical flavour, oil, colour and texture (Gazmuri and Bouchon, 2009). Through frying, food is cooked more quickly and has a crispness characteristic (Ogunmoyela et al., 2016). There are different frying techniques: stir frying, deep frying, shallow frying, pan frying with varied conditions such as the amount and type of fat required, cooking time, type of cooking vessel required and the manipulation of the food. Out of these techniques, the most widely used and efficient method in terms of speed of cooking, taste of food and texture of food is deep frying (Savage et al., 2002). Deep-fat frying is a method used to produce dried food where an edible fat heated above the boiling of water serves as the heat transfer medium. Fat also migrates into the food providing nutrients and flavour (Tarmizi and Niranjan, 2011). However, surface darkening and many adverse reactions take place during deep-fat frying because of high temperature (Joshi et al., 2016). When the oil is heated, it enables heat transfer due to conduction and convection, the latter being caused by free water boiling at the surface upon immersion of the moist food in hot oil (Seruga and Budzaki, 2005). The moisture vaporizes out, and creates a path known as capillary pore, through which hot oil enters the food (Mellema, 2003). The reaction occurs by the influence of oil uptake, crust formation, shrinkage and swelling, thus inducing macro- and micro-structural changes (Taylor, 2013). This influences the vapour and liquid diffusion, safety assurance, and yields final products with the taste and textural characteristics expected by the consumer. Therefore, frying is one of the methods of processing foods; it impacts flavour, taste, colour and crispness in fried foods. In spite of the increase in the demand for fried foods by consumers all over the world, the danger posed by consuming too much fat is still a challenge (Oladejo et al., 2017). Curing is any of the food preservation and flavouring processes such as meat, fish, and vegetables, by adding a combination of salt, nitrates, nitrites or sugar (Boyle and Levin, 2008). However, the use of nitrites in food has been controversial and this is due to the potential to produce nitrosamines when nitrates are present in high concentrations and the product is cooked at high temperature (Karl-Otto, 2008). When nitrites are used in meat, it breaks down in the meat into nitric oxide, which then binds to the iron atom in the centre of myoglobin’s heme group, reducing oxidation and producing a reddish brown colour (Kleinbongard et al., 2006). In foods, nitrosamines are produced from nitrites and secondary amines, which usually occur when amino acids are subjected to heat as a result of cooking or under strong acidic condition such as that of the human stomach (Schurgers and Vermeer, 2000). Under high temperature or acidic condition, the nitrite forms nitrous acid (HNO2), which is protonated and splits into the nitrosonium cation and water. The nitrosonium cation then reacts with an amine to produce nitrosamine (Krasner et al., 2013). These processes lead to the production of significant levels of nitrosamines in many foodstuffs such as meat (Ferlay et al., 2008). The U.S government established limit on the amount of nitrites used in meat products so as to reduce the risk of having cancer in the country (Karl-Otto, 2008). Consumers are very conscious of what they eat due to the carcinogenic effects of most processed foods (USFDA, 2011). In view of this, demand for naturally processed foods or foods processed with little or no chemical preservatives or additives is constantly increasing. This study was carried out to investigate proximate composition, antimicrobial and antioxidant effect of onion, garlic and ginger at different particle sizes on fried meat stored under refrigeration, freezing and ambient temperatures. MATERIALS AND METHODS The meat, salt and spices which were used were purchased from an open market in Ota, Ogun State, Nigeria. Other materials, equipment and utensils were obtained from the Food Technology and Nutrition laboratory of Bells University of Technology, Ota, Ogun State, Nigeria. Meat preparation A deboned lean cow meat extracted from the proximal segment of the vertebrate hind was used for this experiment. The meat was trimmed free of fat and excess connective tissue and washed with water. The chunk of the meat was cut into smaller portions of about 150-200 g. Slicing was done along the fibre axis of each portion giving very thin slices of about 2 mm thickness in continuous sheets. The pieces of sliced meat were then marinated in a plastic bowl covered with a polyethylene film for 24 to 48 h in a refrigerator and then fried (Fenwick and Hanley, 2011). A control experiment was carried out following the same method except that the meats were not marinated. The fried meats were stored in an air tight polyethylene bag separately for analysis. Spice preparation The fresh onion, garlic and ginger were obtained, sorted and cleaned by removing the peel. They were cut into smaller pieces, dried in an electric oven at a temperature of 50°C for 24 for 48 h to a moisture content of 5- 6%. After the drying process, the spices were pulverized with the aid of an electric blender for few minutes to prevent loss of flavor; they were sieved to 250, 300 and 500 μm particle sizes and then packaged into air tight plastic containers and stored (Oyas et al., 2013). Preparation of marinated fried meat The ingredients were weighed into stainless steel bowls and mixed
- 3. Jimoh et al. 3 Table 1. Composition of ingredients used for slurry. Ingredient Weight (g) Blend (g) Garlic 10 50Onion 50 Ginger 40 Salt 10 Water 500 thoroughly with the aid of a spoon as shown in Table 1. The meat pieces were soaked in the marinade (slurry) inside a bowl and covered with polyethylene film. The bowl was placed in a refrigerator for 24 h so as to facilitate the absorption of the spices into the meat. The meat was parboiled, fried, packaged and stored for analysis. This process was done for 250, 300 and 500 µm spice particle sizes. The meat samples were produced from different particle size composition of the spices and the samples were stored for 5 weeks under three different storage conditions; freezing, refrigerating and ambient temperature. Experimental analysis The analyses that were carried out on the meat include proximate, microbial profile and oxidative stability. Proximate analysis Standard methods of AOAC (2005) were used to determine the crude protein, total ash, crude fat and moisture contents of the samples. The total carbohydrate content was calculated by difference in protein, fat, ash and moisture from 100 (Ajatta et al., 2016). Microbial examination Total plate count was carried out on the raw and processed meat samples using the method described by Odom et al. (2012). 10 g of the sample was weighed out and homogenized in sterile distilled water. Five folds dilutions of the homogenate were made using sterile McCartney bottles and 1 ml of 10-4 and 10-5 dilutions of the homogenate were placed on Nutrient Agar media using the pour plate method. The media was left to solidify after which the plates were incubated at 37°C for 24 to 48 h. After incubation, the colony forming units were counted with the aid of a colony counter. The same process was repeated and 0.5 ml of 10-4 and 10-5 dilutions of the homogenate were placed on Sabouraud dextrose agar to test for mold growth on the meat samples. Oxidative stability The oxidative stability analyses carried out on the meat samples are thiobarbituric acid reactive substance (TBARS) determination and free fatty acid (FFA) determination. Thiobarbituric acid analysis was carried out according to Eke et al. (2012). Ten grams of the macerated sample was mixed with 50 ml of distilled water. The mixture was transferred into a distillation flask where 2.5 ml of 4 M HCL acid was added before it was distilled at a rate so that 50 ml of the distillate was collected in 10 min. Five ml of the distillate was pipette into a glass tube and 5 ml of TBA reagent was added and it was properly mixed before it was heated in a water bath for 35 min. A blank sample was similarly prepared using 5 ml of distilled water for 35 min. The sample and the blank tube were cooled and the absorbance of the sample was measured against the blank using a spectrophotometer (Pye Unicam SP9, Cambridge, UK) at 538 nm. TBA Value (as mg malonaldehyde per kg sample) = 7.8 × A Where, A = Absorbance of sample versus blank Free fatty acid (FFA) determination: Two grams of the sample was weighed into a conical flask; 25 ml of diethyl ether and alcohol was added and it was properly mixed. One ml of phenolphthalein indicator was added and it was neutralized with 0.1 M NaOH. Then the mixture was titrated against 0.1 M NaOH until a pink colour which persisted for 3-5 min was observed. Acid value = FFA = Statistical analysis The data reported in all the tables are the means of triplicate observations at least (n ≥ 3). Spice particle sizes (250, 300 and 500 μm) and control experiment were considered as attribute while storage conditions were considered as treatment. Degree of influence of treatment on attribute was determined by analysis of variance (ANOVA) using SAS version 8e software (SAS Institute Inc., Cary, NC, USA) at p < 0.05. Means were separated using Duncan’s Multiple Range Test. RESULTS AND DISCUSSION Proximate composition of meat and spices The proximate composition of onion powder revealed 5.78% moisture, 13.2% protein, 0.22% fat, 3.10% ash and 77.73% carbohydrate content as presented in Table 2. There is slight difference compared to composition of onion reported by (Santas et al., 2010); 11.53% protein, 0.97% fat and 78.36% carbohydrate content. This could be as a result of different variety of fresh onion used and environmental factor. In ginger and garlic; 5.18% moisture, 10.54% protein, 0.13% fat, 4.05% ash and
- 4. 4 Afr. J. Food Sci. Table 2. Proximate composition of spices used for marinade. Parameter Onion powder Ginger powder Garlic powder Moisture (%) Protein (%) Fat (%) Ash (%) CHO (%) 5.78 ± 0.04 13.2 ±0.01 0.22 ±0.02 3.10 ±0.05 77.73 ±0.12 5.18 ±0.10 10.54 ± 0.02 0.13 ± 0.01 4.05 ± 0.08 89.11 ± 0.21 6.43 ± 0.04 36.34 ± 0.08 0.73 ± 0.03 0.59 ± 0.01 55.91 ±0.20 Mean ± Standard deviation of samples (n=3). Table 3. Proximate composition of raw meat and fried treated meat at zero time. Parameter Moisture (%) Protein (%) Fat (%) Ash (%) CHO (%) Raw meat 76.00 ± 0.00 20.80± 0.05 2.54 ± 0.04 0.61 ± 0.10 0.35 ± 0.01 A 20.63 ± 0.01 50.58 ± 0.01 25.56 ± 0.03 3.08 ± 0.04 0.15 ± 0.10 B 20.48 ± 0.02 50.30 ± 0.10 24.78 ± 0.01 3.04 ± 0.03 1.42 ± 0.20 C 17.57 ± 0.04 49.75 ± 0.02 22.95 ± 0.02 2.88 ± 0.04 6.54 ± 0.40 D 14.47 ± 0.01 48.14 ± 0.01 20.21 ± 0.03 1.64 ± 0.02 15.59 ± 0.01 Mean ± standard deviation of samples (n=3). A. Meat sample + 250 µm particle size; B- Meat sample + 300 µm particle size; C, Meat sample + 500 µm particle size; D, Control. 89.11% carbohydrate; and 6.43% moisture, 36.34% protein, 0.73% fat, 0.59% ash and 55.91% carbohydrate respectively were determined. These are not compatible with the result reported by Suhaj (2006); where 6.37% moisture, 8.58% protein, 5.35% crude fat, 6.30% ash and 68.15% carbohydrate for ginger while in garlic powder; 4.55% moisture, 15.53% protein, 0.72% fat, 4.08% ash and 73.22% carbohydrate were reported. The low moisture content of all the spices could be as a result of dehydration during drying process. Thus, the shelf life of these spices may be extended and microbial deterioration may be limited. The high crude protein content of garlic could be as a result of the presence of active proteinous metabolites such as allicin and ajoene (Dashak and Nwanegbo, 2000). The low ash content of garlic could be due to low organic mineral content (Oloyede, 2005). The carbohydrate contents of onion, ginger and garlic showed that they are carbohydrate rich spices. The raw meat contained 76% moisture, 20.80% protein, 2.54% fat, 0.61% ash and 0.35% carbohydrate content as shown in Table 3. This is closely related to fresh lean beef that contained 75% moisture, 22.3% protein, 1.8% fat and 1.2% ash as reported by Bakht et al. (2004). A slight difference in the composition was noticed and this could be due to the size of the meat, maturity and the proportion of lean and fat in the meat. The most important component of the muscle in terms of nutritional value and process suitability is the protein content of the meat as it defines the quality and value of the raw meat material and the finished processed meat product. Effect of spice particle size on proximate composition of marinated meat samples at zero time The proximate composition presented in Table 3 indicated that the spices increase the nutritional composition of the treated meat samples. Sample A had significantly higher moisture content (20.63%) compared to samples B (20.48%), C (17.57%) and D (14.47%). The low moisture content in sample D could be as a result of moisture diffuses from the meat surface unlike other samples with absorbed spice particles. Protein (50.58%), fat (25.56%) and ash contents (3.08%) in sample A (sample marinated with 250 µm spice particle size) were significantly higher (P < 0.05), followed by sample B (sample marinated with 300 µm spice particle size), and sample C (sample marinated with 500 µm spice particle size). This behaviour could be attributed to the fact that more spice with fine size was absorbed into the meat as a result of contact. The fat content slightly increases as spice size reduces. This is most likely because of the large amount of spice absorbed at reduced size thereby increasing the tendency of the meat to retain fat during frying. The ash content also increases at reduced spice sizes. This is not far from the fact that quantity of spice dissolved in water to form slurry would have increased. Ginger and onion have the highest ash content as reported in Table 2 and with higher composition by weight as reflected in Table 1. There was a significant difference (p < 0.05) in the carbohydrate content for all the samples. Low moisture, protein, fat and ash could be attributed to the high carbohydrate content in the control experiment.
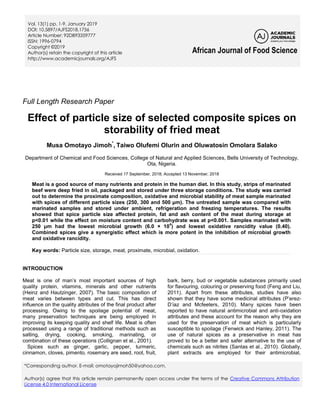
- 5. Jimoh et al. 5 Figure 1. Samples stored under refrigeration temperature (°C). Effect of spice particle size and storage condition on the proximate composition of treated meat samples The fresh meat analyzed shows 76% moisture content. After deep frying, the moisture content of the fried meat was in the range of 15.73% - 20.98%. This is similar to the result reported by Omojola et al. (2014) who recorded a moisture content of 35.57% in deep fried Muscovy drake meat. The observed difference could be as a result of nutritional composition of the treated meat and duration of frying. Aaslyng et al. (2003) revealed that during cooking, meat losses approximately 20 to 40% of its weight because of induced shrinkage which results in moisture being displaced from the meat. Storage conditions, storage periods, spice sizes and combination of storage conditions and spice sizes have significant difference (P < 0.001) on moisture content. The combination of spice sizes and storage periods have no significant difference on moisture content. There was a significant increase (P < 0.05) in the protein, fat, and ash content of the fried meat samples compared to that of the raw meat. This increase could be as a result of the additional nutrients contributed by the spices used for the experiment. The protein, fat and ash content of all the samples reduced significantly as the period advanced and a significant difference (p < 0.01) was observed between the samples marinated with the three spice particle sizes (250, 300, and 500 µm). However, storage conditions, storage periods, spice sizes and combination of storage periods and spice sizes have significant difference (P < 0.001) on fat content while combination of spice sizes and storage conditions have significant difference (P < 0.05) on the fat content. All the variables have significant difference (P < 0.001) on ash and carbohydrate. At the end of the 5 weeks storage period, the samples marinated with 250 µm and stored under freezing temperature (-18 ± 2°C) had the highest protein (50.08%), fat (23.40%), and ash (1.26%) contents while the control stored under ambient temperature (27 ± 2°C) had the least protein (47.37%), fat (17.26%) and ash (0.20%) contents. This showed that spices are good sources of nutritional supplements in diet and the preservation of the nutritional content of a food material during storage is best achieved at freezing temperature. Images of the treated meat samples are shown in Figures 1 to 3. Effect of spice particle size and storage condition on the oxidation stability of treated meat samples It was observed from the results presented in Table 4 that the FFA and the TBARS values of all the samples increased significantly (p<0.001) among the weeks. This could be attributed by the accelerated oxidative reactions in the oil due to the thermal treatment during deep frying. This is in accordance with the result obtained by Presswood (2012) who observed an increase in free fatty acid value of vacuum fried meat under storage. The natural composition of meat, such as the amounts of antioxidant such as vitamin E may also influence the rate and intensity of oxidation reactions. From the result, it was observed that the addition of spices, spice particle size and storage condition had an effect on the FFA and TBARS values of the meat samples. All marinated treatments resulted in low FFA and TBARS values at the end of the storage period compared to the control. At the end of the 5 weeks storage period, the samples marinated with 250 µm spice particle size had the lowest FFA value (ranged from 0.49 to 0.96%) and TBARS value (ranged from 0.40 to 0.88%) while the control (untreated sample) had the highest FFA value (ranged from 1.43 to 4.54%) and TBARS value (ranged from 1.36
- 6. 6 Afr. J. Food Sci. Figure 2. Samples stored under freezing temperature (°C). Figure 3. Samples stored under ambient temperature (°C). to 3.53%). This could be as a result of the smaller particle size and surface area of the spices making it easier to be absorbed into the meat being antioxidant in nature. However, storage condition as well as spice sizes together with combination of these and storage periods have significant difference (P < 0.001) on FFA and TBARS values. Effect of spices on the total viable count and fungi (yeast and mould) counts of meat samples The average total viable count from Wk 1 to Wk 5 ranged from (1.5 × 10 4 to 1.8 × 10⁵ CFU/g) as shown in Table 5 while average fungi count (yeasts and moulds) from Wk 1 to Wk 5 ranged from 1.0 × 10 4 to 1.2 × 10 5 CFU/g on the meat samples as shown in Table 6. These results are in accordance with the recommended microbial limits for cooked beef, pork and lamb meat product at 22 to 37°C (1×10 5 to 5×10 5 CFU/g) as reported by Smith (1968). The combination of onion, garlic, and ginger resulted in a pronounced decrease in the total viable bacteria and fungi counts of the marinated meat samples compared to the control. It was observed that the rate of microbial growth on the meat sample increased as the particle size of the spices increased and as the storage week progressed. At the end of the storage period, the samples marinated with 250 μm spice particle size had lesser bacteria and fungi counts, followed by 300 and 500 μm spice particle size, respectively. The control sample had the highest average bacteria (1.8 × 10 5 CFU/g) and average fungi count (1.45 × 10 5 CFU/g). There was a significant microbial growth between the samples stored under refrigeration, freezing and ambient temperature.
- 7. Jimoh et al. 7 Table 4. Analysis of variance on proximate and oxidative composition of fried treated meat samples. Source DF Anova SS Mean Square F Value P Value MC Attribute (1) 3 760.72 253.57 2730.51 *** Treatment (2) 2 40.09 20.05 215.84 *** Week (3) 4 411.78 102.95 1108.53 *** 1 X 2 6 3.25 0.54 5.83 *** 1 X 3 12 1.29 0.11 1.16 NS Fat Attribute (1) 3 926.58 308.86 17110.30 *** Treatment (2) 2 2.40 1.20 66.51 *** Week (3) 4 98.63 24.66 1366.01 *** 1 X 2 6 0.27 0.04 2.46 * 1 X 3 12 1.92 0.16 8.84 *** Ash Attribute (1) 3 28.69 9.56 1686.78 *** Treatment (2) 2 3.56 1.78 313.91 *** Week (3) 4 59.41 14.85 2619.46 *** 1 X 2 6 0.24 0.04 6.96 *** 1 X 3 12 2.26 0.19 33.17 *** CHO Attribute (1) 3 5696.34 1898.78 32768.30 *** Treatment (2) 2 2.63 1.32 22.70 *** Week (3) 4 14.87 3.72 64.16 *** 1 X 2 6 3.15 0.52 9.05 *** 1 X 3 12 6.63 0.55 9.53 *** CP Attribute (1) 3 110.19 36.73 4.10 ** Treatment (2) 2 17.88 8.94 1.00 NS Week (3) 4 49.38 12.35 1.38 NS 1 X 2 6 54.57 9.09 1.02 NS 1 X 3 12 105.61 8.80 0.98 NS FFA Attribute (1) 3 20.70 6.90 91.89 *** Treatment (2) 2 12.50 6.25 83.27 *** Week (3) 4 29.14 7.28 97.02 *** 1 X 2 6 8.46 1.41 18.78 *** 1 X 3 12 10.78 0.90 11.97 *** TBA Attribute (1) 3 11.95 3.98 91.06 *** Treatment (2) 2 7.13 3.56 81.43 *** Week (3) 4 20.40 5.10 116.59 *** 1 X 2 6 3.54 0.59 13.49 *** 1 X 3 12 6.29 0.52 11.99 *** MC = Moisture content; CHO = carbohydrate; CP = protein; FFA = free fatty acid; TBA = thiobabituric acid; ***significant at P < 0.001; **significant at P < 0.01; *Significant at P < 0.05;NS = not significant.
- 8. 8 Afr. J. Food Sci. Table 5. Total bacteria count (CFU/g) of fried treated meat samples stored under refrigeration, freezing and ambient temperatures among the storage periods (35 days). WK0 WK 1 WK 2 WK 3 WK 4 WK5 A1 <10 9.7 × 10 4 9.5× 10 4 1.0 × 10 5 1.1 × 10 5 1.1 × 10 5 A2 <10 3.5 × 10 4 4.5 × 10 4 5.0 × 10 4 5.5 × 10 4 6.0 × 10 4 A3 1.0 × 10 4 1.0 × 10 5 1.1 × 10 5 1.2 × 10 5 1.2 × 10 5 1.3 × 10 5 B1 <10 5.0 × 10 4 5.7 × 10 4 1.1 × 10 5 1.2 × 10 5 1.2 × 10 5 B2 <10 1.5 × 10 4 2.5 × 10 4 8.0 × 10 4 8.5 × 10 4 9.0 × 10 4 B3 6.6 × 10 3 9.2 × 10 4 1.0 × 10 5 1.3 × 10 5 1.4 × 10 5 1.4 × 10 5 C1 <10 1.4 × 10 5 1.3 × 10 5 1.4 × 10 5 1.4 × 10 5 1.5 × 10 5 C2 <10 1.0 × 10 5 1.1× 10 5 1.1 × 10 5 1.2 × 10 5 1.2 × 10 5 C3 5.7 × 10 4 1.3 × 10 5 1.5 × 10 5 1.6 × 10 5 1.6 × 10 5 1.7 × 10 5 D1 <10 8.1 × 10 4 1.4 × 10 5 1.4 × 10 5 1.5 × 10 5 1.6 × 10 5 D2 <10 7.2 × 10 4 1.1 × 10 5 1.2 × 10 5 1.2 × 10 5 1.3 × 10 5 D3 5.2× 10 4 1.3 × 10 5 1..7 × 10 5 1.7 × 10 5 1.8 × 10 5 1.8 × 10 5 A, Samples marinated with 250 μm spice particle size; B, samples marinated with 300 μm spice particle size; C, Samples marinated with 500 μm spice particle size; D, Control sample, 1, refrigeration temperature; 2, freezing temperature; 3, ambient temperature. Table 6. Fungi count (yeasts and moulds) (CFU/g) of fried treated meat samples stored under refrigeration, freezing and ambient temperatures among the storage periods (35 days). WK0 WK 1 WK 2 WK 3 WK 4 WK5 A1 <10 3.2× 10 4 4.0× 10 4 4.5 × 10 4 5.0 × 10 4 5.5 × 10 4 A2 <10 2.0× 10 4 2.5 × 10 4 3.0 × 10 4 3.5 × 10 4 4.0 × 10 4 A3 6.6 × 10 3 9.2× 10 4 9.8 × 10 4 1.0 × 10 5 1.1 × 10 5 1.2 × 10 5 B1 <10 3.7 × 10 4 5.5 × 10 4 6.0 × 10 4 6.5 × 10 4 7.0 × 10 4 B2 <10 3.7 × 10 4 5.0 × 10 4 5.5 × 10 4 6.0 × 10 4 6.5 × 10 4 B3 2.5 × 10 4 8.2 × 10 4 1.1 × 10 5 1.1 × 10 5 1.2 × 10 5 1.2 × 10 5 C1 <10 5.8 × 10 4 6.7 × 10 4 7.2 × 10 4 7.7 × 10 4 8.3 × 10 4 C2 <10 1.0 × 10 4 5.5× 10 4 6.0 × 10 4 6.5 × 10 4 7.0 × 10 4 C3 1.0 × 10 4 1.0 × 10 5 1.1 × 10 5 1.2 × 10 5 1.2 × 10 5 1.3 × 10 5 D1 <10 7.8 × 10 4 7.8 × 10 4 8.3 × 10 4 8.8 × 10 4 9.3 × 10 4 D2 <10 5.0 × 10 4 7.2 × 10 4 1.2 × 10 5 8.2 × 10 4 8.7 × 10 4 D3 3.5 × 10 4 1.1 × 10 5 1.2 × 10 5 1.3 × 10 5 1.3 × 10 5 1.4 × 10 5 A, Samples marinated with 250 μm spice particle size; B, samples marinated with 300 μm spice particle size; C, Samples marinated with 500 μm spice particle size; D, Control sample, 1, refrigeration temperature; 2, freezing temperature; 3, ambient temperature. Samples stored under ambient temperature had the highest average bacteria (1.8 × 10 5 CFU/g) and average fungi count (1.3 × 10 5 CFU/g) while the samples stored under the freezing condition had the lowest average bacteria (6.0 × 10 4 CFU/g) and average fungi growth (4.0 × 10 4 CFU/g). This is in conformity with Kwada and Tella (2009) who investigated that at low temperature, the rate of growth of micro-organisms and subsequent spoilage are retarded. Conclusion The use of spices at different particle sizes in meat during storage had effect on the proximate composition, microbial and oxidative stability. The samples treated with 250 μm particle size had the highest protein content as well as the least FFA and TBARS over the period of five weeks. The proximate composition of the samples stored under freezing was retained better than those stored
- 9. under refrigeration and ambient temperatures. Spices have active antimicrobial potential which inhibit the growth of a wide range of micro-organisms. They also inhibit oxidative rancidity and retard the development of off flavours in food. The hurdle effect of the spices gives more potent preservation. CONFLICT OF INTERESTS The authors have not declared any conflict of interests. REFERENCES Aaslyng MD, Bejerholm C, Ertbjerg P, Bertram HC, Andersoon HJ (2003). Cooking lose and juiciness of pork in relation to raw meat quality and cooking procedure. Journal of Food Quality Preferences 14:277-288. Ajatta MA, Akinola SA, Osundahunsi OF (2016). Proximate, functional and pasting properties of composite flours made from wheat, breadfruit and cassava starch. Journal of Applied Tropical Agriculture 21(3):158-165. AOAC (2005). Official methods of analysis 18th ed. Association of Official Analytical Chemist, Gaithersburg, MD, USA. Bakht J, Shaheen S, Shafi M (2004). Antimicrobial potentials of menthelongigolia by disc diffusion method. Pak. Journal of Pharmaceutical Sciences 27(4):939-945. Boyle P, Levin B (2008). International Agency for Research on Cancer. World Cancer Report 2008; Lyon, France. Collignan A, Bohuon P, Deumier F, Poligne I (2001). Osmotic treatment of fish and meat product. Journal of Food Engineering 49: 153-162. Dashak DA, Nwanegbo VN (2000). Chemical composition of the seeds and calyx of hibiscus sabdariffa grown in Jos North L.G.C of Plateau State. African Journal of Natural Science 3(10):6-9. Eke MO, Ariahu CC, Okonkwo TM (2012). Production and quality evaluation of dambu-nama; A Nigerian dried meat product. Nigerian Food Journal 30(2):66-72. Feng X, Liu W (2011).Variation of quercetin content in different tissue of welsh onion (Allium fistulosum L.). Journal of Agricultural Research 62:5675-5679. Fenwick GR, Hanley AB (2011). The genus allium, critical reviews. Food Science and Nutrition 22(3):199-271. Ferlay J, Shin HR, Bray F, Forman D, Mathers C, Parkin DM (2008). Estimates of worldwide burden of cancer in 2008: GLOBOCAN 2008. International Journal of Cancer 127:2893-2917. Gazmuri AM, Bouchon P (2009). Analysis of wheat gluten and starch matrices during deep-fat frying. Food Chemistry 115(3):999-1005. Heinz G, Hautzinger P (2007). Meat processing technology for-small to- medium scale producers. Food and Agricultural Organization of the United Nations Regional Office for Asia and the Pacific, Bangkok pp. 3-5. Joshi A, Rudra SG, Sagar VR, Raigond P, Dutt S, Singh B (2016). Development of low fat potato chips through microwave processing. Journal of Food Science and Technology 53(8):3296-3303. Karl-Otto H (2008). The use and control of nitrate and nitrite for the processing of meat products. Meat Science 78:68-76. Kleinbongard P, Dejam A, Lauer T, Jax T, Kerber S, Gharini P, Balzer J, Zotz RB, Scharf RE, Willers R, Schechter AN, Feelisch M, Kelm M (2006). Plasma nitrite concentrations reflect the degree of endothelial dysfunction in humans. Free Radical Biology and Medicine 40(2):295-302. Jimoh et al. 9 Krasner SW, Westerhoff P, Mitch W, Skadsen J, Von Gunten U (2013). Controlling the formation of nitrosamines during water treatment. Water Quality Technology Conference and Exposition, Washington, D.C. 2013. Kwada AD, Tella IO (2009). Determination of info chemicals and the phytochemical screening; the foliage and stem bark of Sennasiamea in Yola, Adamawa State. Journal of Medical Plants 3(9):630-634. Mahesh B, Satish S (2008). Antimicrobial activity of some important medicinal plant against plant and human pathogens. World Journal of Agricultural Science 4:839-843. Mellema M (2003). Mechanism and reduction of fat uptake in deep-fat fried foods. Trends in Food Science and Technology 14:364-373. Odom TC, Udensi EA, Nwanekezi EC (2012). Microbiological qualities of hawked retted cassava fufu in Aba metropolis of Abia State. Nigerian Food Journal 30(1): 53-58. Ogunmoyela OAB, Jimoh MO, Ogabi ON (2016). Development and evaluation of a multi-heat source deep fat fryer. African Journal of Food Science and Technology 7(3):051-059. Oladejo AO, Ma H, Qu W, Zhou C, Wu B, Yang X, Onwude DI (2017). Effect of ultrasound pretreatments on the kinetics of moisture loss and oil uptake during deep fat frying of sweet potato (Ipomea batatas). Innovative Food Science and Emerging Technologies 43:7- 17. Oloyede OI (2005). Chemical profile of Unripe Pulp of Carica Papaya. Pak. Journal of Nutrition 4(6):379-381. Omojola AB, Hammed S, Attoh-Kotoku V, Wogar GSI, Iyanda OD, Aremo JO (2014). Physico chemical and organoleptic characteristics of Muscovy drake meat as influenced by cooking methods. African Journal of Food Science 8(4):184-189. Oyas AA, Sahu NP, Pal AK (2013). Antioxidant activity and antimicrobial property of some Indian spices. International Journal of Scientific and Research Publications 3(3):013-21. P'erez-D'iaz IM, Mcfeeters RF (2010). Preservation of acidified cucumbers with a natural preservative combination of fumaric acid and allylIsothiocyanate that target lactic acid bacteria and yeasts. Journal of Food Science 75(4):204-208. Presswood H (2012). Lipid stability of dehydrated beef strips stored in two packaging types. Department of Food Science, Swedish University of Agricultural Sciences. Santas J, Almajano M, Carbo R (2010). Antimicrobial and antioxidant activity of crude onion (Allium cepa L.) extracts. International Journal of Food Science and Technology 45(2):403-409. Savage G, Dutta P, Rodriguez-Estrada M (2002). Cholesterol oxides: their Nutrition, occurrence and methods to prevent their generation in foods. Asia Pacific Journal of Clinical 11(1):72-78. Schurgers LJ, Vermeer C (2000). Determination of phylloquinone and menaquinones in food, effect of food matrix on circulating vitamin K concentrations. Heamostasis 30(6):298-307. Seruga B, Budzaki S (2005). Determination of thermal conductivity and convective heat transfer coefficient during deep fat frying of krostula dough. Europe Food Research Technology 221:351-356. Smith GR (1968). Sampling for microbiological control of meat product. Food Manufacture 43:27-27. Suhaj M (2006). Spice antioxidants isolation and their antiradical activity: a review. Journal of Food Composition Analysis 19:531-537. Tarmizi AHA, Niranjan K (2011). Post-frying oil drainage from potato chips and French fries: A comparative study of atmospheric and vacuum drainage. Food and Bioprocess Technology 6(2):489-497. Taylor MJ (2013). Deep fried goodness, Workman Publishing Company, ISBN, 978-0-7611-7973. United State Food and Drug Administration (USFDA) (2011). Evaluation and definition of potentially harzardous food, chapter three; Factor that influence microbial growth. New Hampshire Avenue, Silver Spring, MD 20993.