The document discusses energy efficiency in electrical systems, focusing on aspects such as electrical load management, power factor improvement, and the components of electric power supply systems in India. It outlines energy generation methods, the significance of high-voltage transmission, and the efficiency of industrial systems, concluding that optimizing energy use can lead to significant savings. The electricity billing structure, including tariffs and demand charges, is also explained, emphasizing the importance of electricity management for cost reduction.


![Electrical Engineering 2019-2020/ Ravi Kumar Soni
67
Electrical Energy Conversion & Auditing
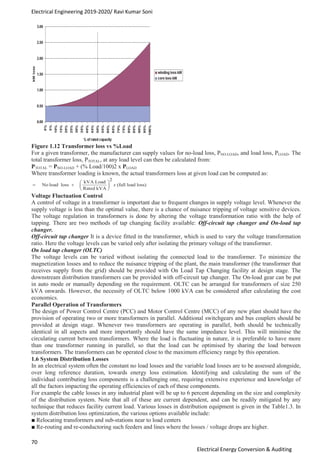
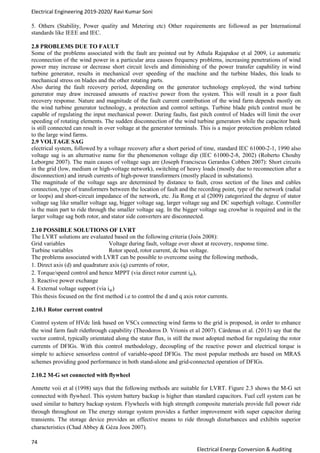
the power factor ranging from 0.2 to 0.9, the electrical distribution network is
stressed for capacity at low power factors.
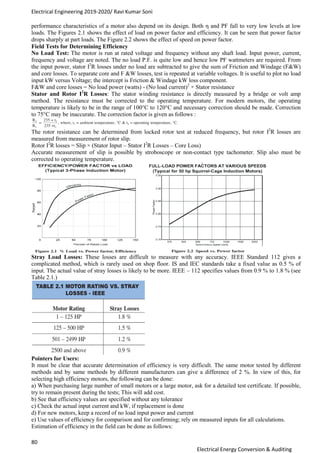
Improving Power Factor
The solution to improve the power factor is to add power factor correction
capacitors (see Figure 1.7) to the plant power distribution system. They act as
reactive power generators, and provide the needed reactive power to accomplish kW
of work. This reduces the amount of reactive power, and thus total power, generated
by the utilities.
Example:
A chemical industry had installed a 1500 kVA transformer. The initial demand of
the plant was 1160 kVA with power factor of 0.70. The % loading of transformer
was about 78% (116 ~ 0/1500 = 77.3%). To improve the power factor and to avoid
the penalty, the unit had added about 410 kVAr in motor load end. This improved the power factor to 0.89, and
reduced the required kVA to 913, which is the vector sum of kW and kVAr (see Figure 1.8).
Figure 1.8 Power factor before and after Improvement
After improvement the plant had avoided penalty and the 1500 kVA transformer now loaded only to 60% of
capacity. This will allow the addition of more load in the future to be supplied by the transformer.
The advantages of PF improvement by capacitor addition
a) Reactive component of the network is reduced and so also the total current in the system from the source end.
b) I2R power losses are reduced in the system because of reduction in current.
c) Voltage level at the load end is increased.
d) kVA loading on the source generators as also on the transformers and lines upto the capacitors reduces giving
capacity relief. A high power factor can help in utilising the full capacity of your electrical system.
Cost benefits of PF improvement
While costs of PF improvement are in terms of investment needs for capacitor addition the benefits to be
quantified for feasibility analysis are:
a) Reduced kVA (Maximum demand) charges in utility bill
b) Reduced distribution losses (KWH) within the plant network
c) Better voltage at motor terminals and improved performance of motors
d) A high power factor eliminates penalty charges imposed when operating with a low power factor
e) Investment on system facilities such as transformers, cables, switchgears etc for delivering load is reduced.
Selection and location of capacitors
Direct relation for capacitor sizing.
kVAr Rating = kW [tan φ1 – tan φ2]
where kVAr rating is the size of the capacitor needed, kW is the average power drawn, tan φ1 is the
trigonometric ratio for the present power factor, and tan φ2 is the trigonometric ratio for the desired PF.
φ1 = Existing (Cos-1 PF1) and φ2 = Improved (Cos-1 PF2)
Alternatively the Table 1.2 can be used for capacitor sizing.
The figures given in table are the multiplication factors which are to be multiplied with the input power (kW) to
give the kVAr of capacitance required to improve present power factor to a new desired power factor.
Example:
The utility bill shows an average power factor of 0.72 with an average KW of 627. How much kVAr is required
to improve the power factor to .95 ?
Using formula
Cos Φ1 = 0.72 , tan Φ1 = 0.963
Cos Φ2 = 0.95 , tan Φ2 = 0.329
kVAr required = P ( tanφ1 - tanφ2 ) = 627 (0.964 – 0.329) = 398 kVAr
Using table (see Table 1.2)
1) Locate 0.72 (original power factor) in column (1).
2) Read across desired power factor to 0.95 column. We find 0.635 multiplier](https://image.slidesharecdn.com/eecaunit4-240618090401-95889882/85/EECA-unit-4-pdf-notes-for-electrical-engineering-7-320.jpg)


![Electrical Engineering 2019-2020/ Ravi Kumar Soni
82
Electrical Energy Conversion & Auditing
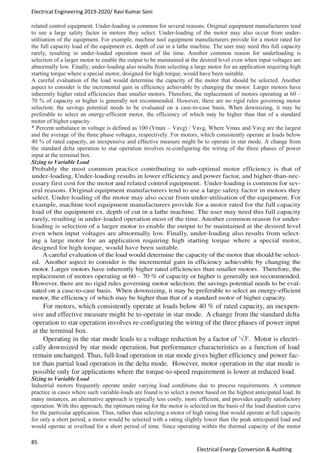
2.5 Motor Selection
The primary technical consideration defining the motor choice for any particular application is the torque
required by the load, especially the relationship between the maximum torque generated by the motor (break
down torque) and the torque requirements for start-up (locked rotor torque) and during acceleration periods. The
duty / load cycle determines the thermal loading on the motor. One consideration with totally enclosed fan cooled
(TEFC) motors is that the cooling may be insufficient when the motor is operated at speeds below its rated value.
Ambient operating conditions affect motor choice; special motor designs are available for corrosive or dusty
atmospheres, high temperatures, restricted physical space, etc. An estimate of the switching frequency (usually
dictated by the process), whether automatic or manually controlled, can help in selecting the appropriate motor
for the duty cycle.
The demand a motor will place on the balance of the plant electrical system is another consideration - if the load
variations are large, for example as a result of frequent starts and stops of large components like compressors, the
resulting large voltage drops could be detrimental to other equipment. Reliability is of prime importance – in
many cases, however, designers and process engineers seeking reliability will grossly oversize equipment,
leading to sub-optimal energy performance. Good knowledge of process parameters and a better understanding of
the plant power system can aid in reducing oversizing with no loss of reliability. Inventory is another
consideration - Many large industries use standard equipment, which can be easily serviced or replaced, thereby
reducing the stock of spare parts that must be maintained and minimizing shut-down time. This practice affects
the choice of motors that might provide better energy performance in specific applications. Shorter lead times for
securing individual motors from suppliers would help reduce the need for this practice.
Price is another issue - Many users are first-cost sensitive, leading to the purchase of less expensive motors that
may be more costly on a lifecycle basis because of lower efficiency. For example, energy efficient motors or
other specially designed motors typically save within a few years an amount of money equal to several times the
incremental cost for an energy efficient motor, over a standard-efficiency motor. Few of salient selection issues
are given below:
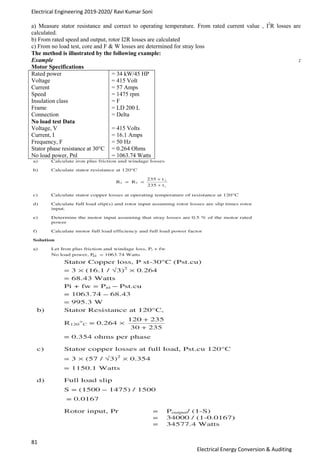
• In the selection process, the power drawn at 75 % of loading can be a meaningful indicator of energy efficiency.
• Reactive power drawn (kVAR) by the motor.
• Indian Standard 325 for standard motors allows 15 % tolerance on efficiency for motors upto 50 kW rating and
10 % for motors over 50 kW rating.
• The Indian Standard IS 8789 addresses technical performance of Standard Motors while IS 12615 addresses the
efficiency criteria of High Efficiency Motors. Both follow IEC 34-2 test methodology wherein, stray losses are
assumed as 0.5 % of input power. By the IEC test method, the losses are understated and if one goes by IEEE test
methodology, the motor efficiency values would be further lowered.
• It would be prudent for buyers to procure motors based on test certificates rather than labeled values.
• The energy savings by motor replacement can be worked out by the simple relation : kW
savings = kW output × [ 1/ηold – 1/ ηnew ] where ηold and ηnew are the existing and proposed motor efficiency
values.](https://image.slidesharecdn.com/eecaunit4-240618090401-95889882/85/EECA-unit-4-pdf-notes-for-electrical-engineering-22-320.jpg)


![ch_introduction to power1 part 1_ppt[1].pdf](https://cdn.slidesharecdn.com/ss_thumbnails/ch1ppt1-240311072205-6dbf40e9-thumbnail.jpg?width=640&height=640&fit=bounds)