Download to read offline


![What Are Students’ Attitudes towards Mathematics? – INDICATOR A5 chapter a
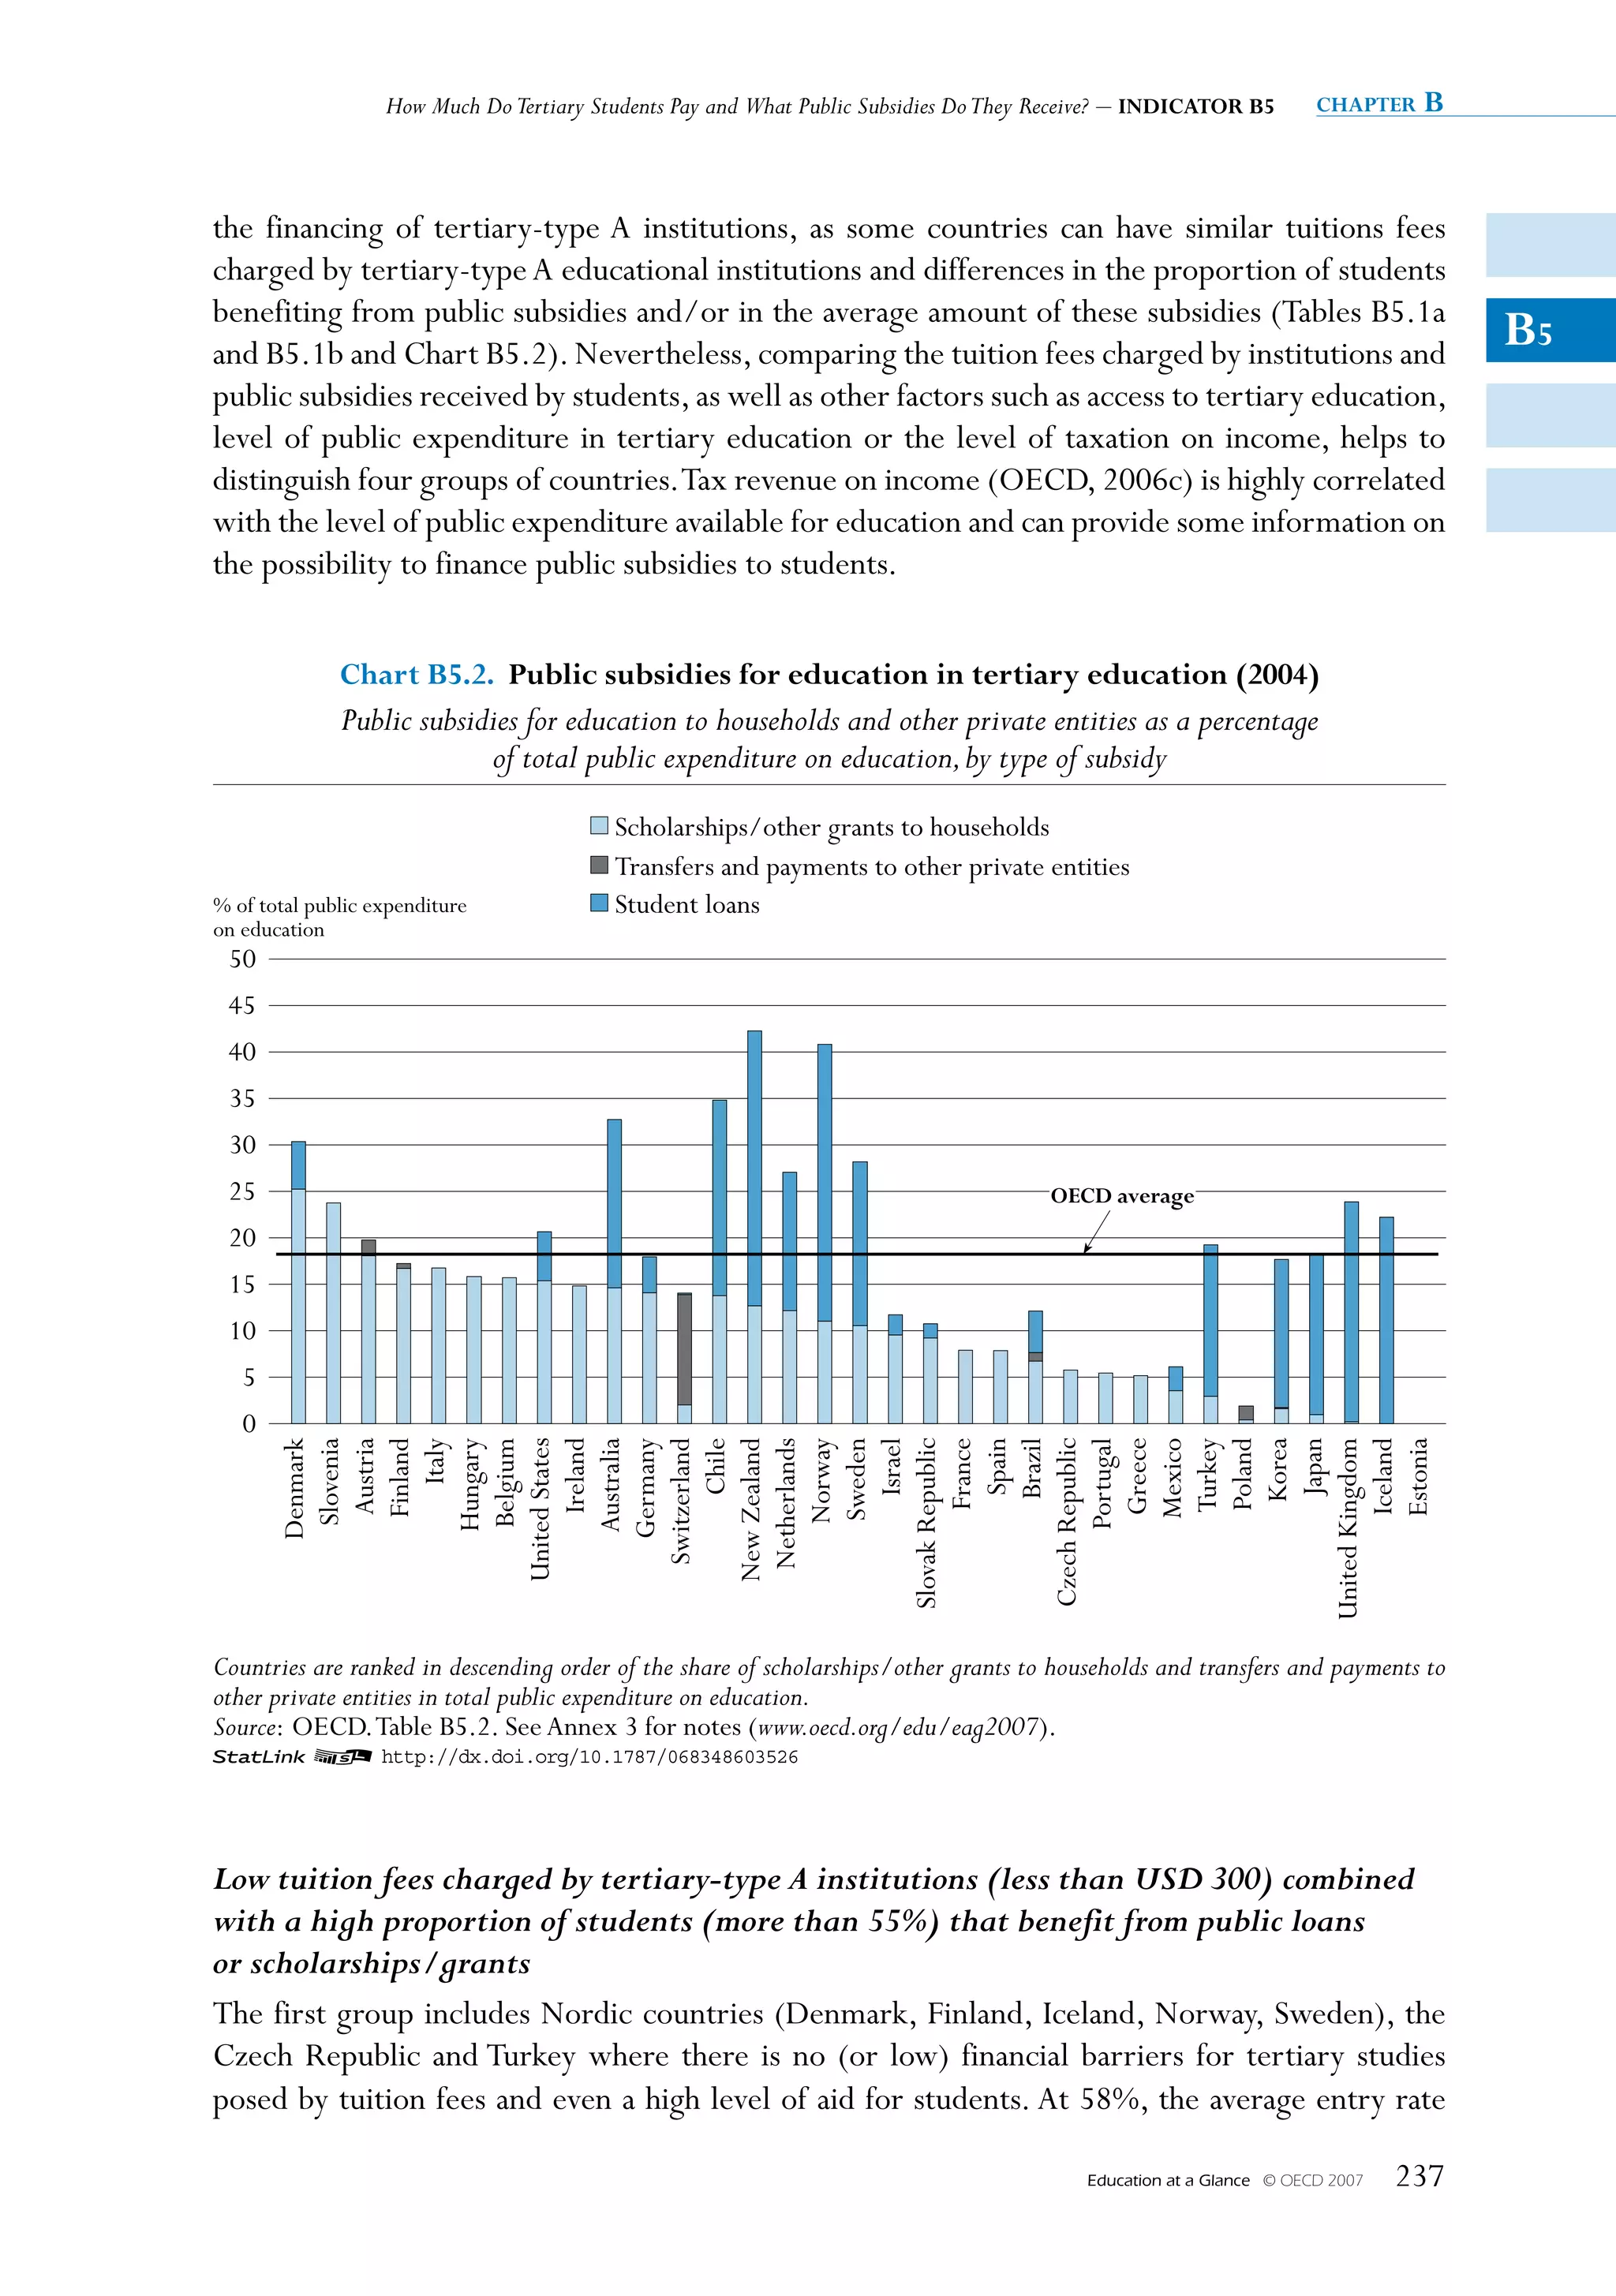
Policy context
A5
PISA measures several facets of students’ attitudes and approaches to learning and the contexts
in which they learn. PISA’s conceptual framework is founded on a general model of student
learning in which students are active participants in the learning process, with learning involving
the strategic engagement of one’s cognitive, affective and behavioural processes within their
particular cultural, social, and school contexts. In PISA, 15-year-olds’ attitudes and approaches
to learning are treated as important outcomes in their own right, as well as factors that account
for variation in cognitive performance.
There is considerable empirical support for the influence of students’ learning attitudes and
approaches on academic performance, and vice versa. At the same time, however, it is important
to note that the extent and nature of such relationships may differ across countries and cultures.
Students’ attitudes toward learning and their perceptions of their abilities to regulate their own
learning and select appropriate strategies for achieving their goals are shaped in part by their
outside environment – the society and culture in which they live and the schools they attend.
Education systems differ in the extent to which they value particular learning attitudes or courses
of action. For example, in countries that may place a high premium on academic performance,
particularly in mathematics, students may display considerably higher levels of anxiety about
their performance in mathematics than in countries that do not share this goal.
This indicator examines how 15-year-old students’ attitudes toward and approaches toward
learning and the school contexts of learning vary across countries and across groups of
countries, and also the relationship between these characteristics and students’ performance in
mathematics.
Evidence and explanations
The indicator is based on the PISA 2003 survey and draws on eight composite scales describing
students’ attitudes towards mathematics and their approaches to learning, as well as four school-
related scales describing the social contexts and climates in which learning occurs. Each of the
12 scales is based on a number of survey items that provide ordinal values, which are summarised
into composite scales, with varying but reasonable levels of scale reliabilities. (See Learning for
Tomorrow’s World: First Results from PISA 2003 [OECD 2004a] for additional information on the
construction of these scales.)
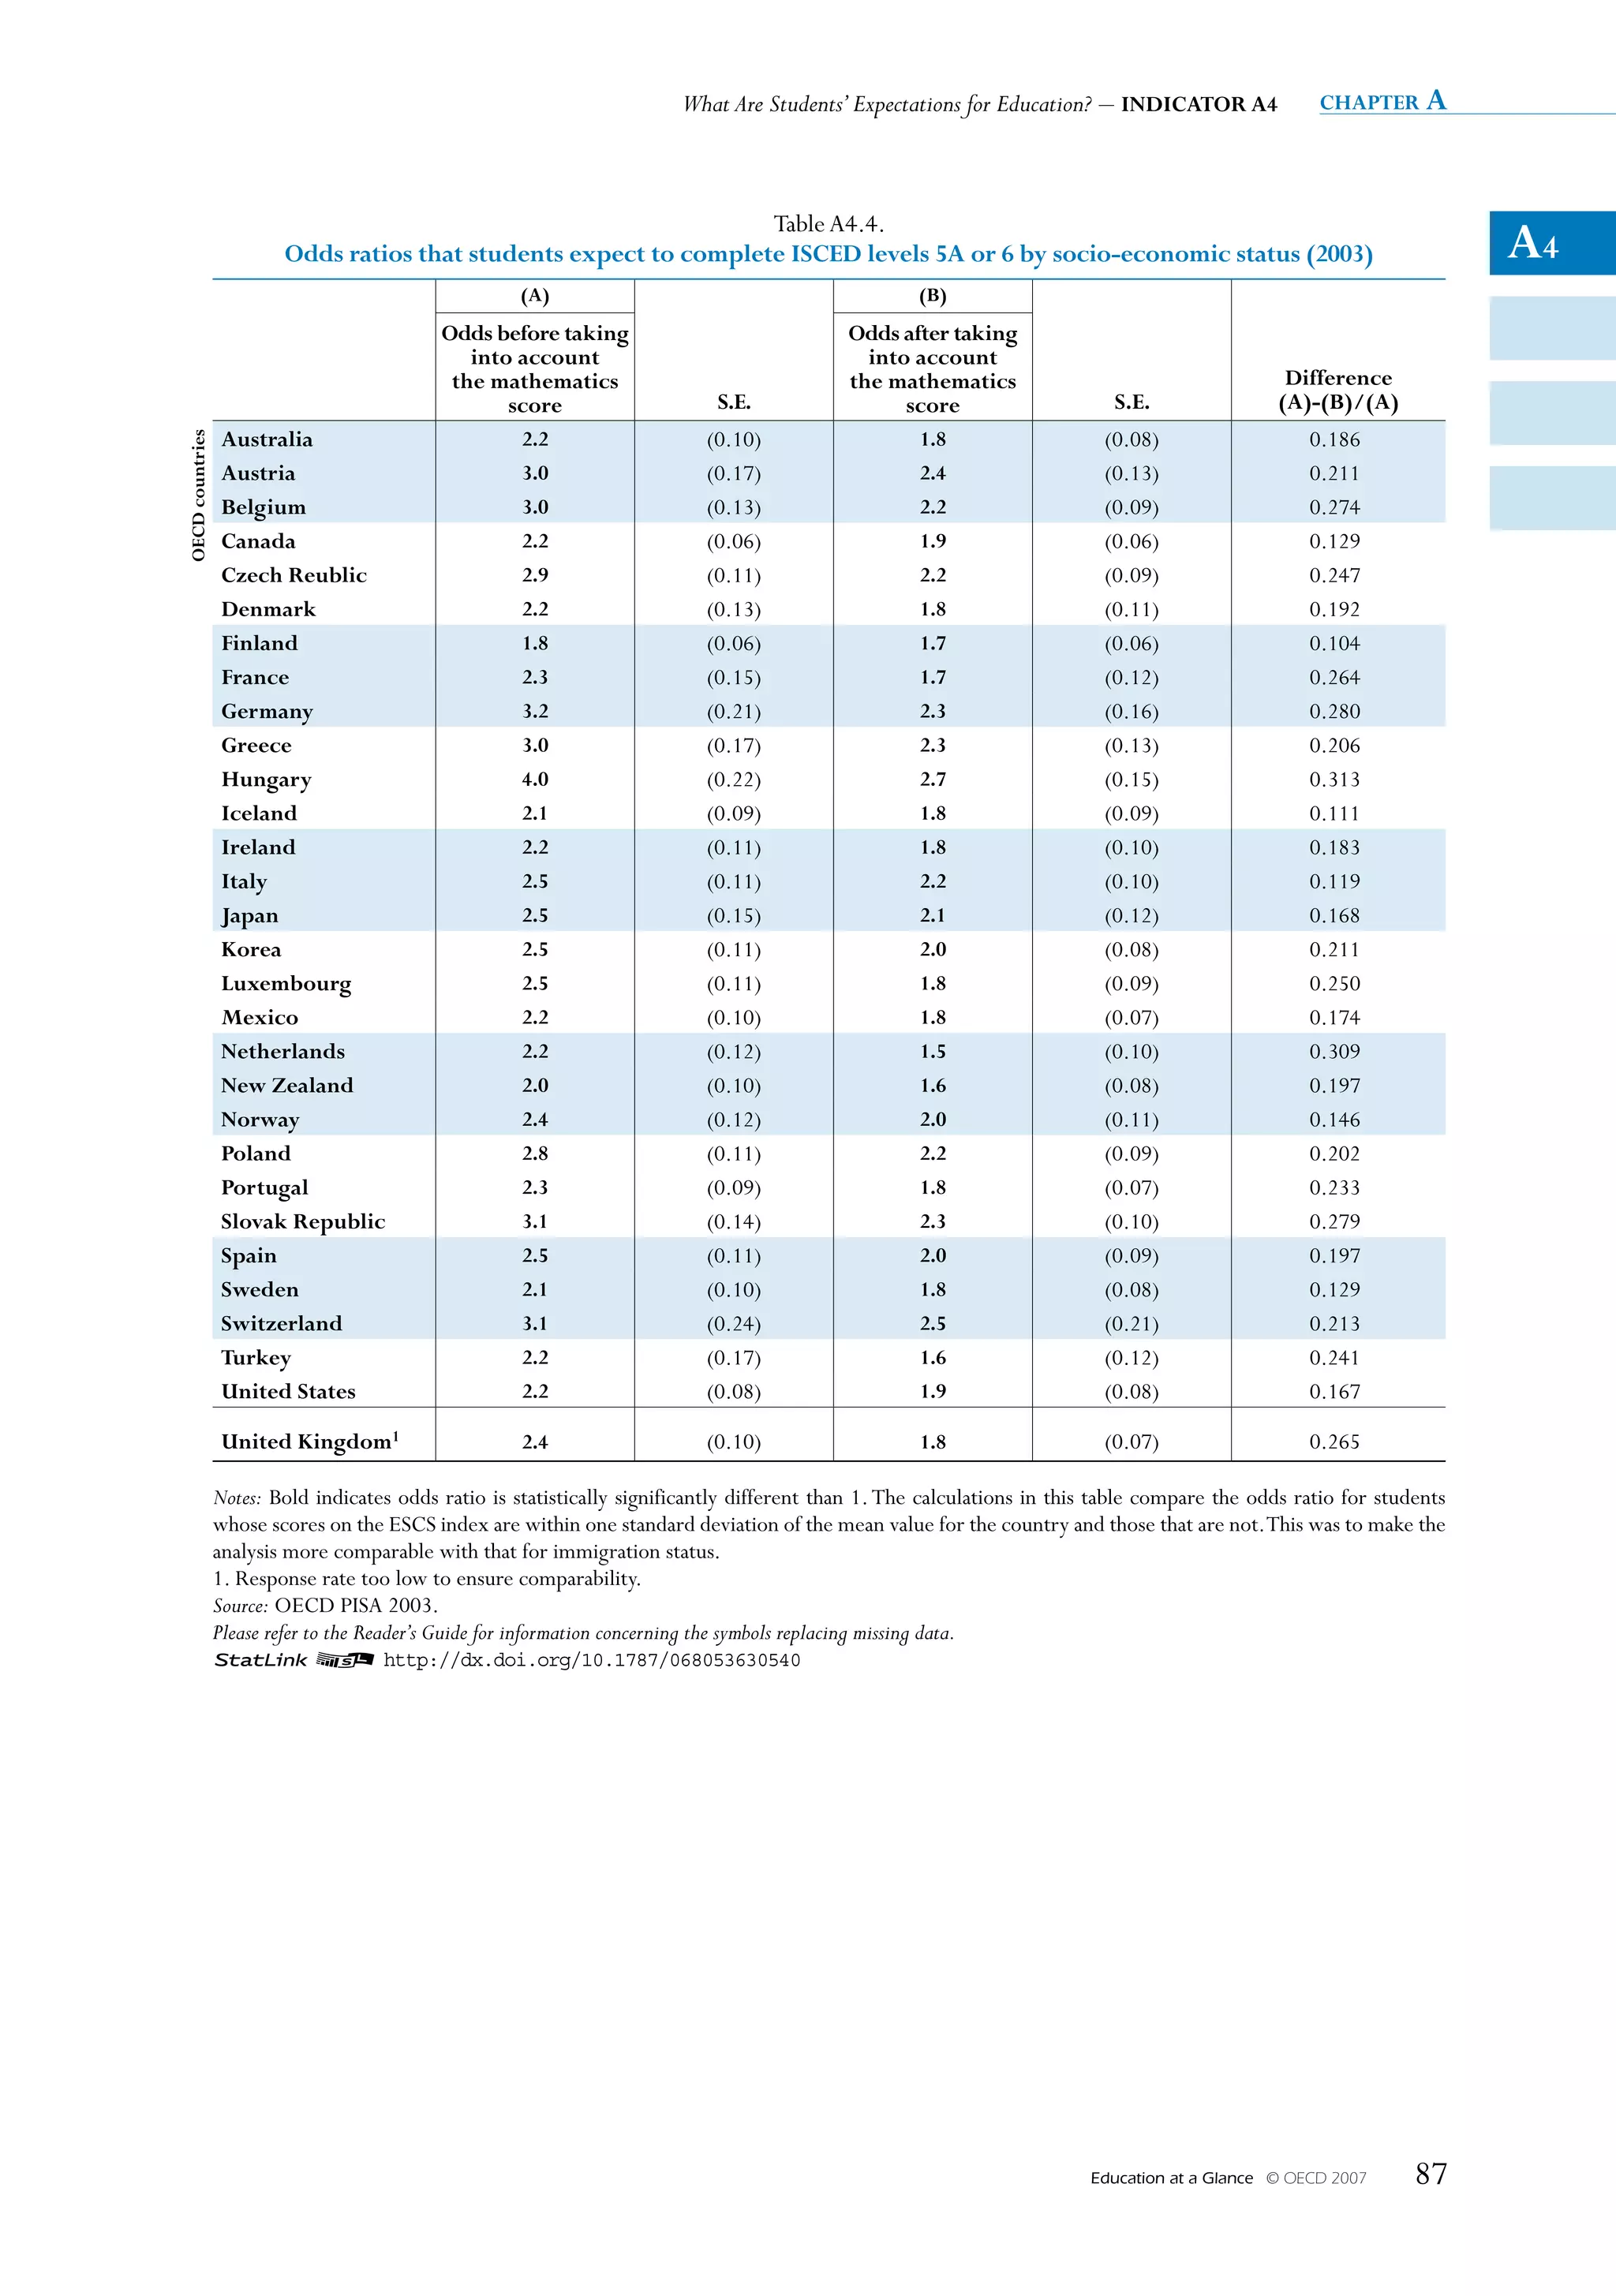
Students’ attitudes include their interest in and enjoyment of mathematics, instrumental
motivation, self-concept in mathematics, self-efficacy in mathematics, and anxiety in mathematics.
Learning approaches include students’ reported use of control strategies, memorisation strategies,
and elaboration strategies. School-related indices include students’ attitudes toward school, their
sense of belonging in school, and indices of teacher support and of disciplinary climate. Box 5.1
describes these scales in more detail.
Classifying countries by students’ attitudes toward mathematics, approaches to
learning, and school-related indices
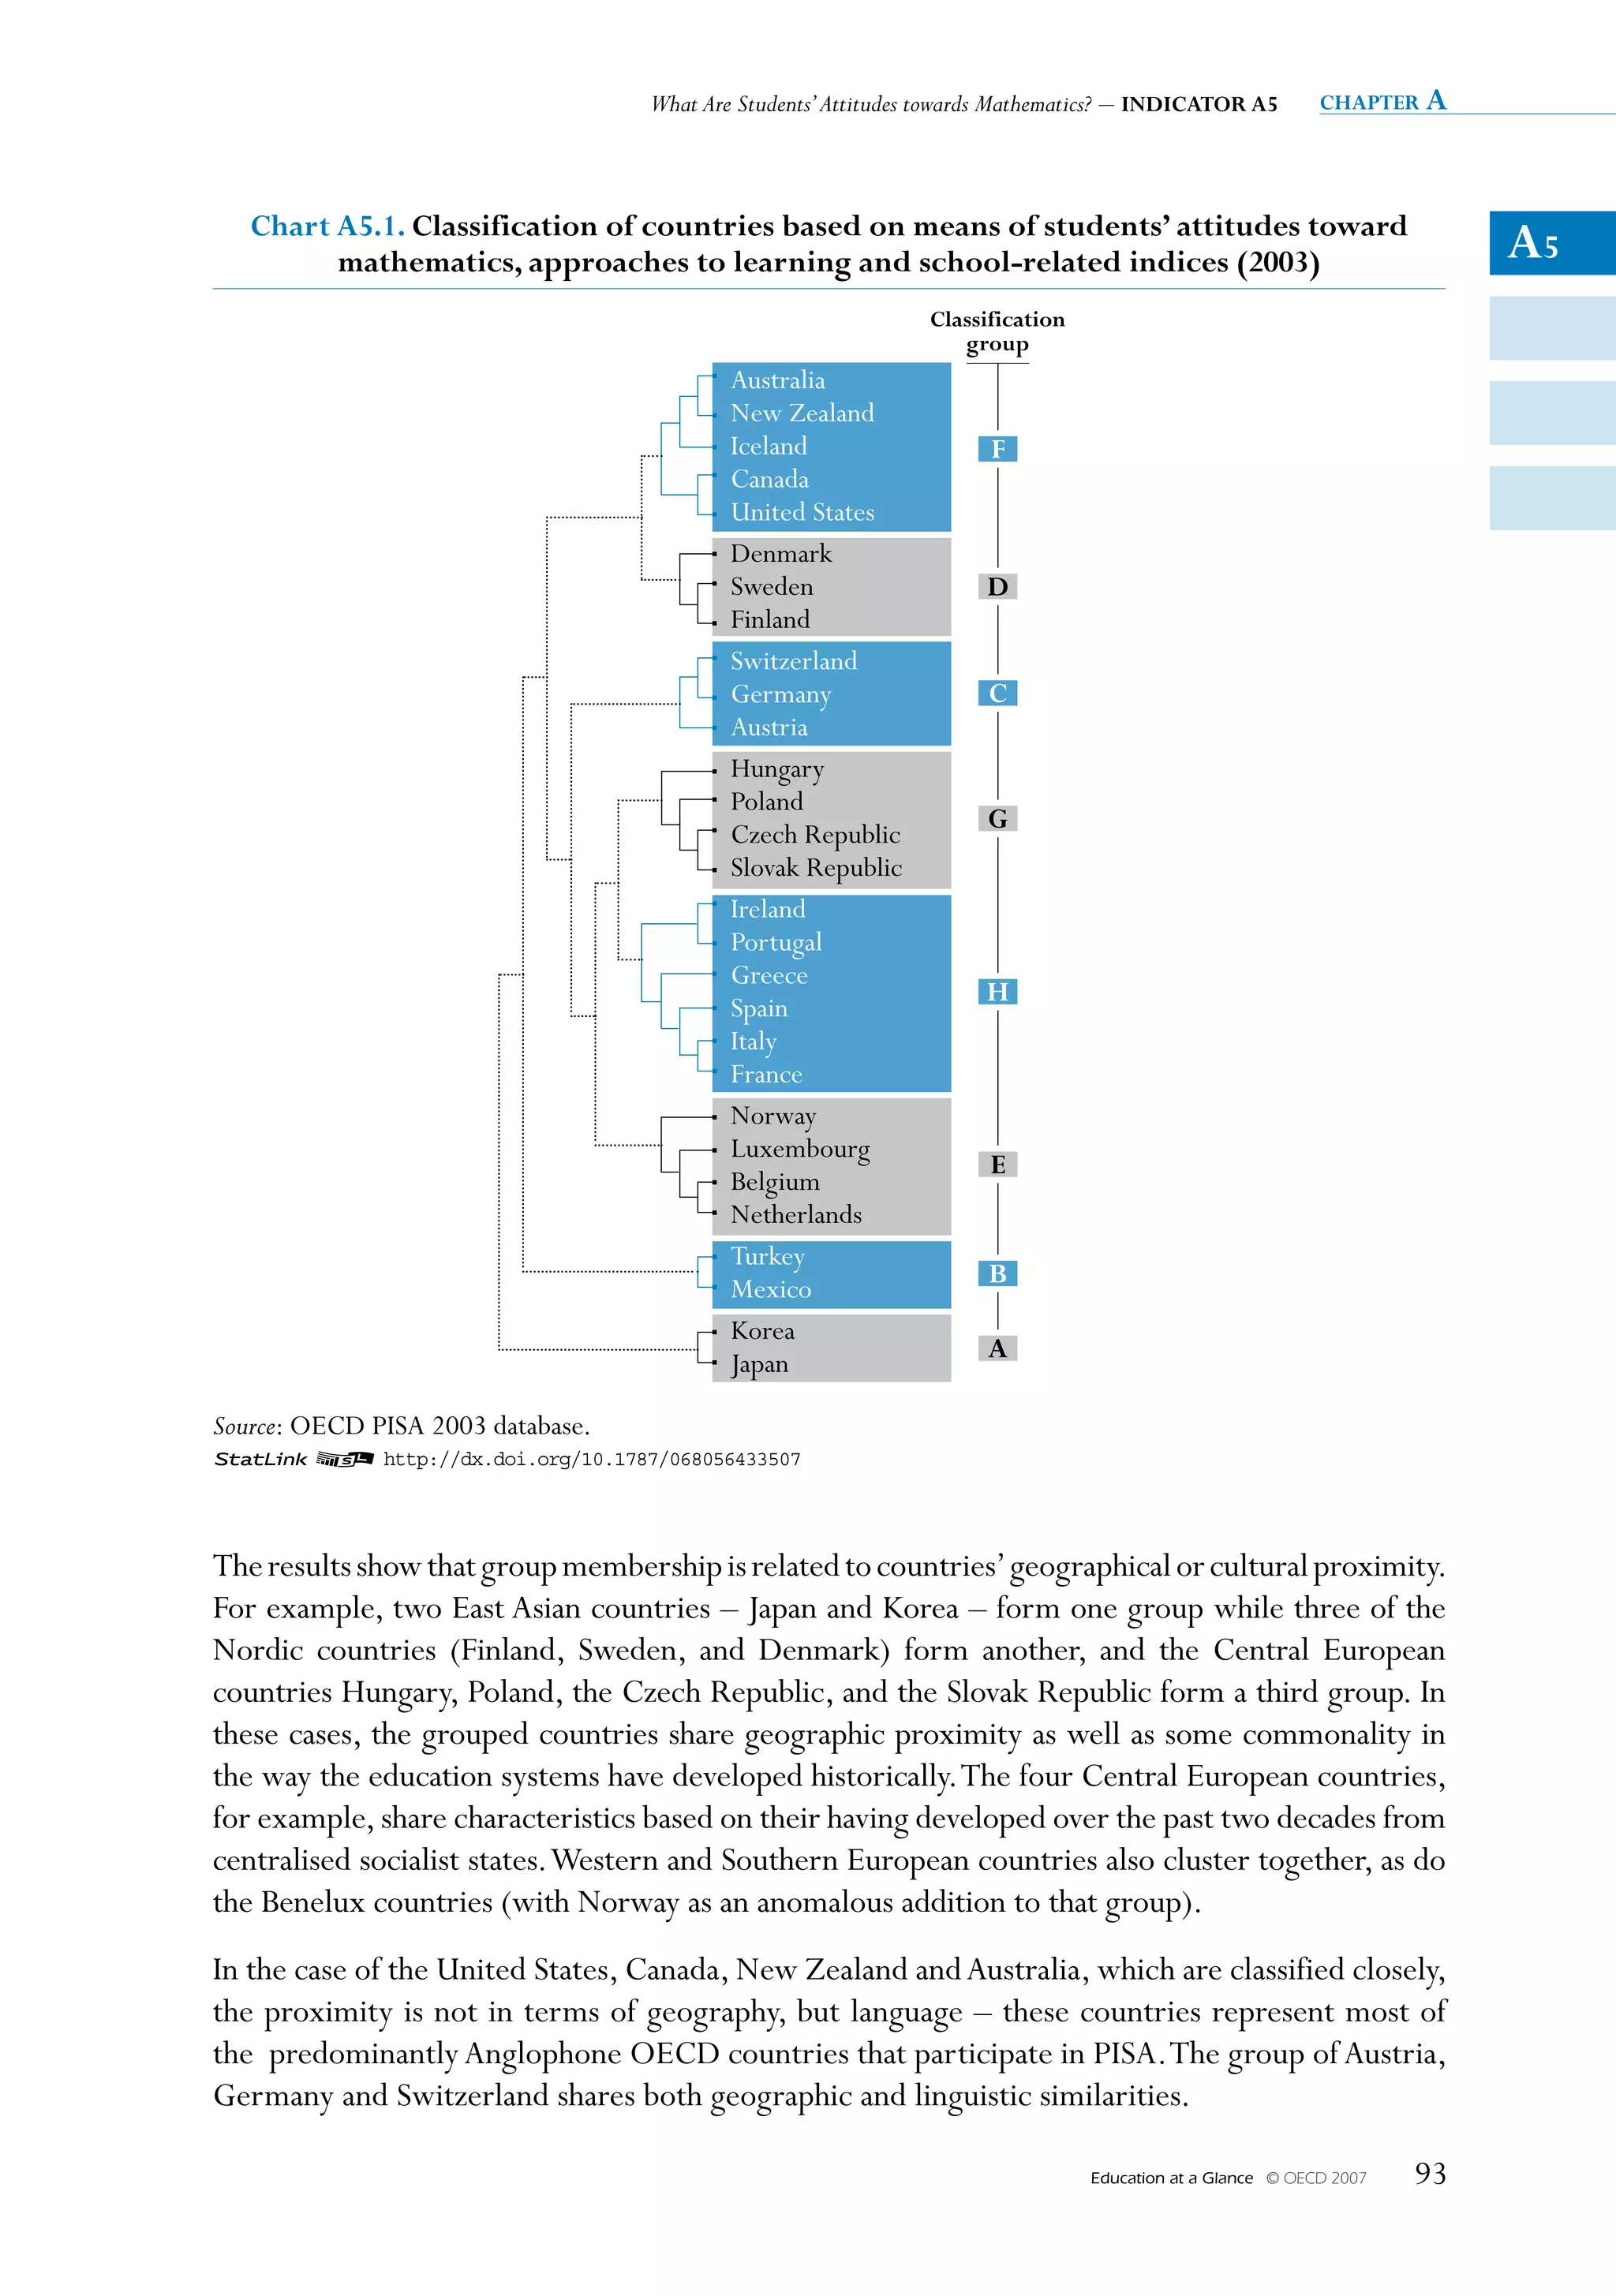
Chart A5.1 shows the results of a classification analysis, which grouped countries according to
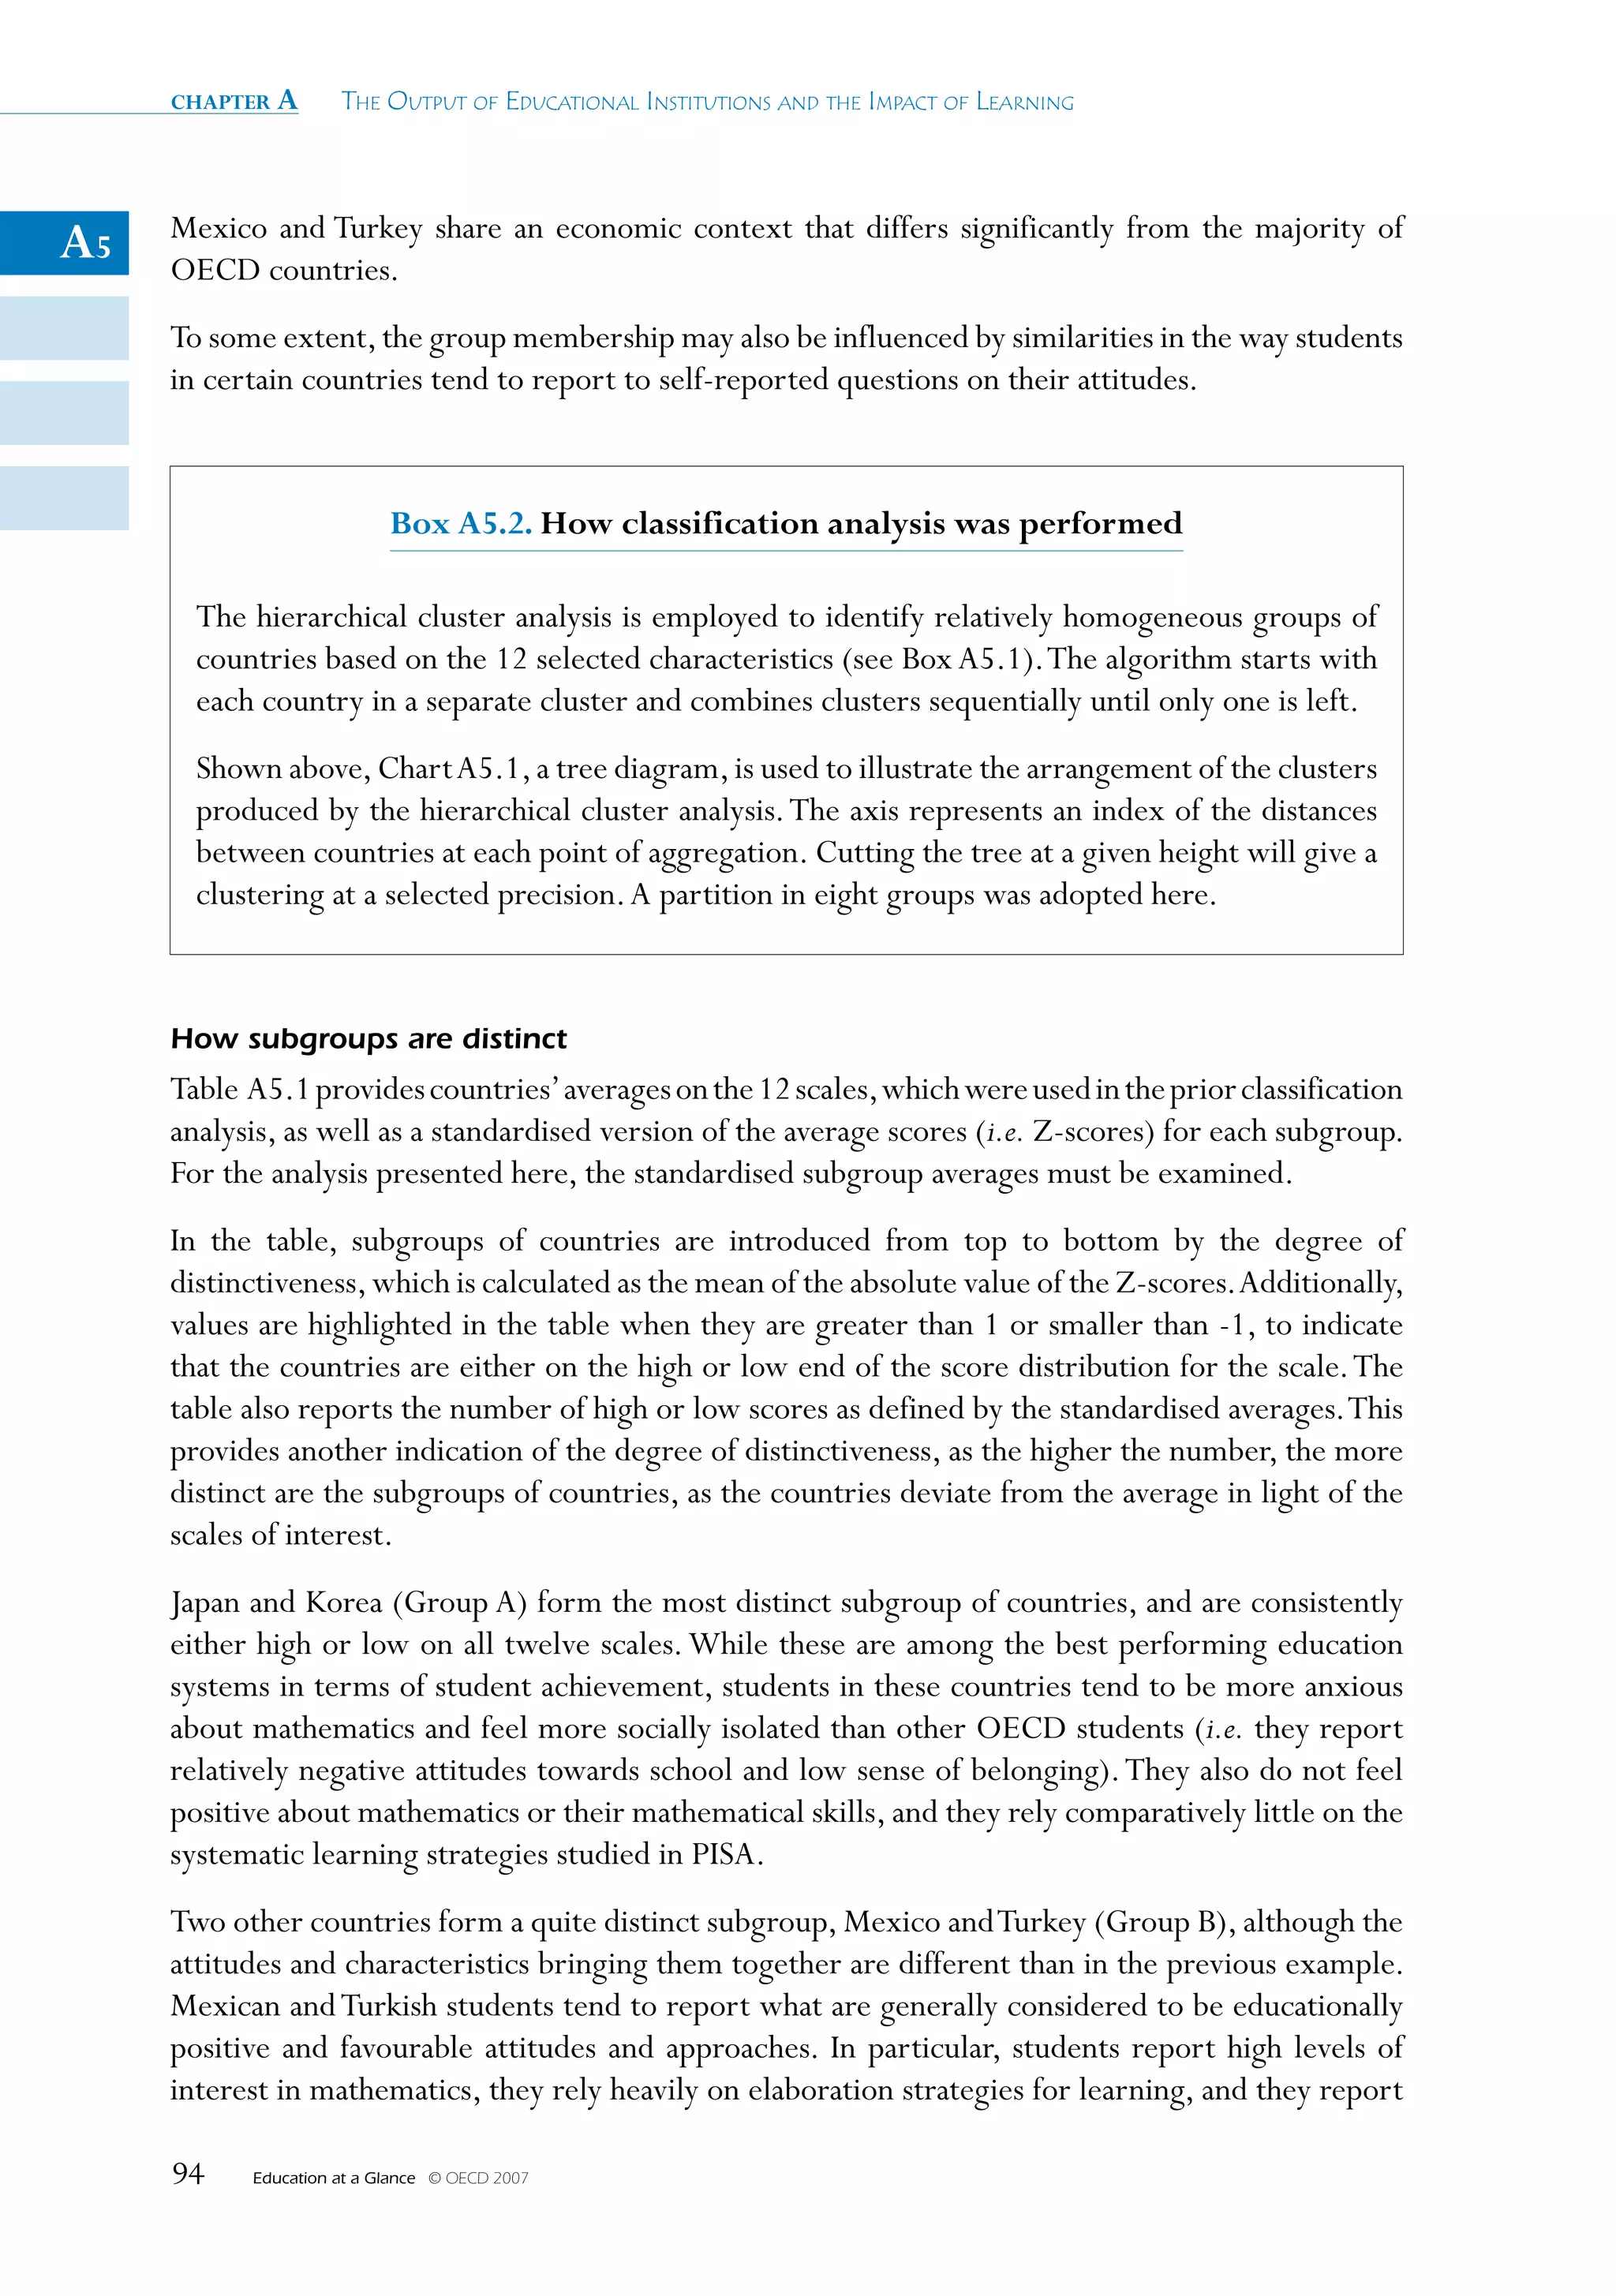
similarities among their averages on the 12 scales. Box 5.2 provides additional information on
how the classification analysis was performed. The ordering of groups from top to bottom in the
chart is arbitrary and implies no sense of hierarchy.
Education at a Glance © OECD 2007 91](https://image.slidesharecdn.com/educacionsegunocde2007-100705022559-phpapp01/75/Educacion-OCDE-2007-91-2048.jpg)


![What Are Students’ Attitudes towards Mathematics? – INDICATOR A5 chapter a
countries in the sample. These countries also are similar in the consistently weak associations of
sense of belonging and mathematics performance. Germany, Switzerland and Austria (Group C)
A5
are similar only in the above-average negative association of teacher support and mathematics
performance. In these countries, students with low mathematics scores may be more likely to
receive additional support, indicating that these systems may be rich in teacher support for those
students who need it.
Definitions and methodologies
PISA was most recently administered in 2006; however, since those data are not yet available, this
indicator is based on data from the PISA 2003 survey.
The target population for this indicator was all 15-year-old students (in participating countries)
enrolled in educational institutions at the secondary-school level regardless of grade level, type
of institution, and part- or full-time enrolment status. Fifteen-year olds were defined as students
who were between 15 years and 3 months to 16 years and 2 months at the beginning of the PISA
testing period.
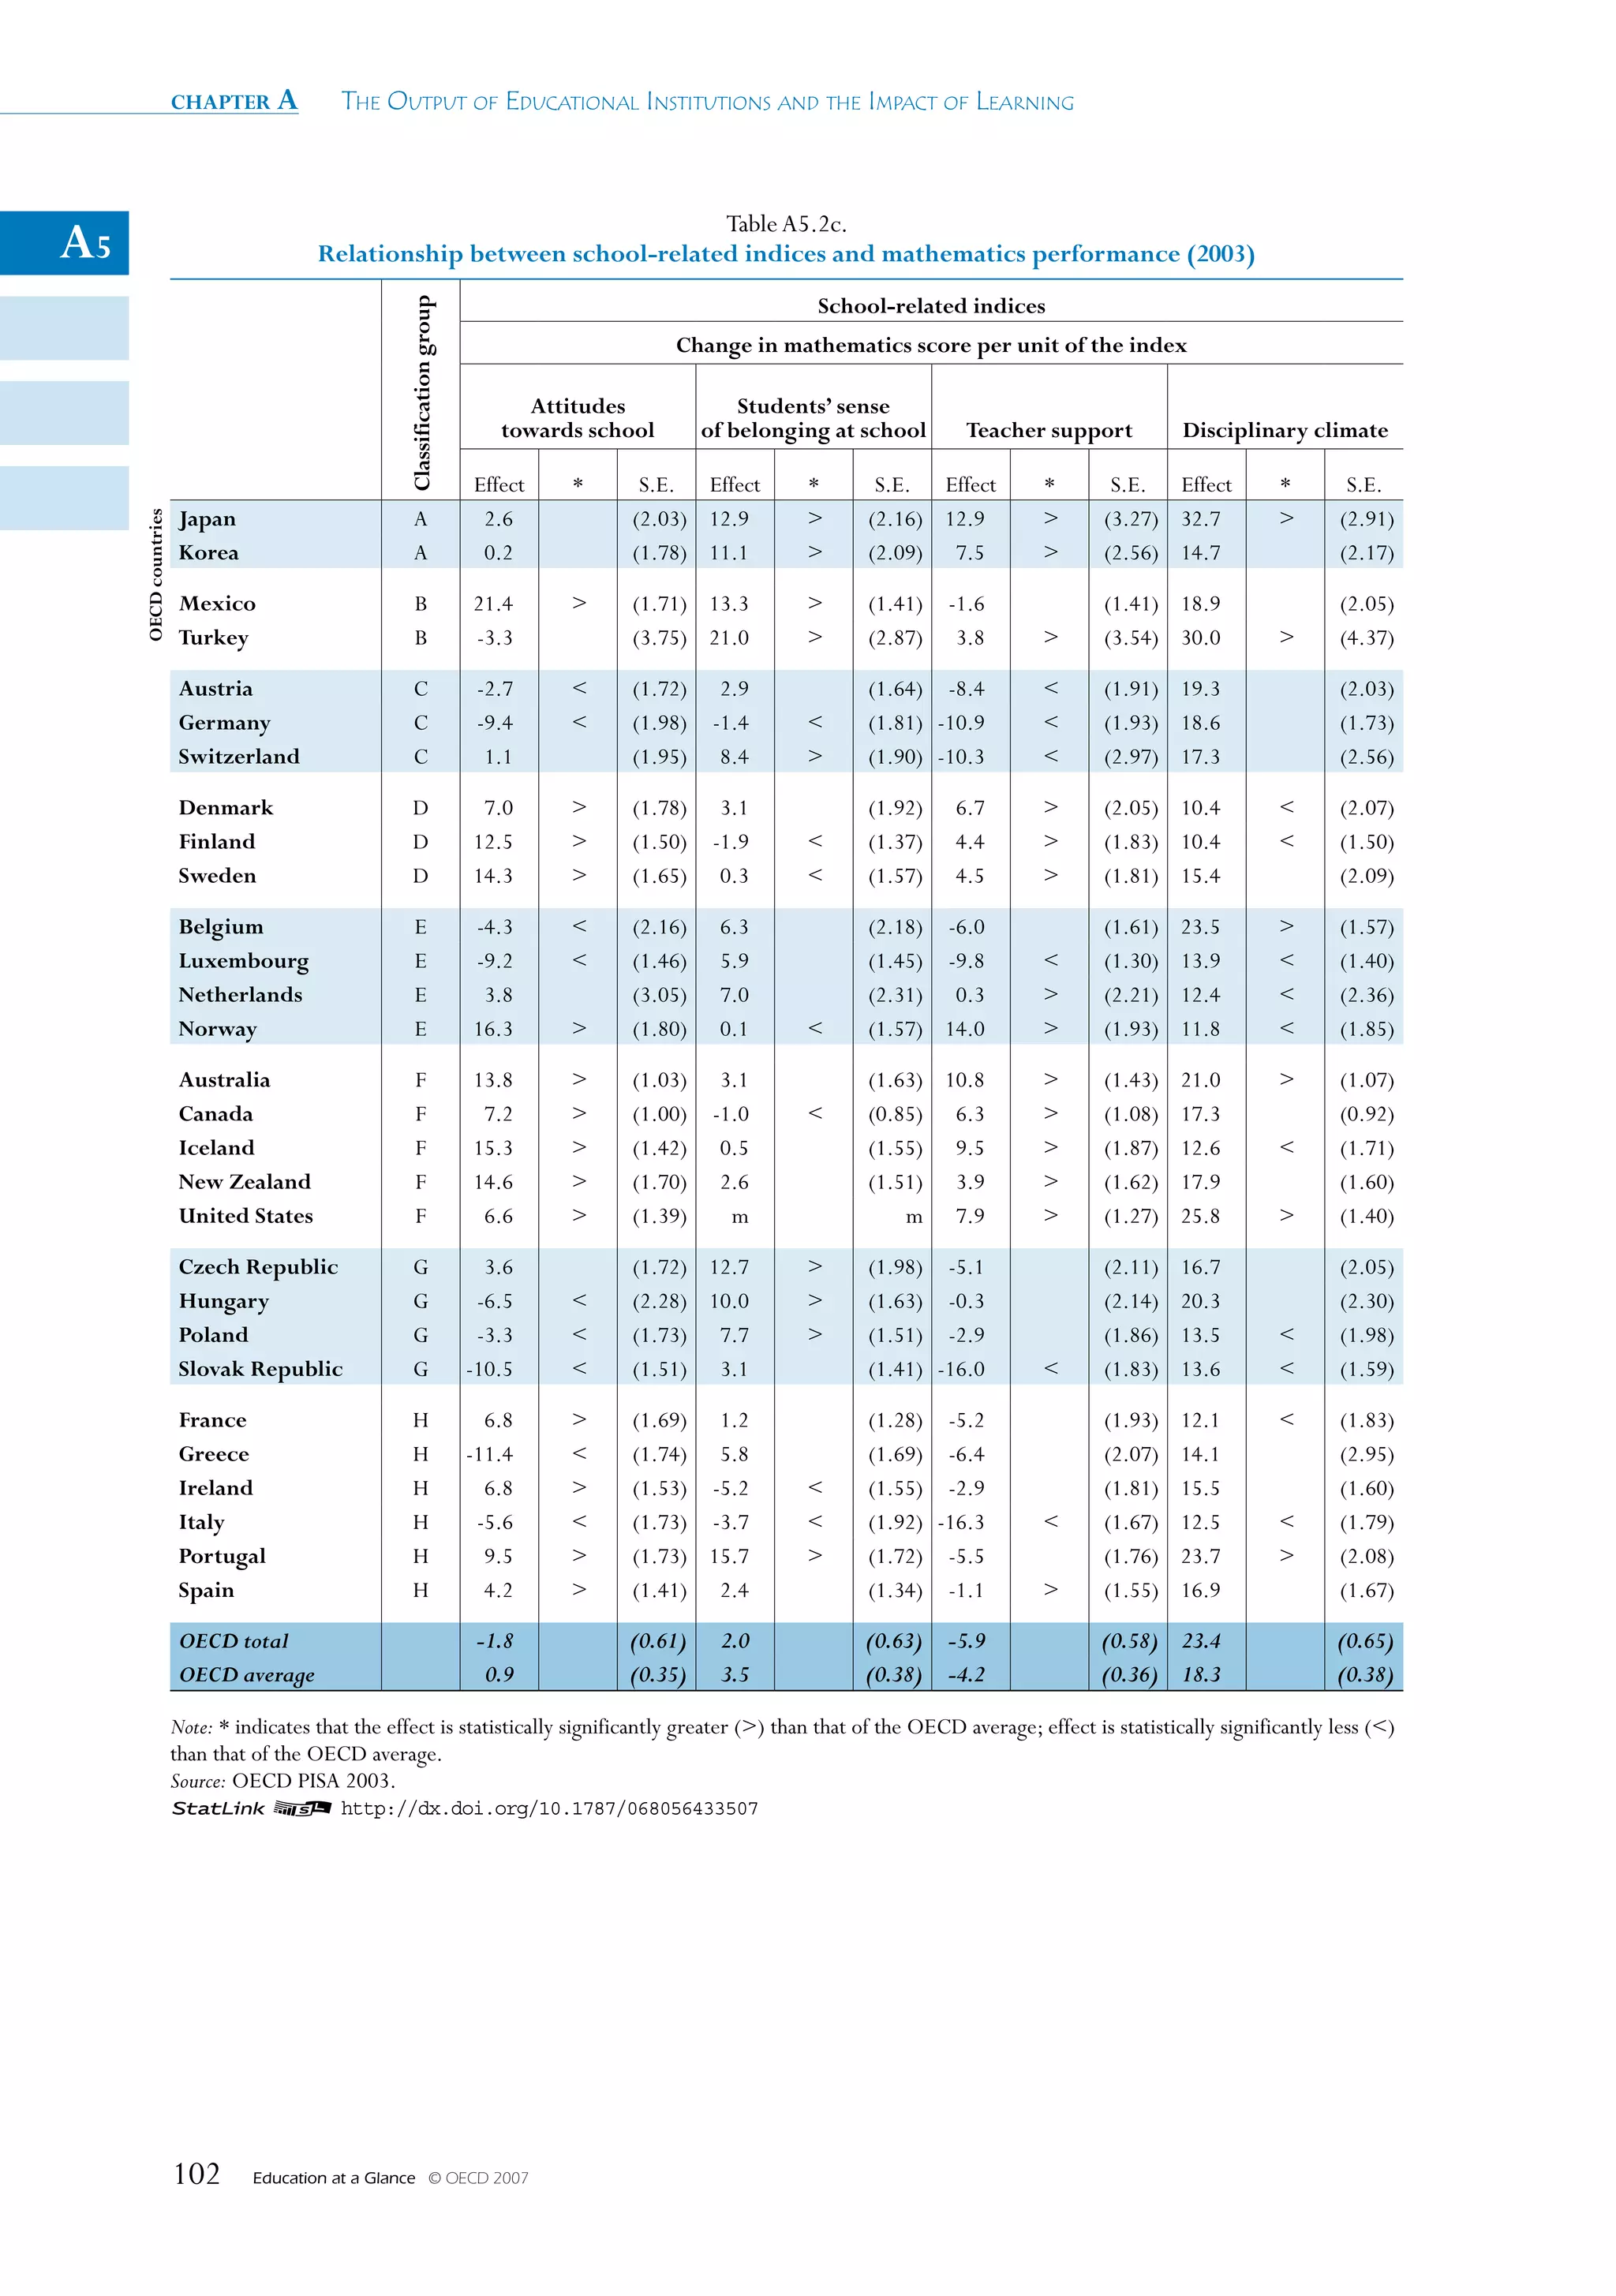
Tables A5.2a through A5.2c provide data on the change in a country’s mathematics score per
unit of the relevant indices. The indices summarise student responses to a series of related
questions constructed on the basis of previous research (see Annex A1 of Learning for Tomorrow’s
World: First Results from PISA 2003 [OECD 2004a]). The validity of comparisons across countries
was explored using structural equation modelling. In describing students in terms of each
characteristic (i.e. self-concept in mathematics), scales were constructed on which the average
OECD student (i.e. the student with an average level of self-concept) was given an index value of
zero, and about two-thirds of the OECD student population are between the values of -1 and 1
(i.e. the index has a standard deviation of 1). Negative values on an index do not necessarily imply
that students responded negatively to the underlying questions. Rather, a student with a negative
score responded less positively than students on average across OECD countries. Likewise, a
student with a positive score responded more positively than the average in the OECD area.
Tables A5.2a, A5.2b and A5.2c also provide an OECD average and an OECD total, per the
standard PISA reporting conventions. The OECD average takes the OECD countries as a single
entity, to which each country contributes with equal weight. For statistics such as percentages or
mean scores, the OECD average corresponds to the arithmetic mean of the respective country
statistics. In contrast, for statistics relating to variation, the OECD average may differ from the
arithmetic mean of the country statistics because it not only reflects variation within countries,
but also variation that lies between countries. The OECD total, rather, takes OECD countries as
a single entity, to which each country contributes in proportion to the number of 15-year-olds
enrolled in its schools. It illustrates how a country compares with the OECD as a whole and
may be used to refer to the stock of human capital in the OECD region. As in the indicator, the
average is used when the focus is on comparing performance or other attributes across countries.
All averages include data for the United Kingdom, even when the data are not shown in the
respective data tables.
The United Kingdom did not reach PISA’s unit response rate standard, which precludes
its comparison with the other countries on whole population analyses. Estimates for the
United Kingdom are still reported in charts and tables dealing with subsets of the population
Education at a Glance © OECD 2007 97](https://image.slidesharecdn.com/educacionsegunocde2007-100705022559-phpapp01/75/Educacion-OCDE-2007-97-2048.jpg)


![chapter a The OuTpuT Of educaTiOnal insTiTuTiOns and The impacT Of learning
Policy context
A6
In most OECD countries, policy makers and the general public are paying increasing attention to
issues surrounding international migration. In part, this is a consequence of the growth of immigrant
inflows that many OECD countries have experienced since the 1980s, whether from globalising
economic activities and family reunions in the aftermath of labour migration movements during the
1960s and 1970s, the dissolution of the Eastern Bloc in Europe, or political instability.The issues go
well beyond how migration flows can be channelled and managed, and are increasingly related to
how the challenges of integration can be addressed effectively – for both the immigrants themselves
and the populations in the countries receiving them. Given the pivotal role of education for success
in working life, education and training set the stage for the integration of immigrants into labour
markets. They can also contribute to overcoming language barriers and facilitate the transmission
of the norms and values that provide a basis for social cohesion.
PISA adds a crucial new perspective to the analyses, by assessing the success of 15-year-old students
with an immigrant background in school, both in comparison to their native counterparts and
in comparison to similar student populations in other countries. The performance disadvantages
of students with an immigrant background shown by this indicator lay out major challenges for
education systems and these are unlikely to be resolved on their own. On the contrary, given the
anticipated effects of population aging and ongoing needs for skilled labour as well as the extent
of family reunification, it is likely that migration to OECD countries will remain high on national
policy agendas. Education systems, particularly in Europe, will need to deal more effectively with
increasing socio-economic and cultural diversity in their student populations and find ways to
ensure that children from immigrant backgrounds ultimately enter the labour market with strong
foundation skills, as well as with the capacity and motivation to continue learning throughout life.
Evidence and explanations
Among the 14 OECD countries in which students with an immigrant background accounted for
more than 3% of 15-year-old students, first-generation students lag 48 score points behind their
native counterparts on the PISA mathematics scale, equivalent to more than an average school year’s
progress (the average performance gain associated with a school year is estimated at 41 score points)
(see Chart A6.1). Even after accounting for socio-economic factors such as the occupation and
education of their parents, an average disadvantage of 30 score points remains (see Where Immigrants
Succeed: A Comparative Review of Performance and Engagement in PISA 2003 [OECD, 2006b]).
box A6.1. Terminology used for describing students’ immigrant background
Native students: Students with at least one parent born in the country of assessment.
Students born in the country who have one foreign-born parent (children of “combined”
families) are included in the native category, as previous research indicates that these students
perform similarly to native students.
First-generation students: Students born outside of the country of assessment whose
parents are also foreign-born.
Second-generation students: Students born in the country of assessment with foreign-
born parents.
106 Education at a Glance © OECD 2007](https://image.slidesharecdn.com/educacionsegunocde2007-100705022559-phpapp01/75/Educacion-OCDE-2007-106-2048.jpg)


![What is the Impact of Immigrant Background on Student Performance? – INDICATOR A6 chapter a
A very different picture emerges for Australia and Canada and the partner economies Hong Kong-
China and Macao-China. In these countries, the percentage of students performing below
A6
Level 2 is comparatively low in all groups, with less than 16% of first-generation, second-
generation or native students failing to reach Level 2. The comparatively positive situation
of students with an immigrant background in Australia and Canada may, in part, be a result
of selective immigration policies resulting in immigrant populations with greater wealth and
education. In Hong Kong-China and Macao-China the ethnic background and language between
native students and those with an immigrant background is often similar, even if large socio-
economic differences exist. However, the bottom line is that these countries have only a relatively
small proportion of students at low levels of mathematical literacy.
The trends in reading are similar to those in mathematics. With the exception of the Russian
Federation, the percentage of native students who fail to reach Level 2 in reading is less than
20% across all of the countries included in this study. Among students with an immigrant
background, however, it is considerably higher (see Tables A6.2d, A6.2e and A6.2f, available on
line at [http://dx.doi.org/10.1787/068061288083]). In 10 OECD countries – Austria, Belgium,
Denmark, France, Germany, Luxembourg, Norway, Sweden, Switzerland and the United States –
and in the partner economy the Russian Federation more than 25% of first-generation students fail
to reach Level 2. As in mathematics, countries with high percentages of students with an immigrant
background below Level 2 in reading may consider introducing support measures particularly
geared to the needs of these student groups.
Findings from PISA suggest that students are most likely to initiate high quality learning, using
various strategies, if they are well motivated, not anxious about their learning and believe in
their own capacities. On the same token, high performance could lead to better motivation
and attitudes towards schooling less anxiety. How well do schools and families foster and
strengthen positive predispositions to learning among students with an immigrant background
and thus contribute to laying a foundation for them to leave school with the motivation and
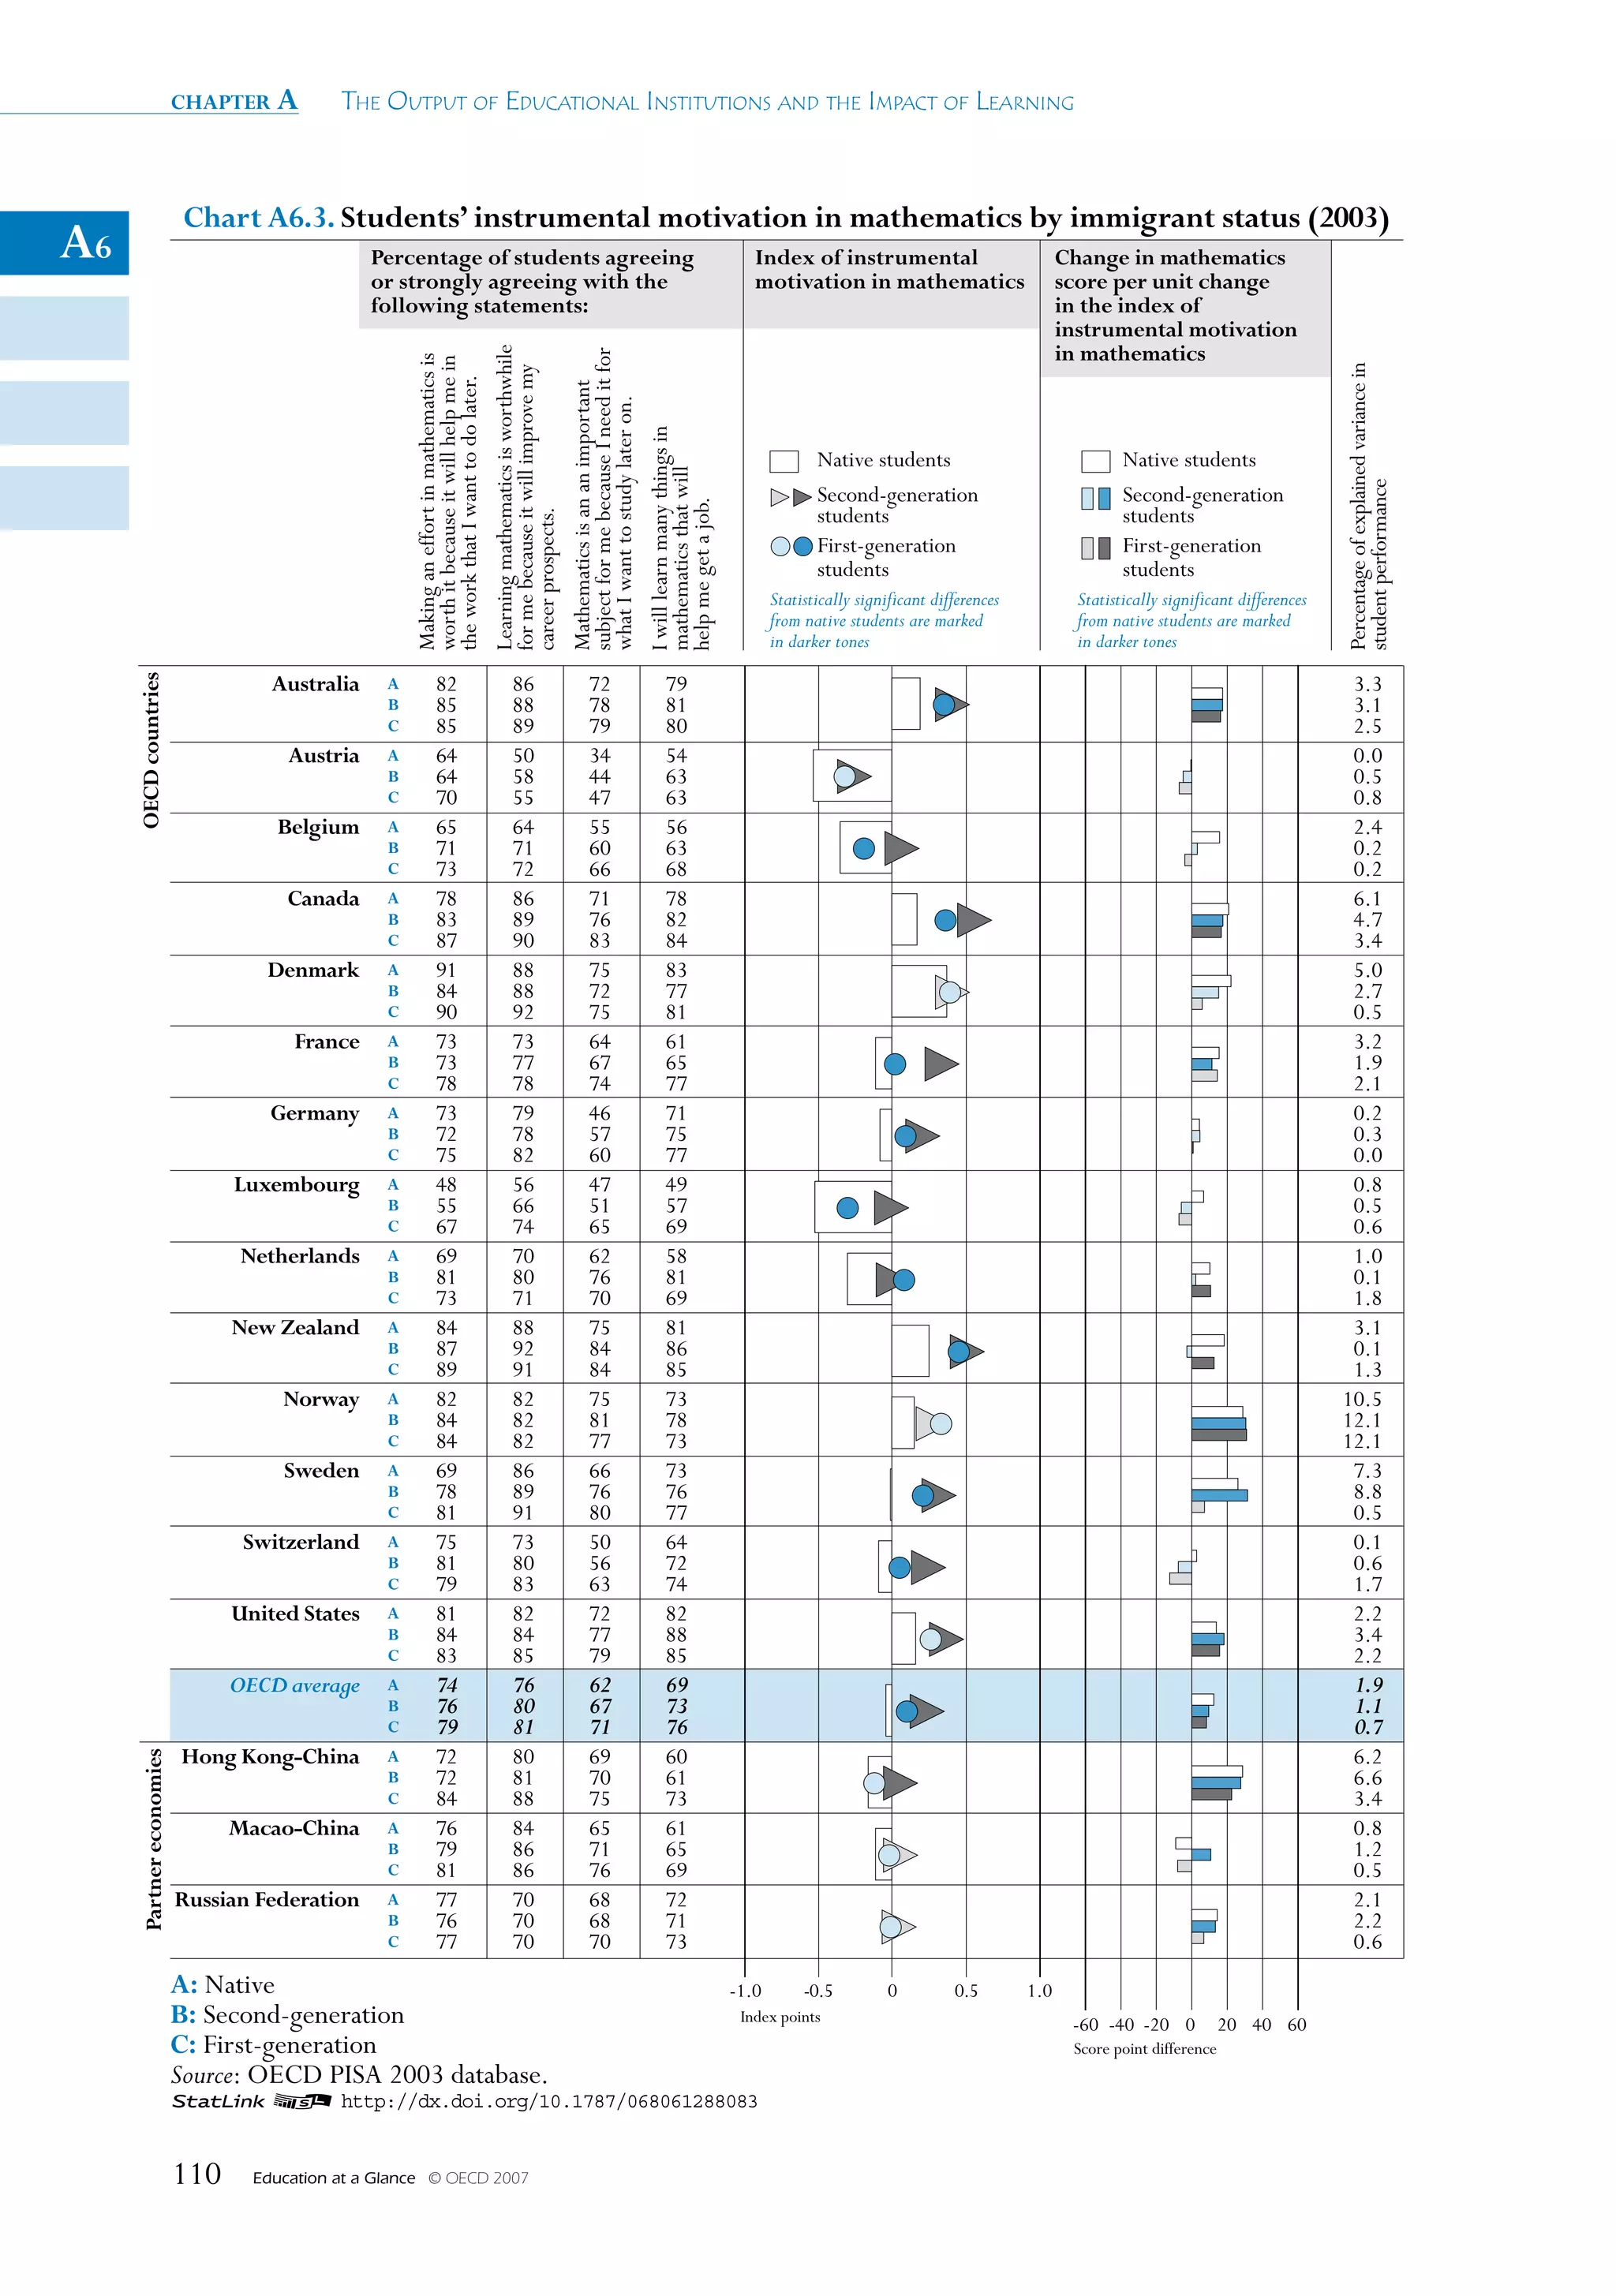
capacity to continue learning throughout life? Chart A6.3 shows that these students report no
signs of a lack of instrumental motivation in mathematics (see also Box A5.1 in Indicator A5).
Despite performing less well on the whole than native students and generally coming from less
advantaged families, students who experience immigration first-hand tend to report, throughout
the OECD area, higher levels of instrumental motivation in mathematics than their native and
second-generation peers. In fact, in none of the countries studied do students with an immigrant
background report lower levels of interest. Much of this difference remains after accounting for
socio-economic aspects as well as student performance in mathematics. The consistency of this
finding is striking, given the substantial differences between countries in terms of immigration
histories, immigrant populations, immigration and integration policies, and the performance of
students with immigration background in PISA.
This points to areas where schools and policy makers could develop additional programmes to
seek to reduce achievement gaps by using the strong instrumental motivation of students with an
immigrant background. Schools and teachers may need to pay additional attention to reducing
differences in these essential non-achievement outcomes. This could prove beneficial not only
for these students’ potential to learn throughout life, but also for helping to increase their level
of achievement.
Education at a Glance © OECD 2007 109](https://image.slidesharecdn.com/educacionsegunocde2007-100705022559-phpapp01/75/Educacion-OCDE-2007-109-2048.jpg)


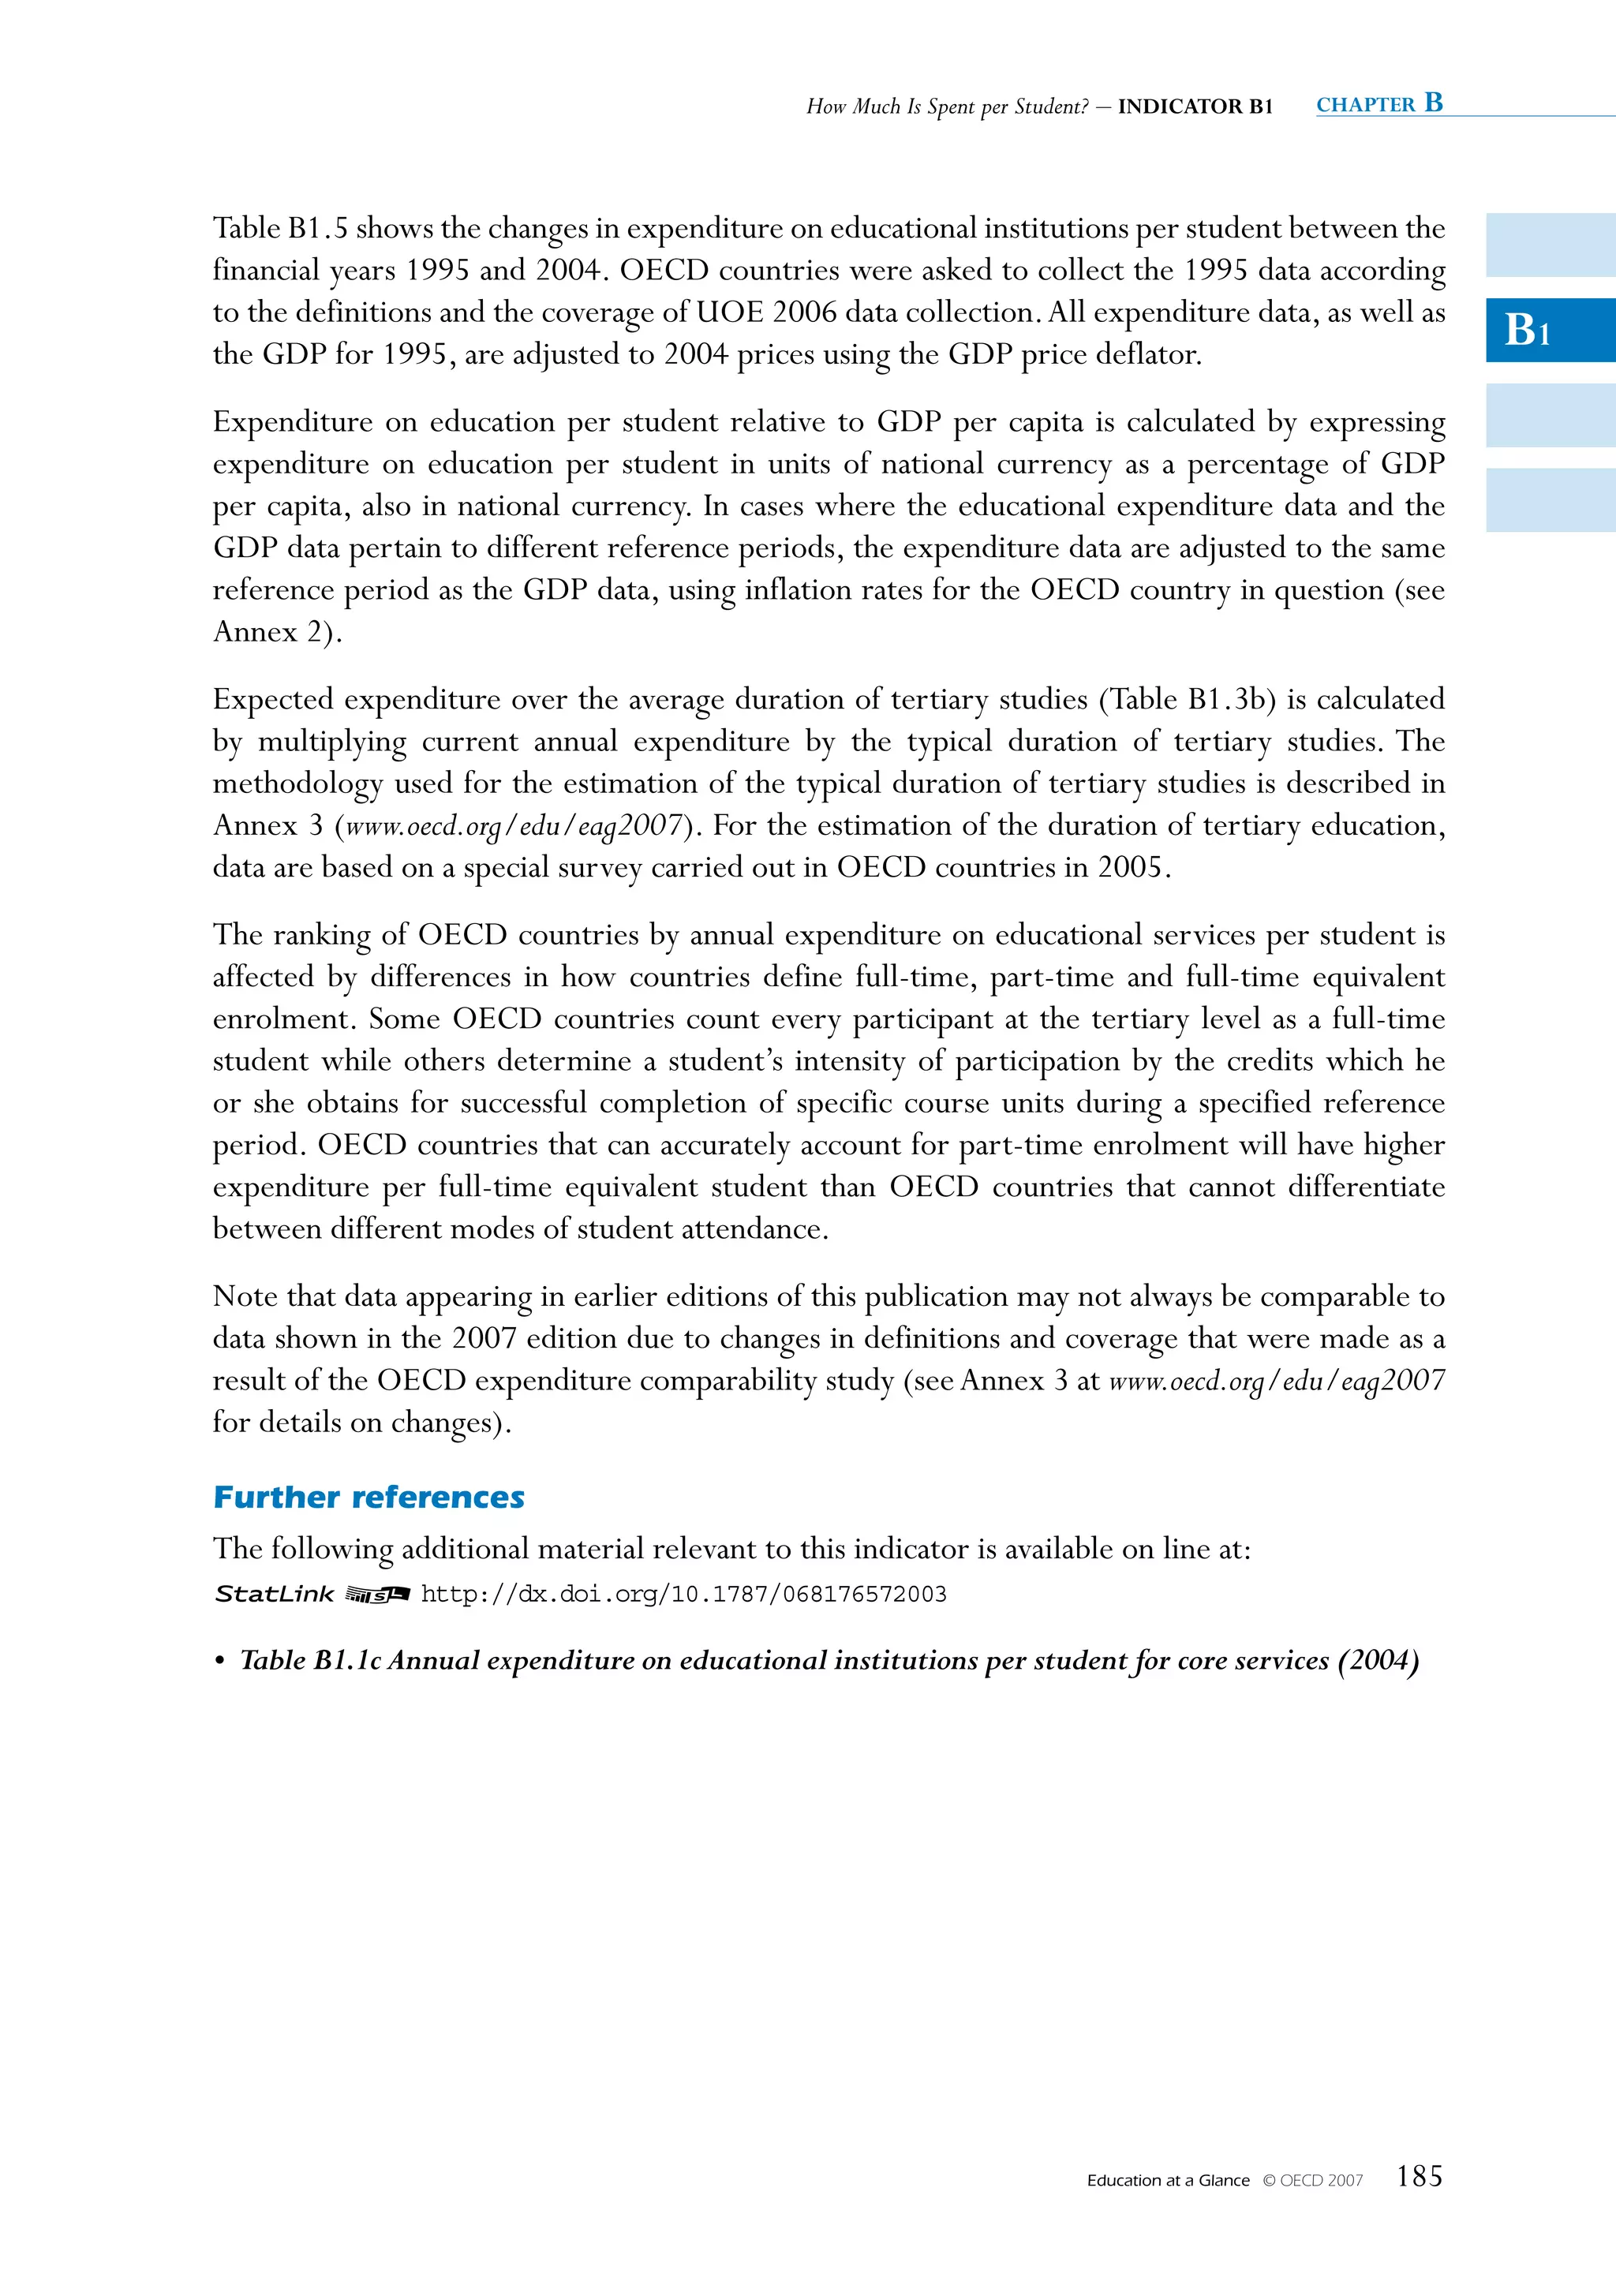


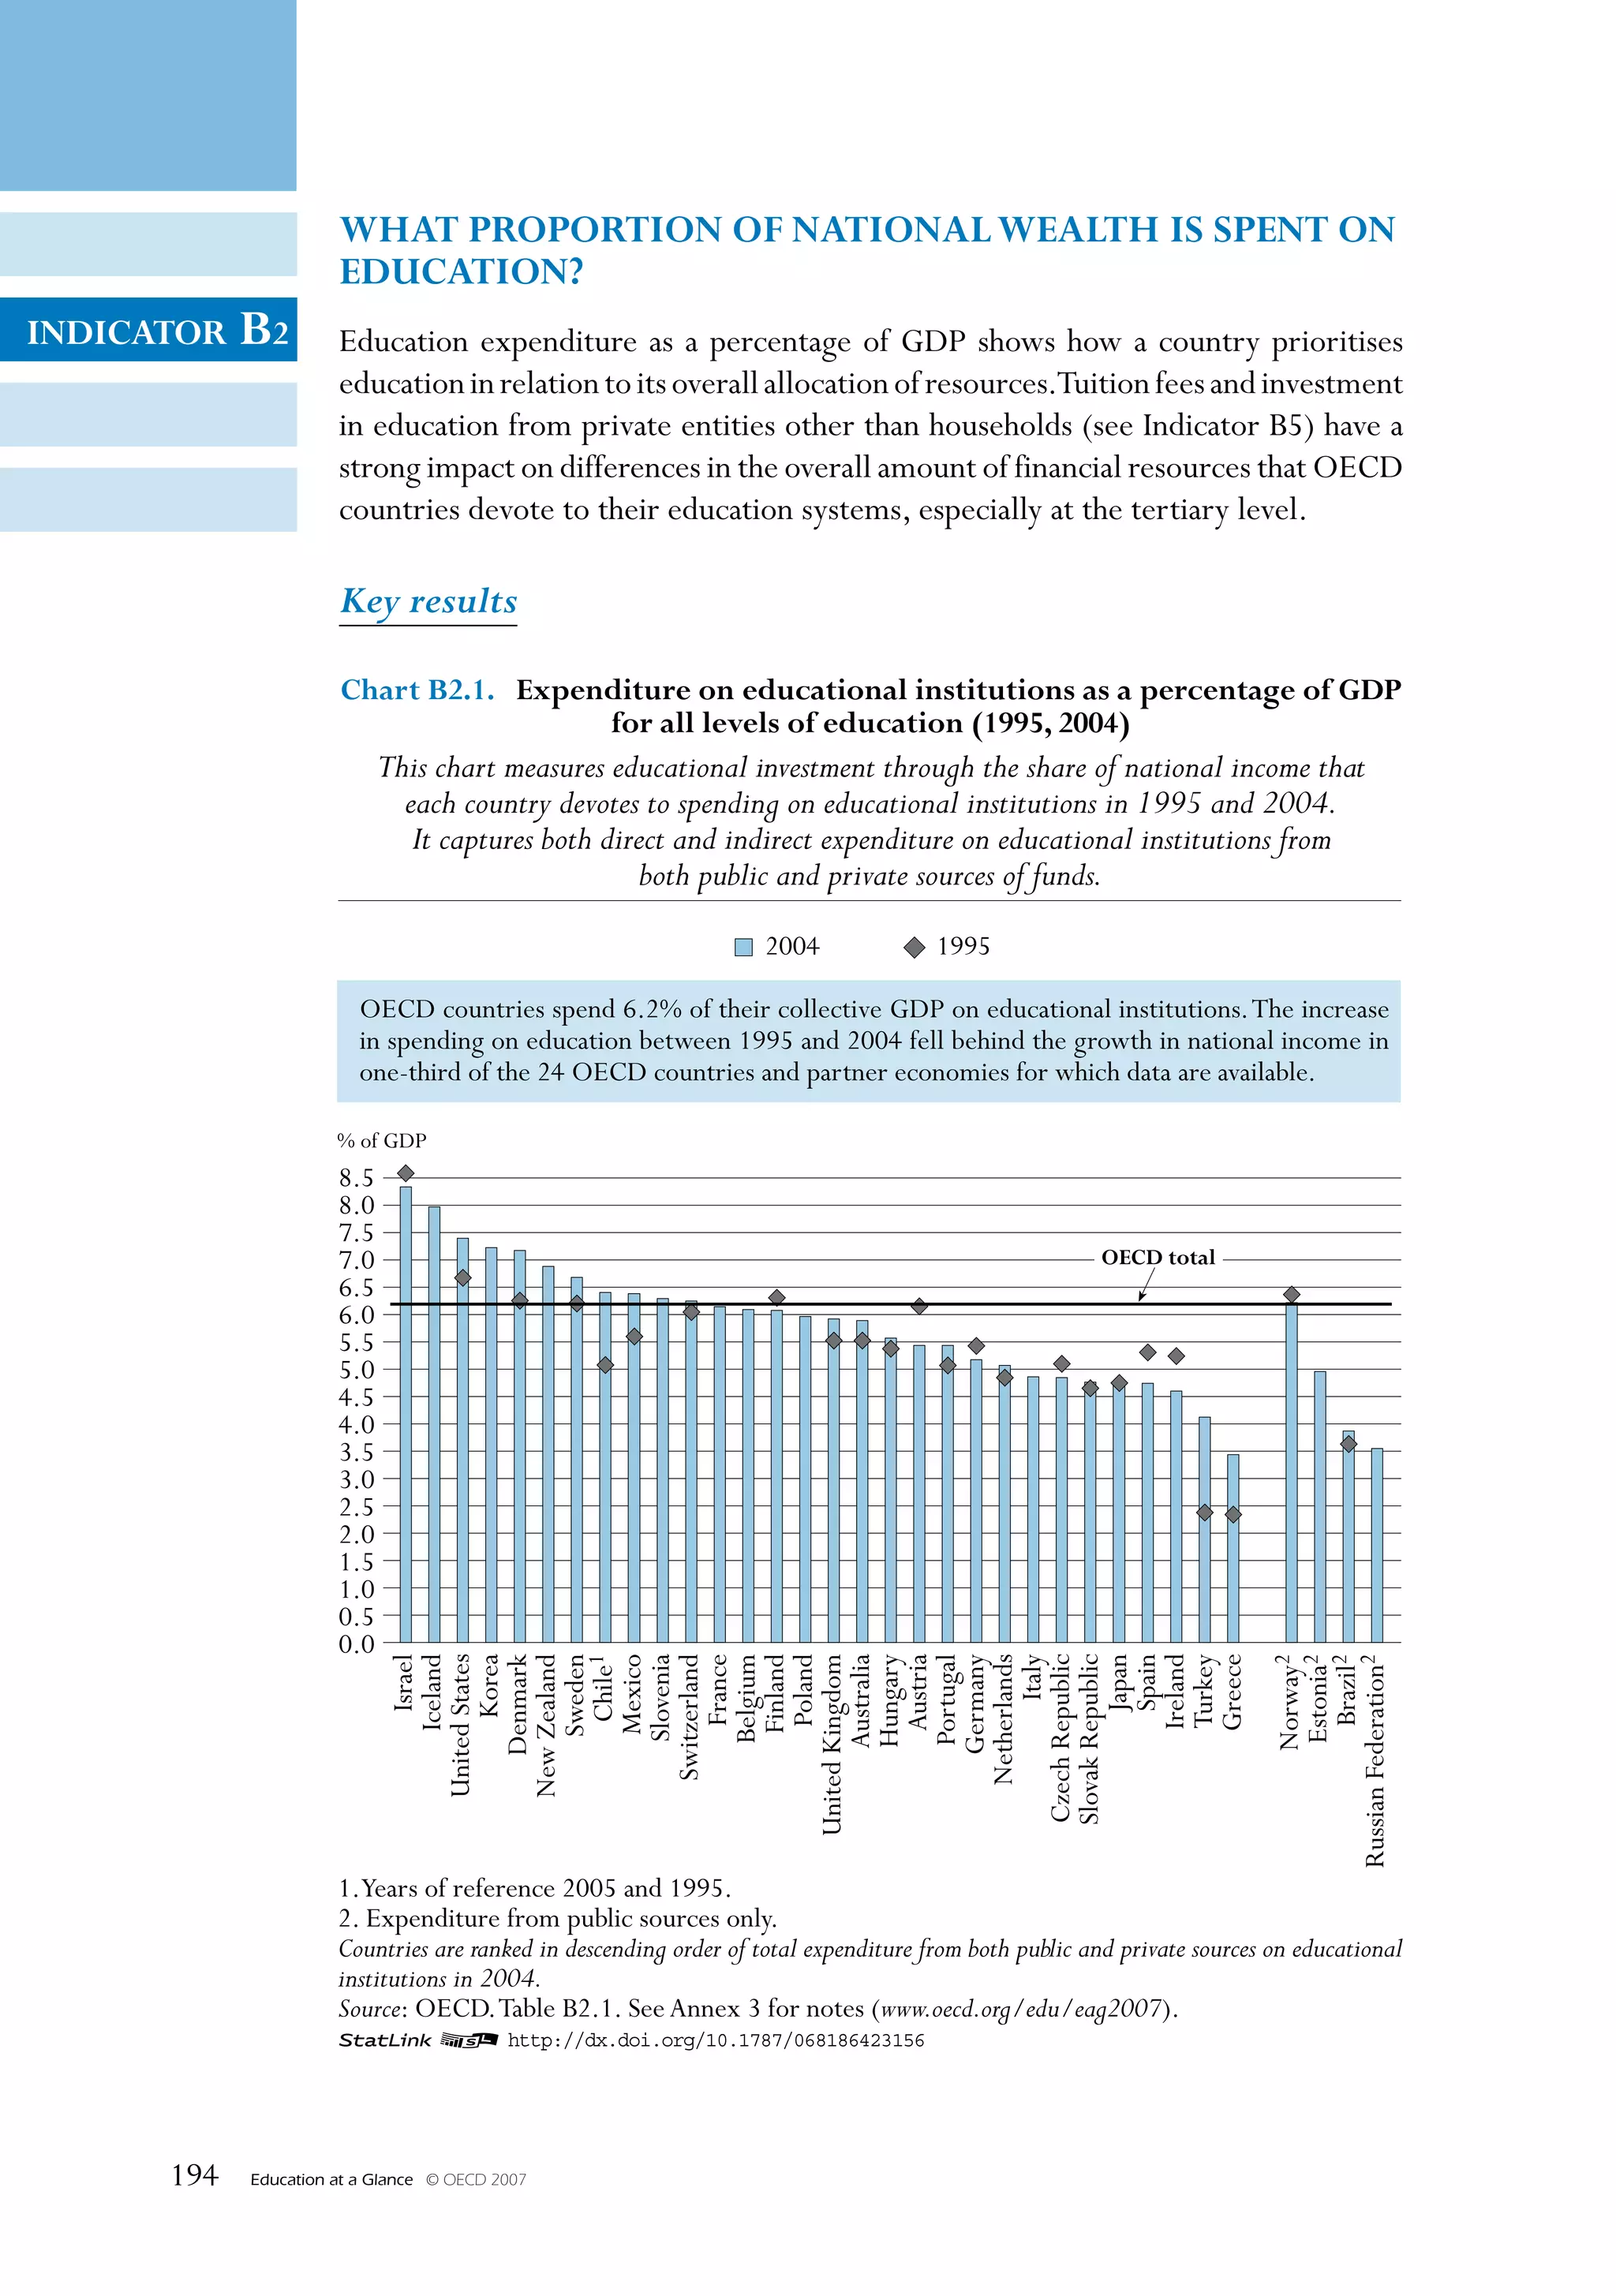

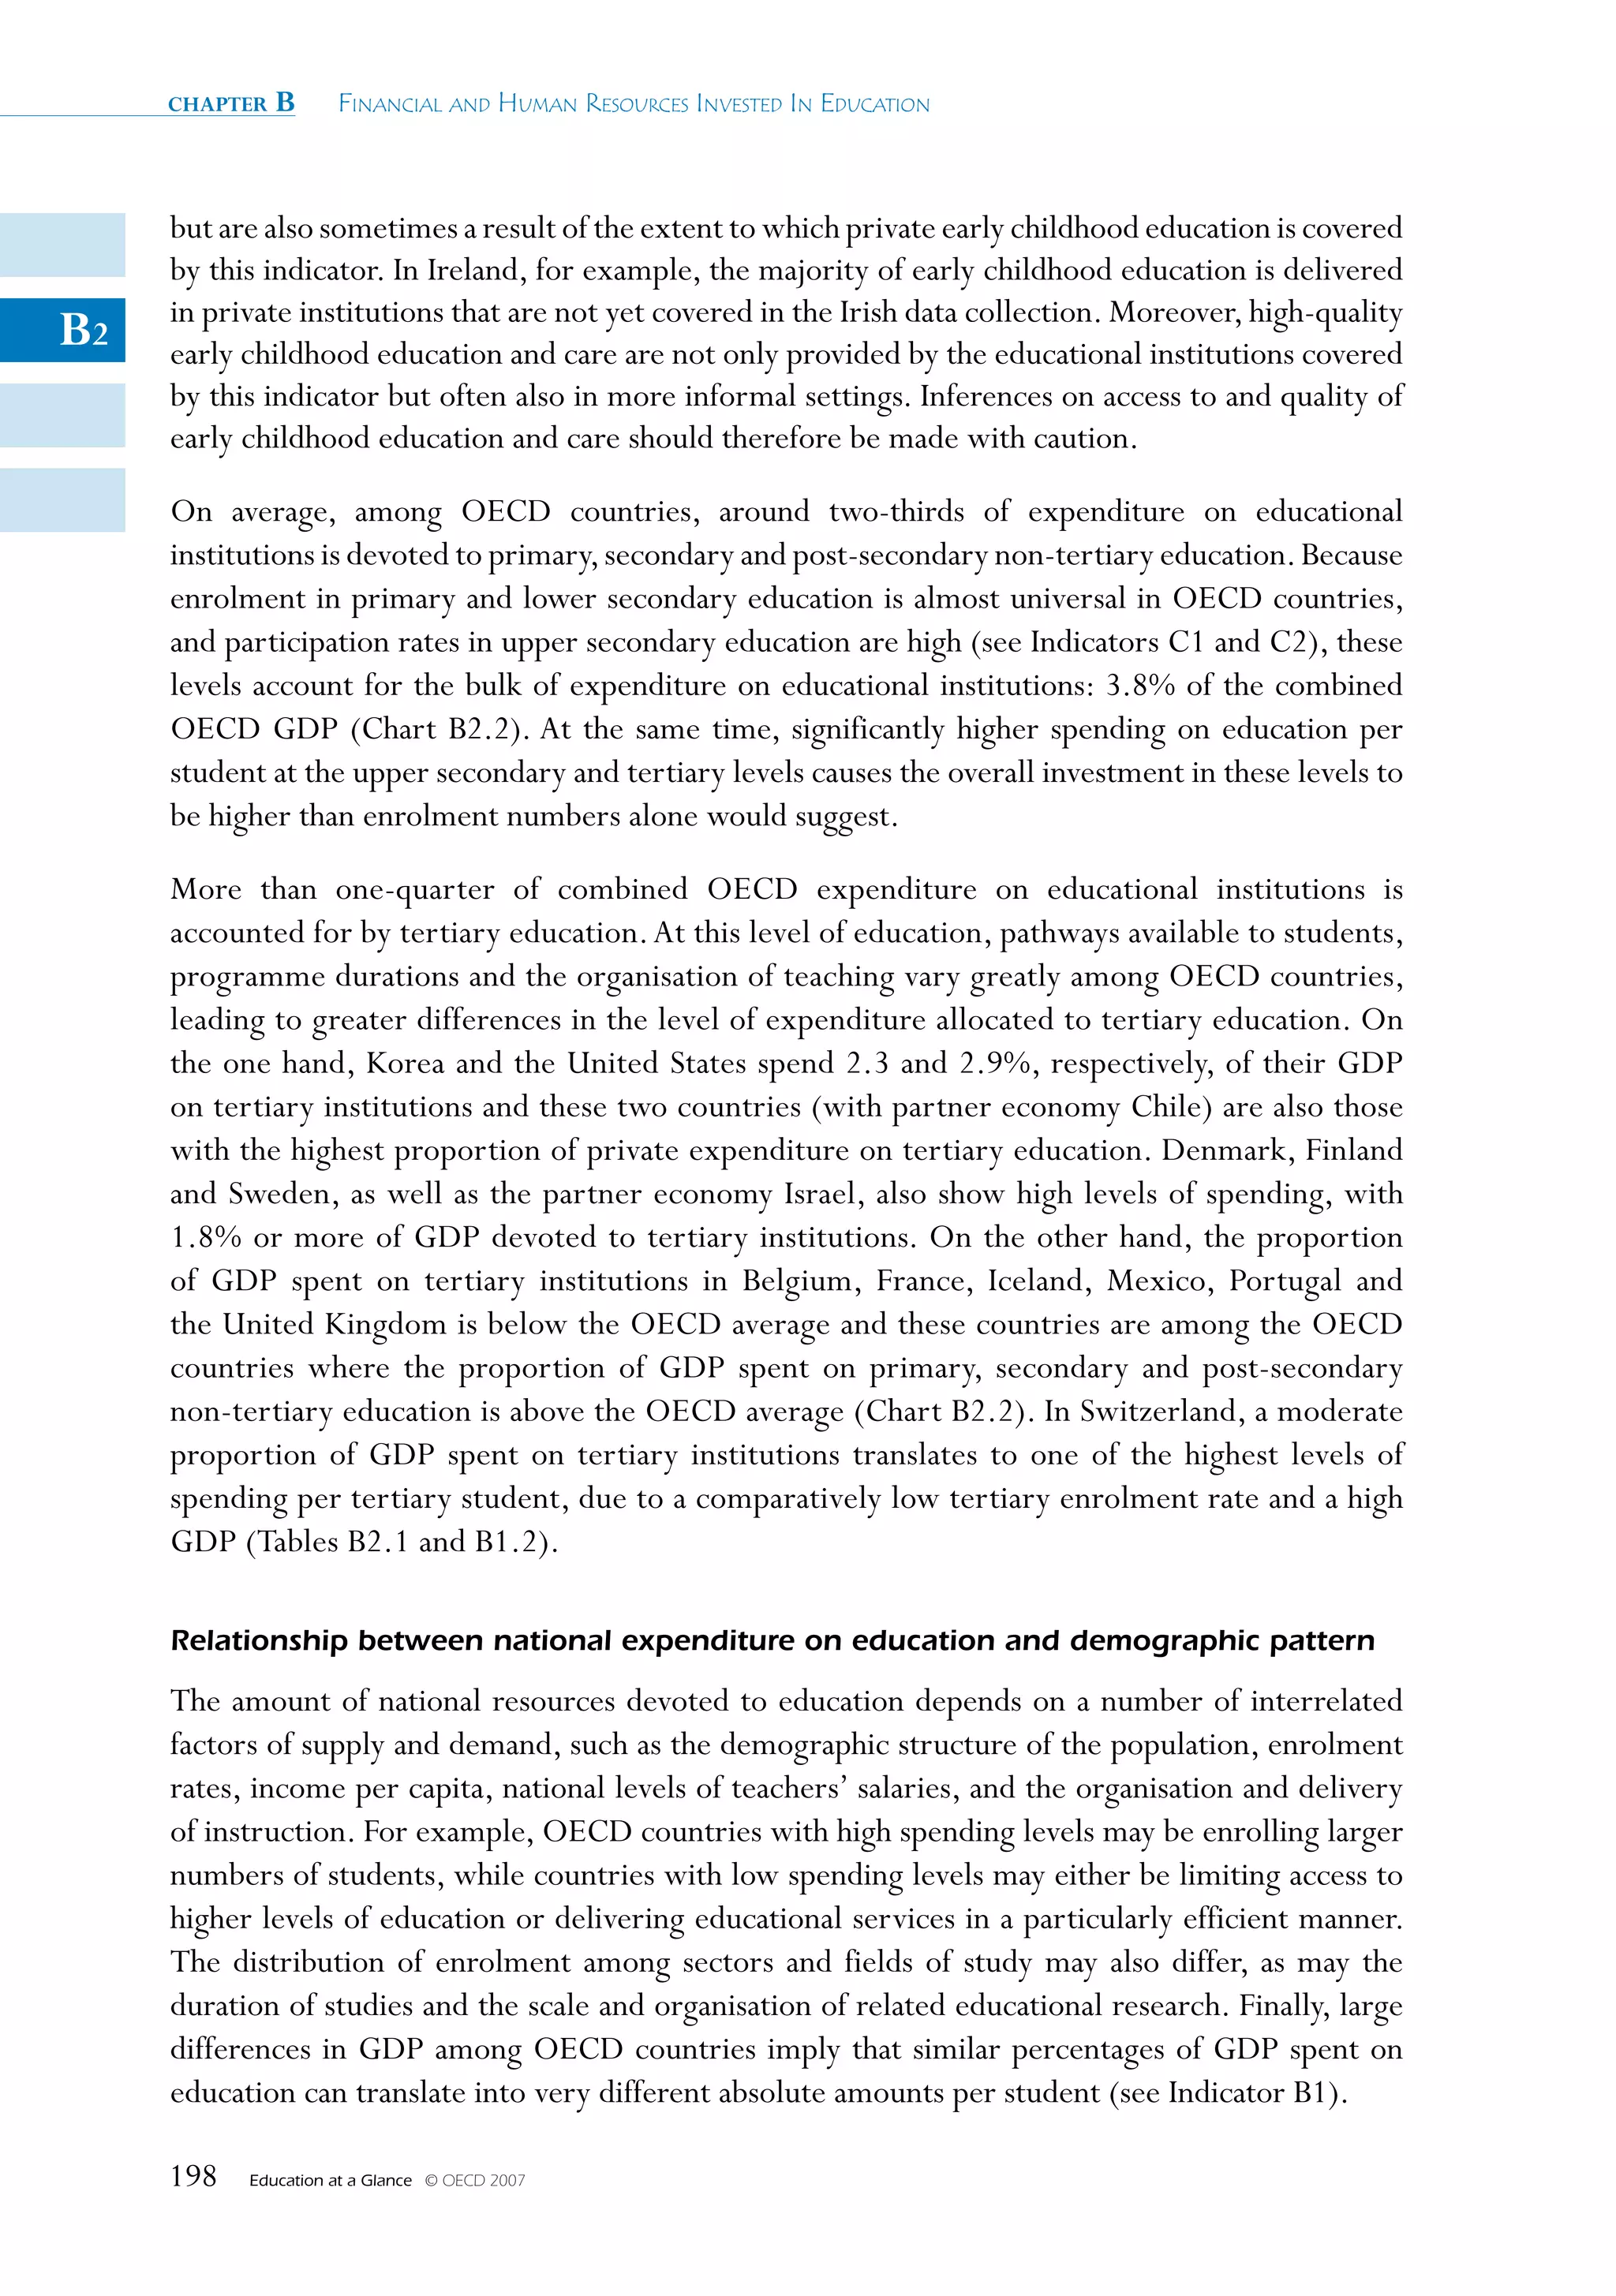
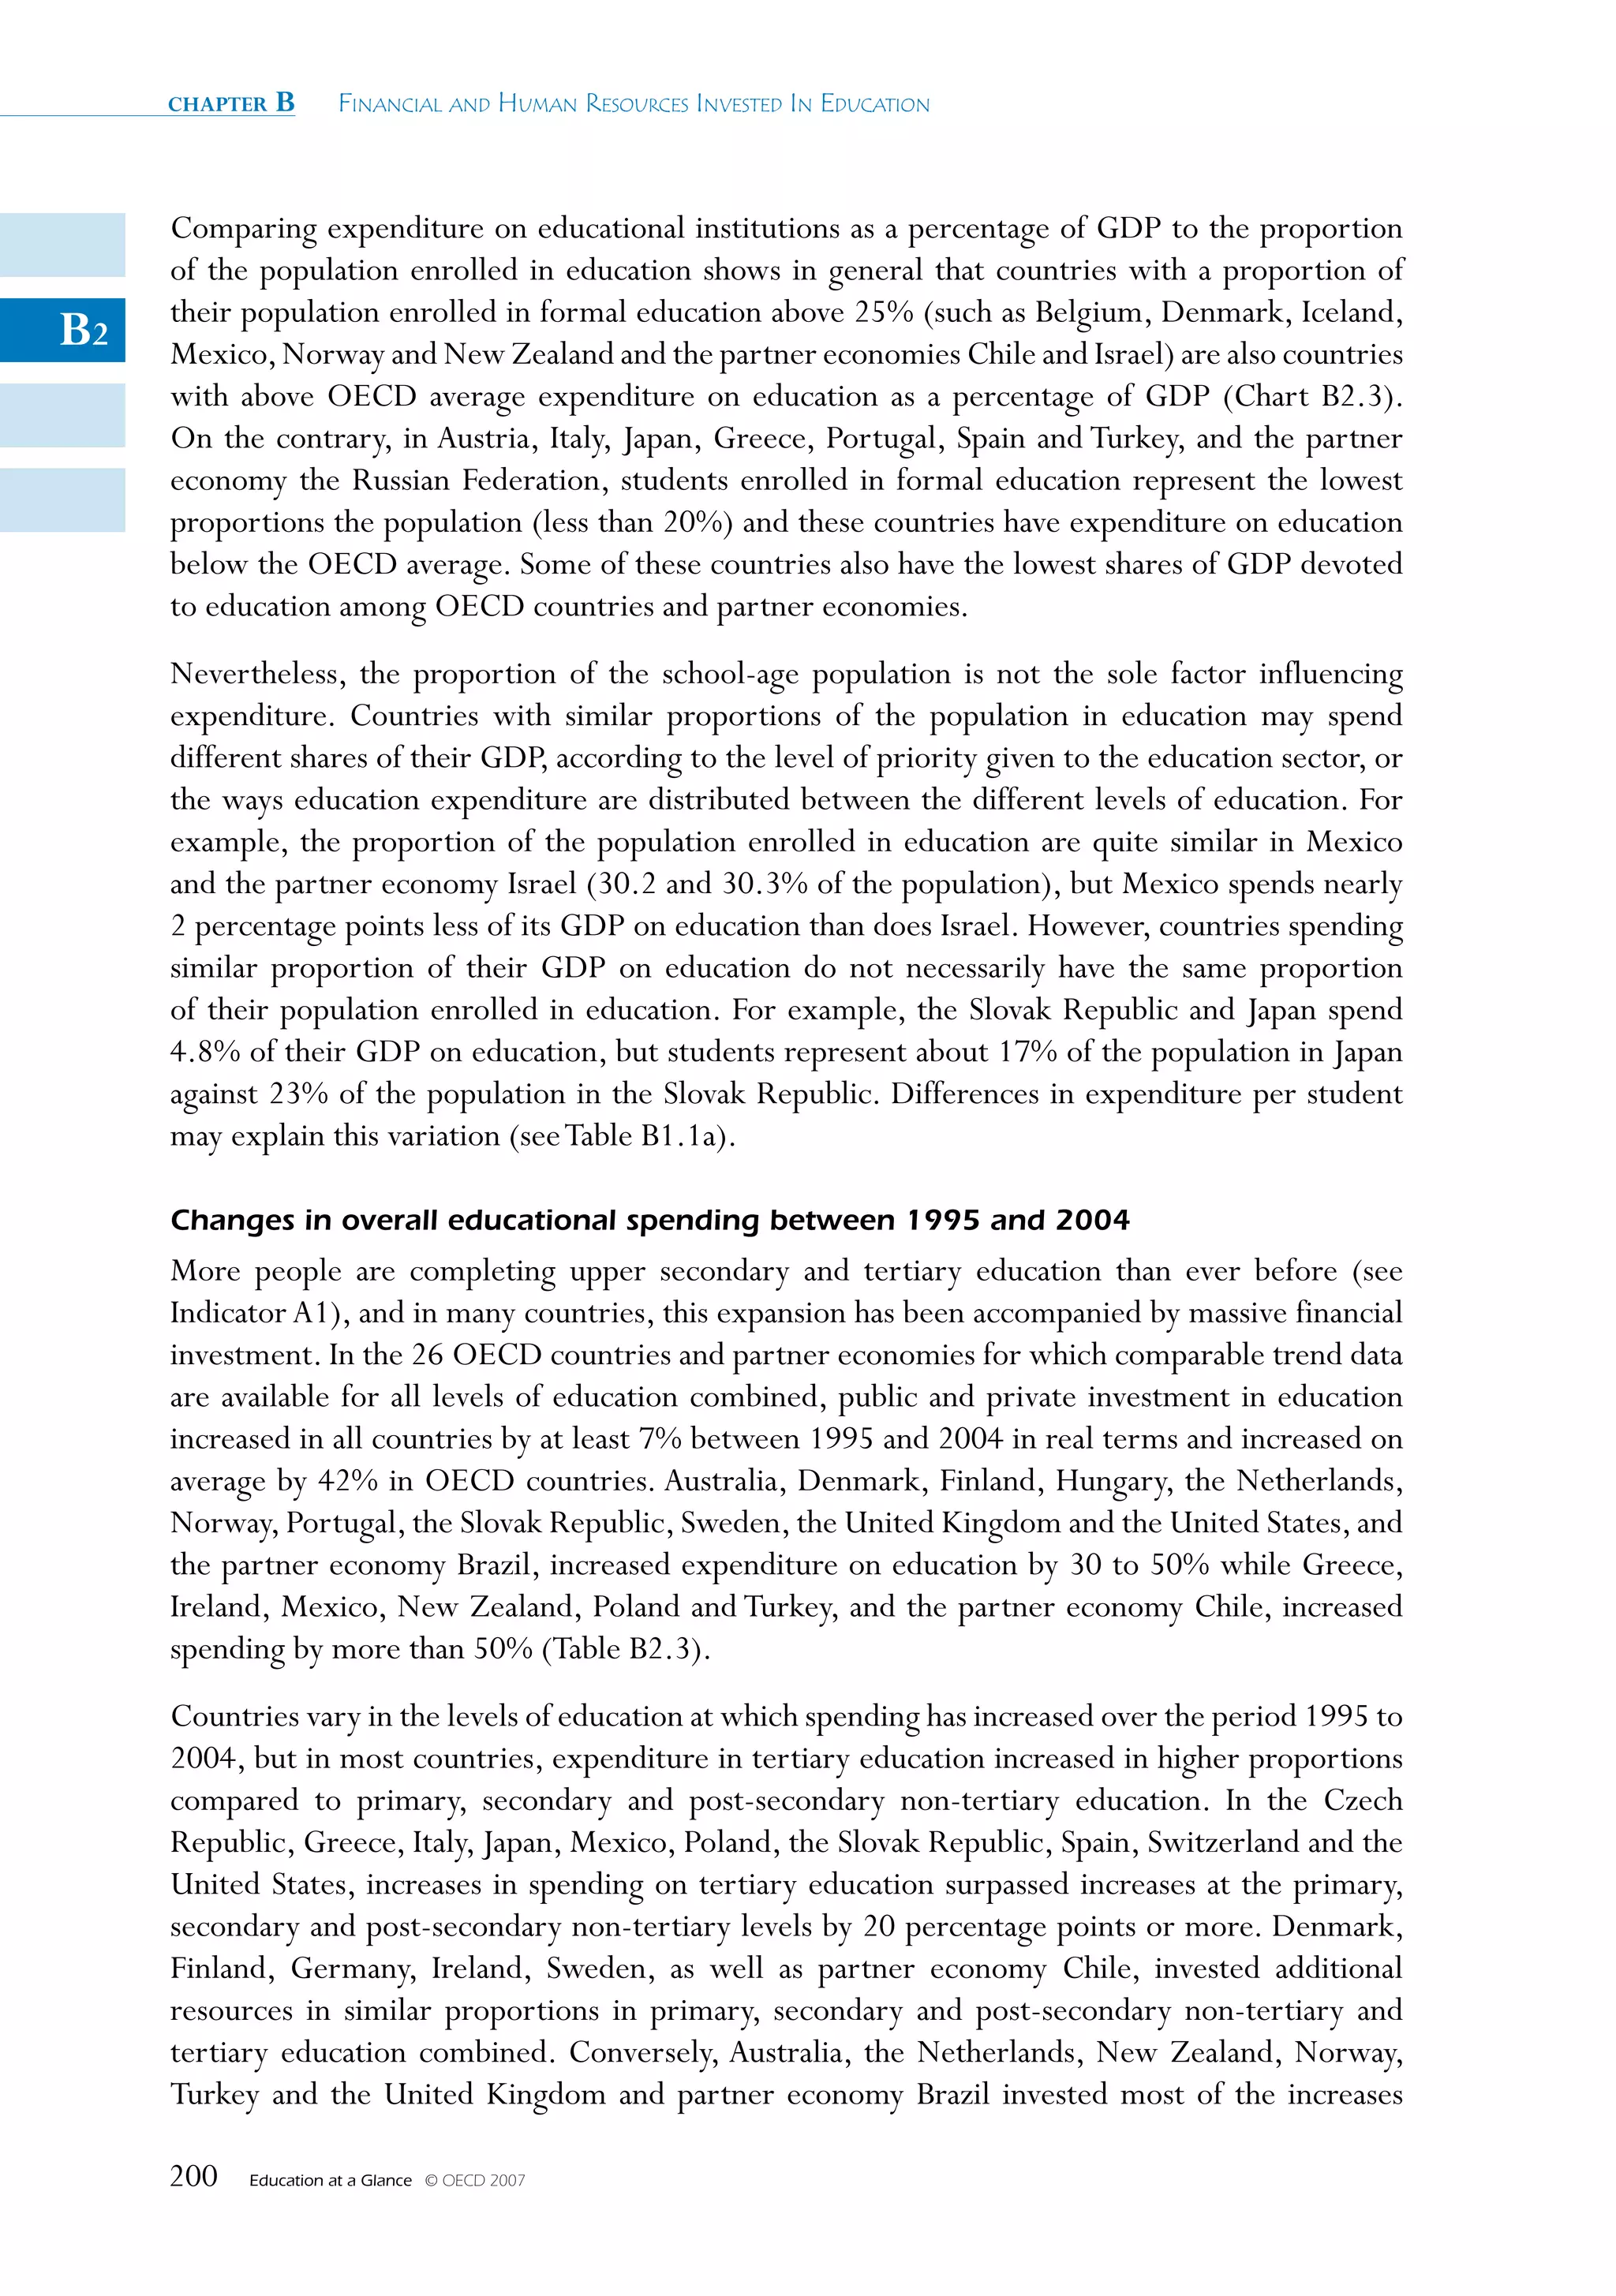


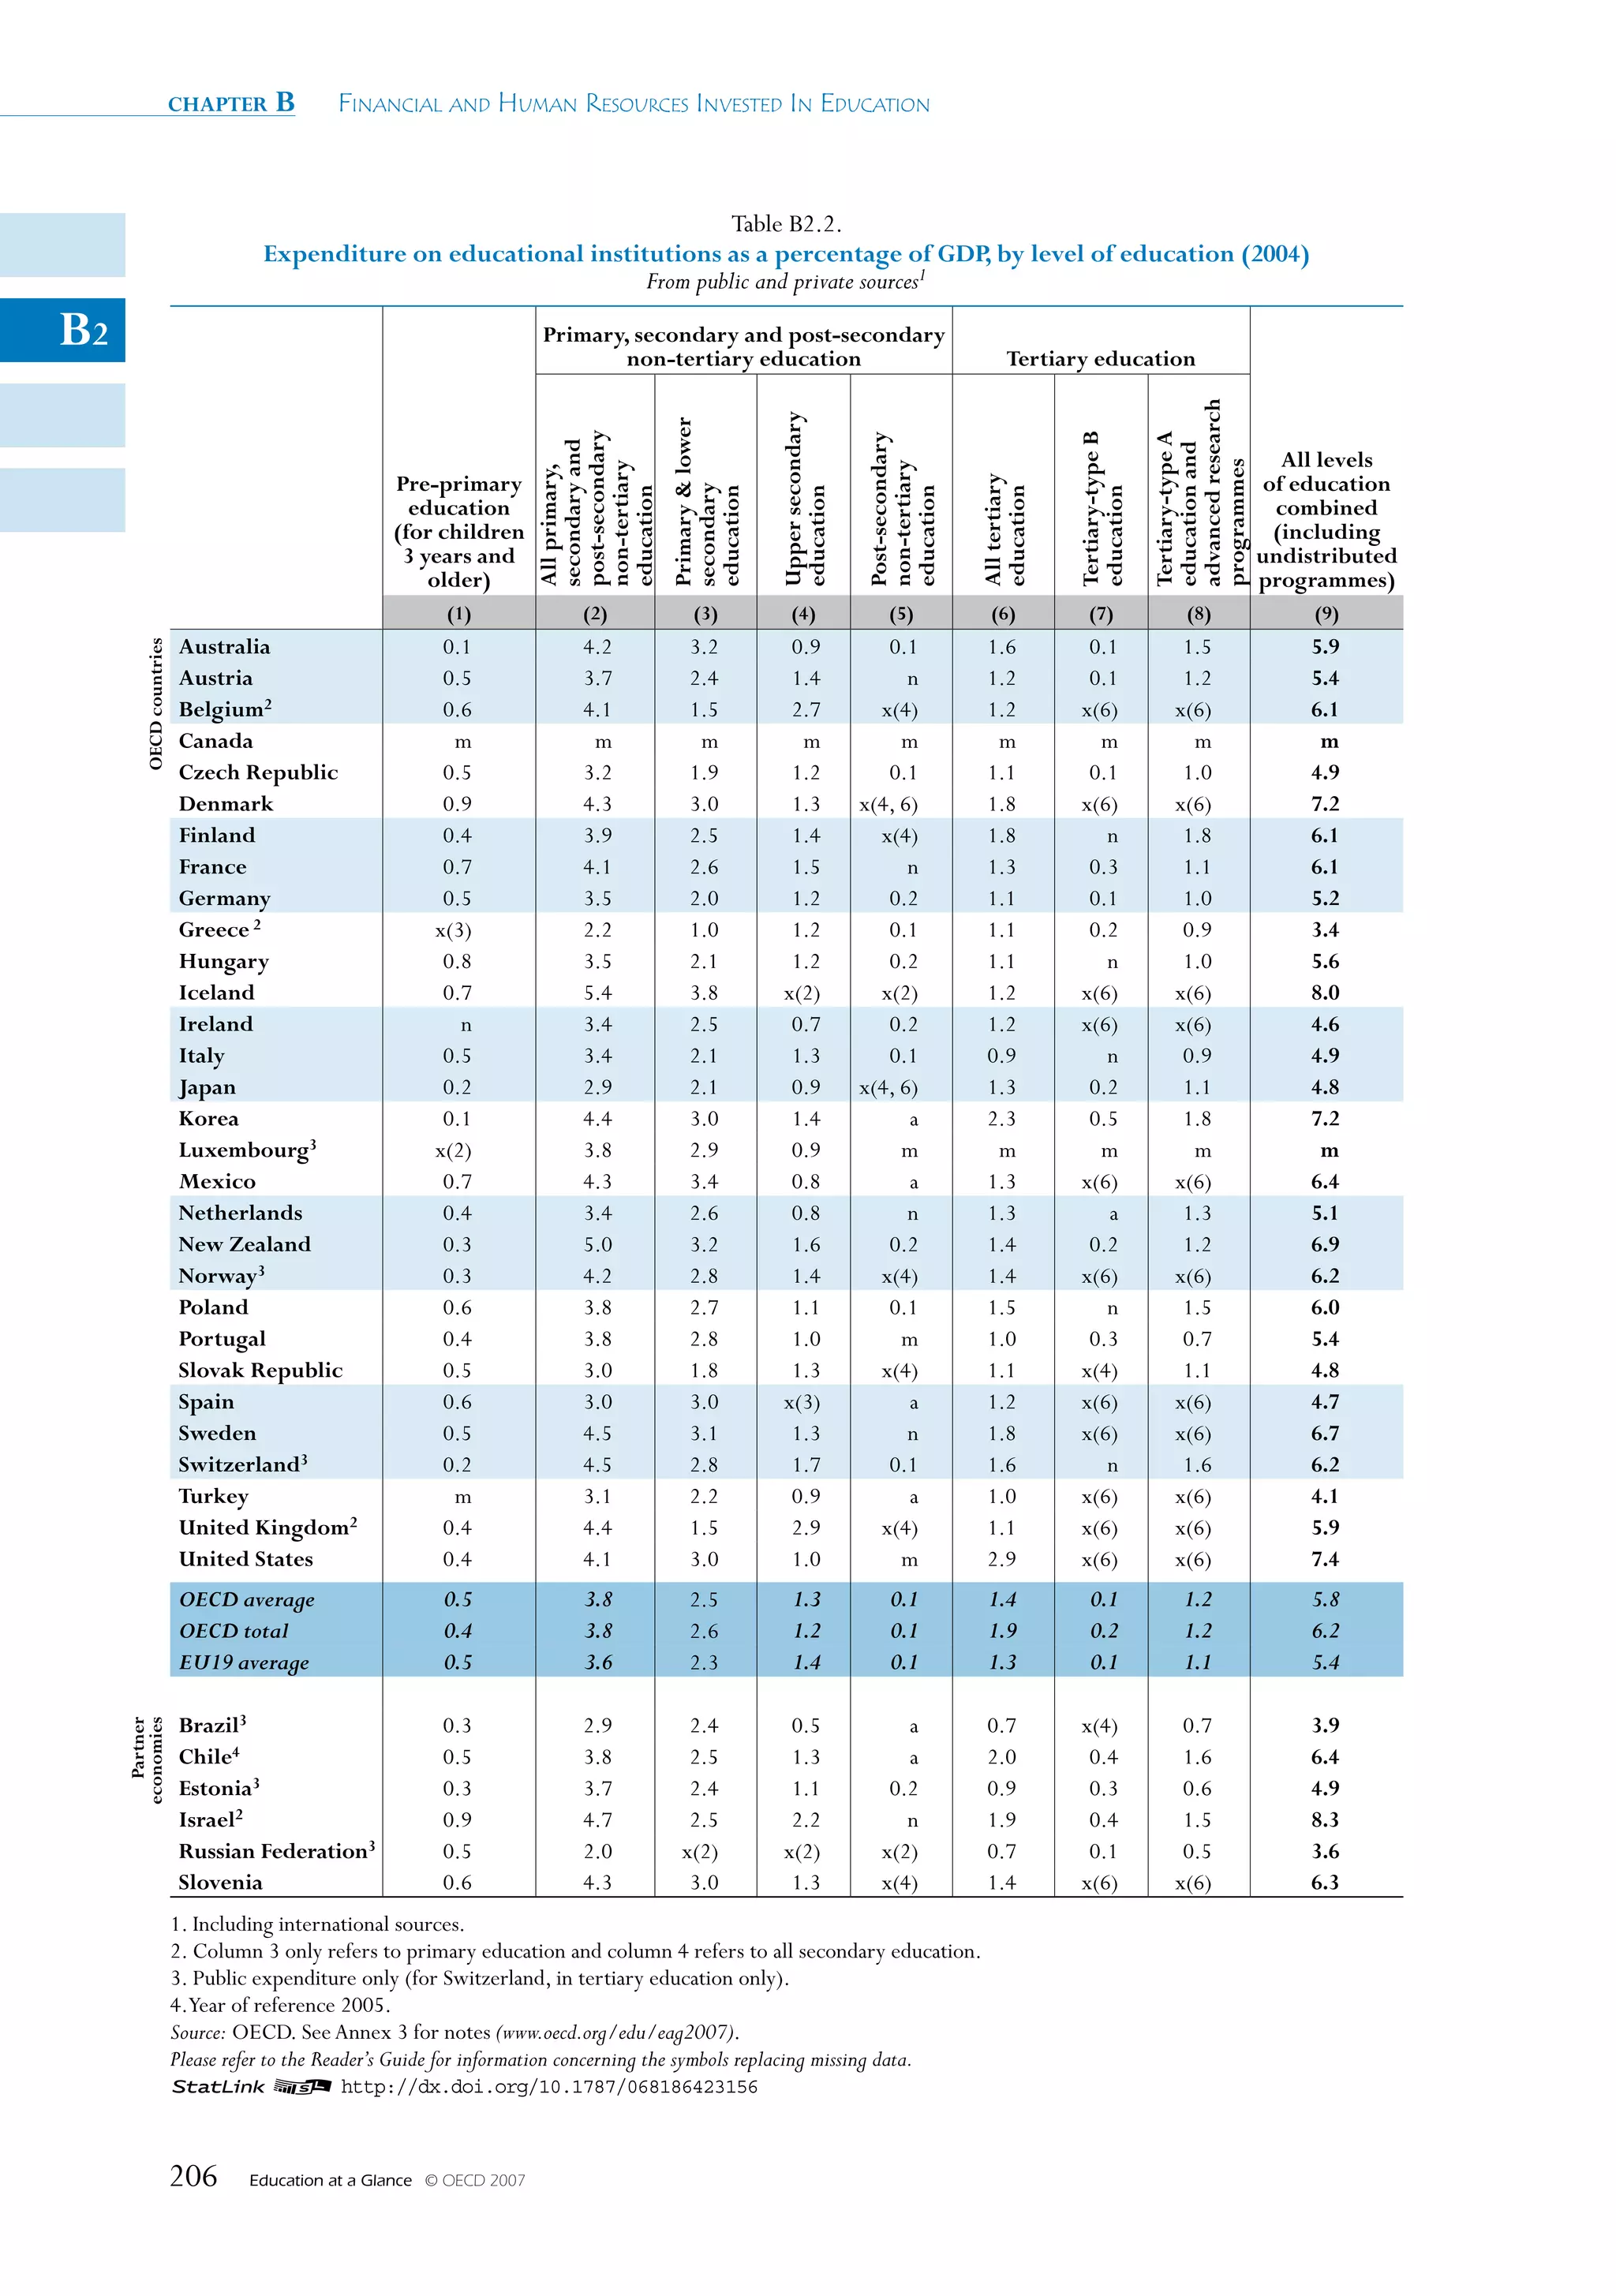
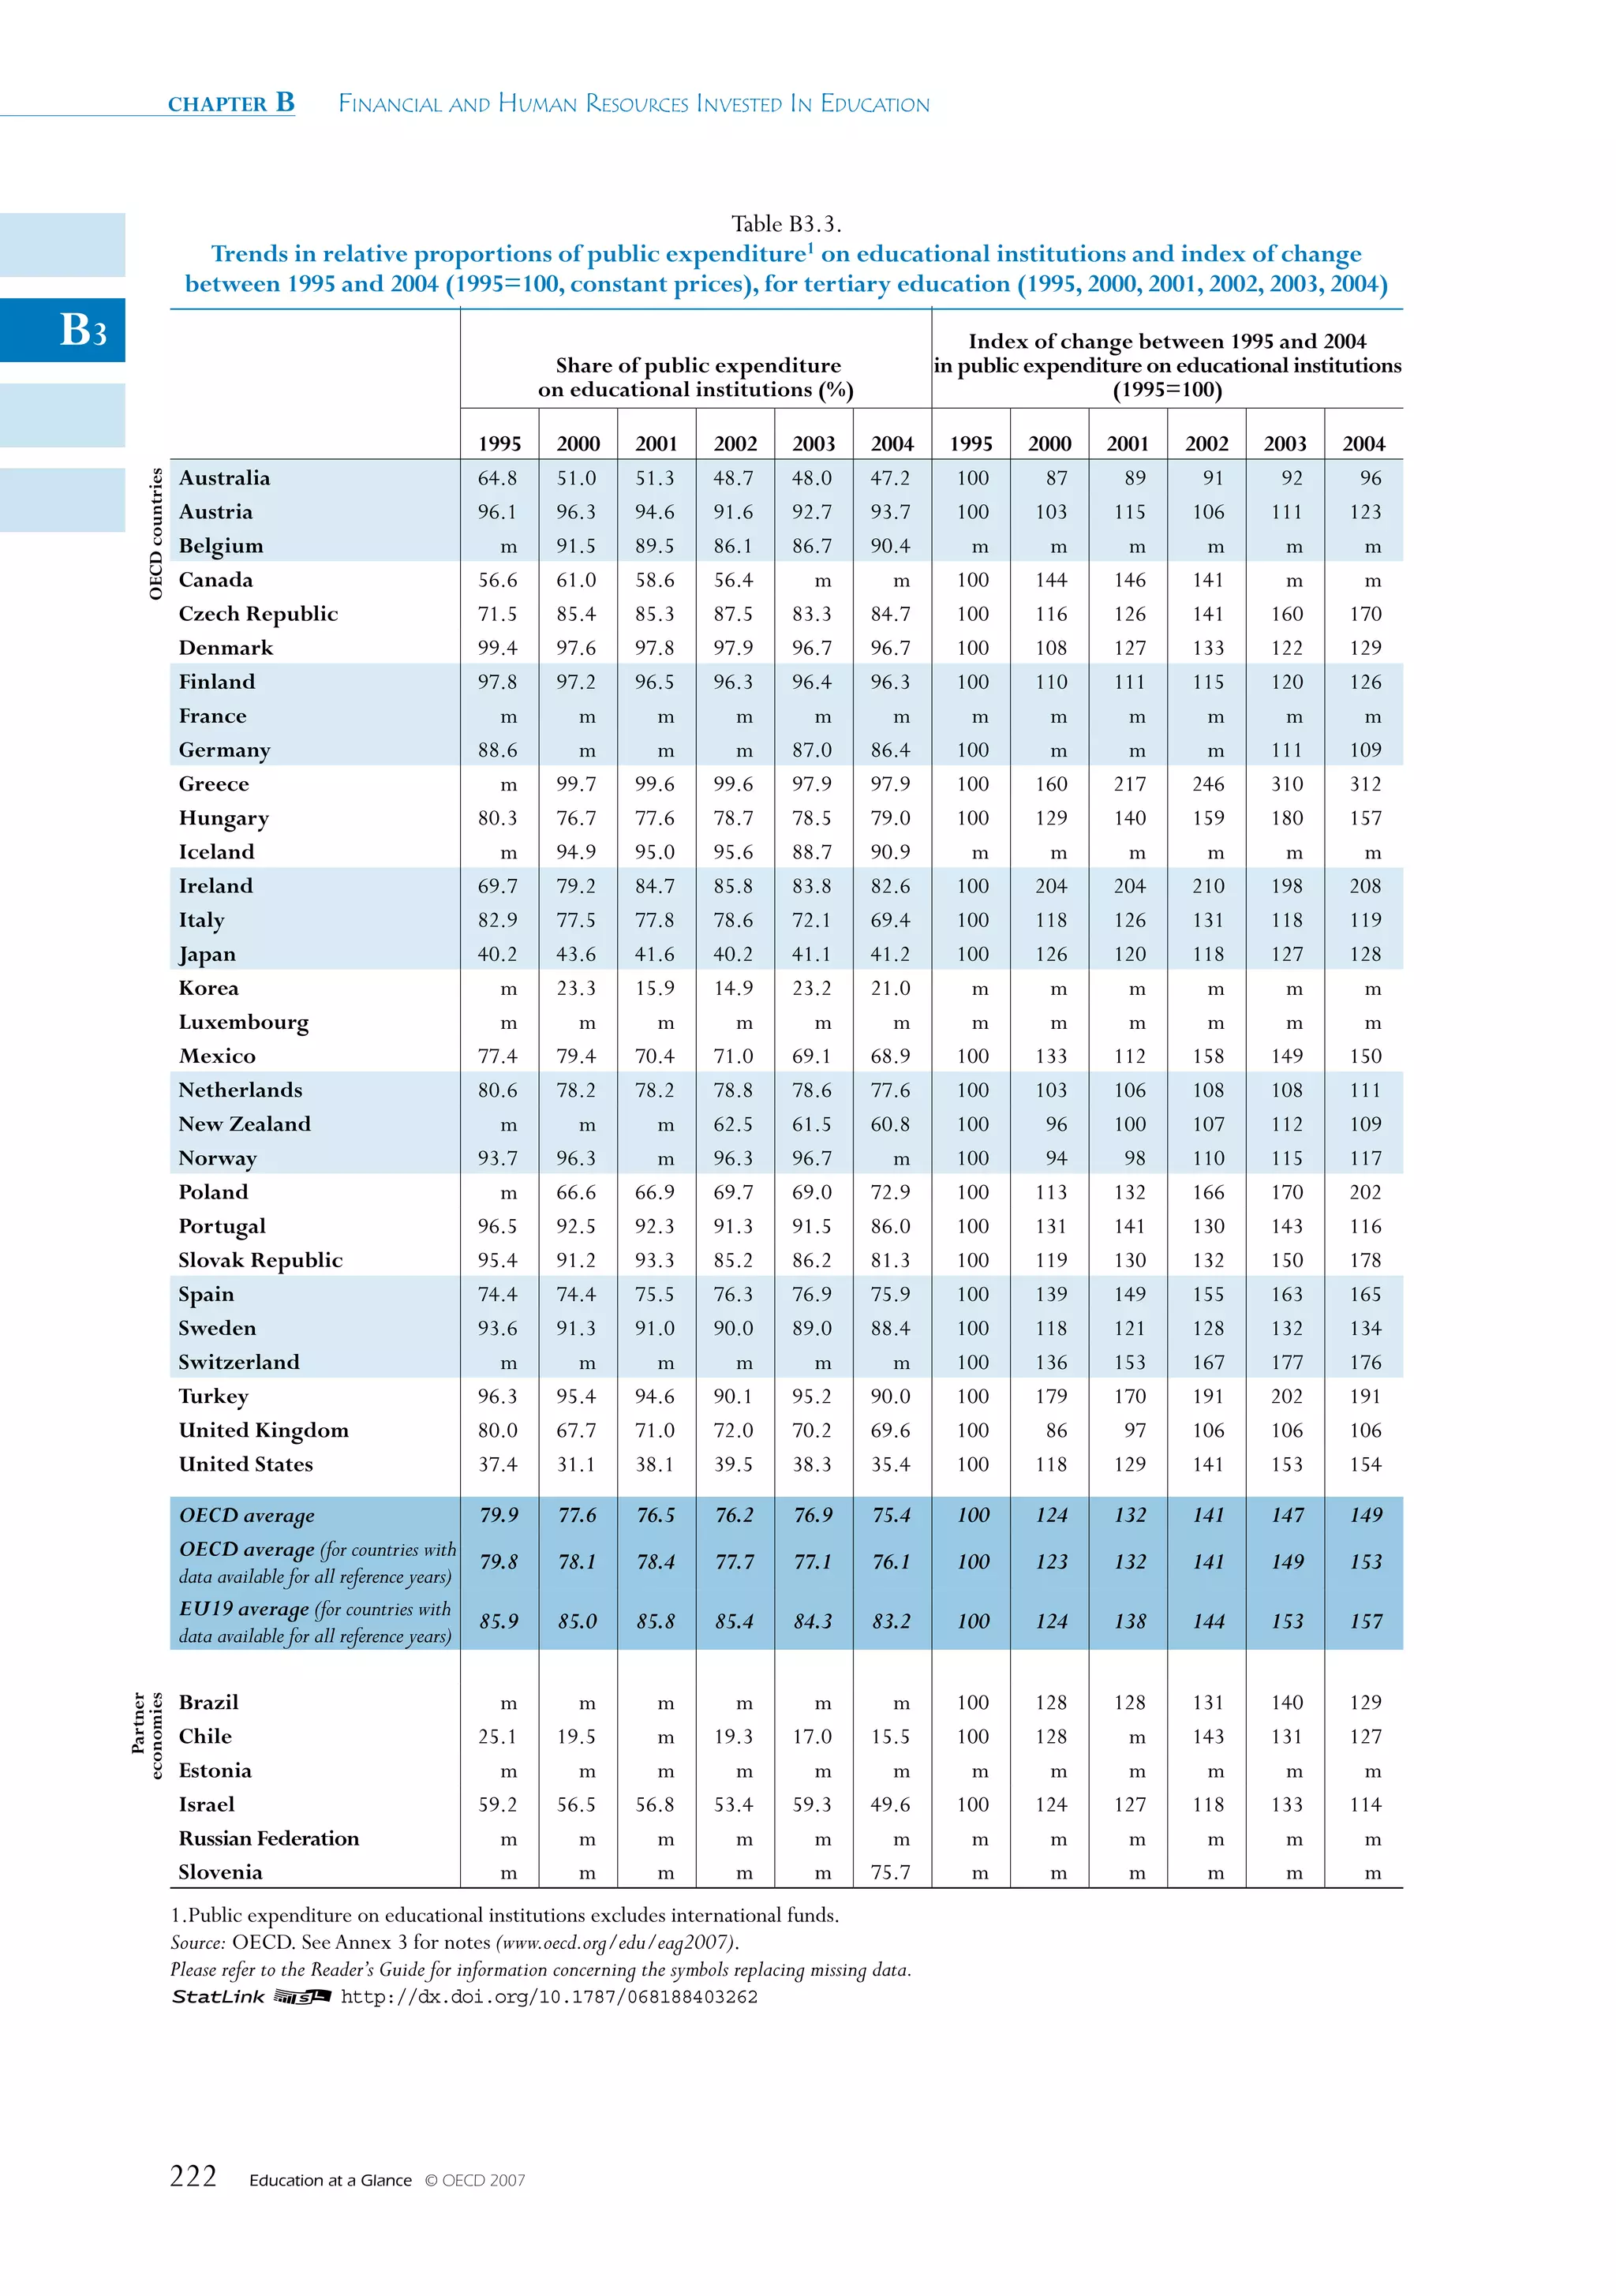
![What Proportion of National Wealth Is Spent on Education? – INDICATOR B2 chapter B
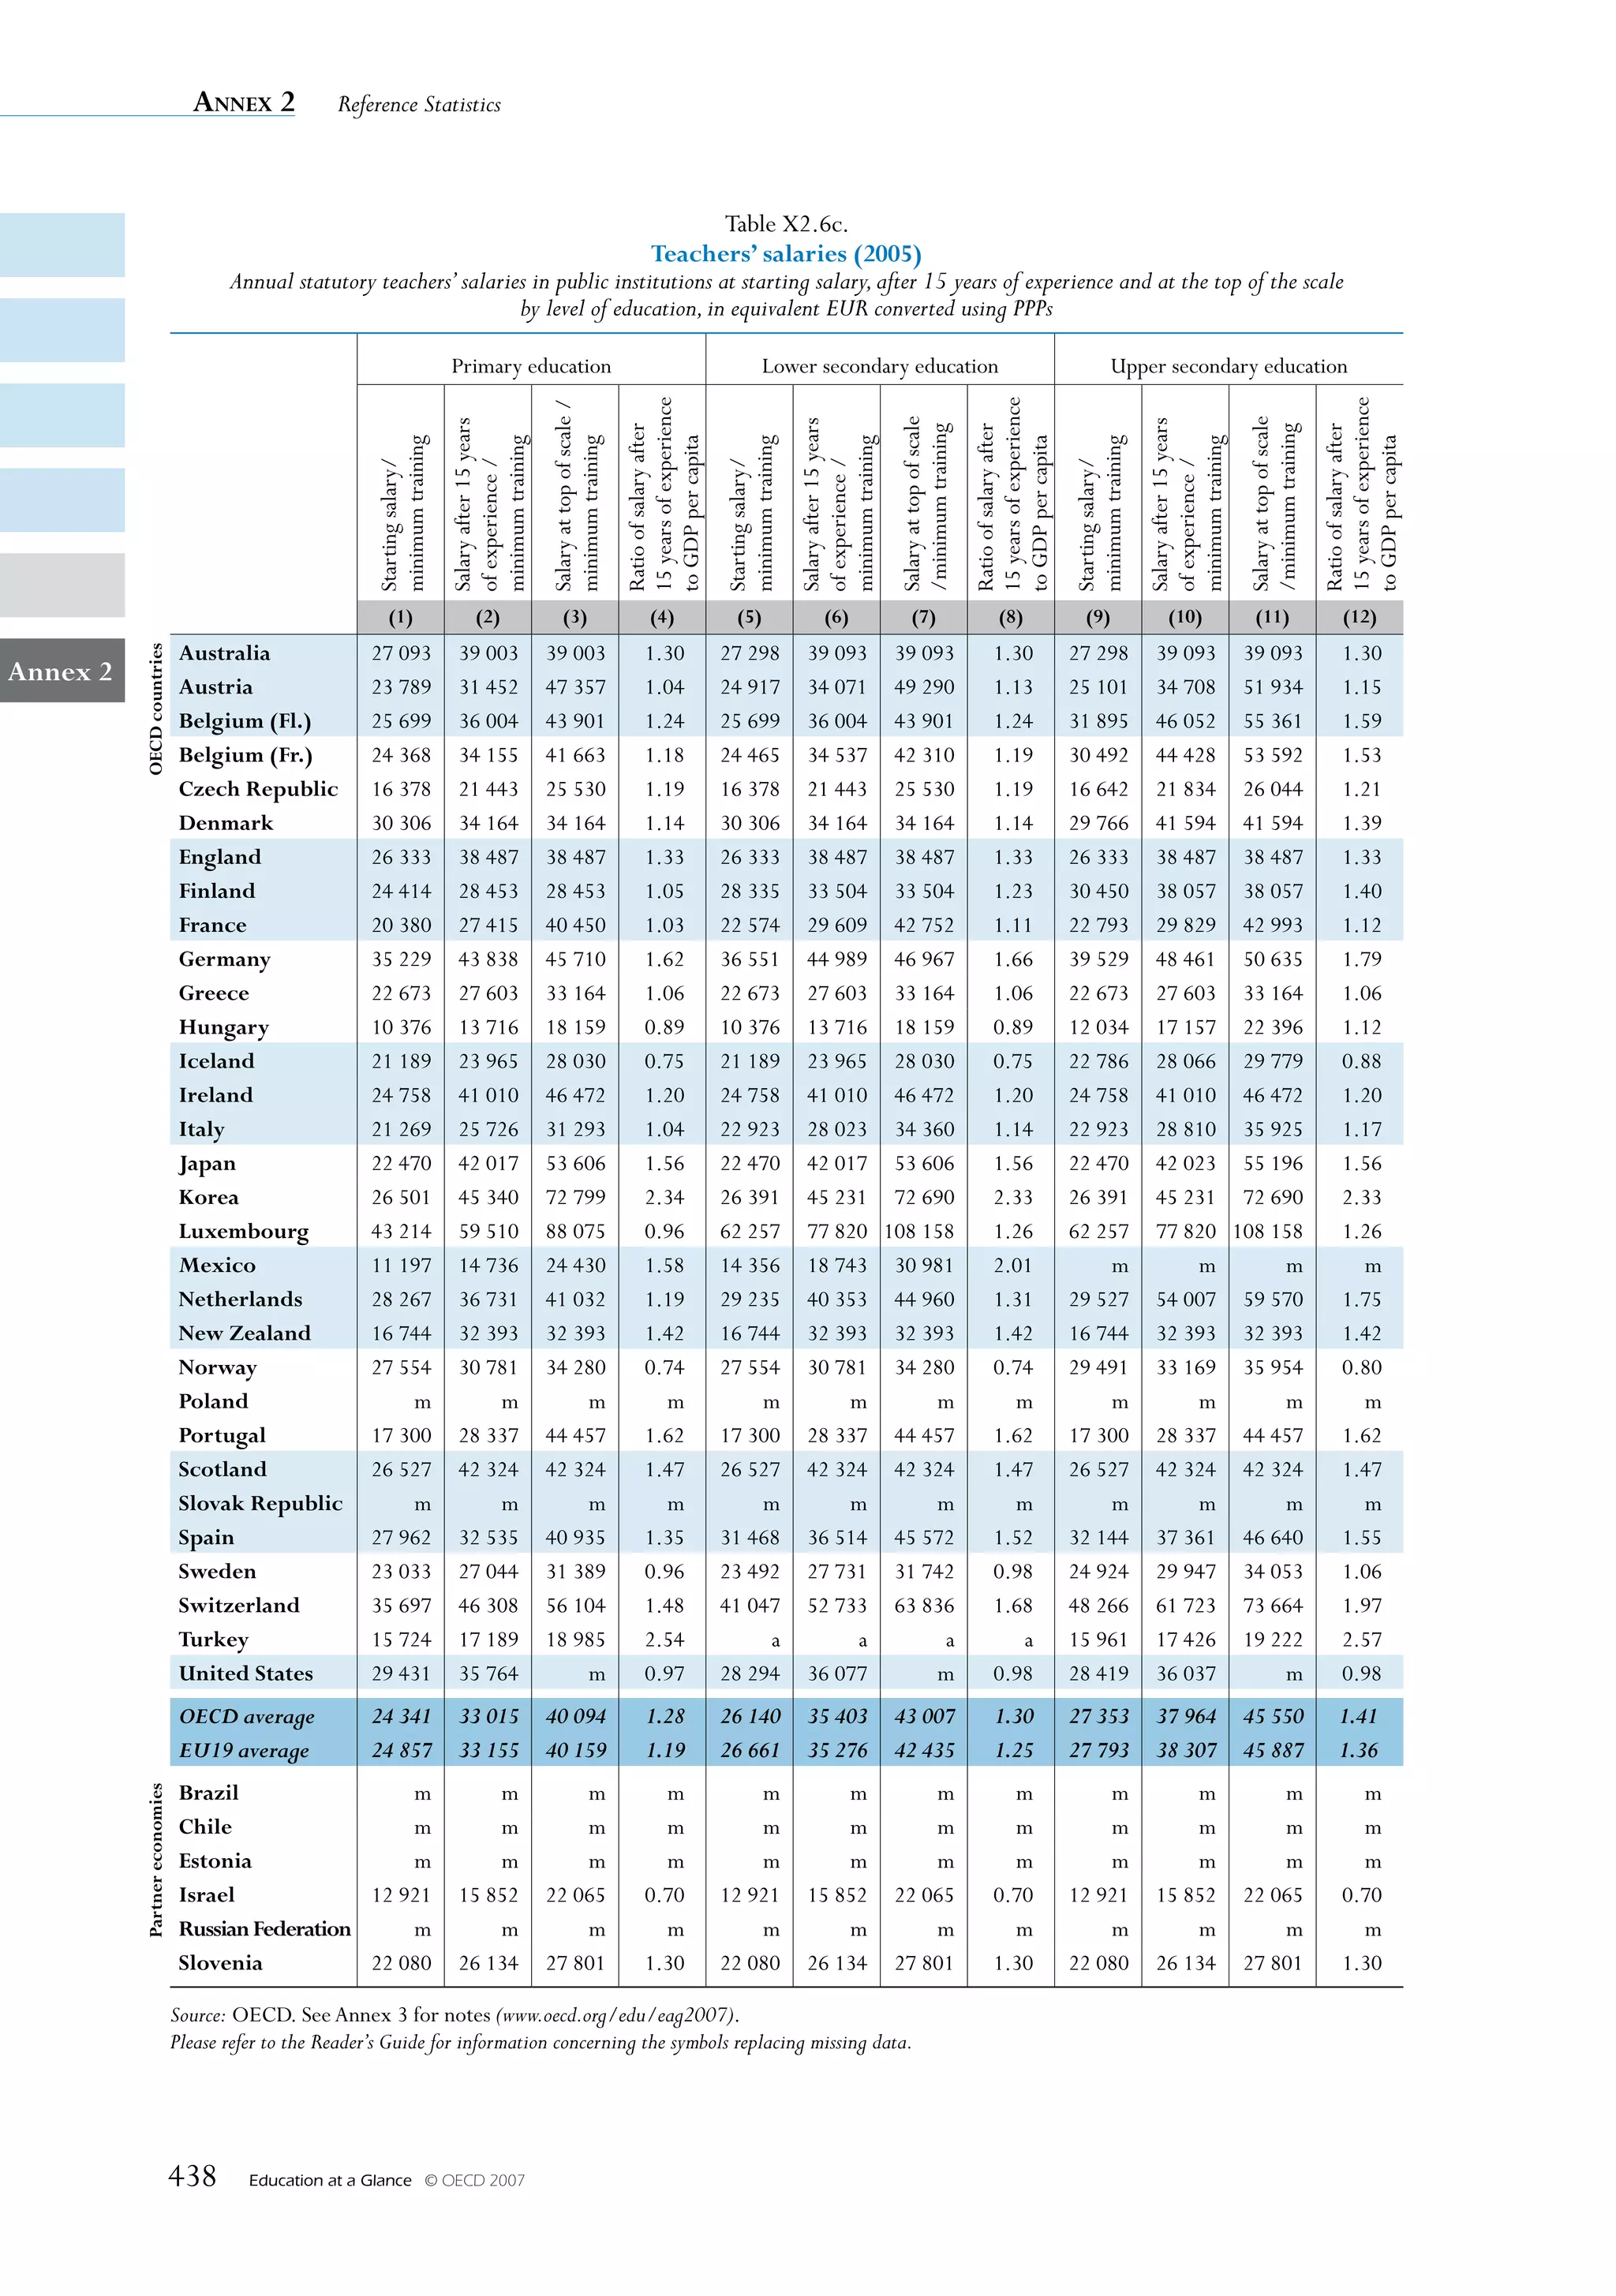
Table B2.3.
Change in expenditure on educational institutions (1995, 2000, 2001, 2002, 2003, 2004)
Index of change between 1995 and 2004 in expenditure on educational institutions from public and private sources, by level of education
[GDP deflator (1995=100), constant price]
Primary, secondary
B2
and post-secondary non-tertiary
All levels of education education Tertiary education
1995 2000 2001 2002 2003 2004 1995 2000 2001 2002 2003 2004 1995 2000 2001 2002 2003 2004
(1) (2) (3) (4) (5) (6) (7) (8) (9) (10) (11) (12) (13) (14) (15) (16) (17) (18)
Australia 100 127 133 137 141 145 100 134 141 143 148 150 100 110 113 122 125 132
OECD countries
Austria 100 103 105 106 107 108 100 106 103 104 108 108 100 102 117 111 115 126
Belgium m m m m m m m m m m m m m m m m m m
Canada1 100 108 111 114 m m 100 95 95 106 m m 100 134 141 142 m m
Czech Republic 100 89 93 96 107 116 100 86 90 92 102 111 100 99 107 116 138 145
Denmark1 100 123 131 132 132 138 100 119 125 123 125 130 100 110 129 135 125 133
Finland 100 113 117 122 129 134 100 112 117 123 131 135 100 111 112 116 121 128
France2 100 110 111 111 m m 100 110 111 111 m m 100 110 110 111 m m
Germany 100 m m m 110 109 100 m m m 107 106 100 m m m 114 112
Greece1, 3 100 155 166 176 200 208 100 147 137 145 161 172 100 160 217 246 310 312
Hungary 100 111 119 134 155 150 100 100 107 121 143 142 100 135 145 162 185 159
Iceland m m m m m m m m m m m m m m m m m m
Ireland 100 137 142 148 159 171 100 122 134 141 157 174 100 178 167 167 162 174
Italy 100 103 113 107 109 107 100 95 110 103 107 104 100 126 135 139 136 144
Japan1 100 107 108 109 112 111 100 103 104 106 106 105 100 116 115 118 124 125
Korea m m m m m m m m m m m m m m m m m m
Luxembourg m m m m m m m m m m m m m m m m m m
Mexico 100 129 138 148 162 159 100 124 137 135 149 147 100 129 123 172 167 168
Netherlands 100 115 121 126 129 134 100 119 127 134 138 143 100 106 109 107 111 115
New Zealand3 100 133 133 143 152 154 100 140 140 149 159 162 100 96 100 107 112 109
Norway3 100 103 116 126 136 134 100 106 110 122 132 129 100 94 98 110 115 117
Poland3 100 125 134 136 142 151 100 136 147 145 149 152 100 113 132 166 170 202
Portugal 100 130 138 137 139 136 100 132 139 139 136 133 100 136 147 137 150 143
Slovak Republic1 100 105 109 116 136 146 100 105 107 116 134 140 100 126 148 149 167 210
Spain 100 110 113 115 119 124 100 101 101 102 104 107 100 139 147 151 158 162
Sweden 100 123 124 135 137 139 100 123 123 133 135 139 100 123 126 135 141 144
Switzerland3 100 106 112 118 120 116 100 100 105 109 109 113 100 136 153 167 177 176
Turkey3 100 175 167 176 196 229 100 174 166 171 194 243 100 179 170 191 202 191
United Kingdom 100 112 120 131 139 139 100 115 123 136 149 149 100 102 109 118 120 122
United States 100 131 130 135 143 148 100 125 132 136 139 140 100 142 127 133 150 163
OECD average 100 119 124 129 138 142 100 117 121 126 134 139 100 124 132 141 150 155
EU19 average 100 117 122 127 134 138 100 114 119 123 130 134 100 124 135 142 152 158
Brazil1, 3 100 121 122 123 136 140 100 122 125 125 142 148 100 128 128 131 140 129
Partner
economies
Chile4 100 178 m 201 206 211 100 184 m 206 210 207 100 165 m 186 193 206
Estonia m m m m m m m m m m m m m m m m m m
Israel 100 119 125 127 125 129 100 117 123 126 121 124 100 130 132 131 133 137
Russian Federation m m m m m m m m m m m m m m m m m m
Slovenia m m m m m m m m m m m m m m m m m m
1. Some levels of education are included with others. Refer to “x”code in Table B1.1b for details.
2. Excluding over sea departments (DOM).
3. Public expenditure only.
4.Year of reference 2005 instead of 2004.
Source: OECD. See Annex 3 for notes (www.oecd.org/edu/eag2007).
Please refer to the Reader’s Guide for information concerning the symbols replacing missing data.
1 2 http://dx.doi.org/10.1787/068186423156
Education at a Glance © OECD 2007 207](https://image.slidesharecdn.com/educacionsegunocde2007-100705022559-phpapp01/75/Educacion-OCDE-2007-207-2048.jpg)


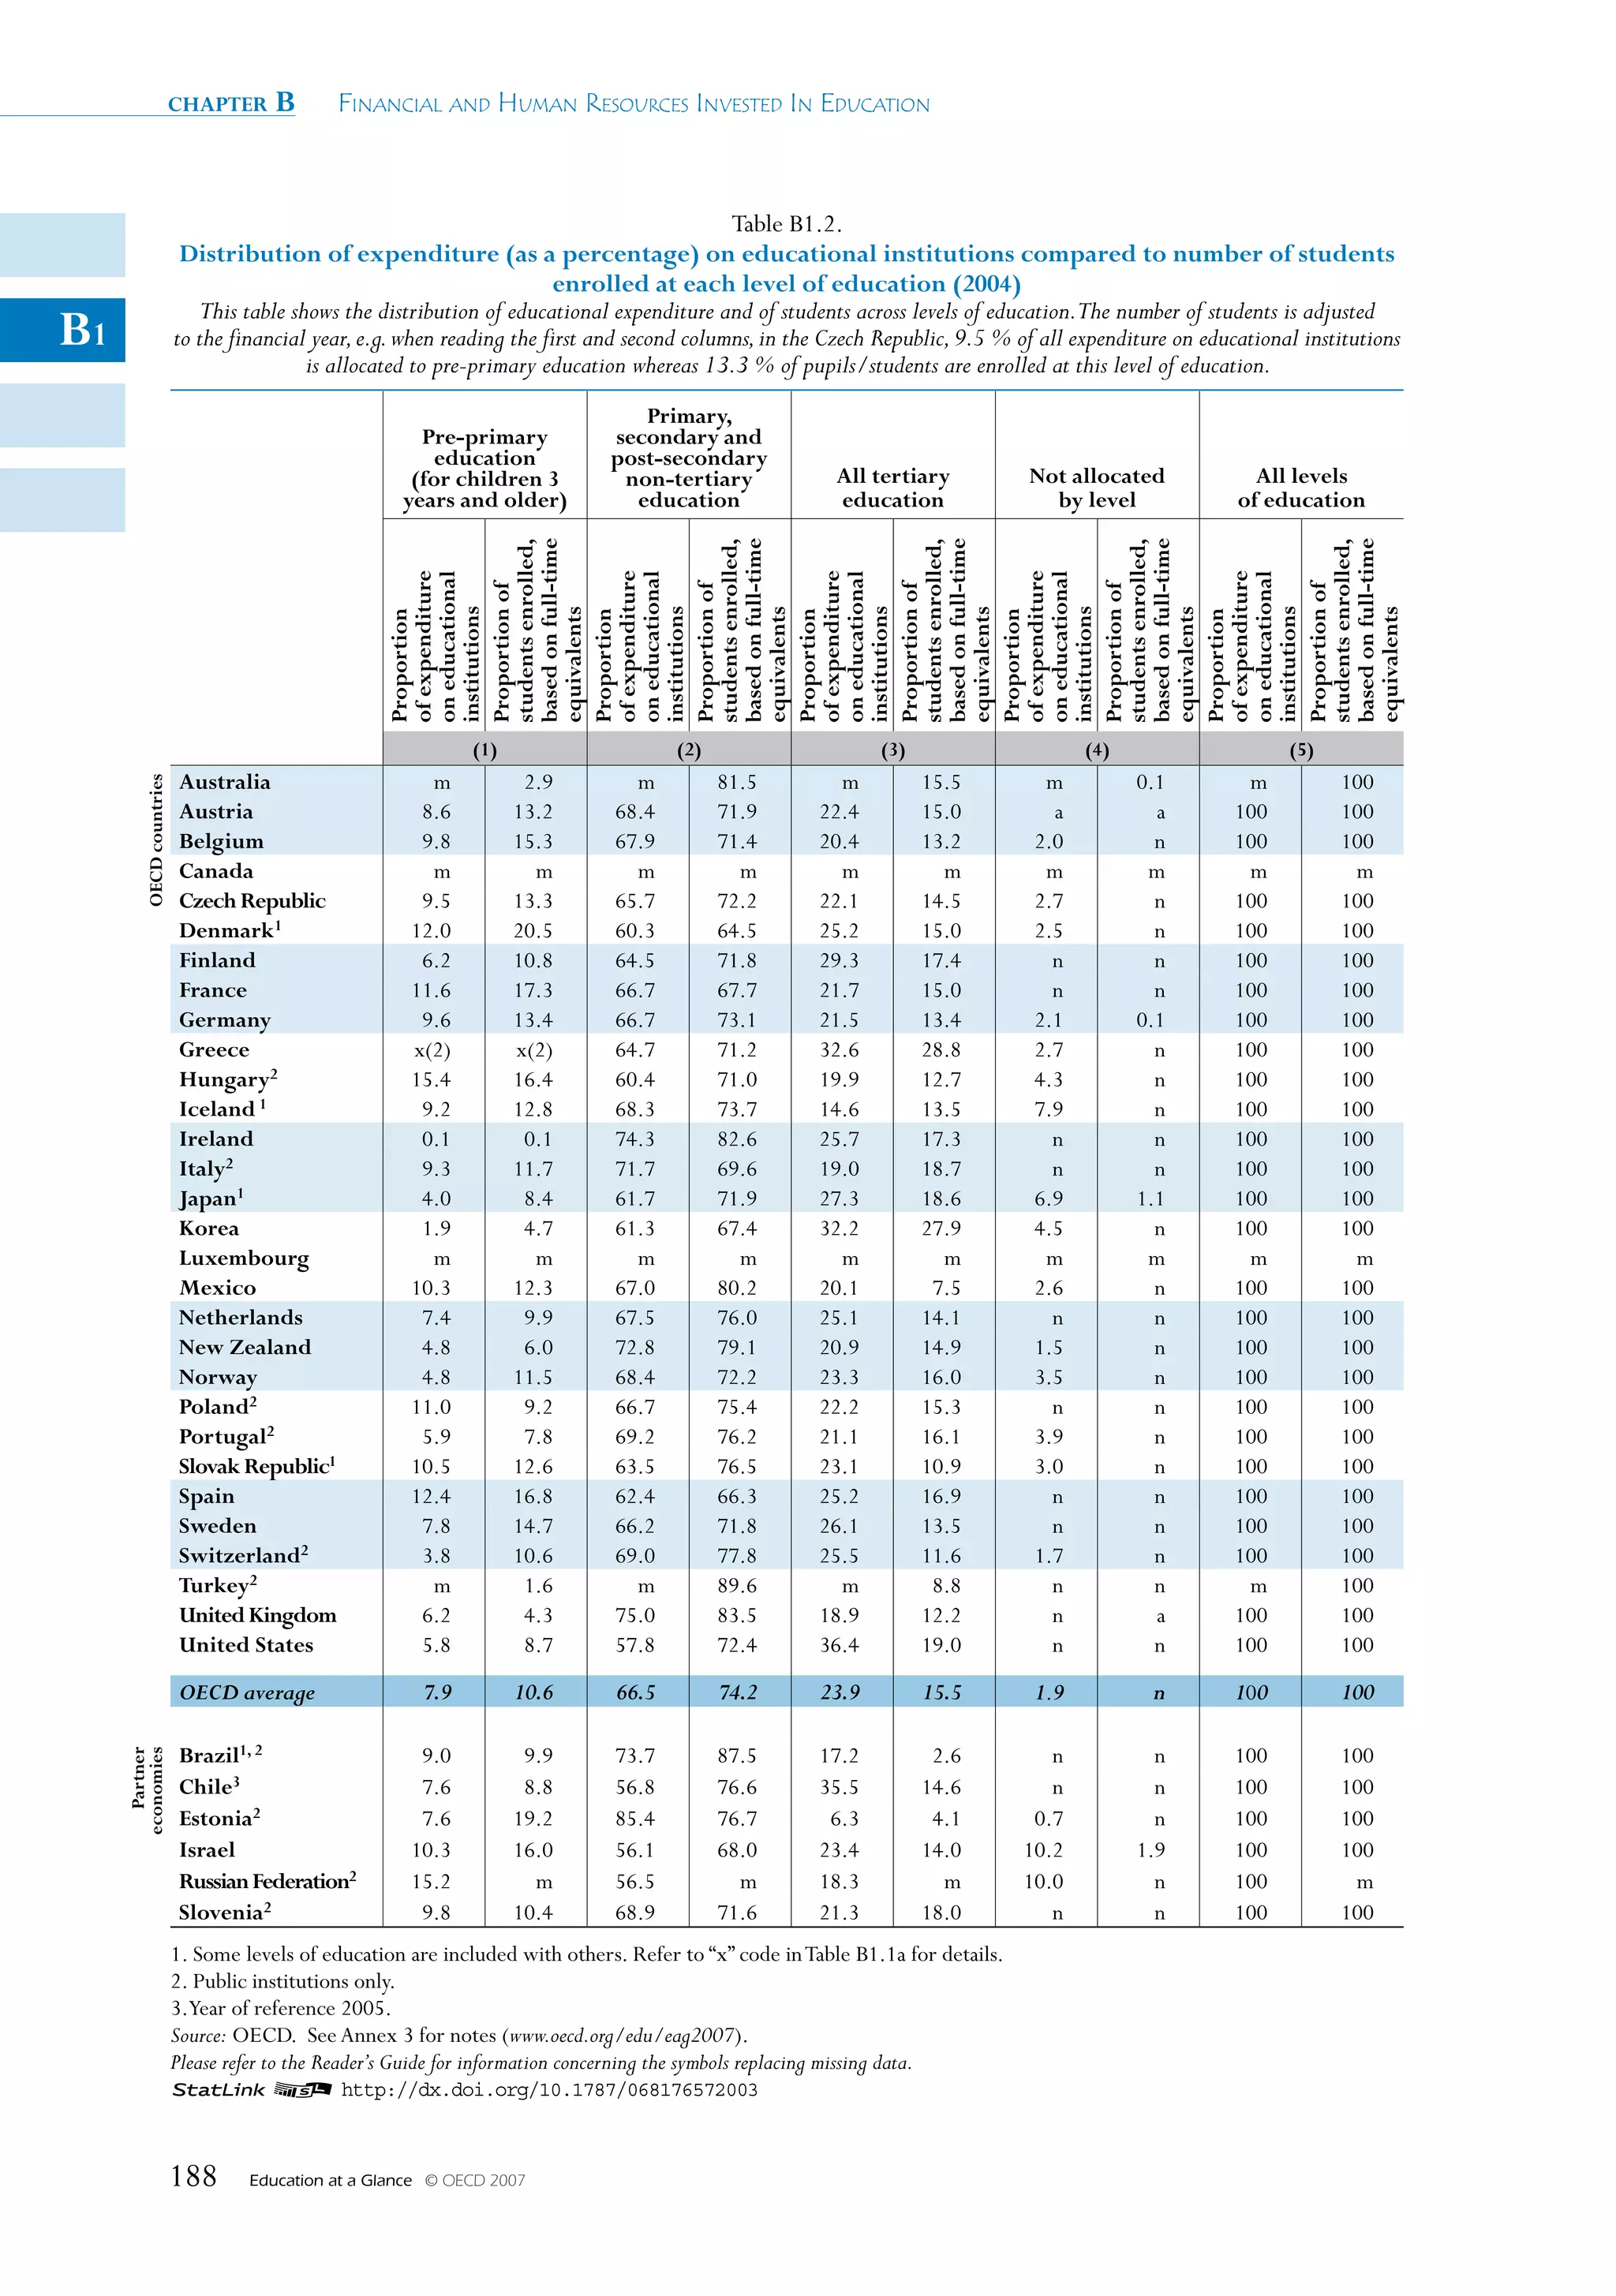
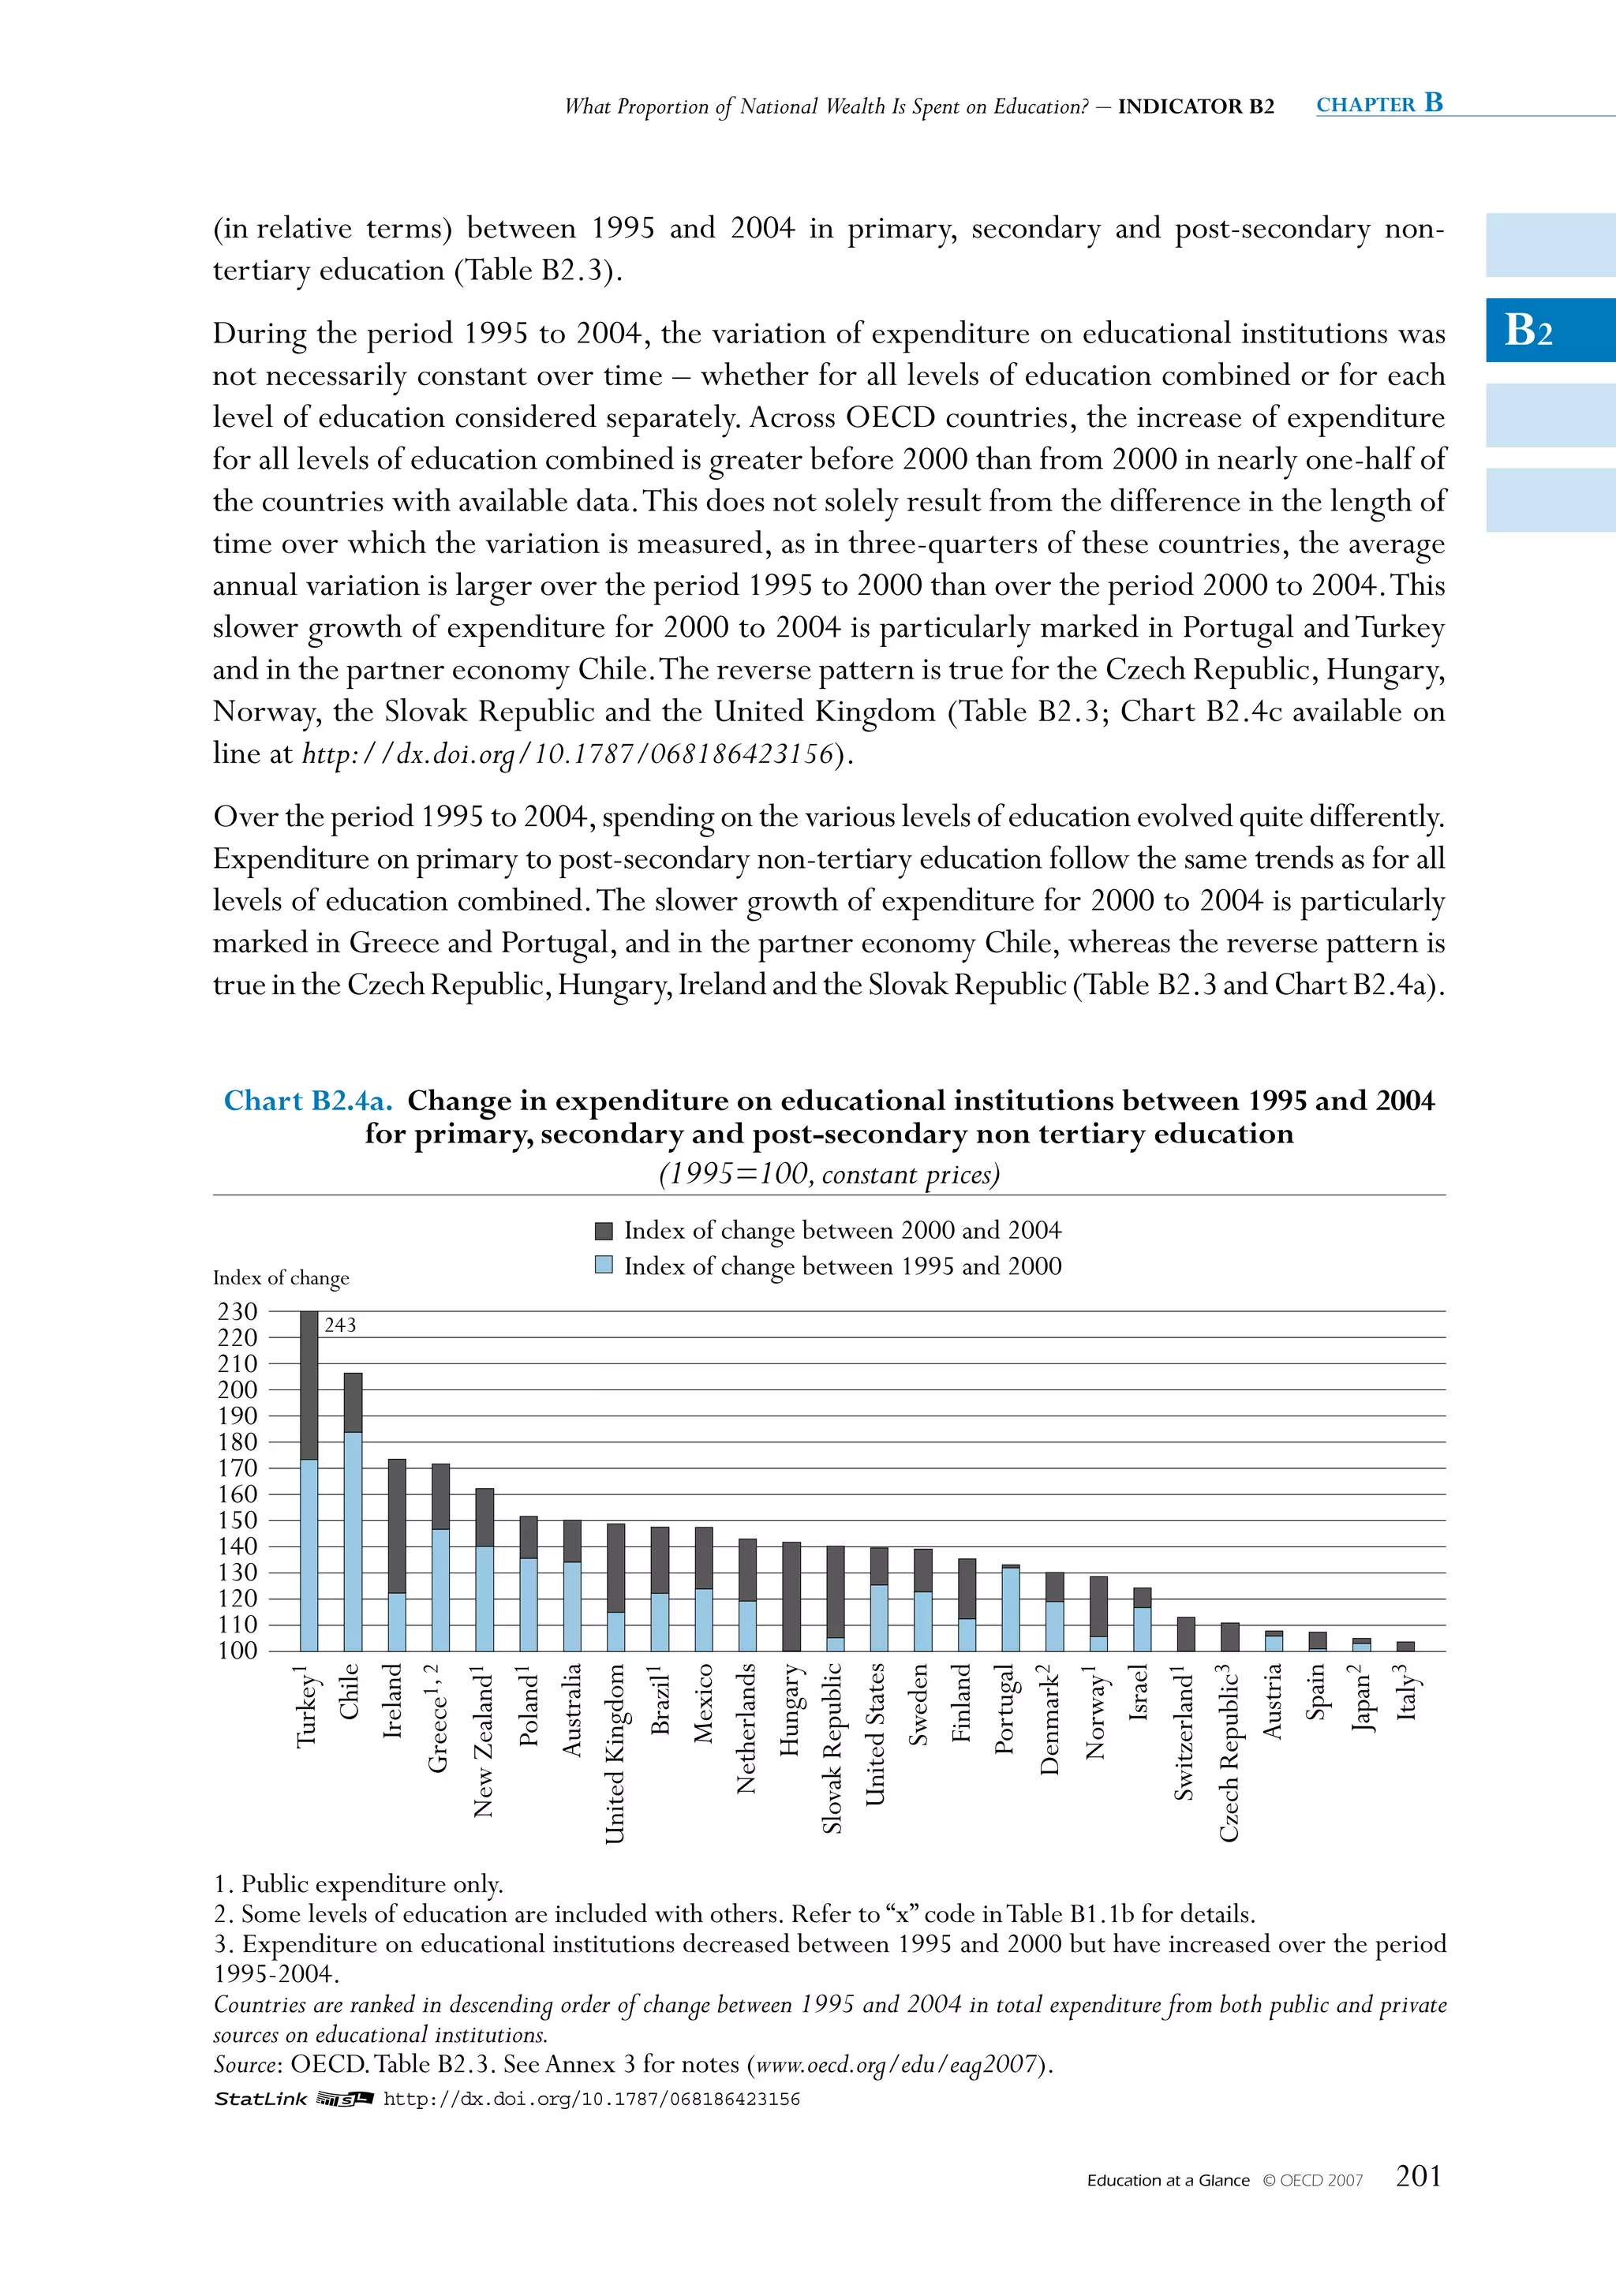
![chapter B Financial and Human ResouRces invested in education
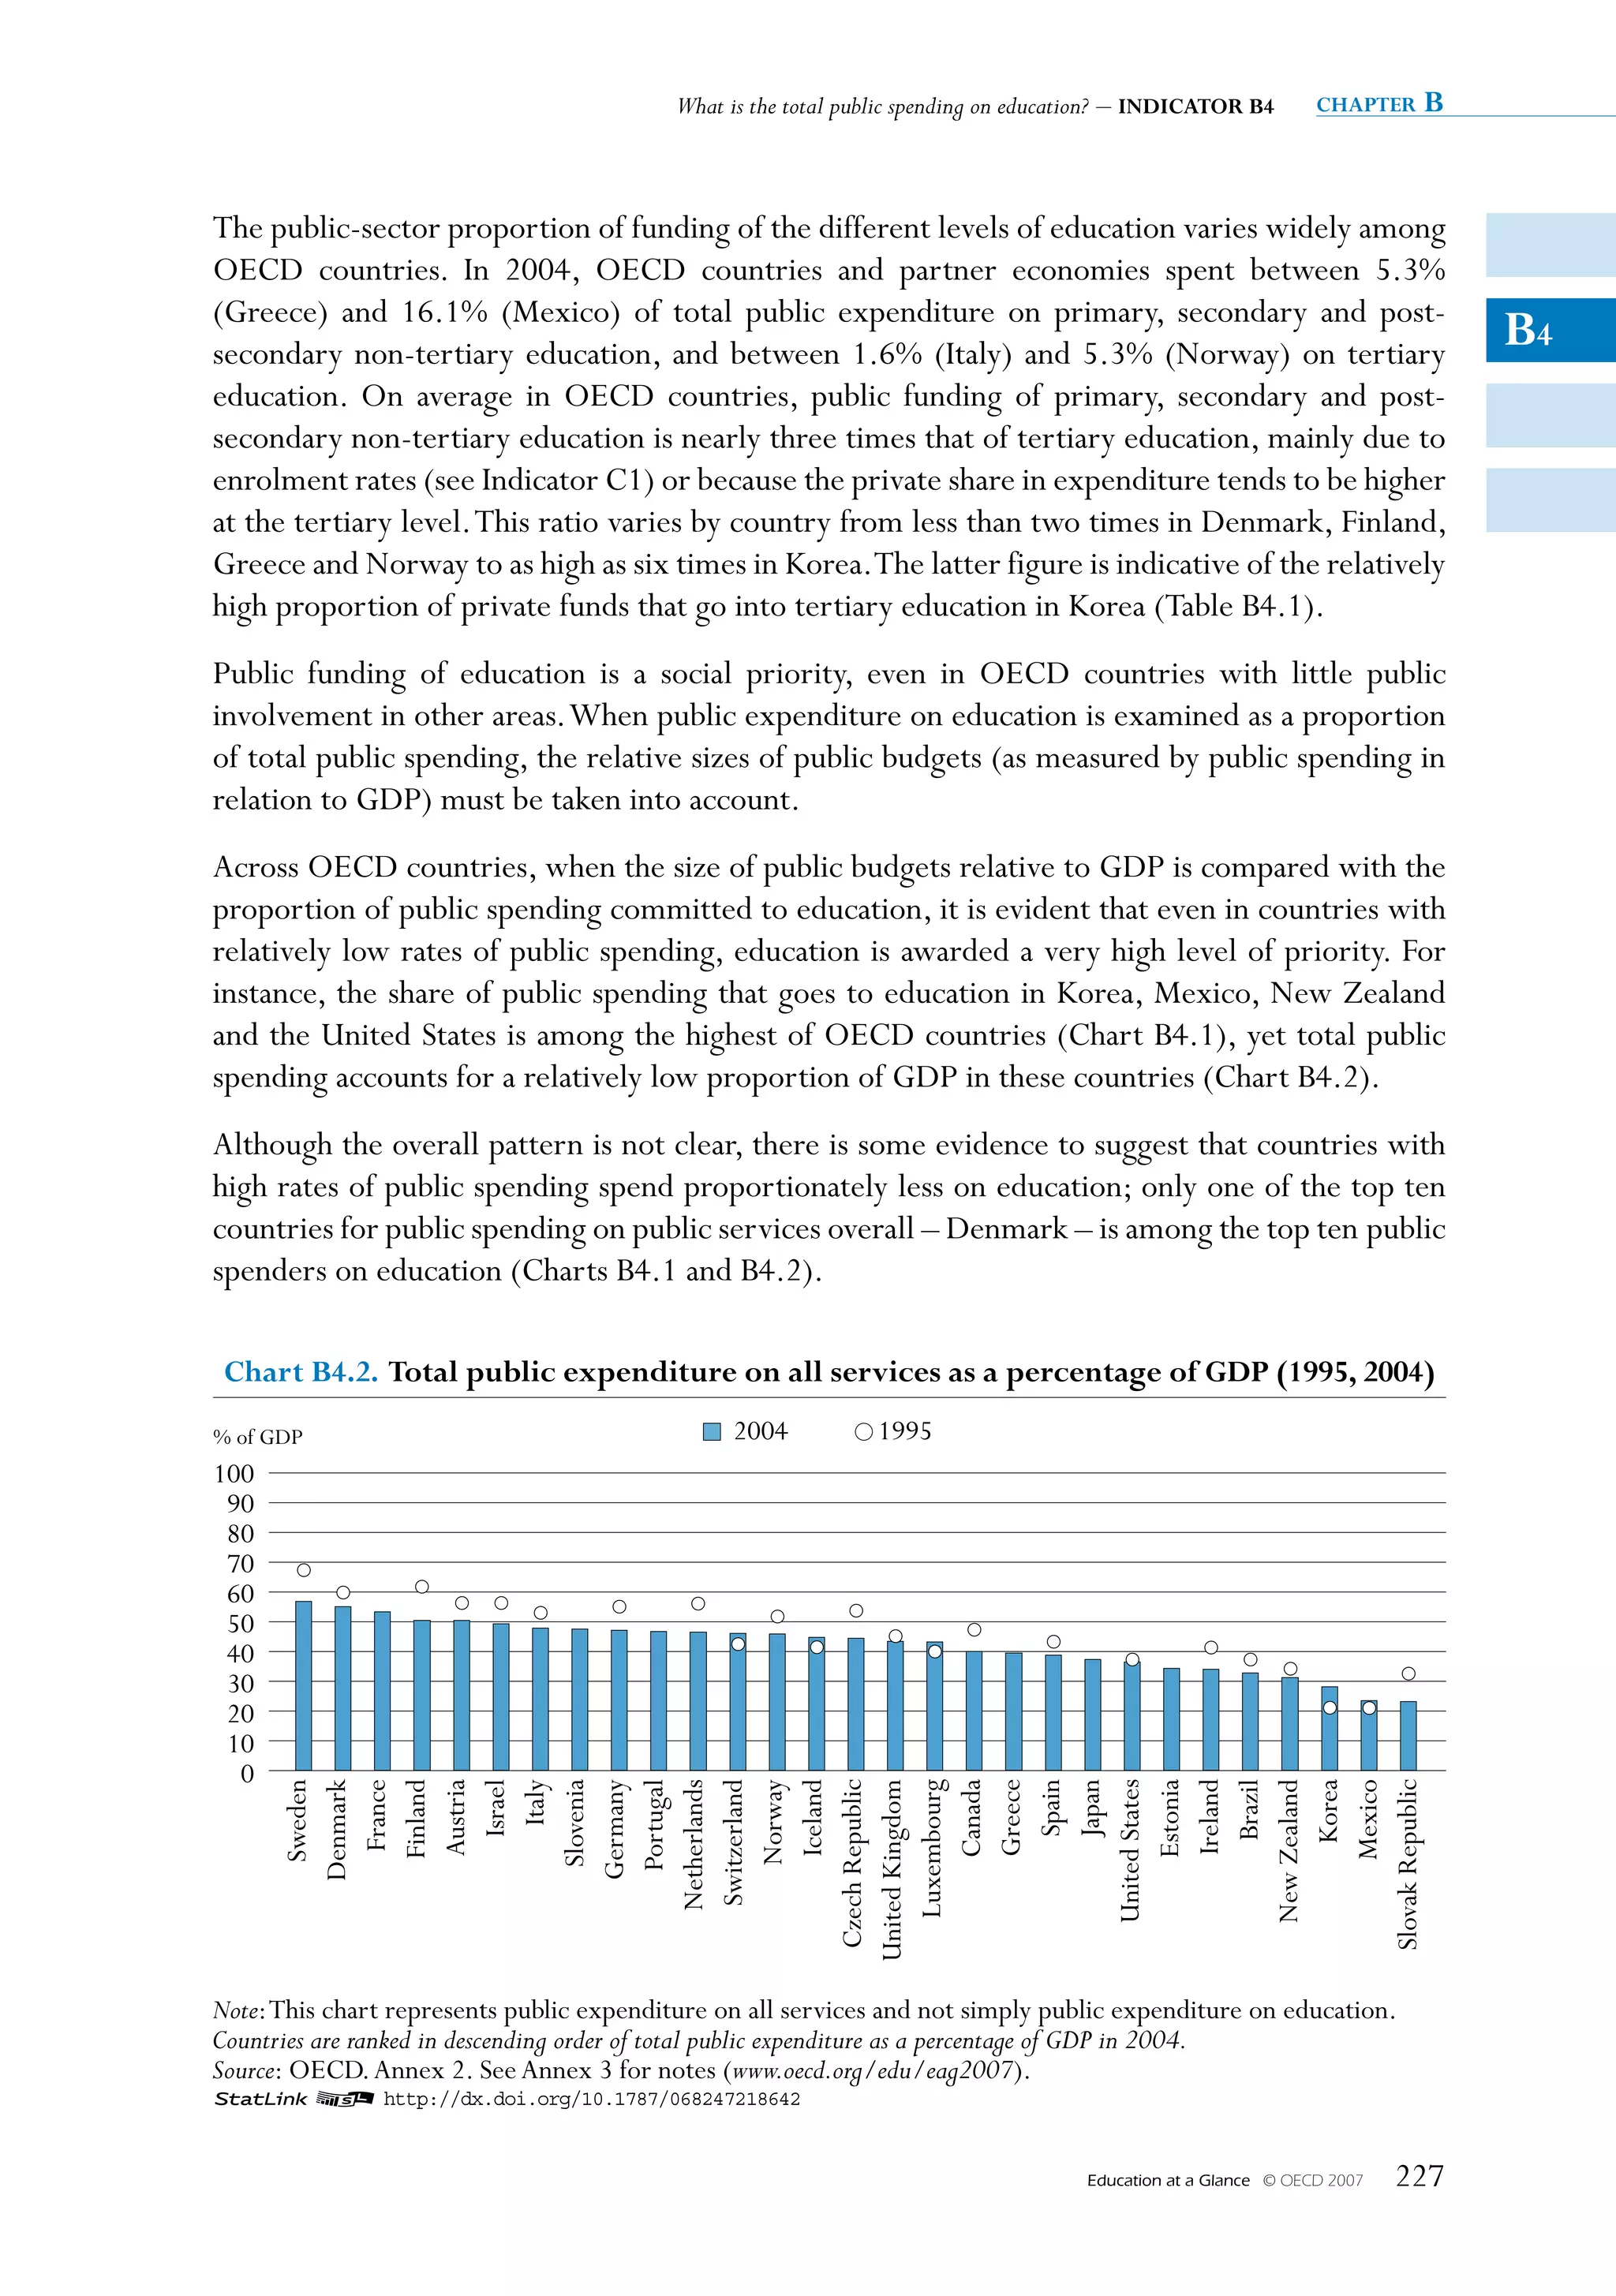
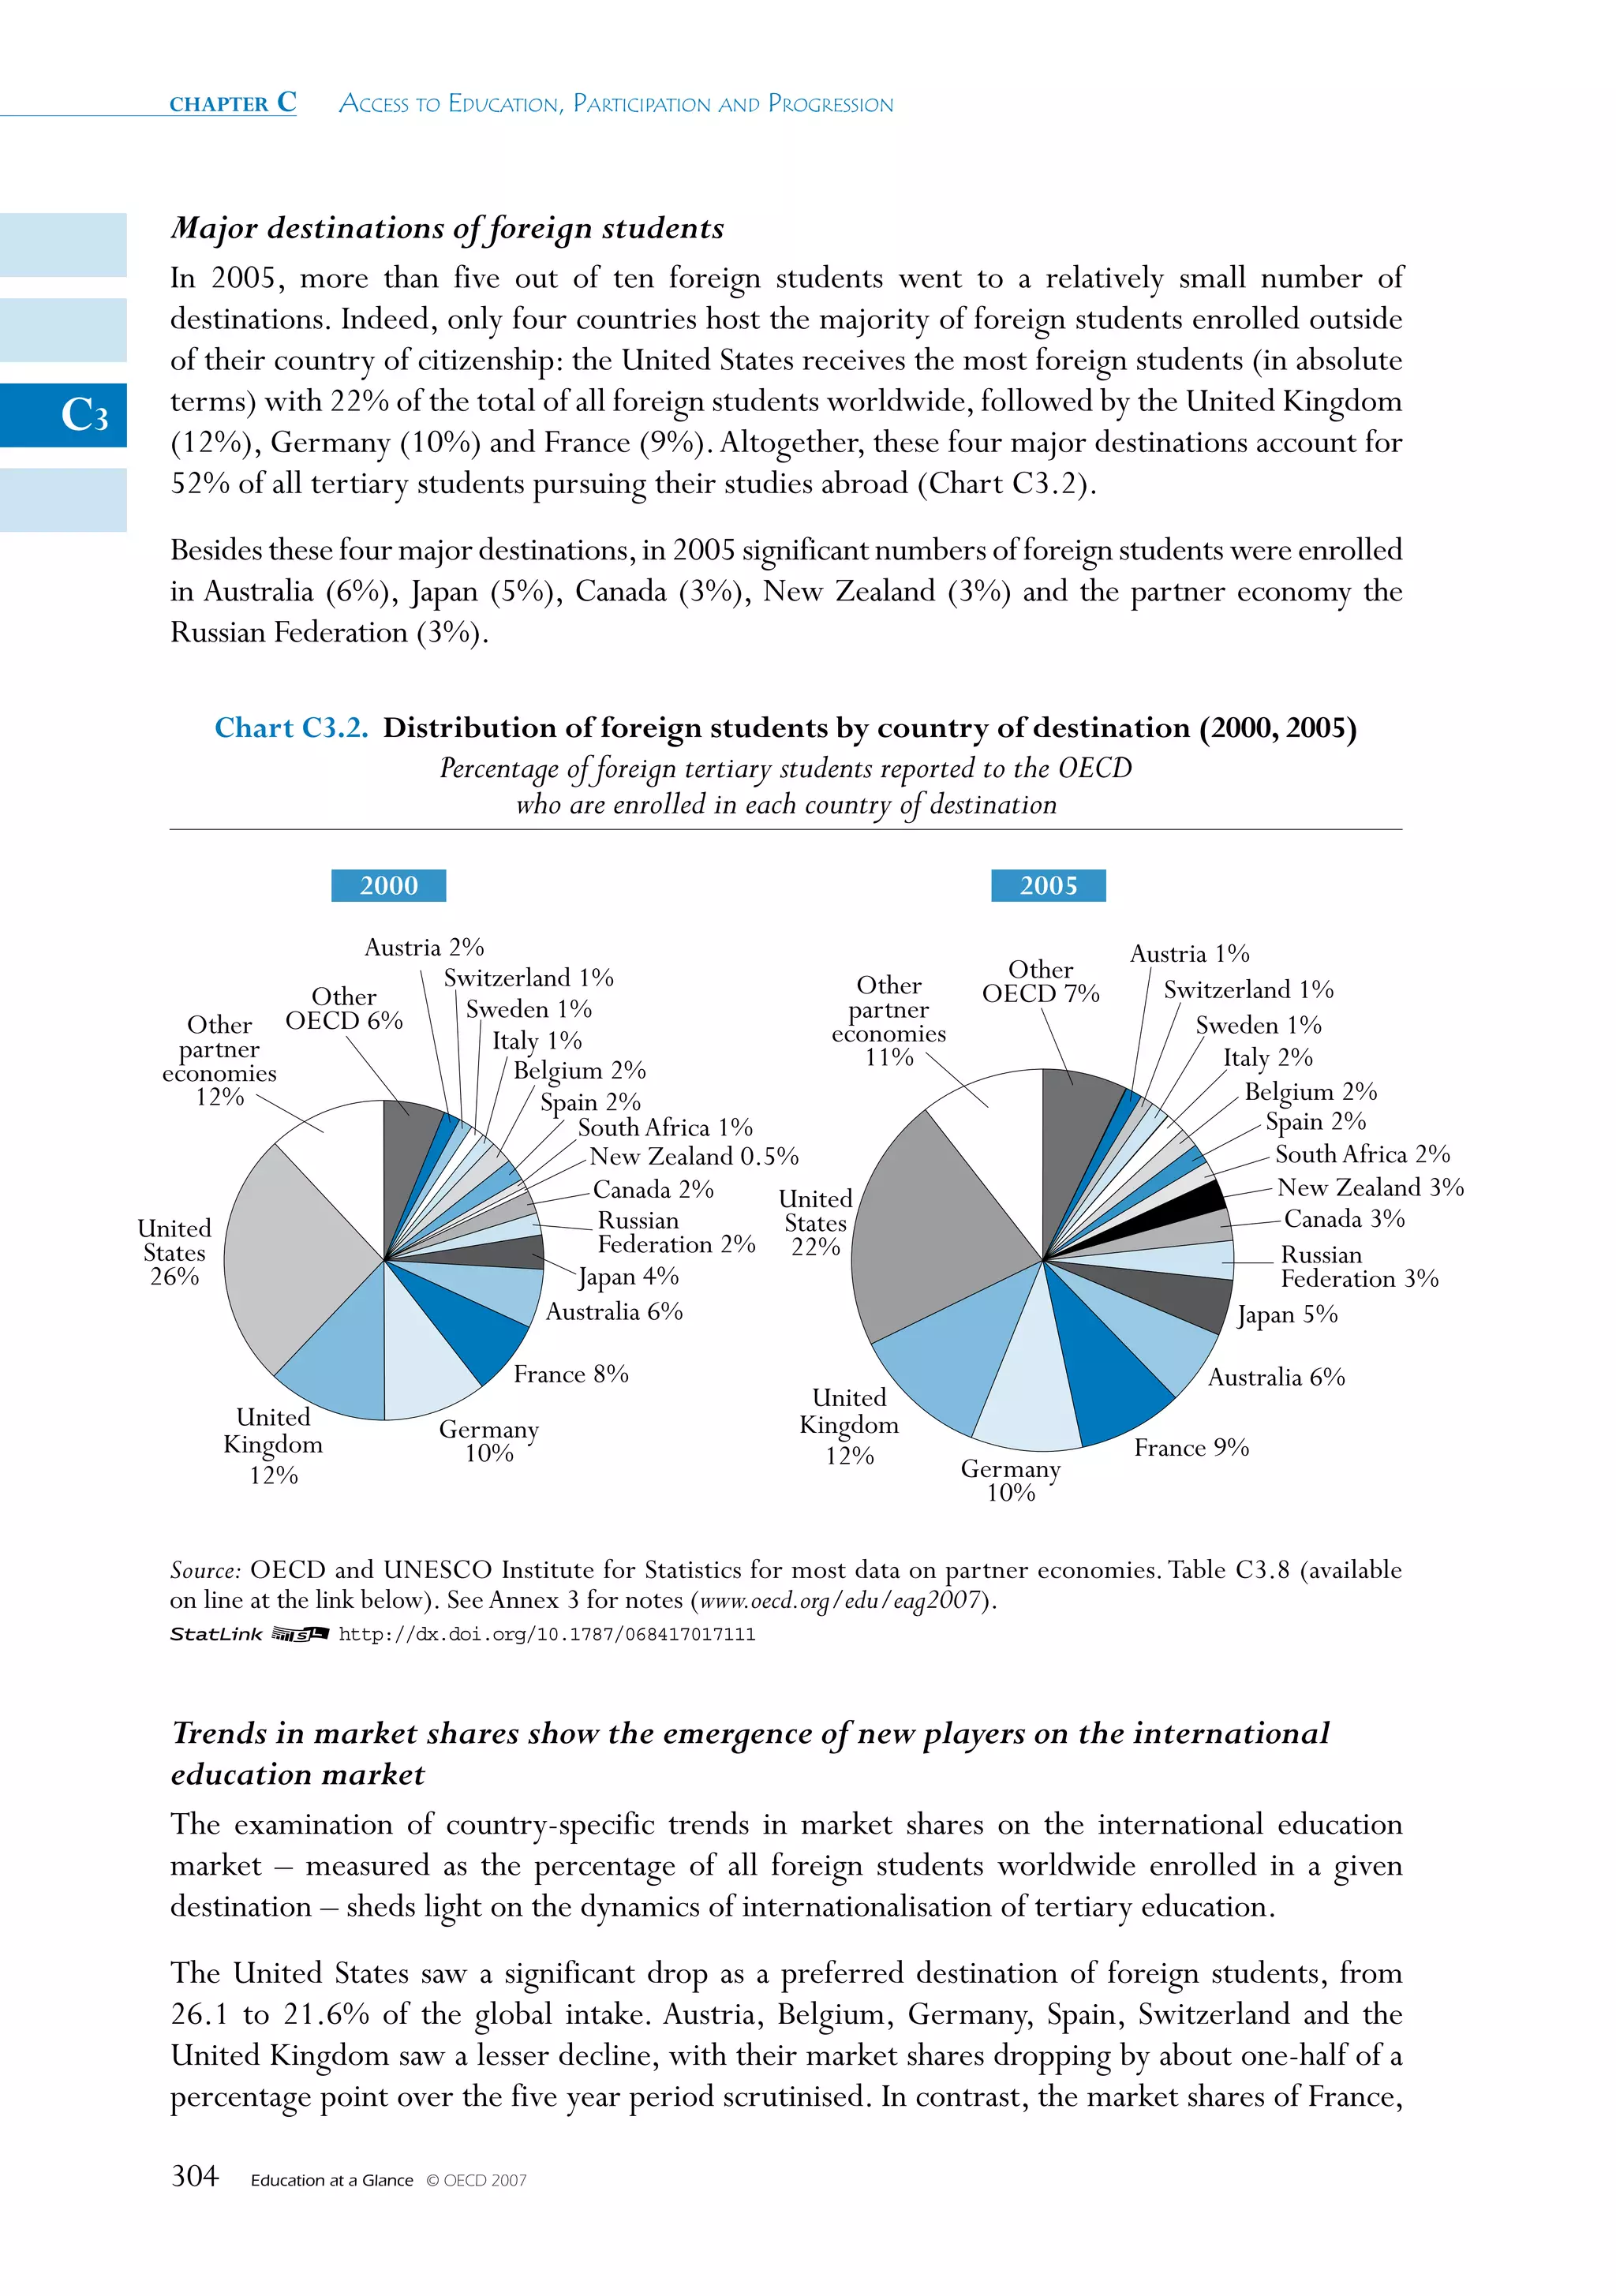
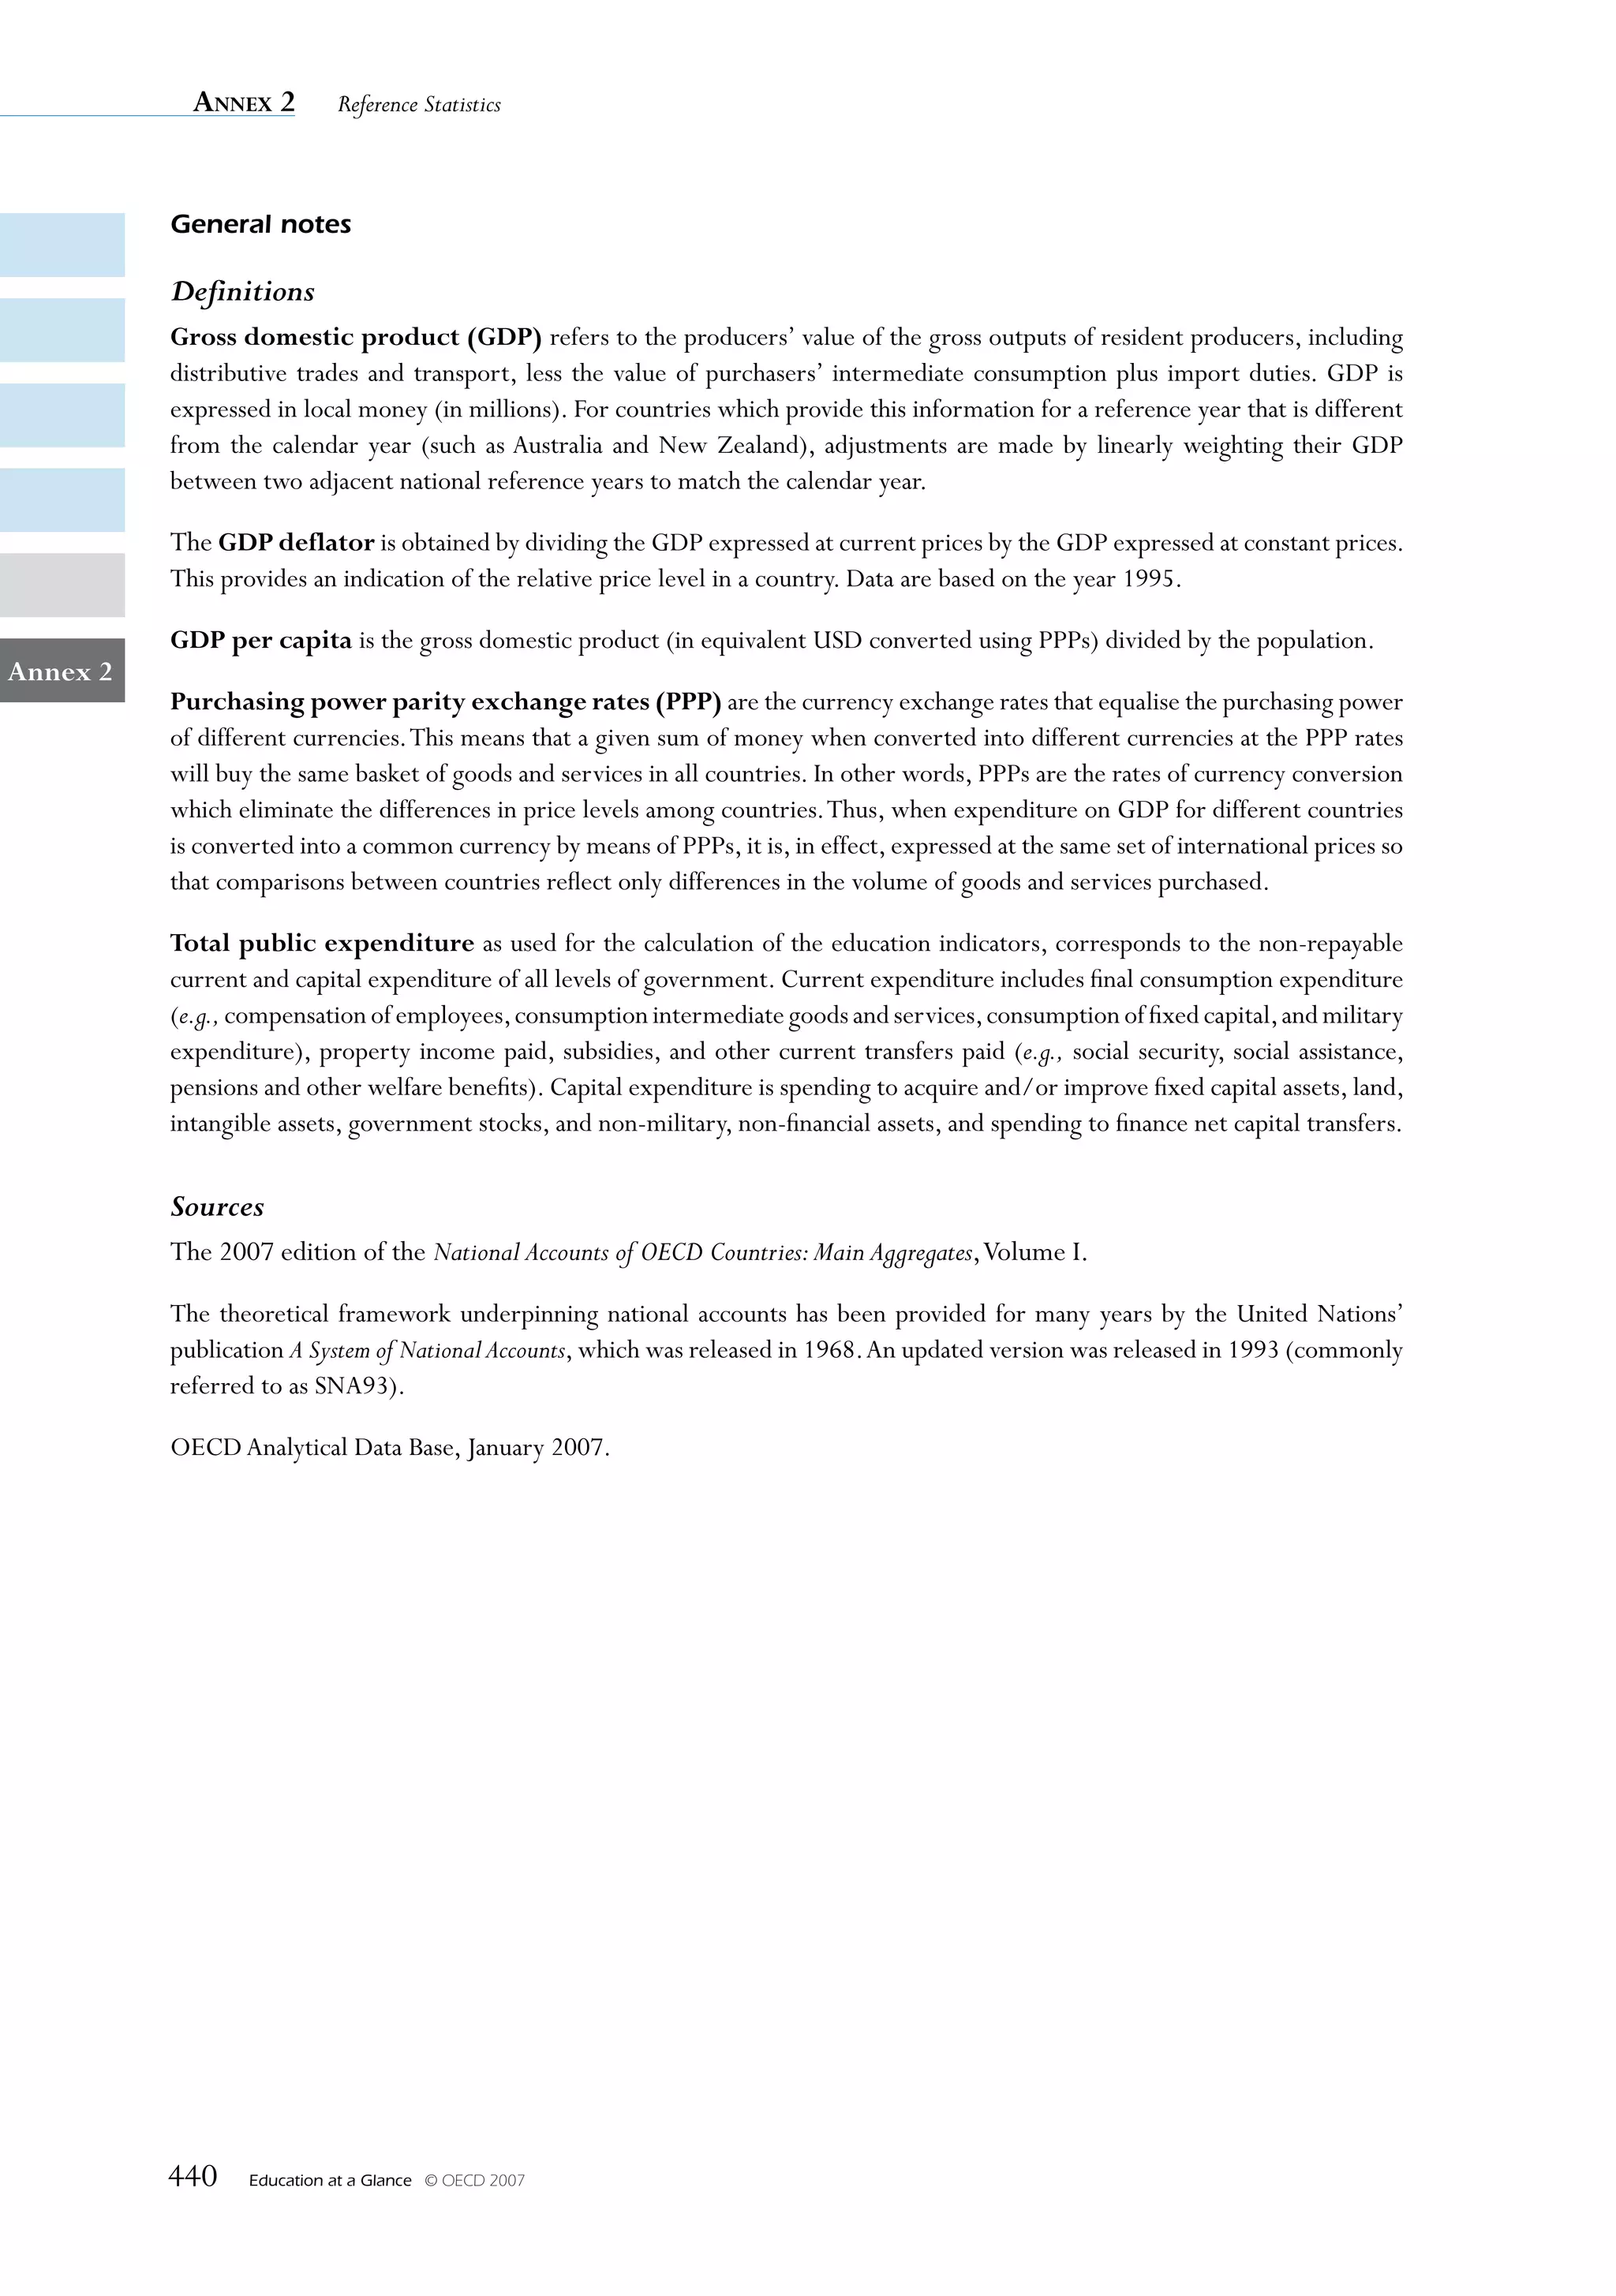
Table B5.1a.
Estimated annual average tuition fees charged by tertiary-type A educational institutions1
for national students (academic year 2004-2005)
In equivalent USD converted using PPPs, by type of institutions, based on full-time students
B5 Amounts of tuition fees and associated proportions of students should be interpreted with caution as they result from the weighted average of
the main Tertiary-type A programmes and do not cover all the educational institutions. However, the figures reported can be considered as good
proxies and show the difference among countries in tuition fees charged by main educational institutions and for the majority of students.
Annual average tuition fees in USD
Percentage of full-time charged by institutions
students enrolled in: (for full-time students)
Independent
Independent
Government
Government
institutions
institutions
institutions
institutions
dependent
dependent
private
private
private
private
Public
Public Comment
(1) (2) (3) (4) (5) (6) (7)
Australia 98 a 2 3 855 a 7 452 95% of national students in public institutions are in
OECD countries
subsidised places and pay an average USD 3 595 tuition
fee, including HECS/HELP subsidies.
Austria 88 12 n 837 837 n
Belgium (Fl.) x(2) 100 m x(5) 574 m
Belgium (Fr.)2 32 68 m 661 746 m
Canada m m m 3 464 m m
Czech Republic 93 a 7 No tuition fees a 3 145 The average fee in public institutions is rather negligible
because fees are paid only by student studying too long
(more than standard length of the programme plus 1 year):
about 4% of students.
Denmark 3 100 n a No tuition fees m a
Finland 89 11 a No tuition fees No tuition fees a Excluding membership fees to student unions.
France 87 1 12 From 160 to x(6) From 500 to University programmes under the control of the
490 8 000 Ministry of Education only.
Germany m m m m m m
Greece m m m m m m
Hungary m m m m m m
Iceland 87 13 a No tuition fees From 1 750 a Excluding registration fees for all students.
to 4 360
Ireland 100 a n No tuition fees a No tuition The tuition fees charged by institutions are on average
fees of USD 4 470 [1 870 to 20 620] in public institutions
and of USD 4 630 [3 590 to 6 270] in private
institutions but the government gives the money
directly to institutions and the students have not to
pay these tuition fees.
Italy 94 a 6 1 017 a 3 520 The annual average tuition fees do not take into
account the scholarships/grants that totally cover the
tuition fees but partial reductions of fees cannot be
excluded.
Japan 25 a 75 3 920 a 6 117 Excludes admission fee charged by the school for
the first year (USD 2 267 on average for public,
USD 2 089 on average for private institutions) and
subscription fee for using facilities (USD 1 510 on
average) for private institutions.
Korea 22 a 78 3 883 a 7 406 Tuition fees in first degree programme only. Excludes
admission fees to university, but includes supporting
fees. A student receiving a scholarship twice a year, is
counted as two students.
Luxembourg m m m m m m
Mexico 66 a 34 m a 11 359
Netherlands a 100 a a 1 646 a
New Zealand 3 98 2 m 1 764 x(4) x(4)
1. Without taking into account scholarships/grants that the student may receive.
2. Tuition fees charged for programmes are the same in public than in private institutions but the distribution of students differ between public
and private institutions explaining that the weighted average is not the same.
3. Weigthed average for the whole of tertiary education.
Source: OECD. See Annex 3 for notes (www.oecd.org/edu/eag2007).
Please refer to the Reader’s Guide for information concerning the symbols replacing missing data.
1 2 http://dx.doi.org/10.1787/068348603526
244 Education at a Glance © OECD 2007](https://image.slidesharecdn.com/educacionsegunocde2007-100705022559-phpapp01/75/Educacion-OCDE-2007-244-2048.jpg)
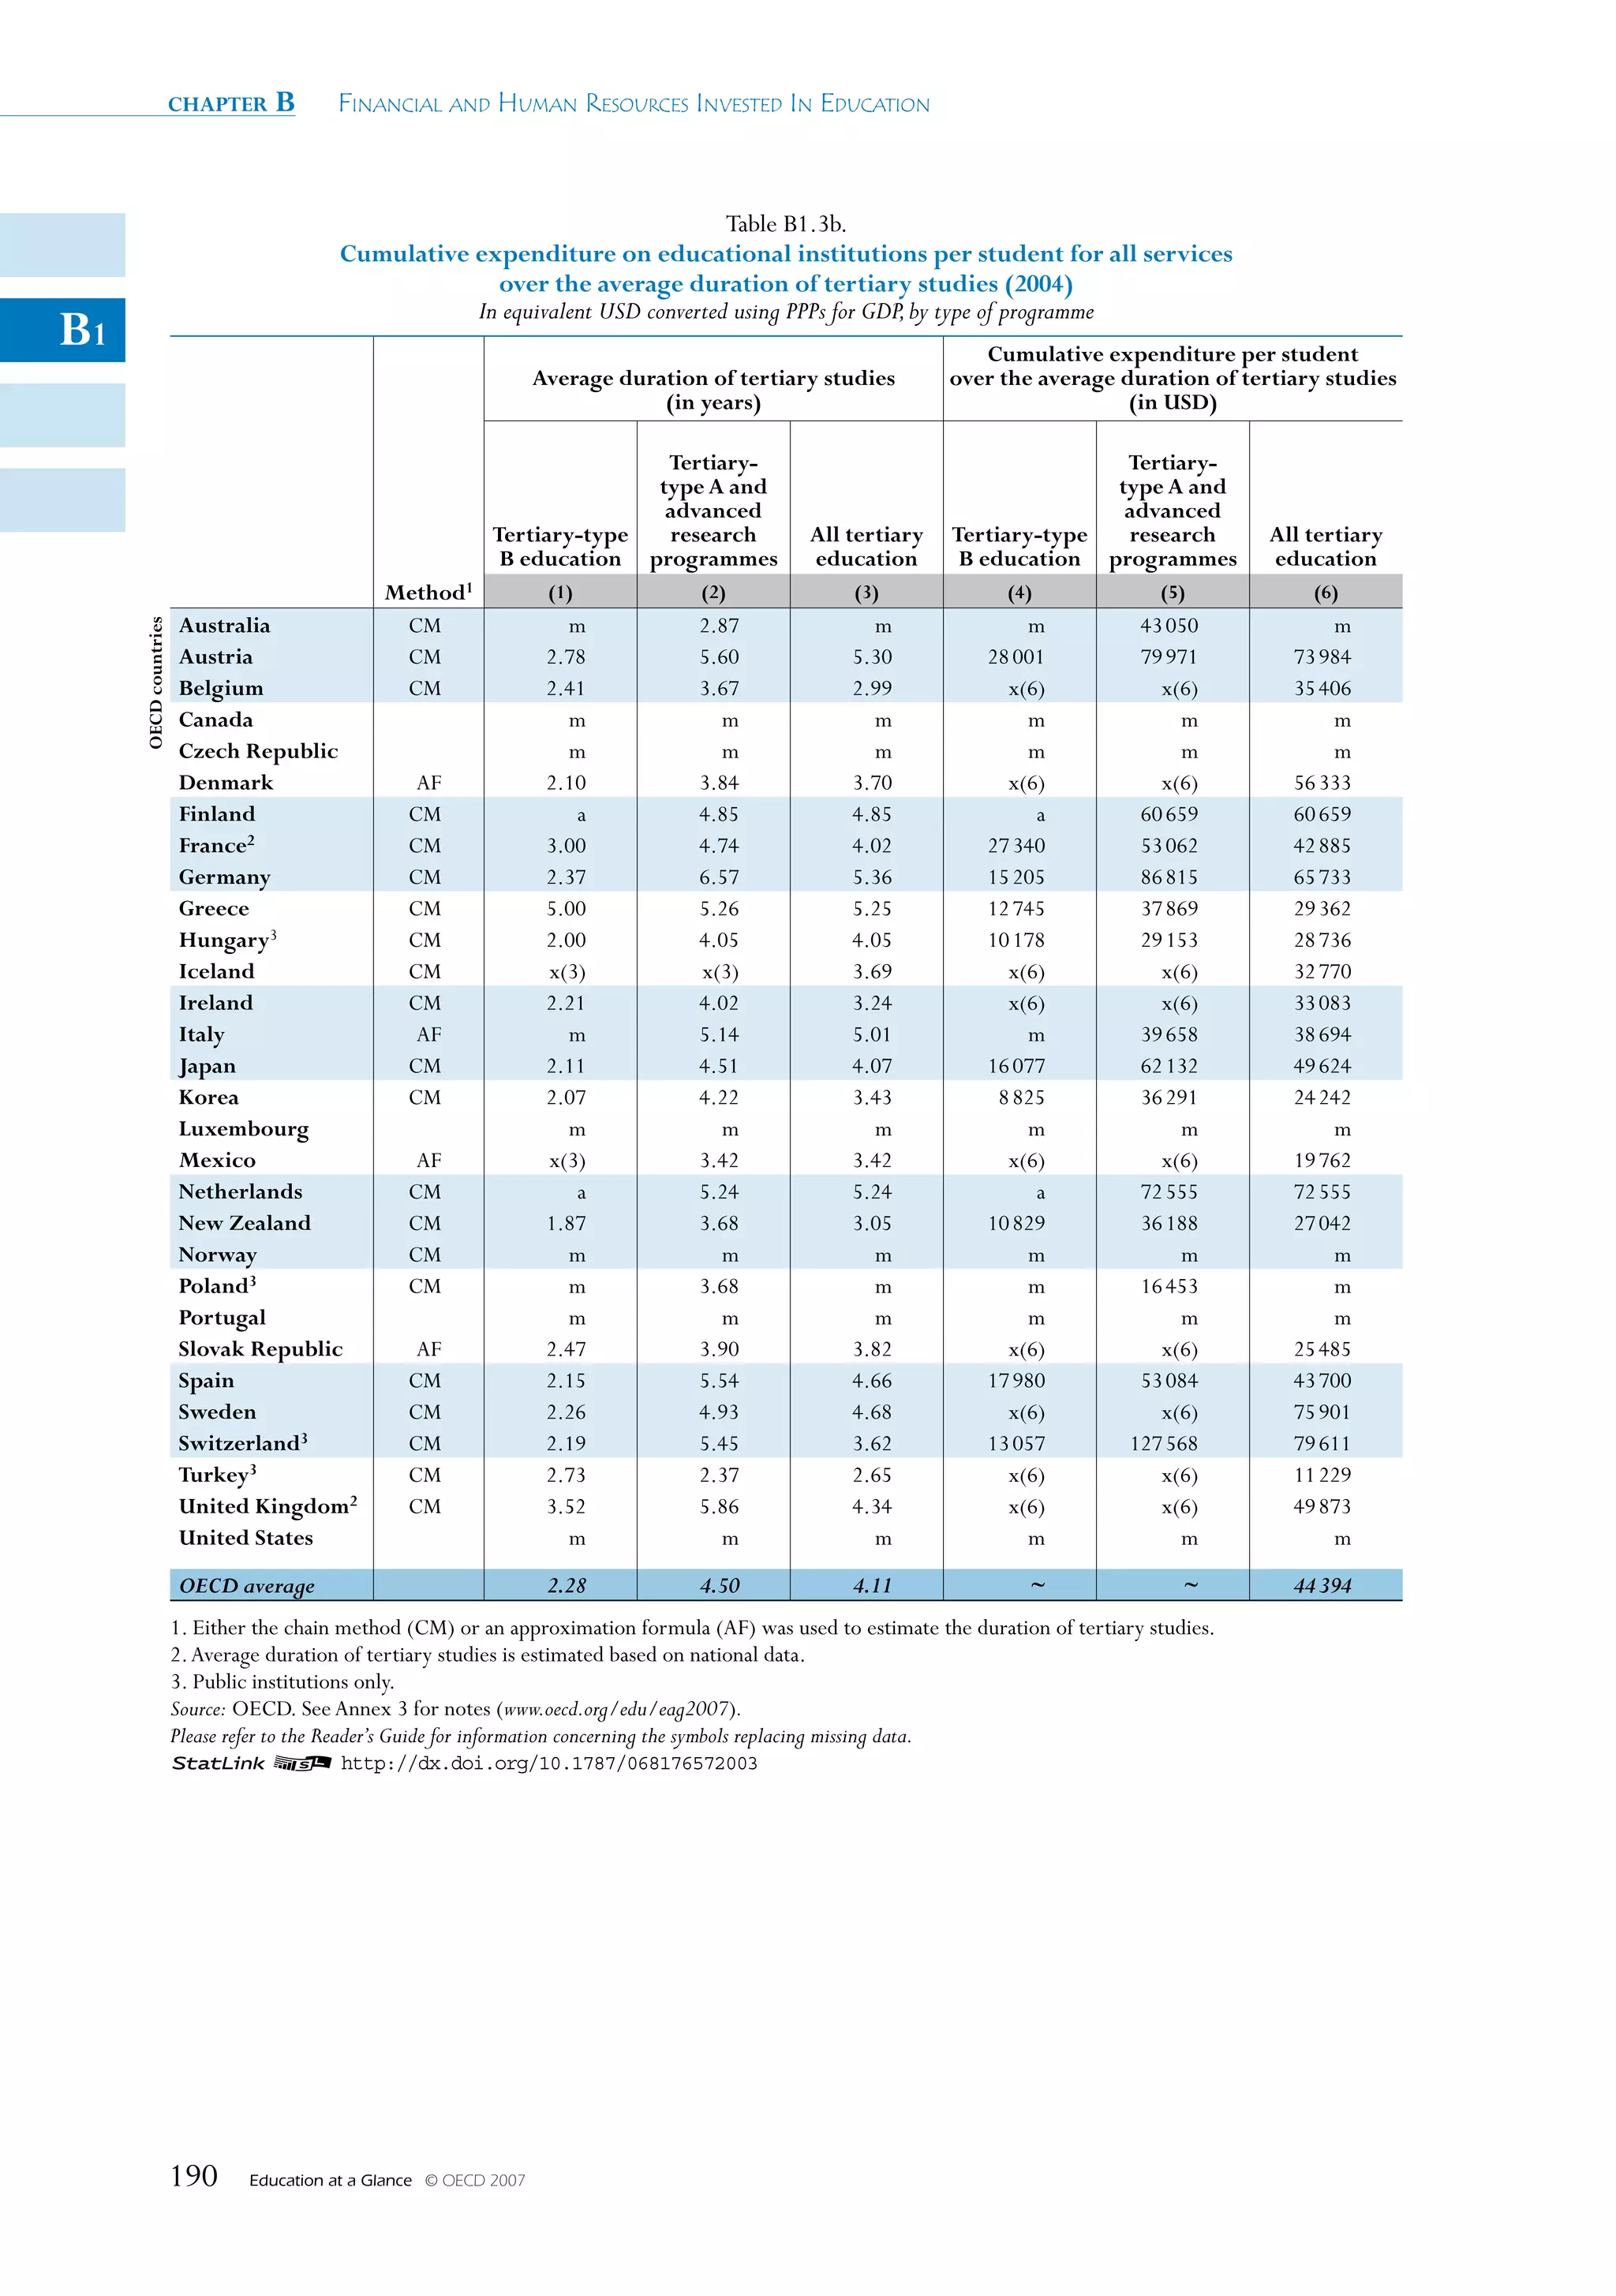
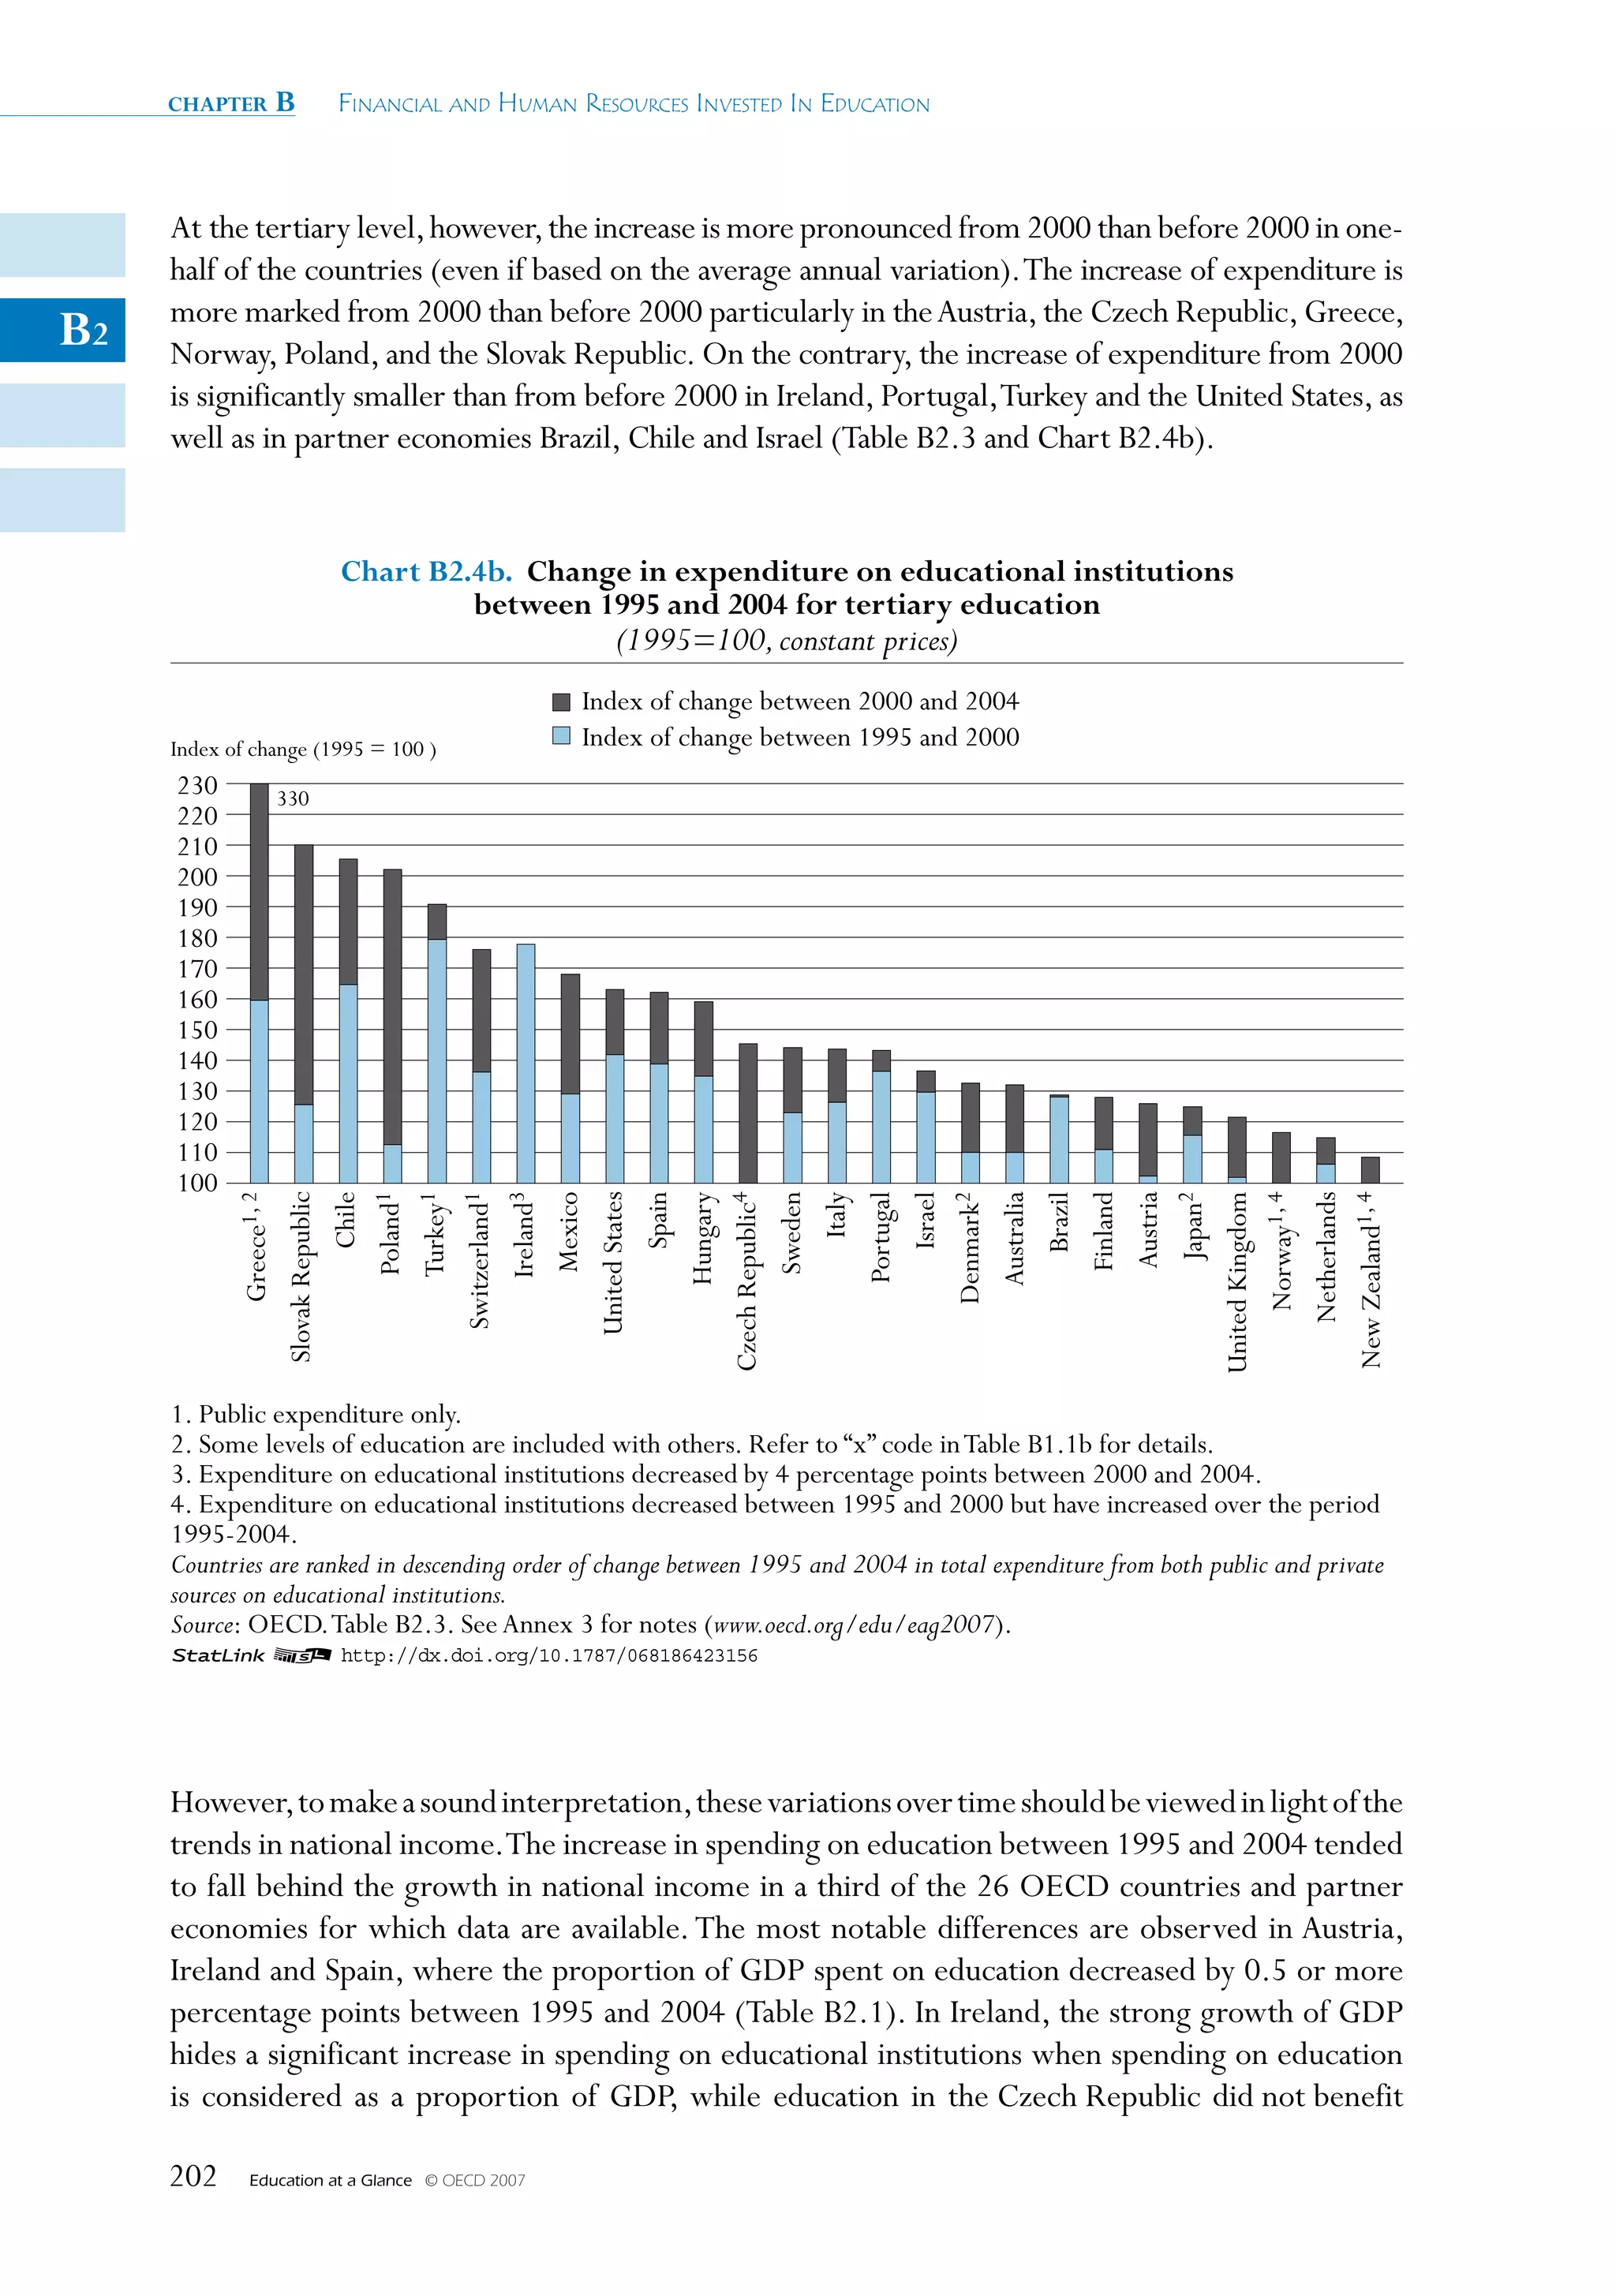
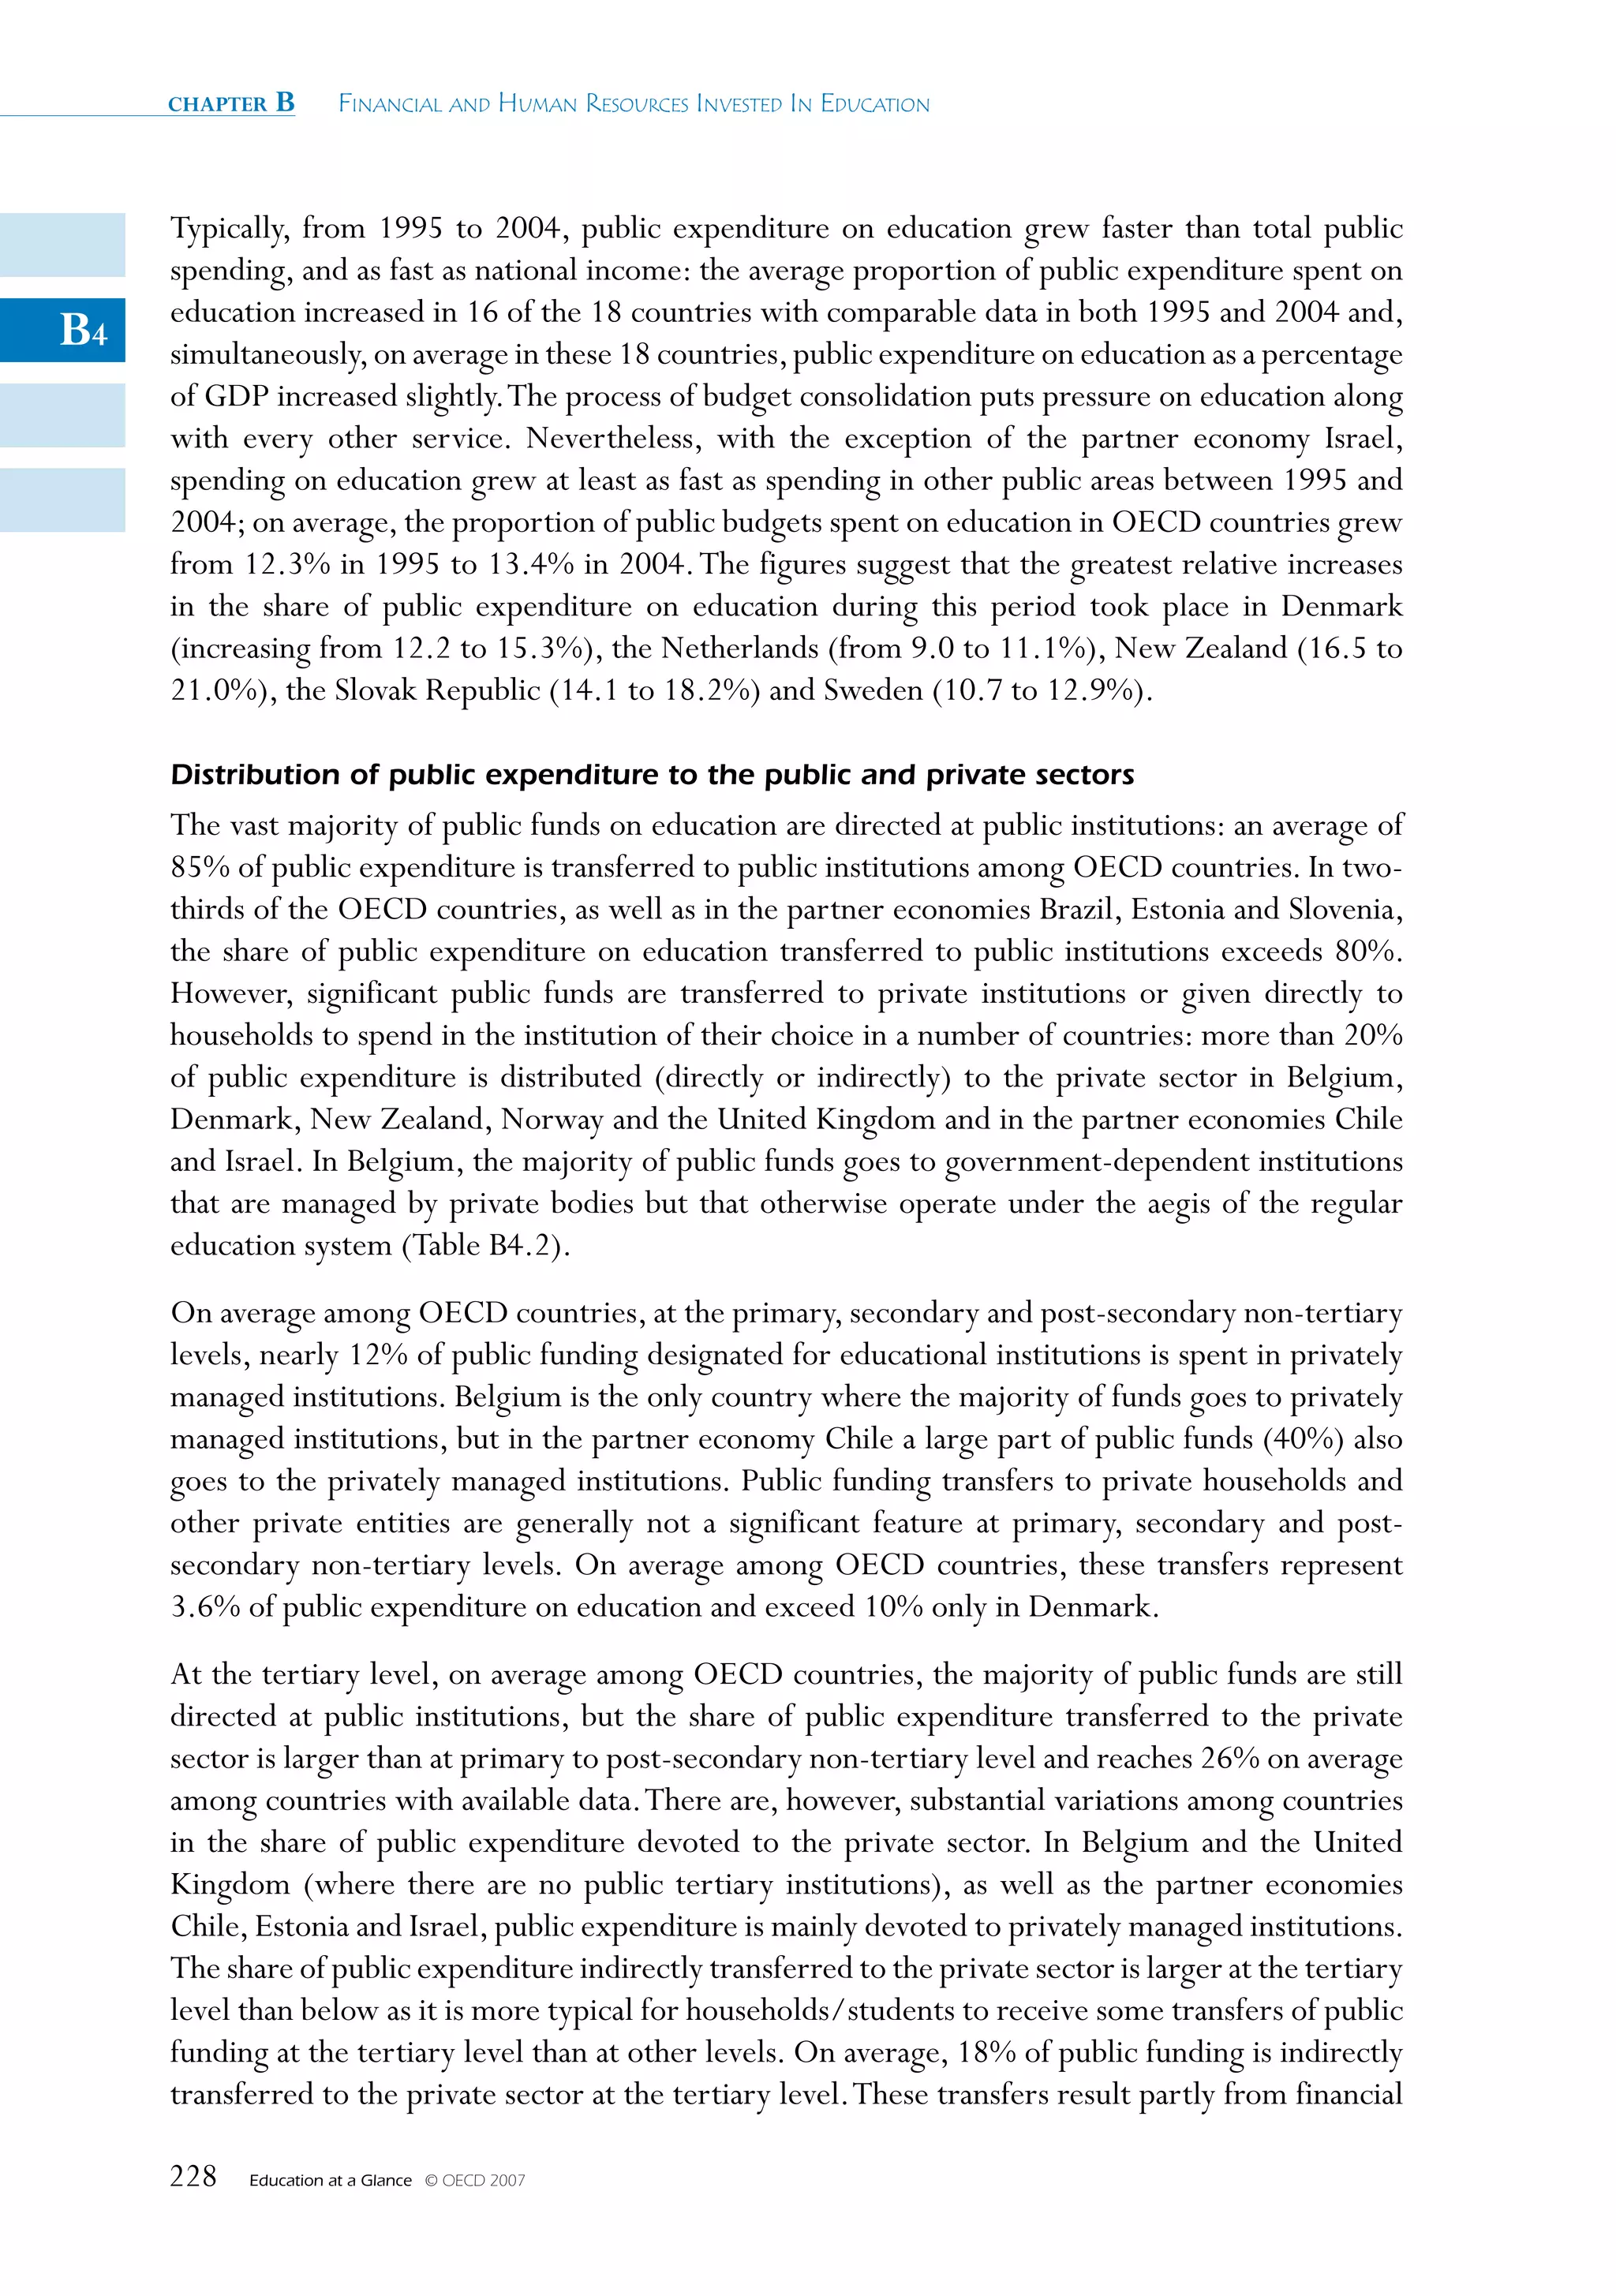
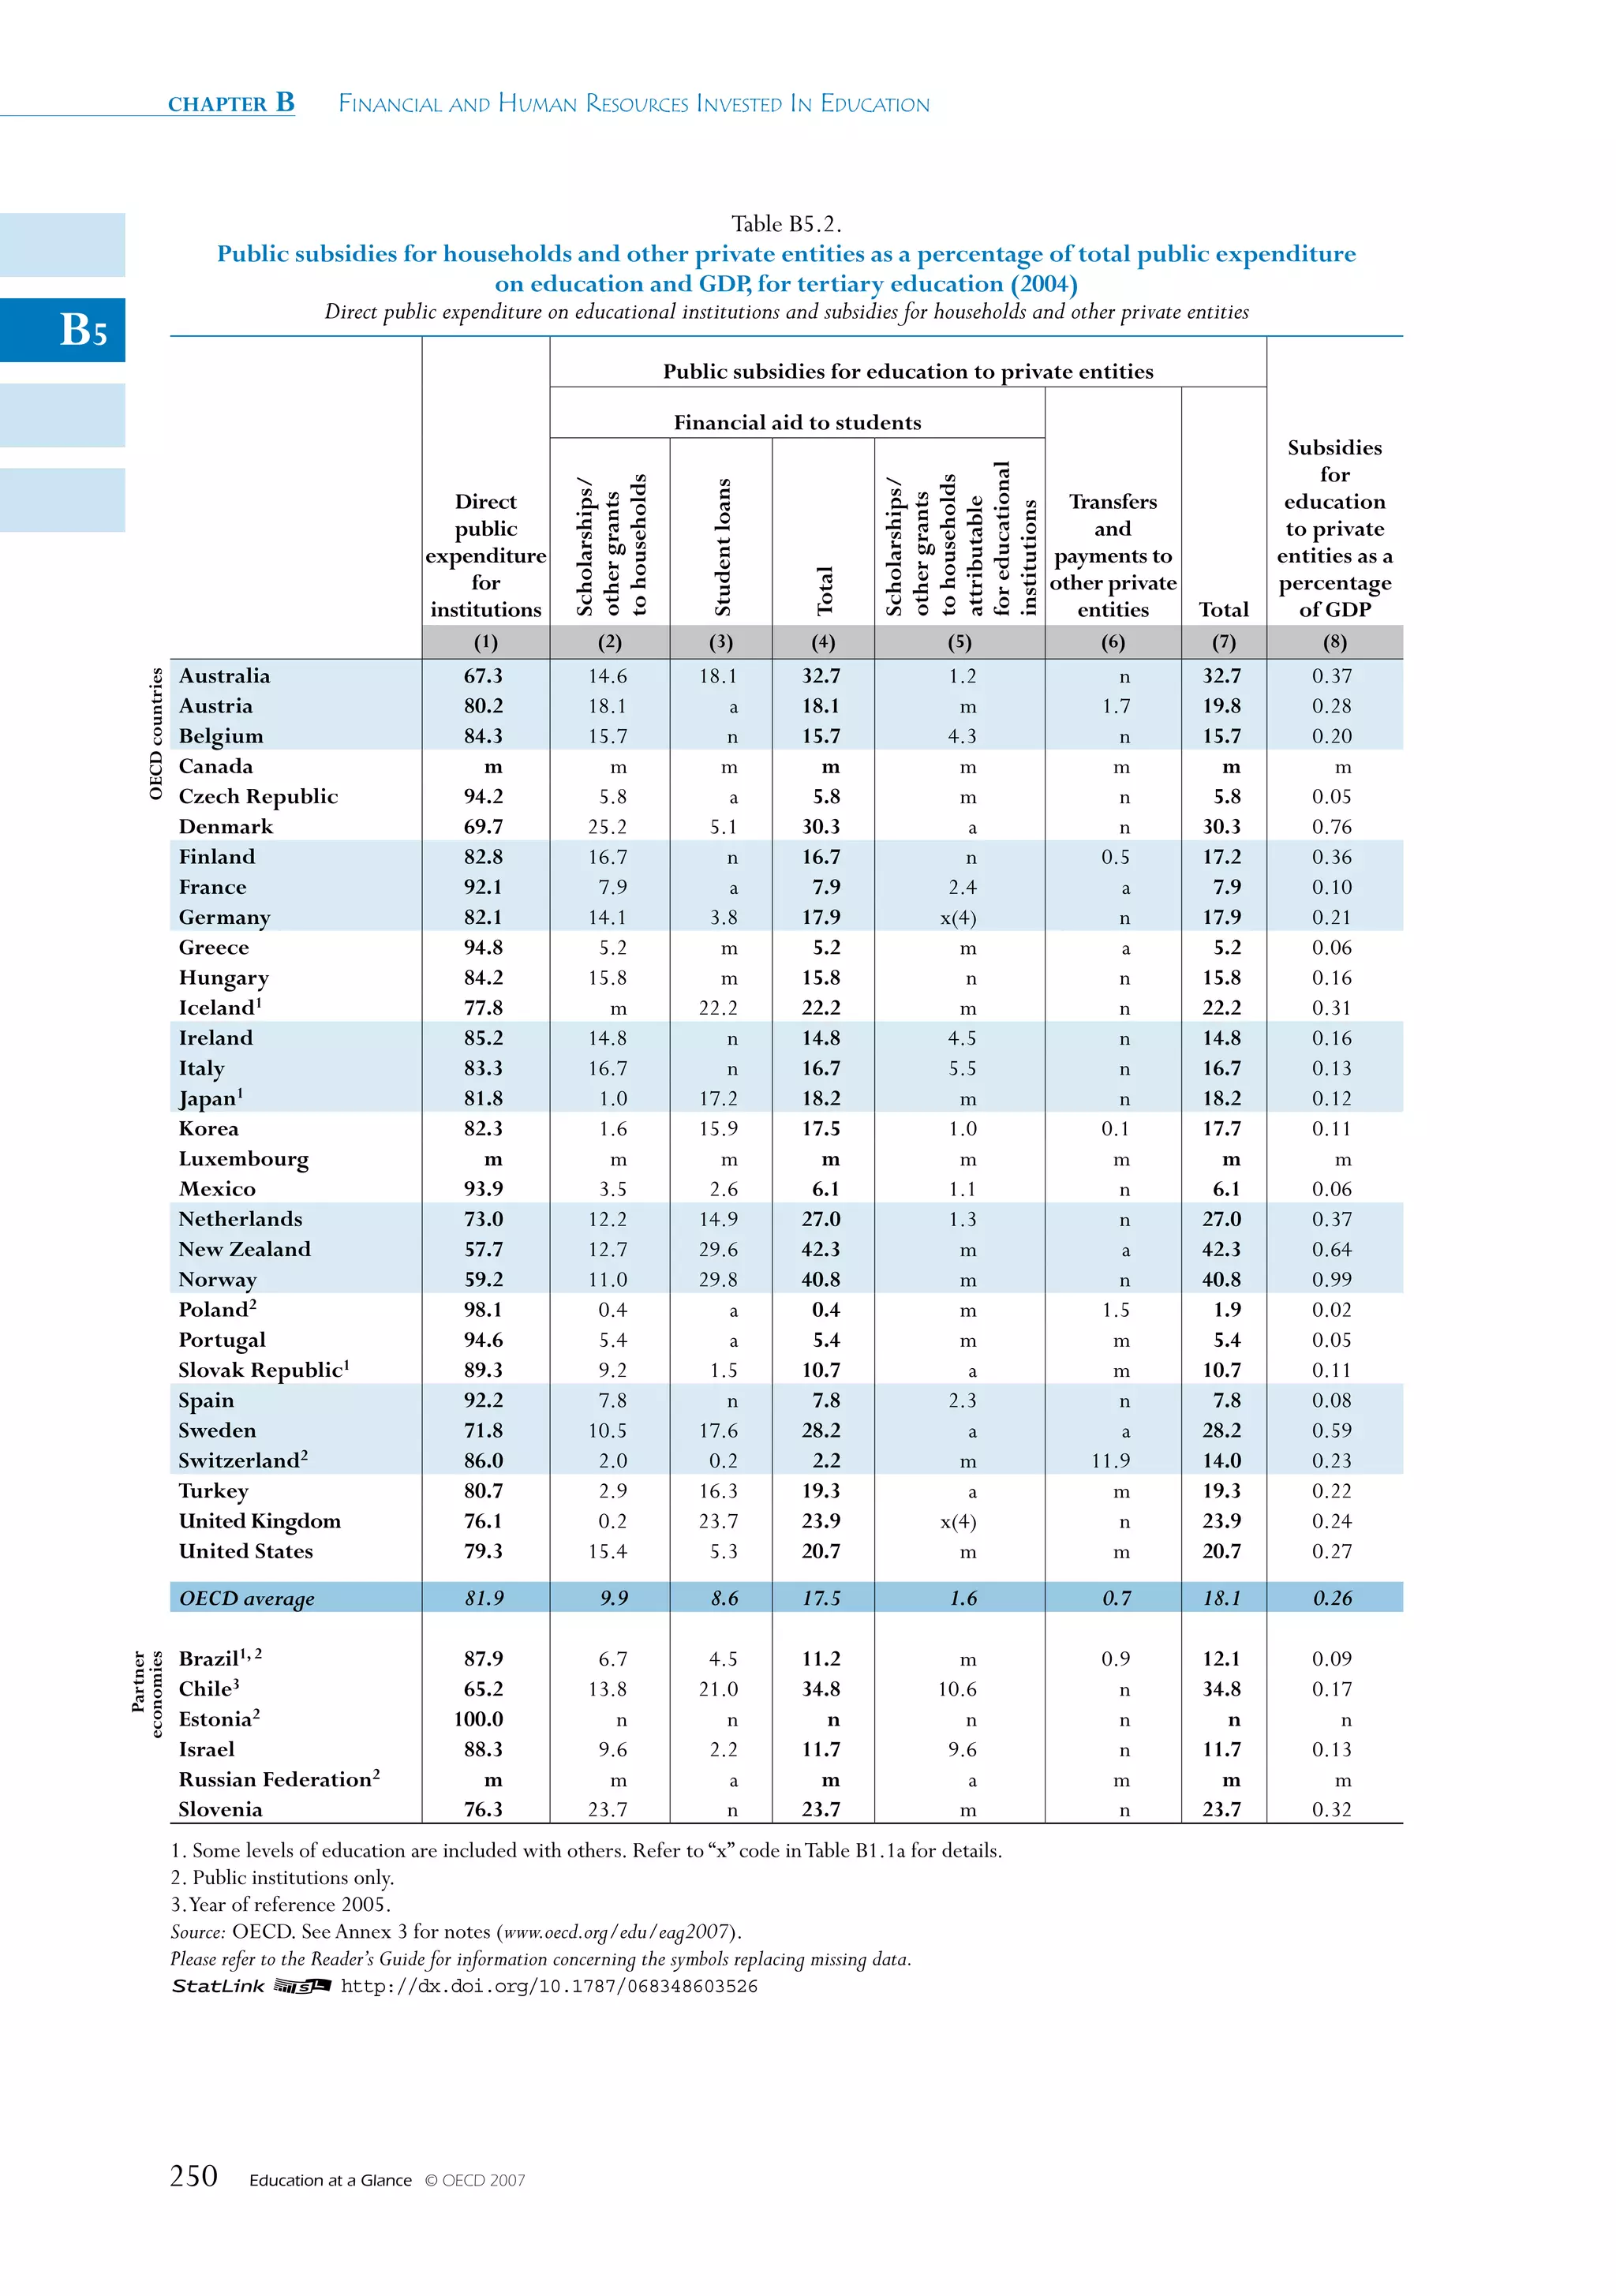
![How Much Do Tertiary Students Pay and What Public Subsidies Do They Receive? – INDICATOR B5 chapter B
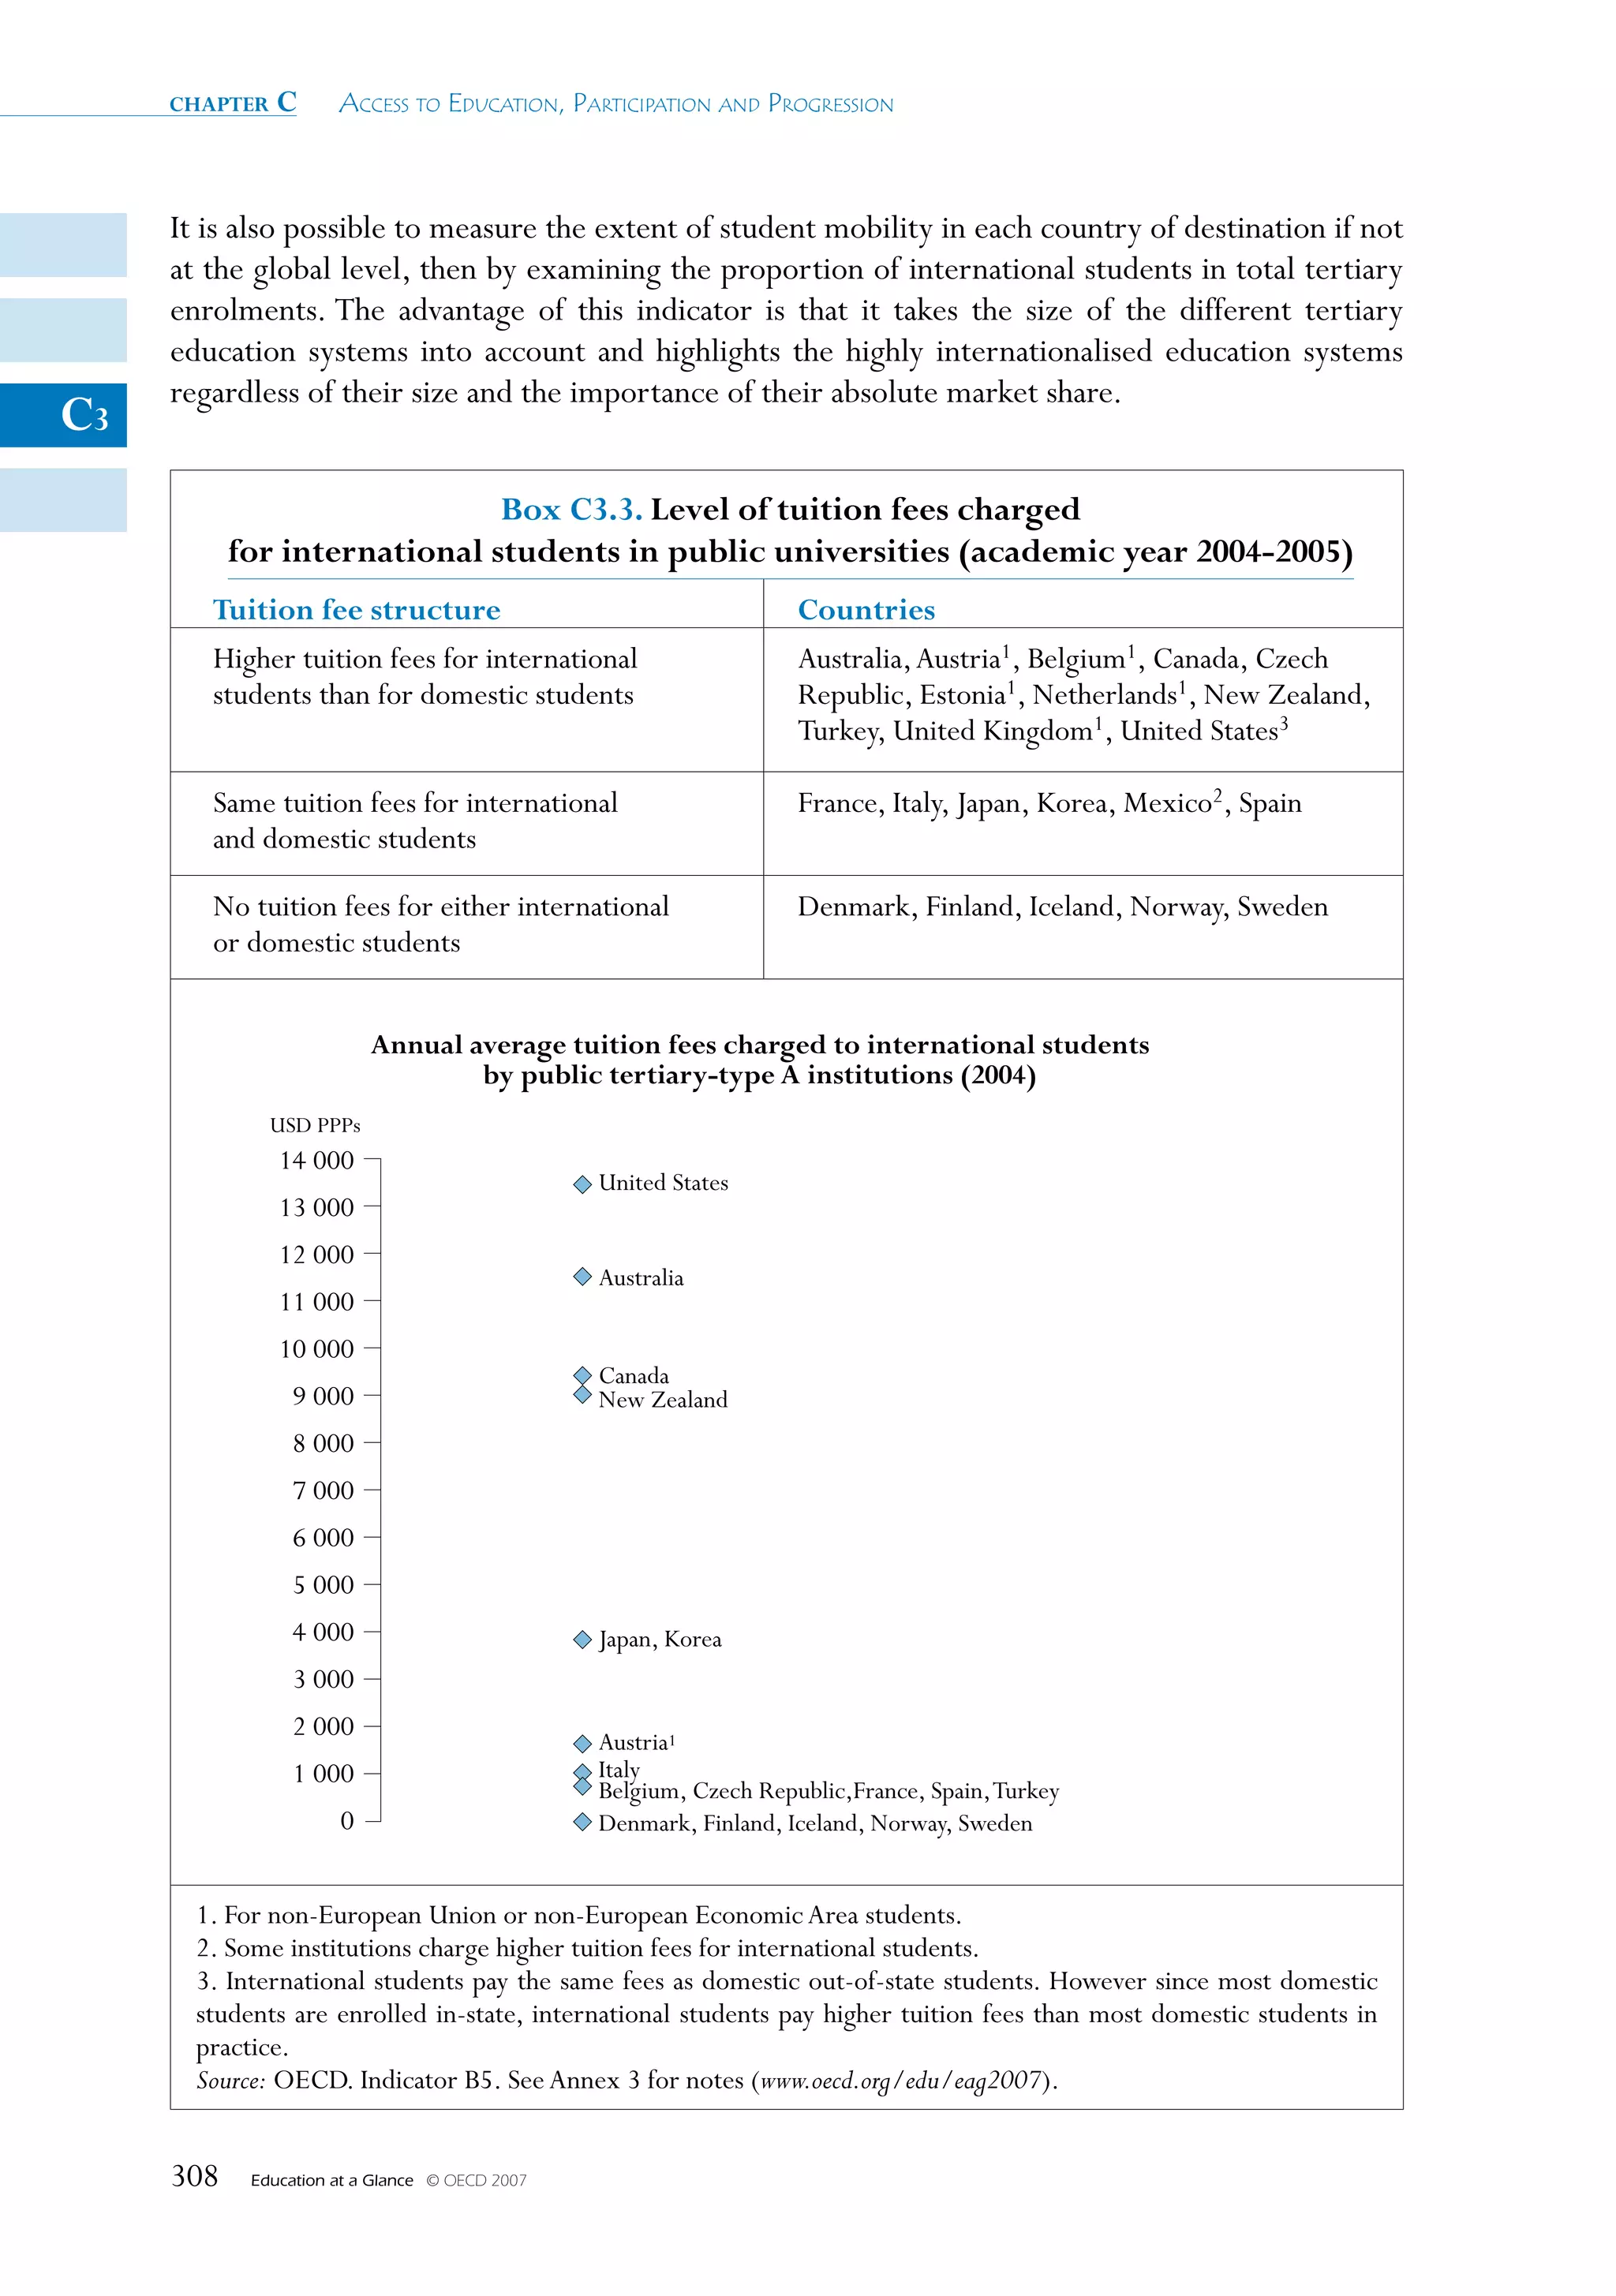
Table B5.1a. (continued)
Estimated annual average tuition fees charged by tertiary-type A educational institutions1
for national students (academic year 2004-2005)
In equivalent USD converted using PPPs, by type of institutions, based on full-time students
Amounts of tuition fees and associated proportions of students should be interpreted with caution as they result from the weighted average of
B5
the main Tertiary-type A programmes and do not cover all the educational institutions. However, the figures reported can be considered as good
proxies and show the difference among countries in tuition fees charged by main educational institutions and for the majority of students.
Annual average tuition fees in USD
Percentage of full-time charged by institutions
students enrolled in: (for full-time students)
Independent
Independent
Government
Government
institutions
institutions
institutions
institutions
dependent
dependent
private
private
private
private
Public
Public
Comment
(1) (2) (3) (4) (5) (6) (7)
Norway 87 13 a No tuition fees From 4 800 a
OECD countries
to 5 800
Poland 87 a 13 No tuition fees a 2 710
Portugal m m m m m m
Slovak Republic m m m m m m
Spain 91 a 9 795 a m
Sweden 93 7 n No tuition fees No tuition fees m Excluding mandatory membership fees to student
unions.
Switzerland m m m m m m
Turkey 92 a 8 276 a 14 430 For public institutions, only undergraduate
[9 020 to and masters levels.
20 445]
United Kingdom a 100 n a 1 859 1 737
United States 68 a 32 5 027 a 18 604 Including non-national students.
Brazil m m m m m m
Partner
economies
Chile m m m m m m
Estonia a 86 14 a From 2 190 From 1 190
to 4 660 to 9 765
Israel a 87 13 a From 2 658 From 6 502 Tuition fees charged by institutions are higher for
nd st
to 3 452 to 8 359 2 degree than for 1 degree programmes.
Russian Fed. m m m m m m
Slovenia m m m m m m
1. Without taking into account scholarships/grants that the student may receive.
2. Tuition fees charged for programmes are the same in public than in private institutions but the distribution of students differ between public
and private institutions explaining that the weighted average is not the same.
3. Weighted average on the whole tertiary education.
Source: OECD. See Annex 3 for notes (www.oecd.org/edu/eag2007).
Please refer to the Reader’s Guide for information concerning the symbols replacing missing data.
1 2 http://dx.doi.org/10.1787/068348603526
Education at a Glance © OECD 2007 245](https://image.slidesharecdn.com/educacionsegunocde2007-100705022559-phpapp01/75/Educacion-OCDE-2007-245-2048.jpg)


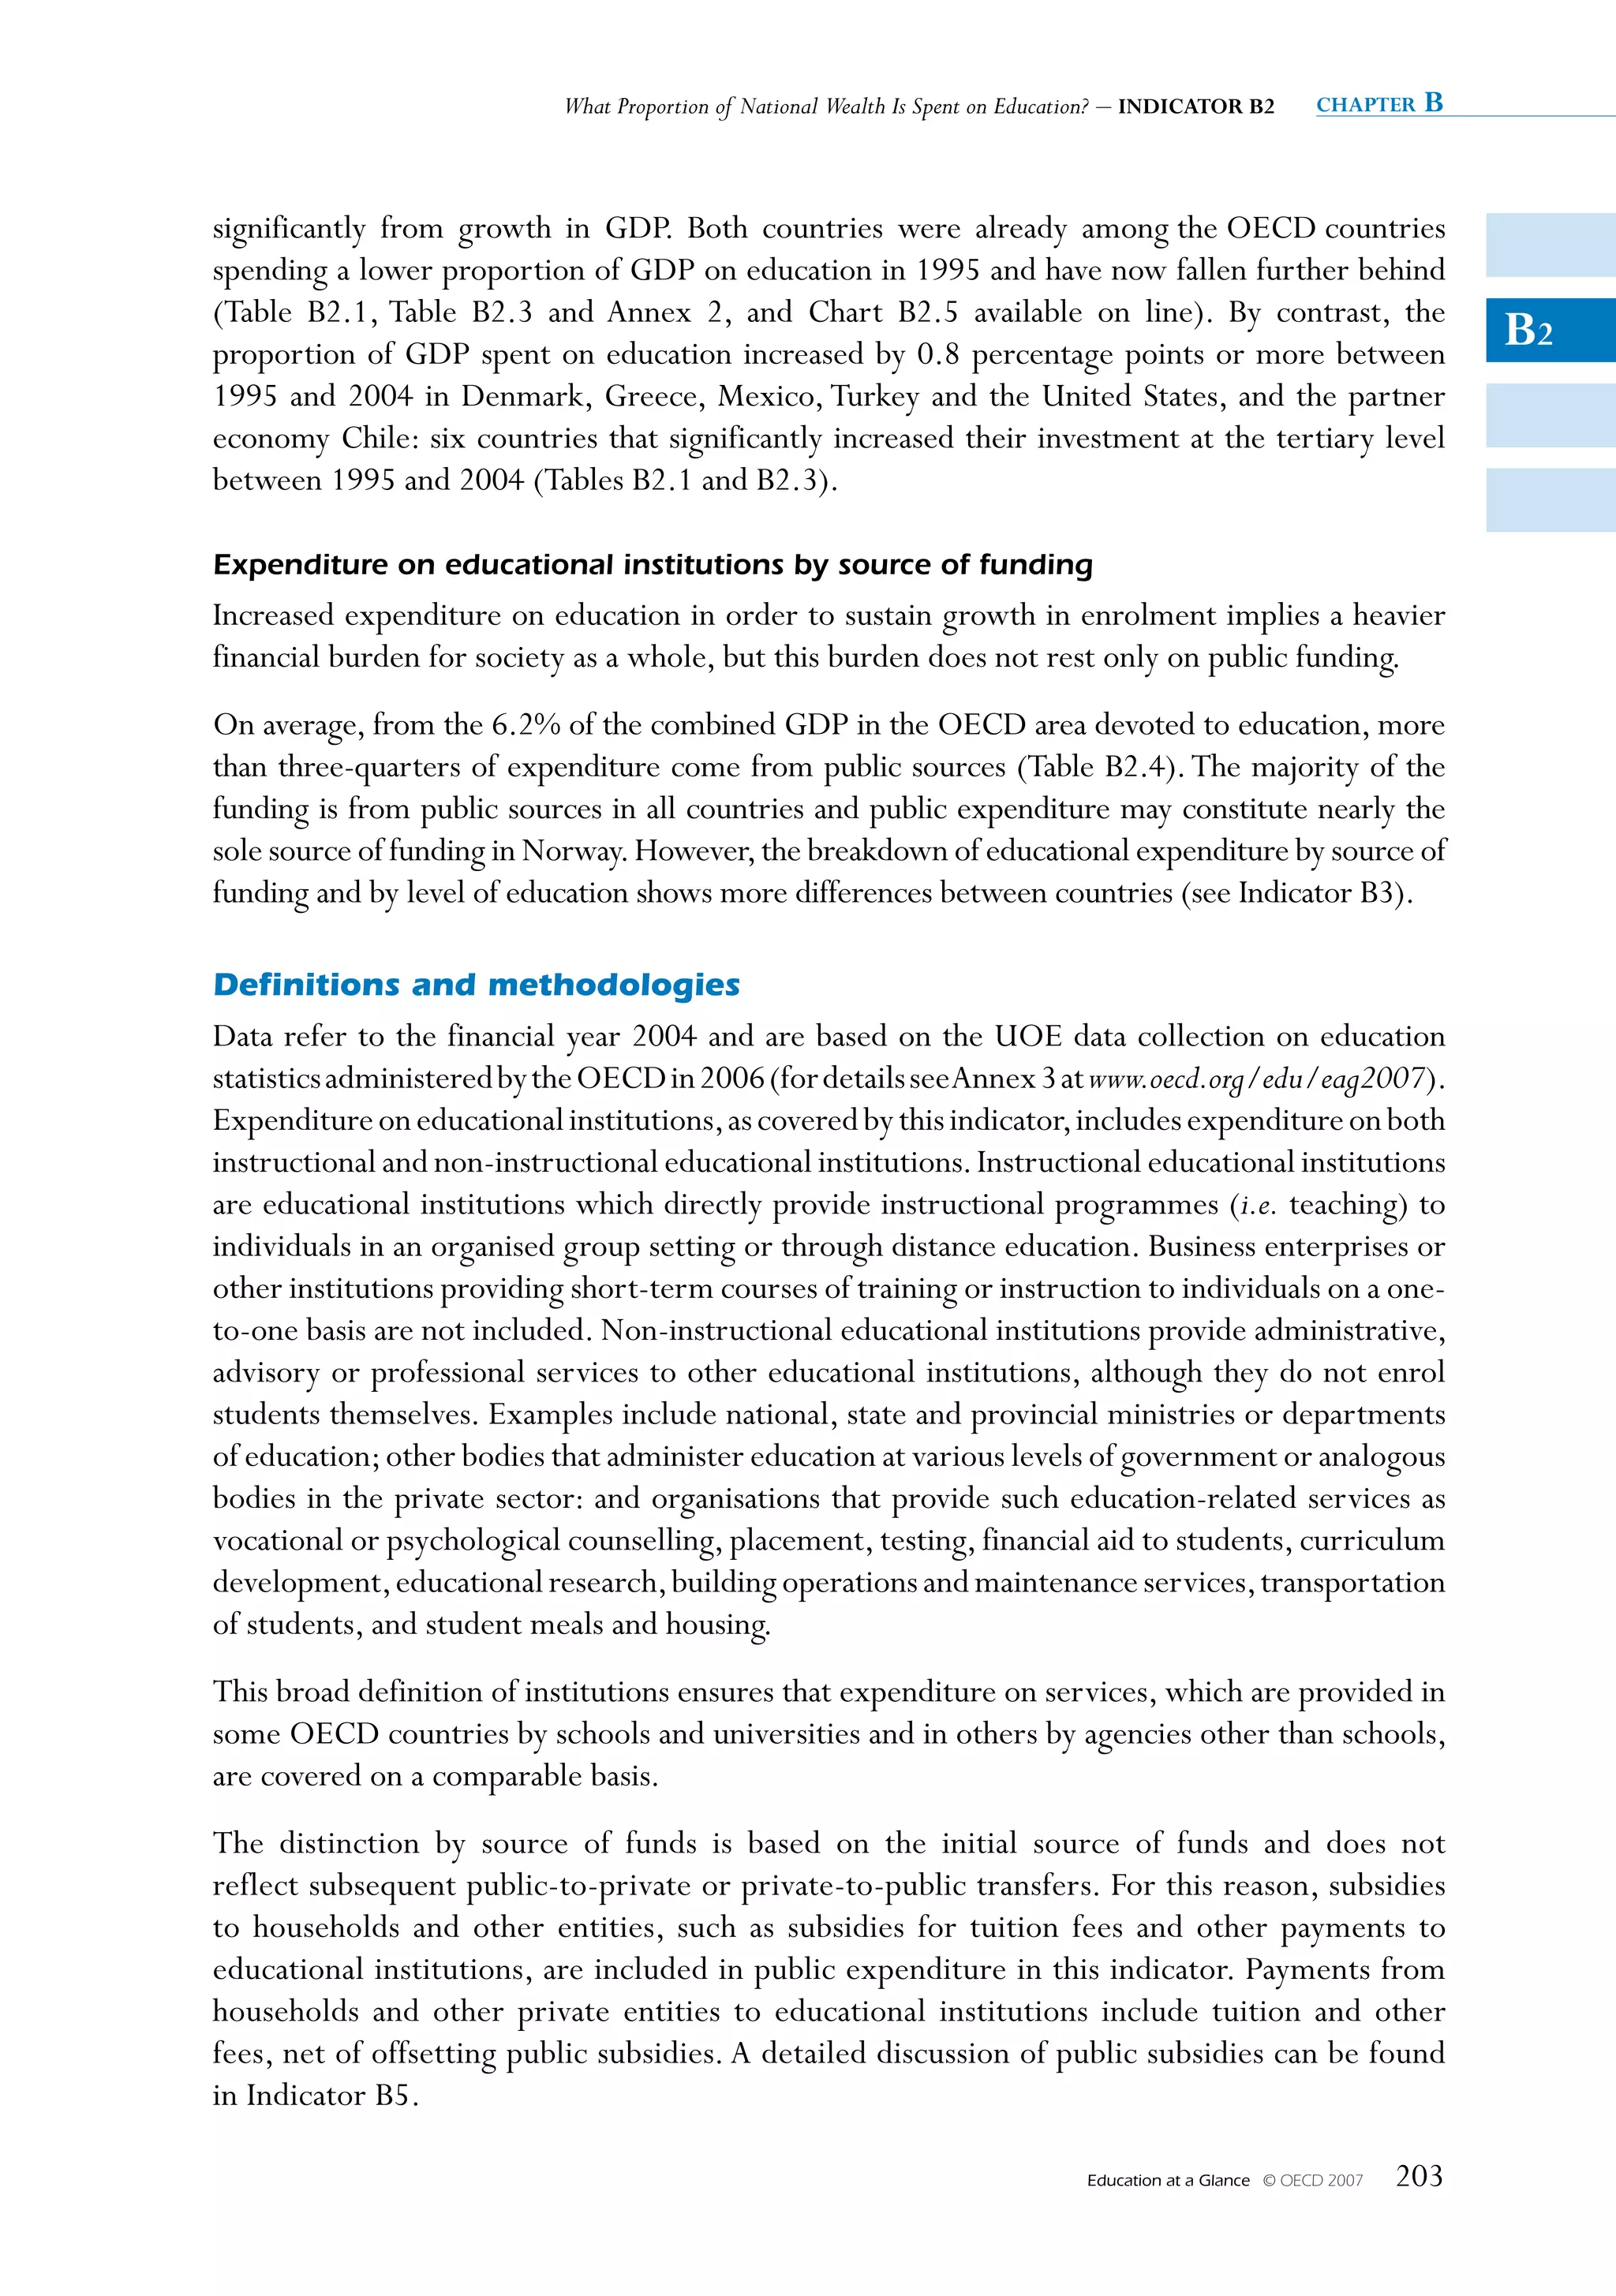
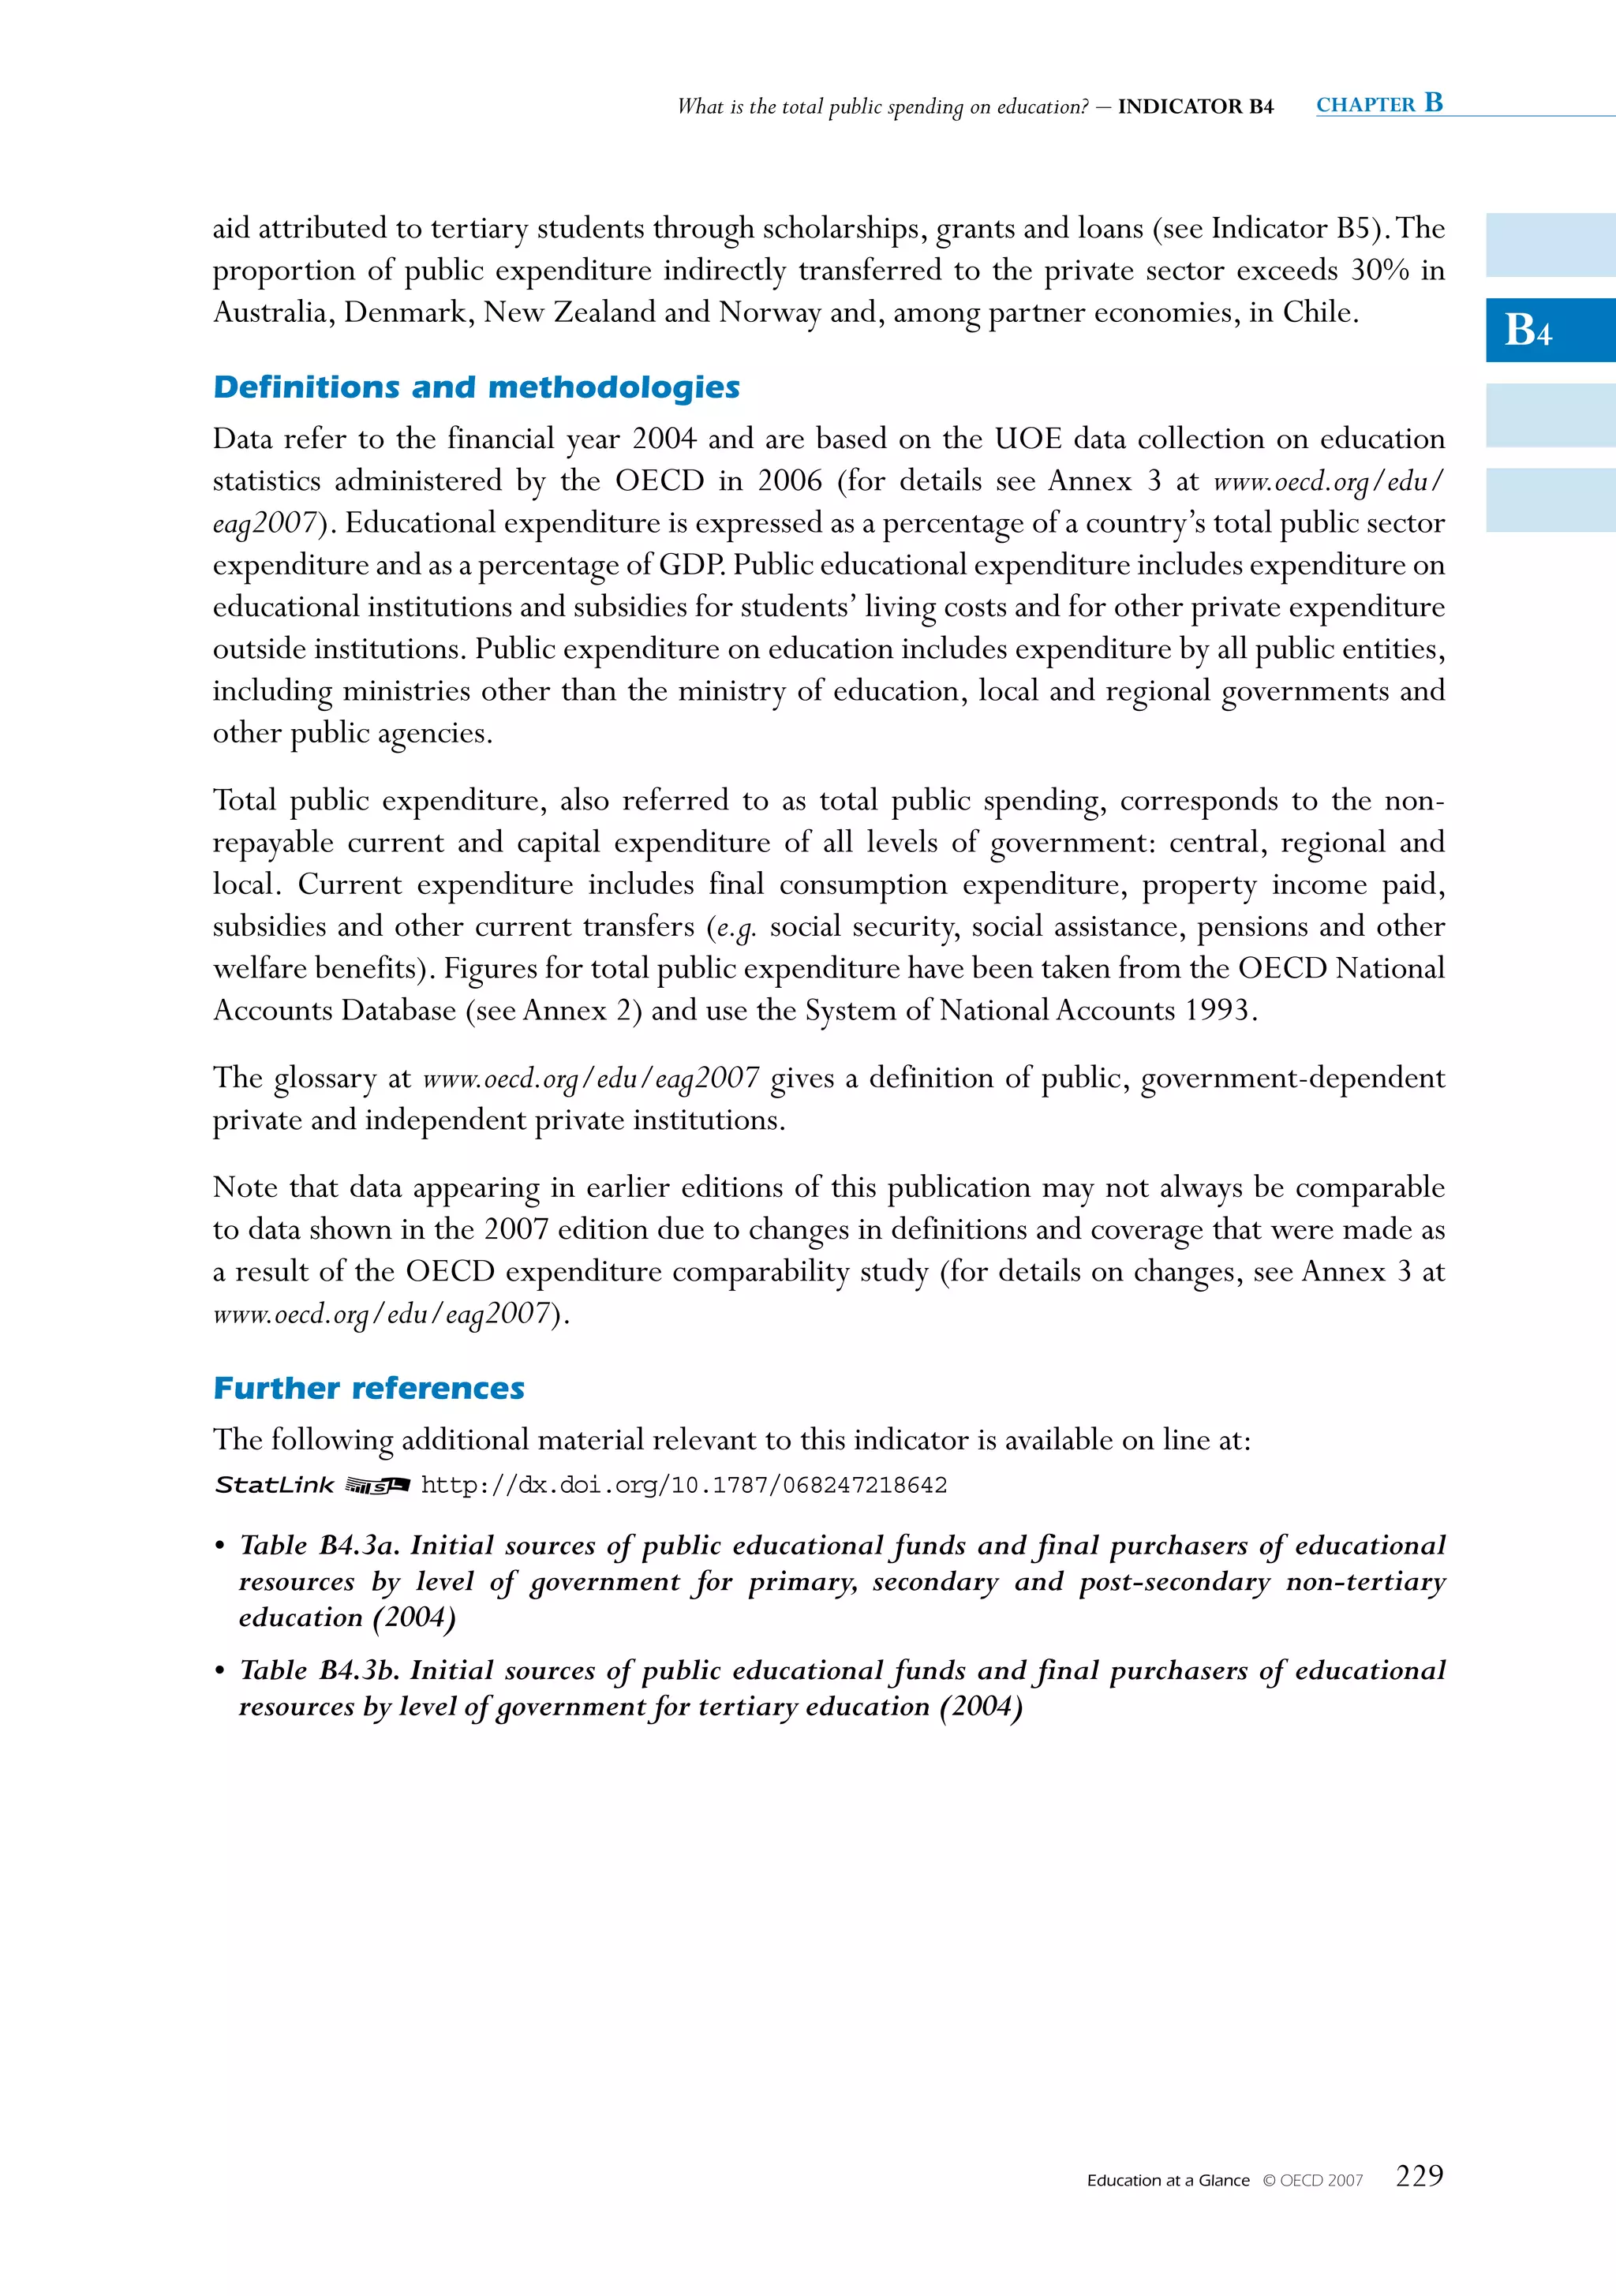
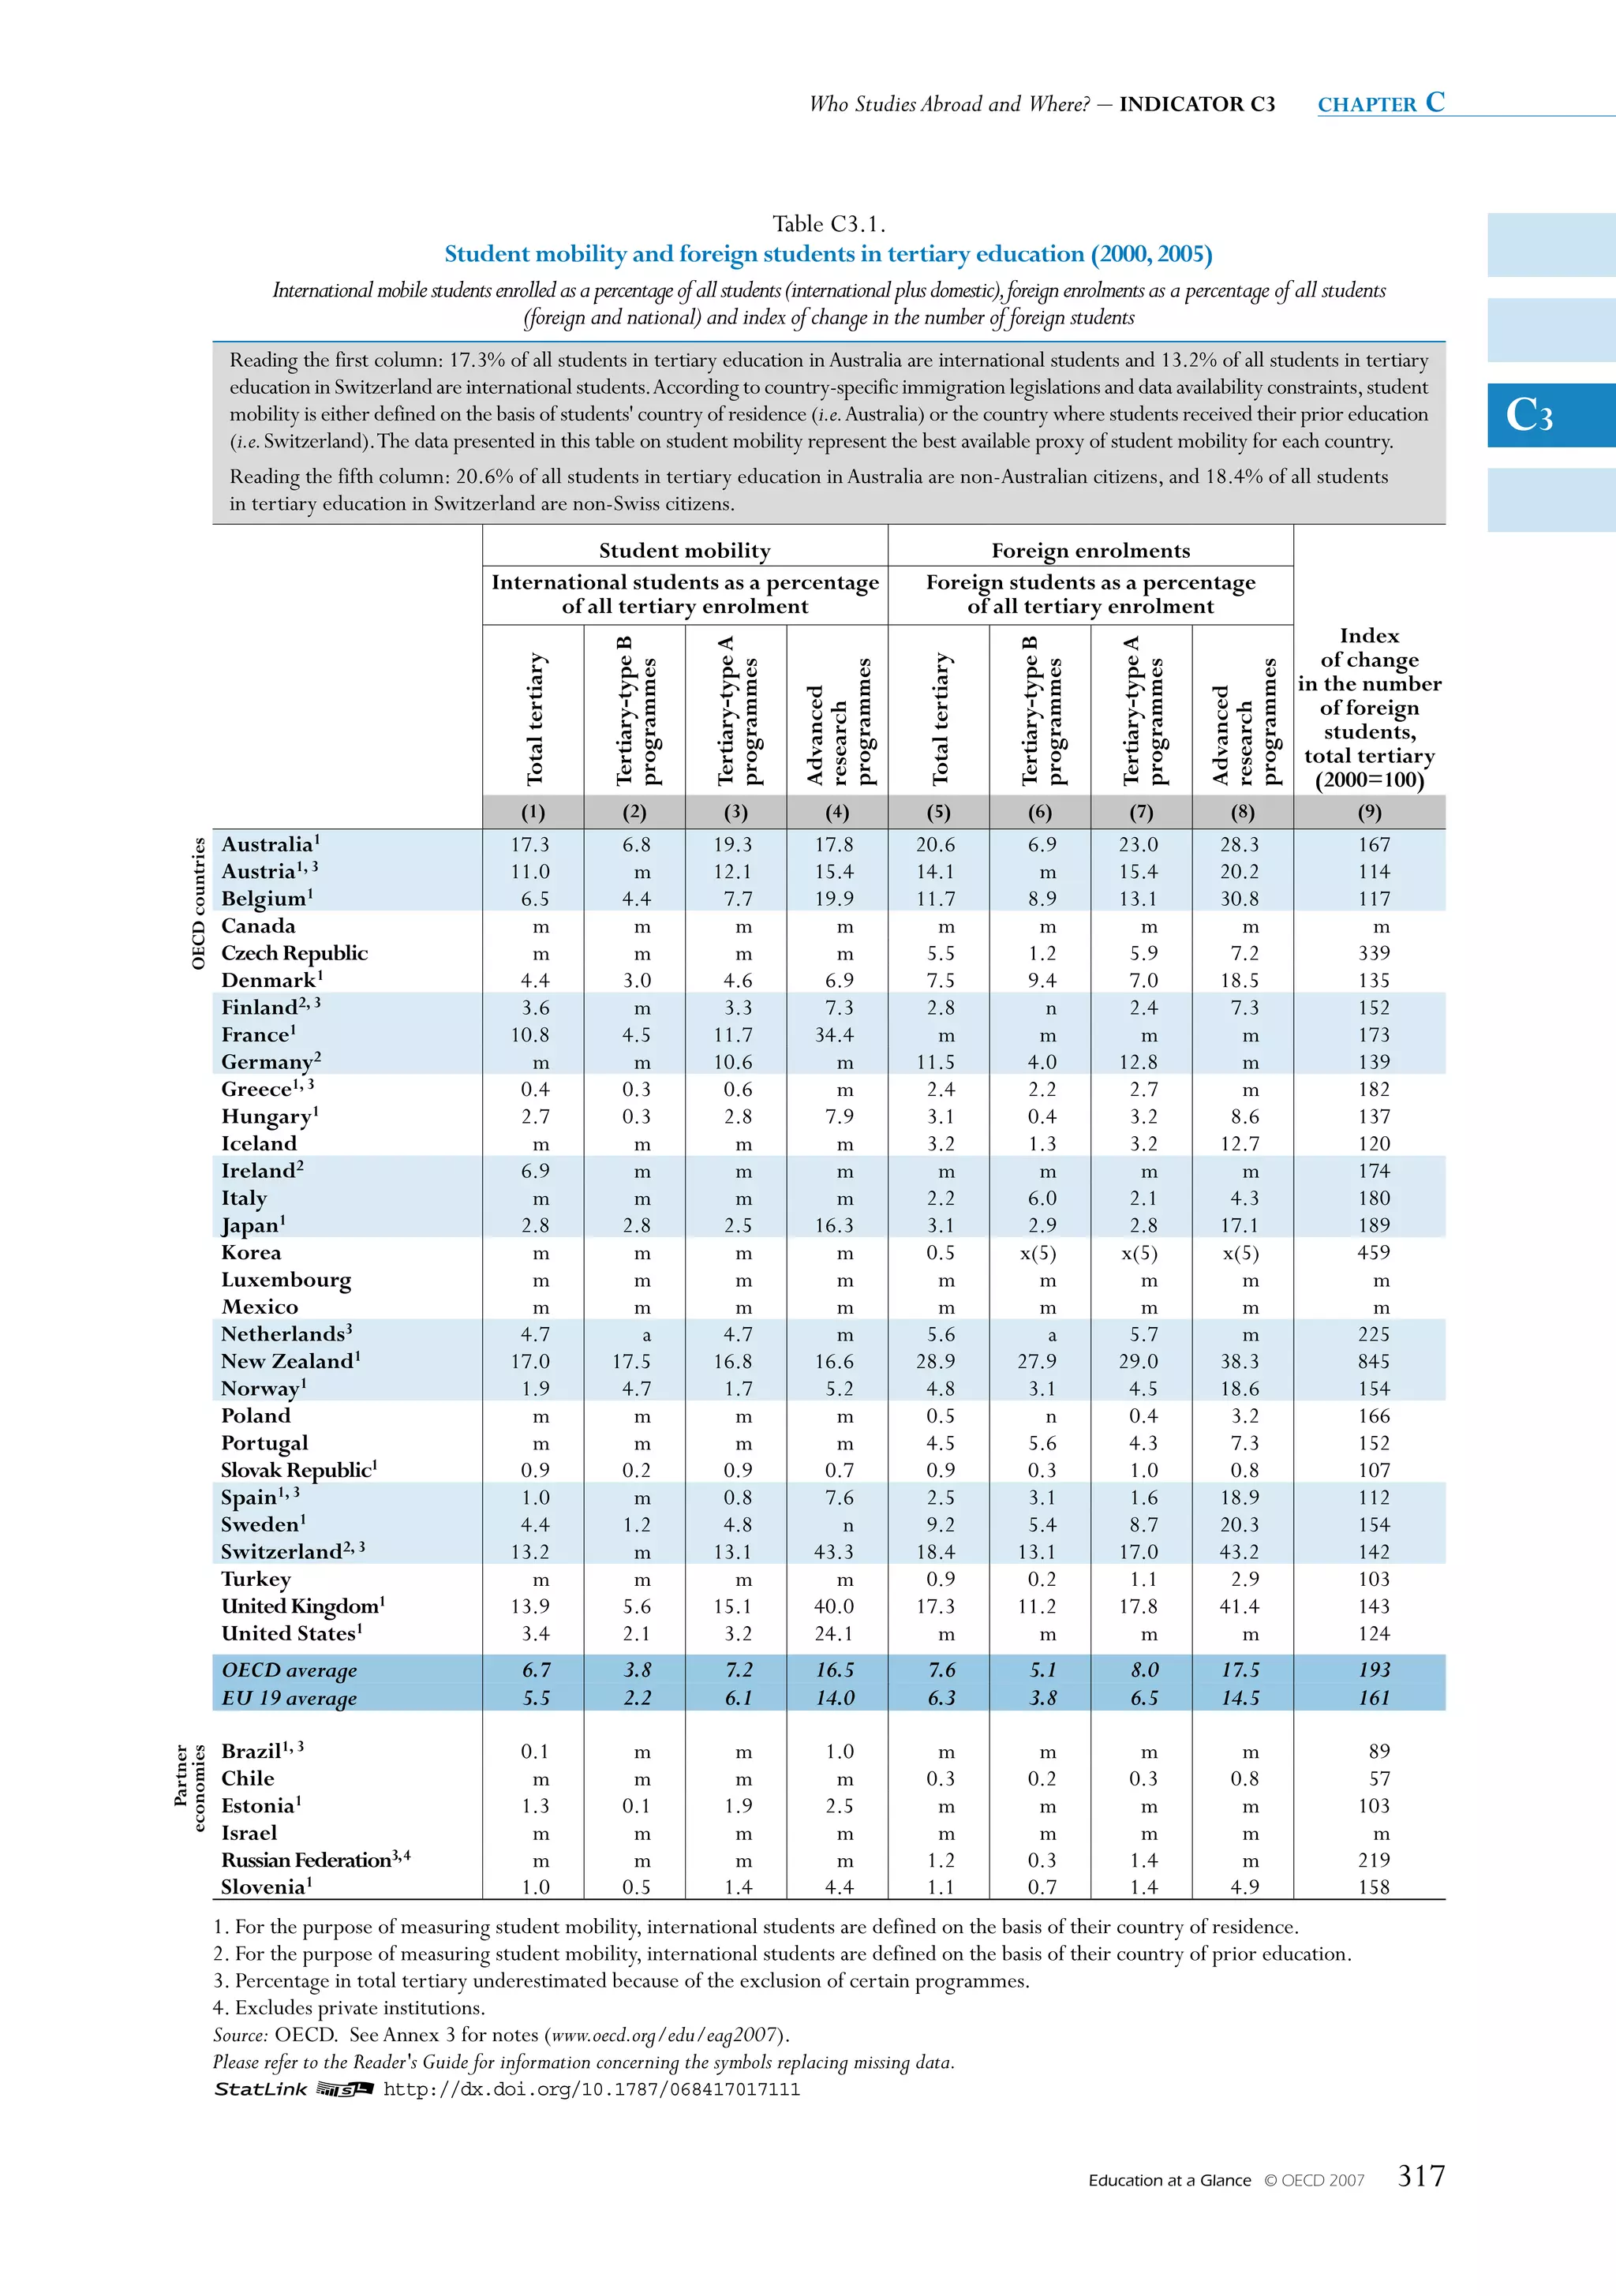
![Who Studies Abroad and Where? – INDICATOR C3 chapter c
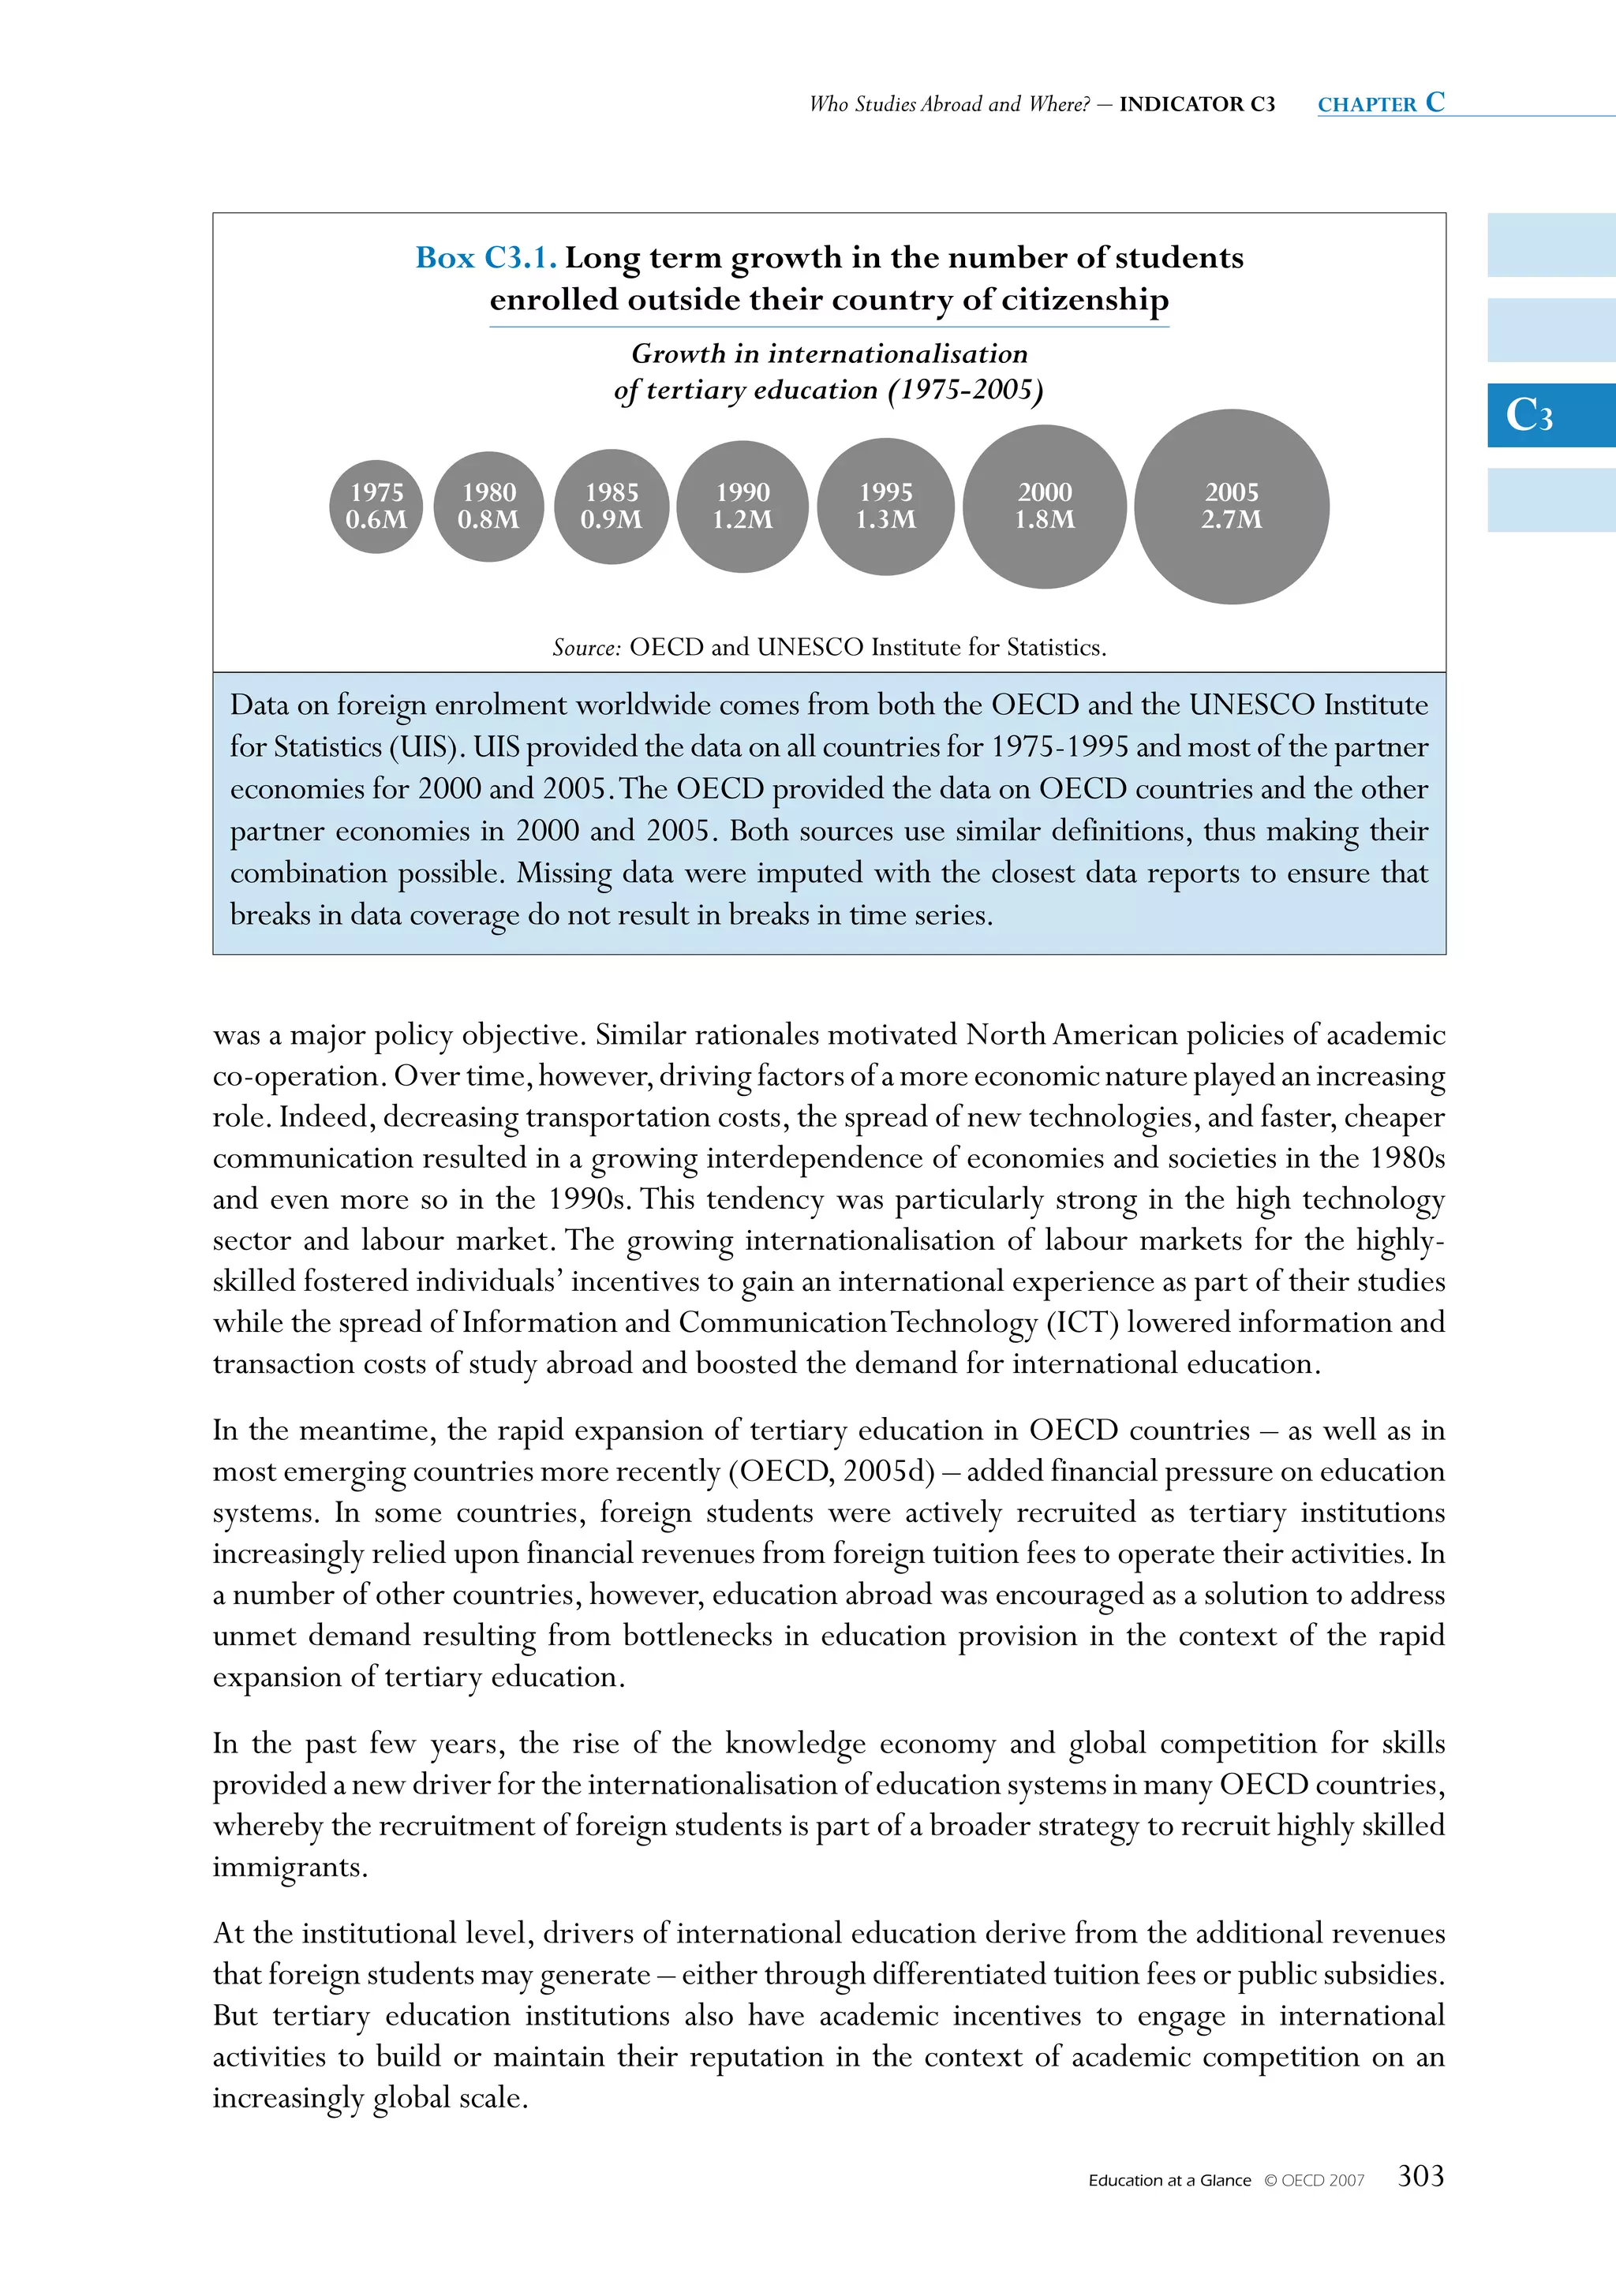
New Zealand and the partner economies South Africa and the Russian Federation expanded by
1 percentage point or more.The growth in market position was most impressive for New Zealand
(2.1%), thereby positioning the country among the big players in the international education
market (Chart C3.3).
These trends underline the different dynamics of international education in OECD and partner C3
economies, and reflect different emphases of internationalisation policies, ranging from pro-
active marketing policies in the Asia-Pacific region to a more passive approach in the traditionally
dominant United States. The United States foreign student intake was also affected by the
tightening of the conditions of entry for international students in the aftermath of the events of
11 September 2001 (see Indicator C3, Education at a Glance 2005 [OECD, 2005d]).
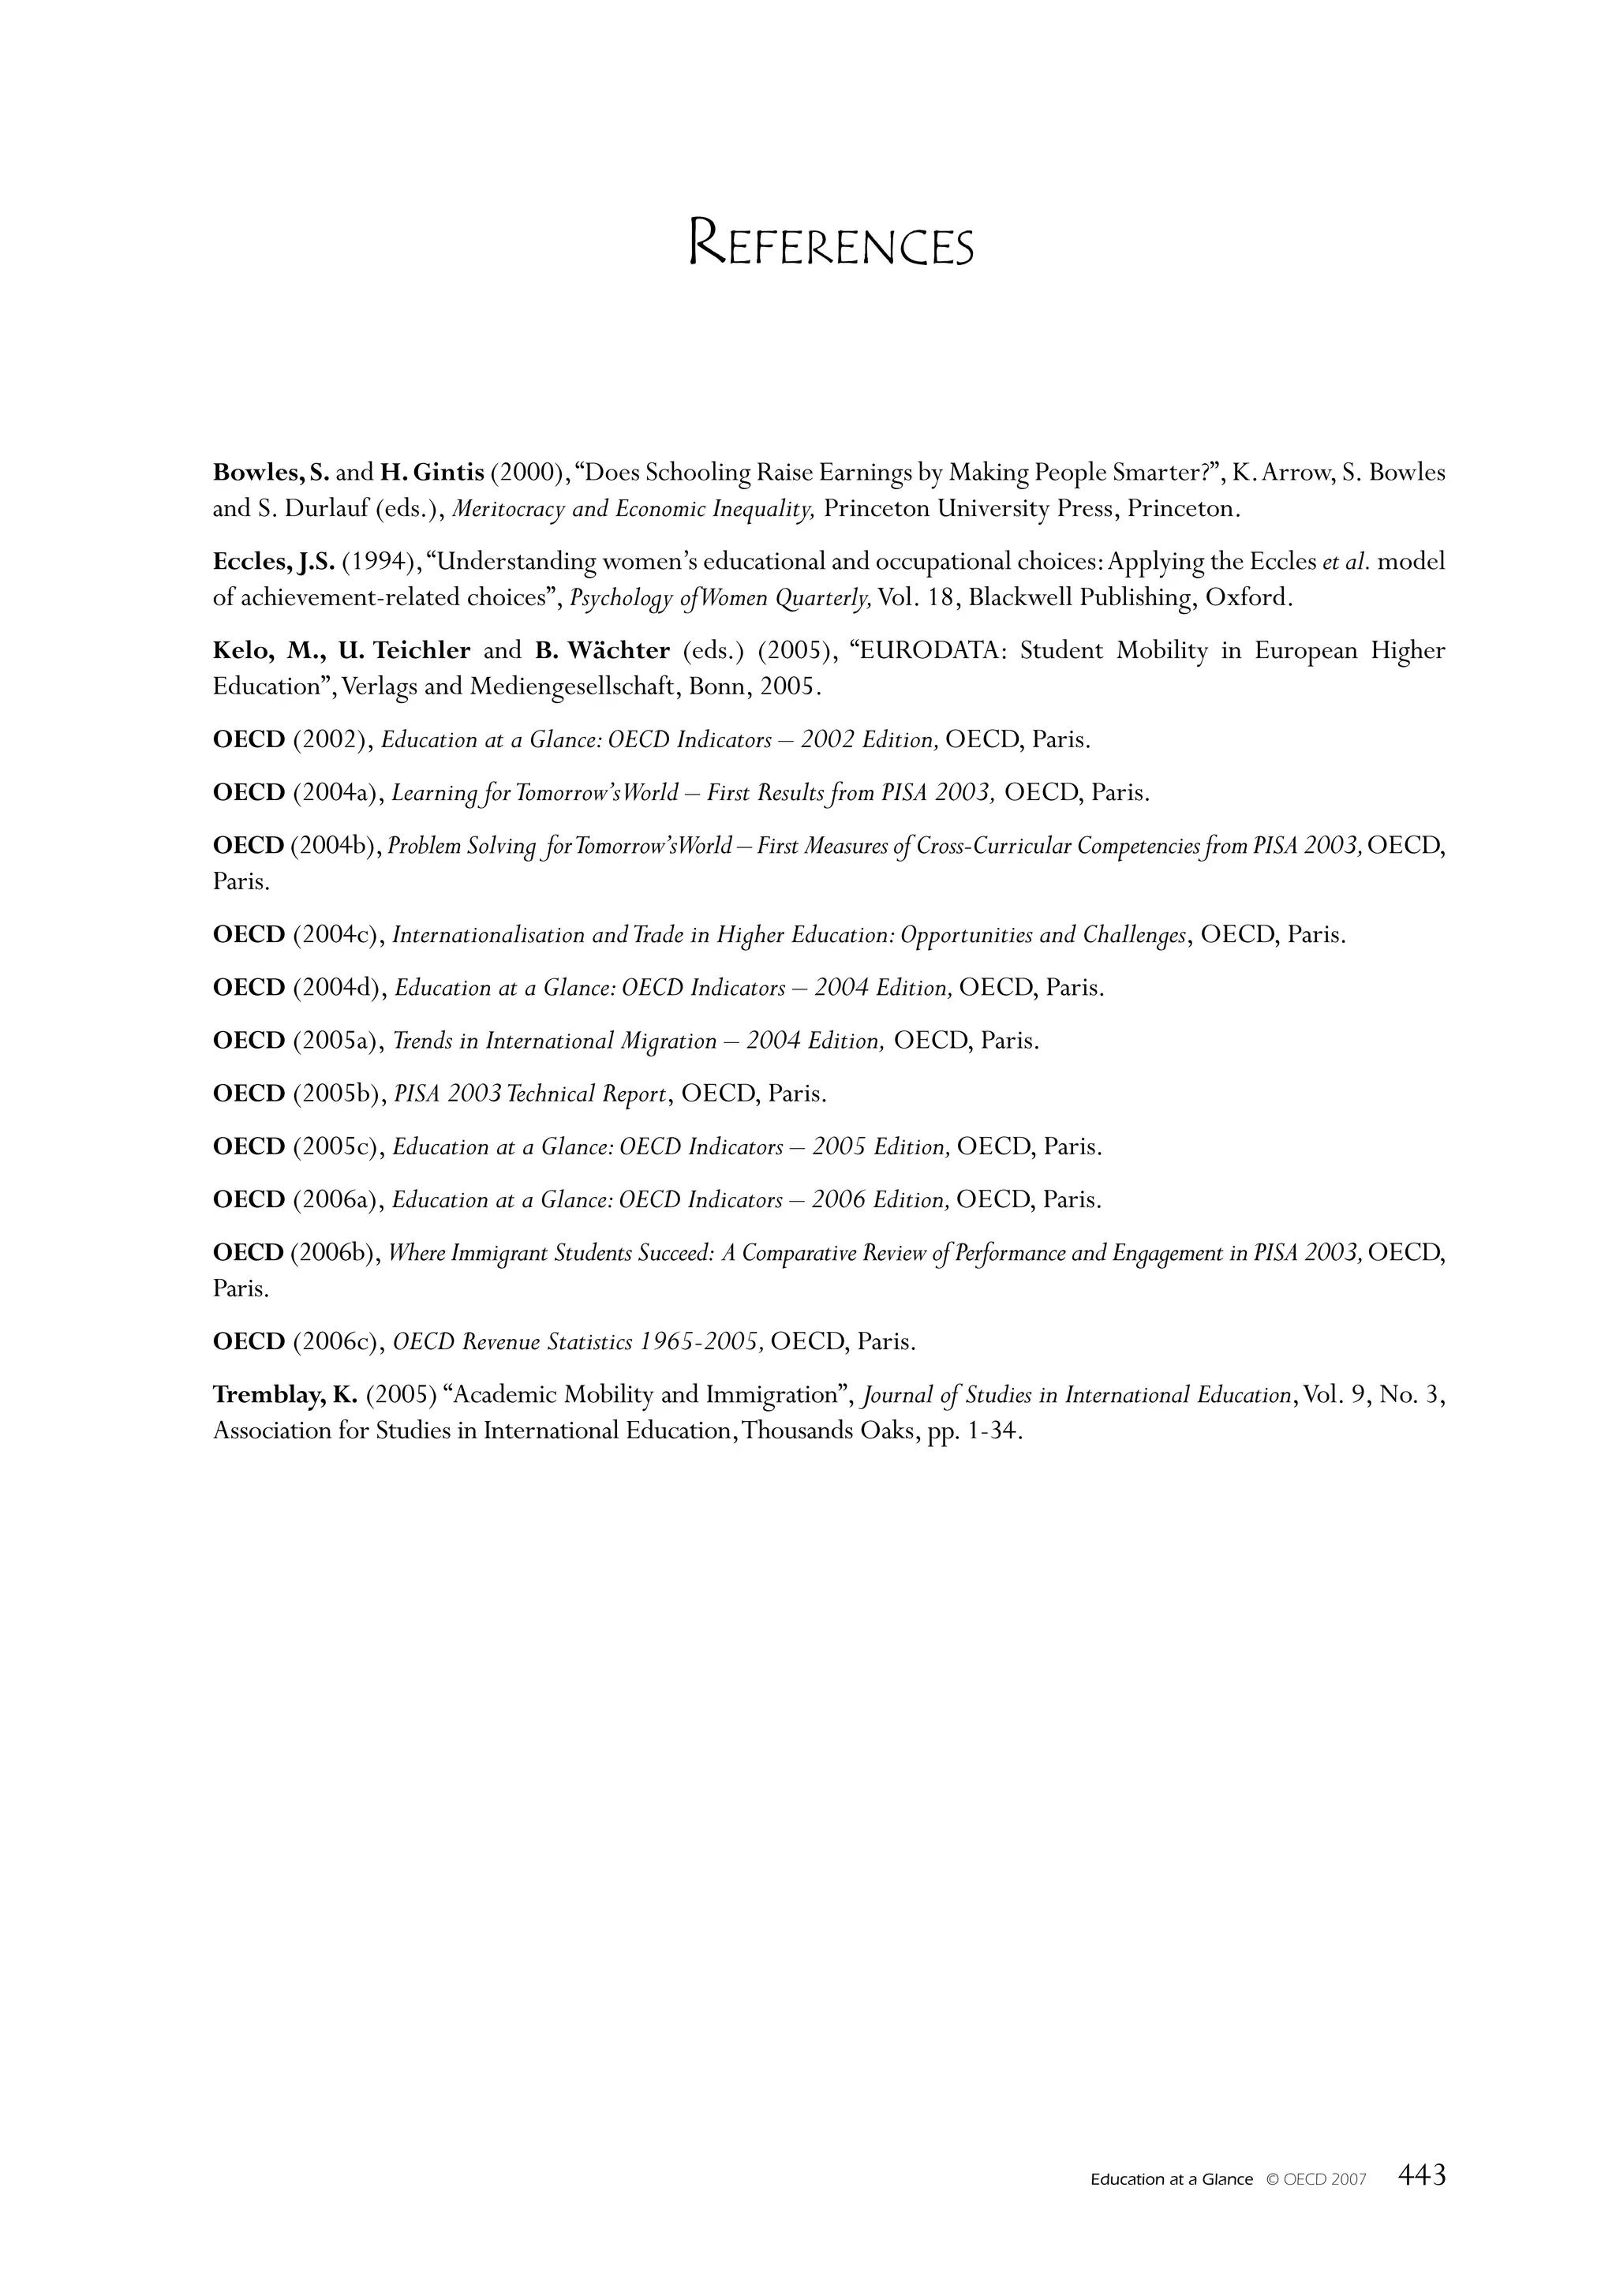
Chart C3.3. Trends in international education market shares (2000, 2005)
Percentage of all foreign tertiary students enrolled, by destination
OECD countries 2005 Partner economies 2005
2000 2000
United States
United Kingdom
Germany
France
Australia
Japan
Russian Federation
Canada
New Zealand
South Africa
Spain
Belgium
Italy
Sweden
Greece
Switzerland
Austria
Netherlands
Czech Republic
Turkey
Denmark
Portugal
Korea
Hungary
Norway
Ireland
Poland
Finland
Chile
Mexico
Slovak Repulic
Brazil
Slovenia
Estonia
Luxembourg
Iceland
Other partner economies
0 5 10 15 20 25 30 Market share (%)
Countries are ranked in descending order of 2005 market shares.
Source: OECD and UNESCO Institute for Statistics for most data on partner economies. Table C3.8 (available
on line at the link below). See Annex 3 for notes (www.oecd.org/edu/eag2007).
1 2 http://dx.doi.org/10.1787/068417017111
Education at a Glance © OECD 2007 305](https://image.slidesharecdn.com/educacionsegunocde2007-100705022559-phpapp01/75/Educacion-OCDE-2007-305-2048.jpg)


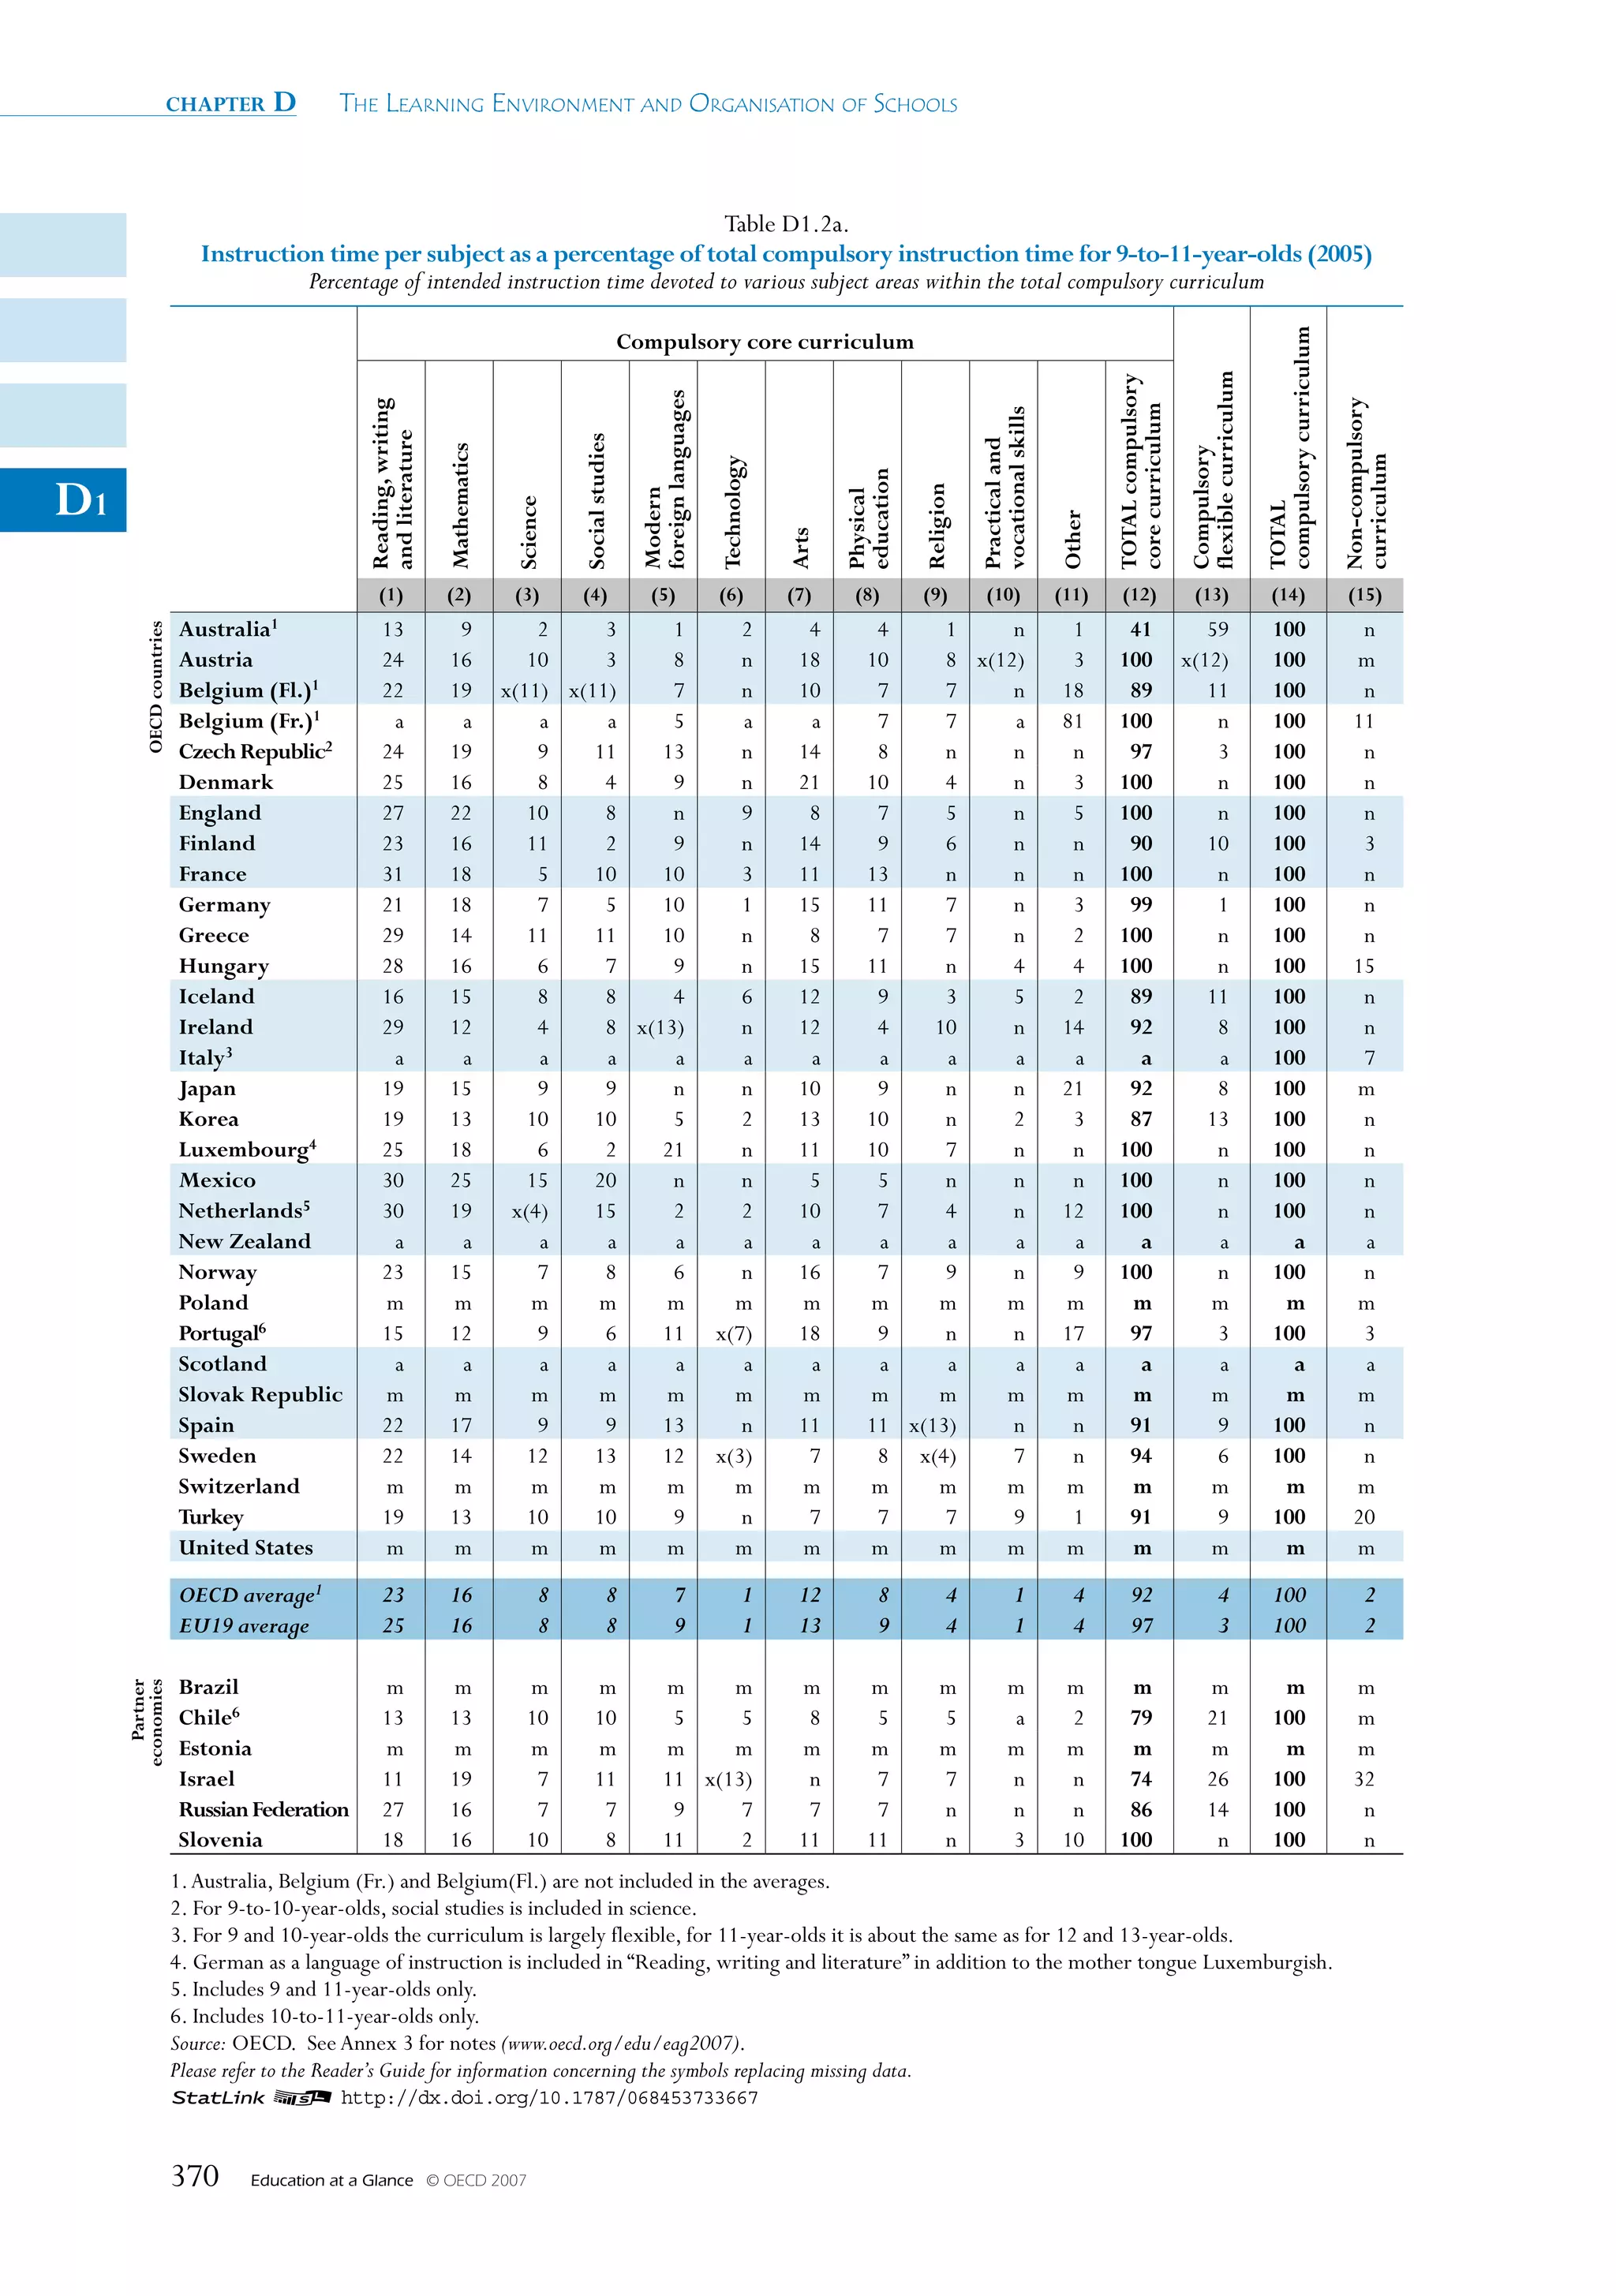
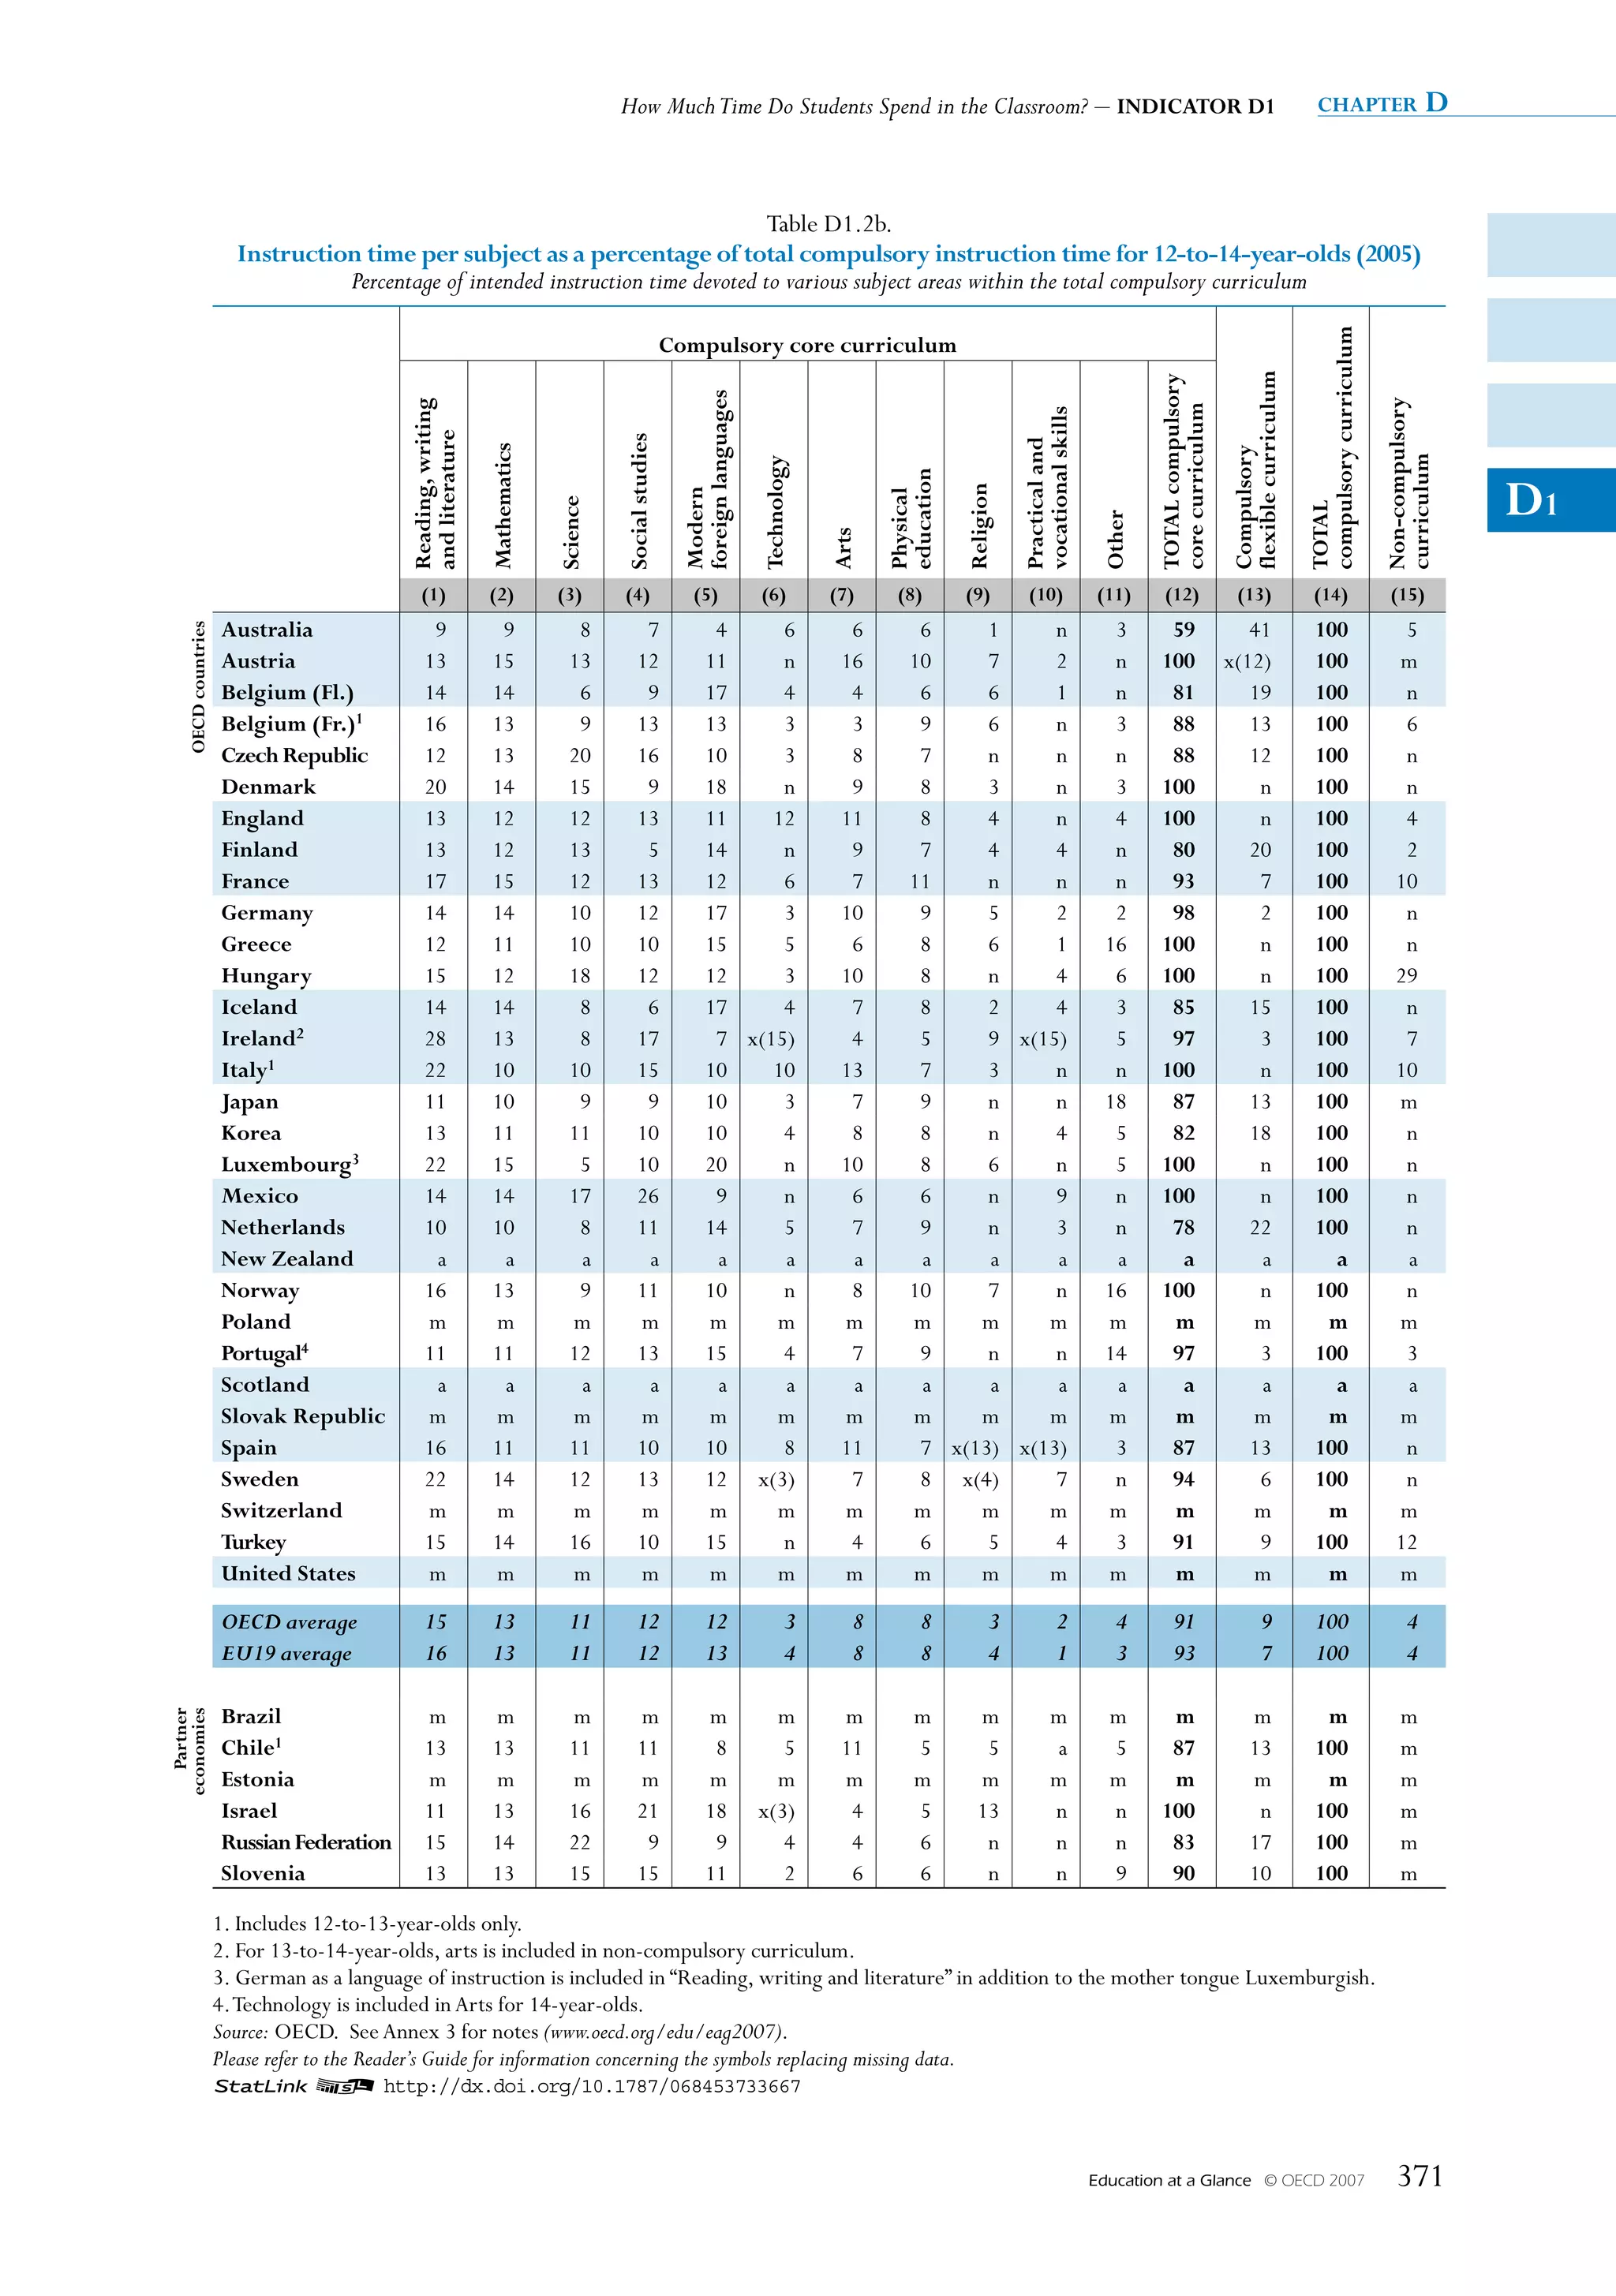


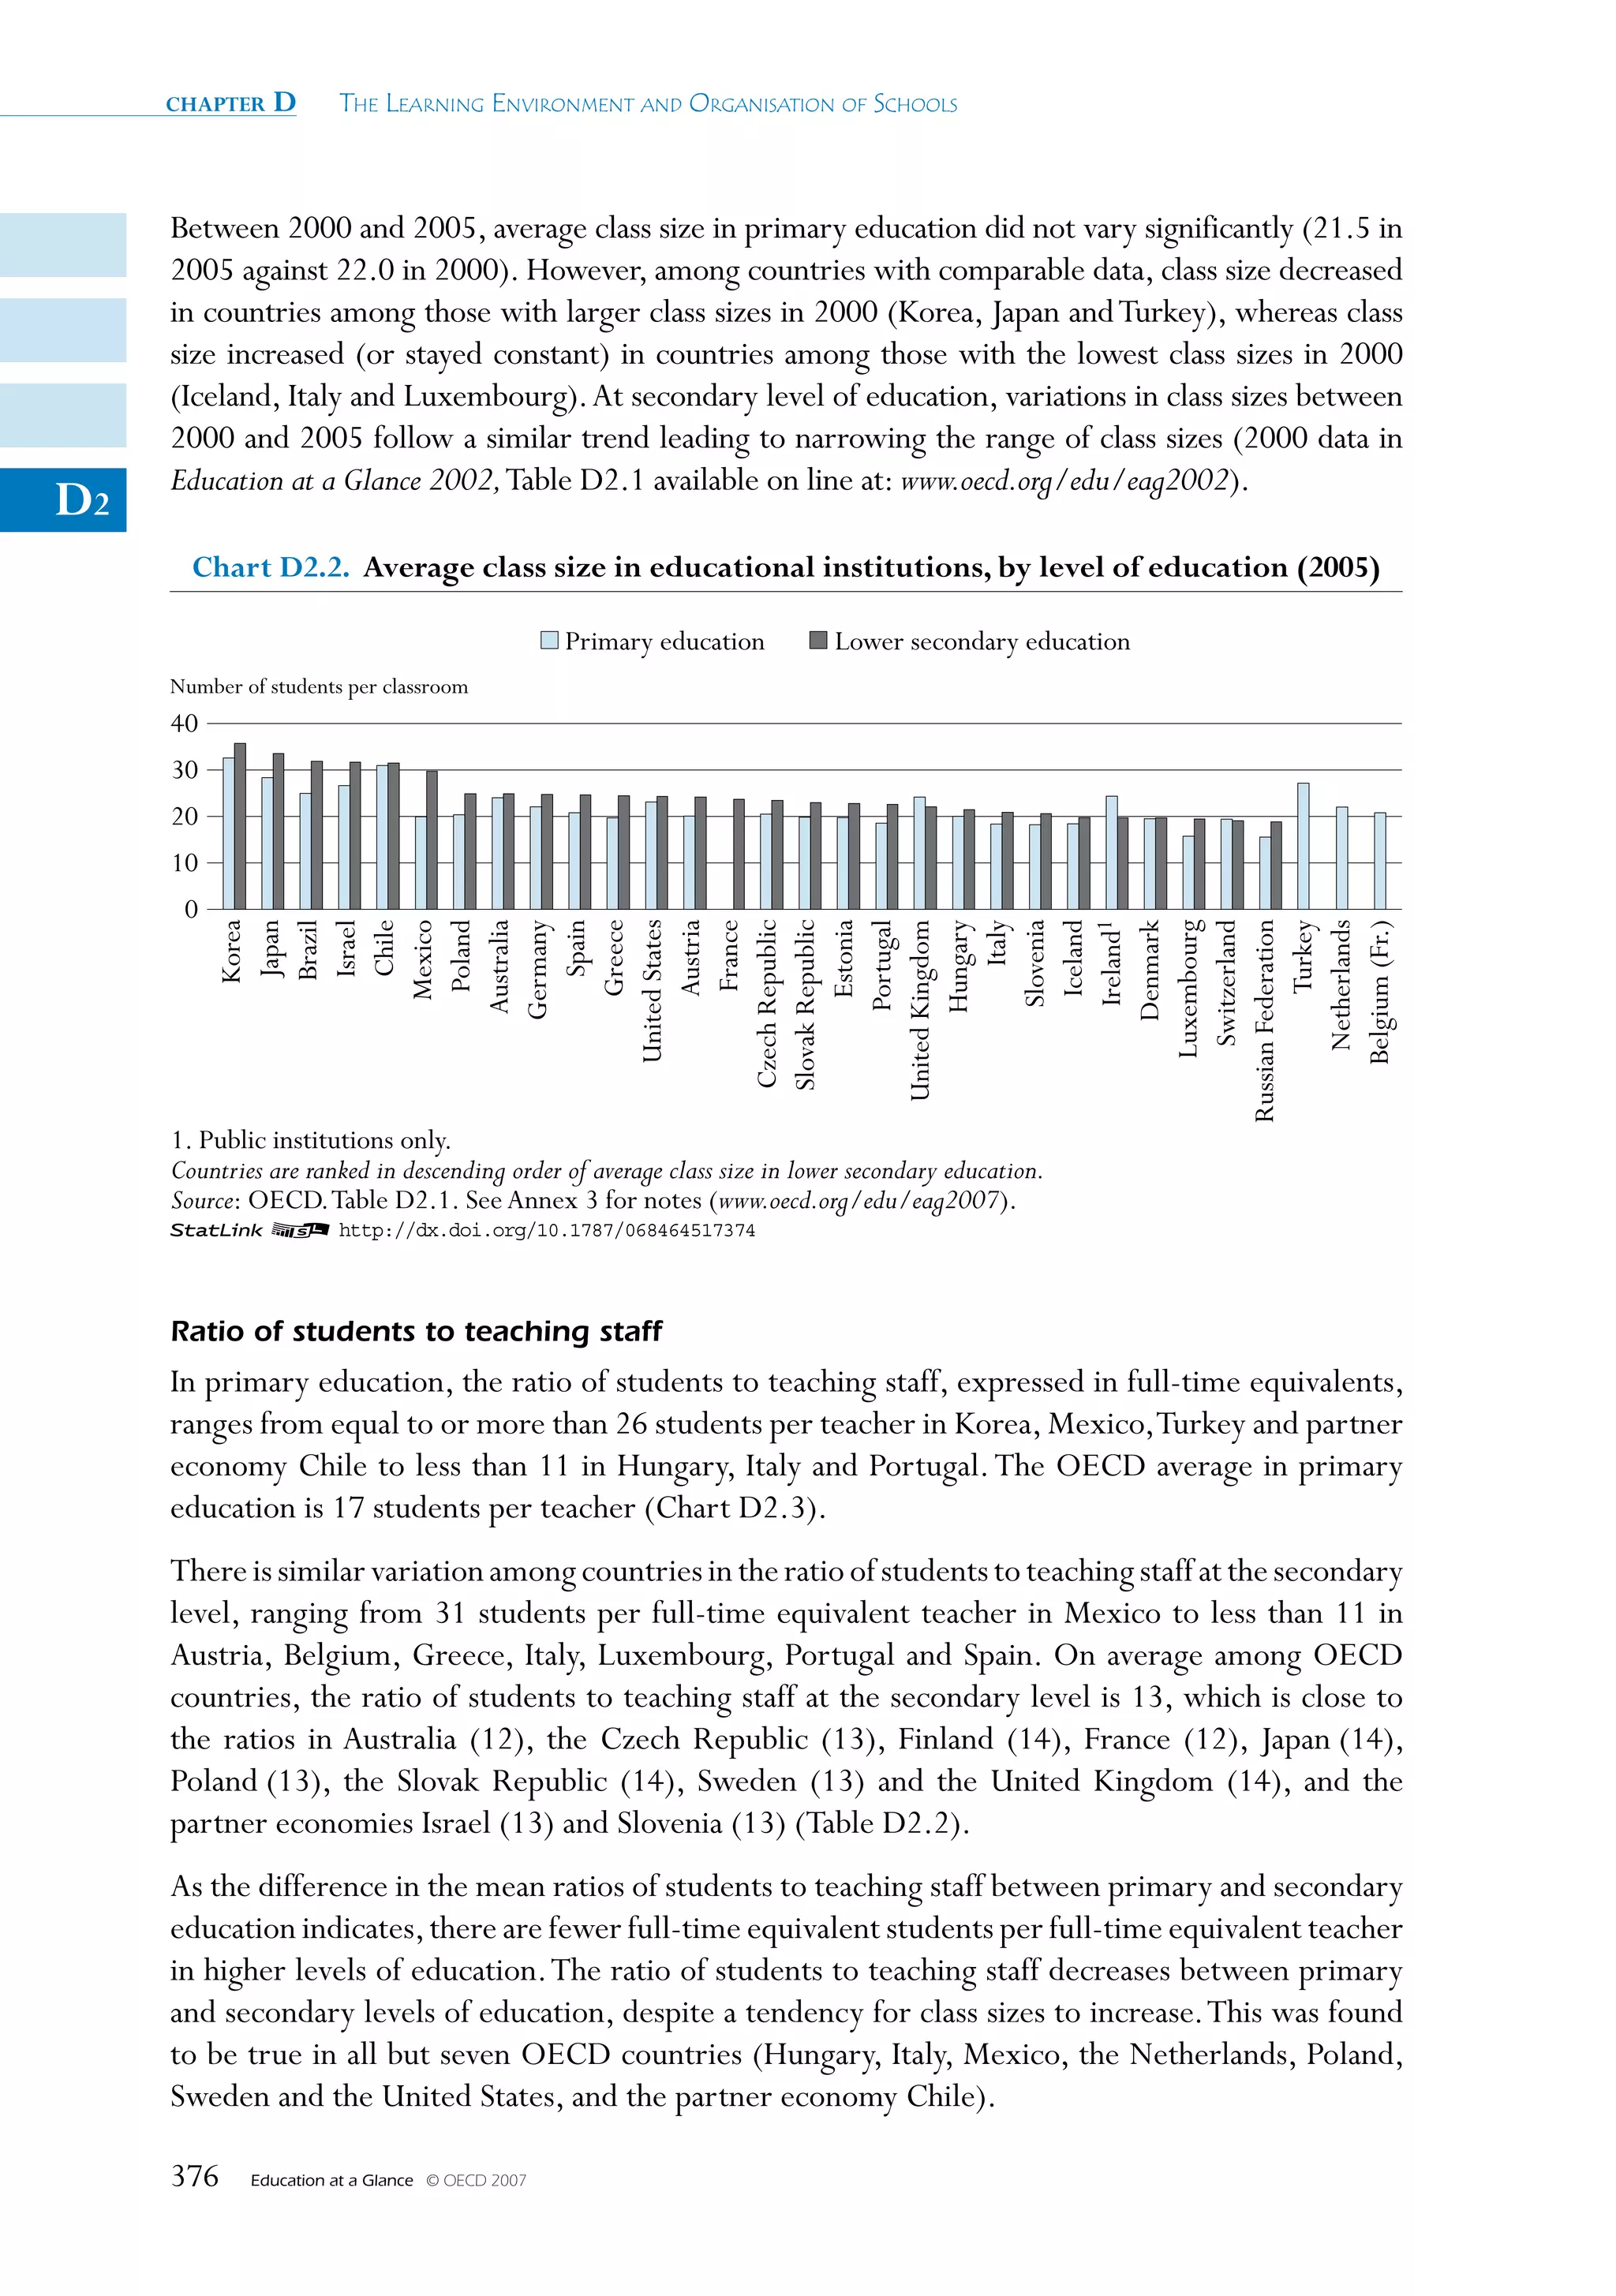


![chapter D The Learning environmenT and organisaTion of schooLs
importance of class size in discussions of schooling in many countries, differences in class size
between public and private schools and institutions may be a driver of differences in enrolment
between these sectors. It is interesting to note that in the OECD countries and partner
economies with a substantial private sector in primary and lower secondary education (Australia,
Belgium [Fr.], Denmark, Korea, and Luxembourg and the partner economy Chile; see Table
C2.9), there are, on average, only marginal differences in class size between public and private
institutions. Where large differences do exist, they tend to show private institutions having more
D2 students per class than public institutions. This indicates that in countries where a substantial
proportion of students and families have decided to choose private education institutions, class
size would not be a major determinant of those decisions.
Definitions and methodologies
Data refer to the school year 2004-2005, and are based on the UOE data collection on education
statistics that is administered annually by the OECD.
Class sizes have been calculated by dividing the number of students enrolled by the number
of classes. In order to ensure comparability among countries, special needs programmes have
been excluded. Data include only regular programmes at primary and lower secondary levels of
education and exclude teaching in sub-groups outside the regular classroom setting.
The ratio of students to teaching staff has been calculated by dividing the number of full-time
equivalent students at a given level of education by the number of full-time equivalent teachers
at that level and in the specified type of institution.
The breakdown of the ratio of students to teaching staff by type of institution distinguishes
between students and teachers in public institutions and in private institutions (government-
dependent private institutions and independent private institutions). In some countries the
proportion of students in private institutions is small (see Table C2.9).
Instructional personnel:
• Teaching staff refers to professional personnel directly involved in teaching students. The
classification includes classroom teachers; special education teachers; and other teachers who
work with a whole class of students in a class, in small groups in a resource room, or in one-to-
one teaching situations inside or outside a regular class.Teaching staff also includes department
chairpersons whose duties include some teaching, but excludes non-professional personnel
who support teachers in providing instruction to students, such as teachers’ aides and other
paraprofessional personnel.
• Teachers’ aides and teaching/research assistants include non-professional personnel or students
who support teachers in providing instruction to students.
380 Education at a Glance © OECD 2007](https://image.slidesharecdn.com/educacionsegunocde2007-100705022559-phpapp01/75/Educacion-OCDE-2007-380-2048.jpg)


![chapter D The Learning environmenT and organisaTion of schooLs
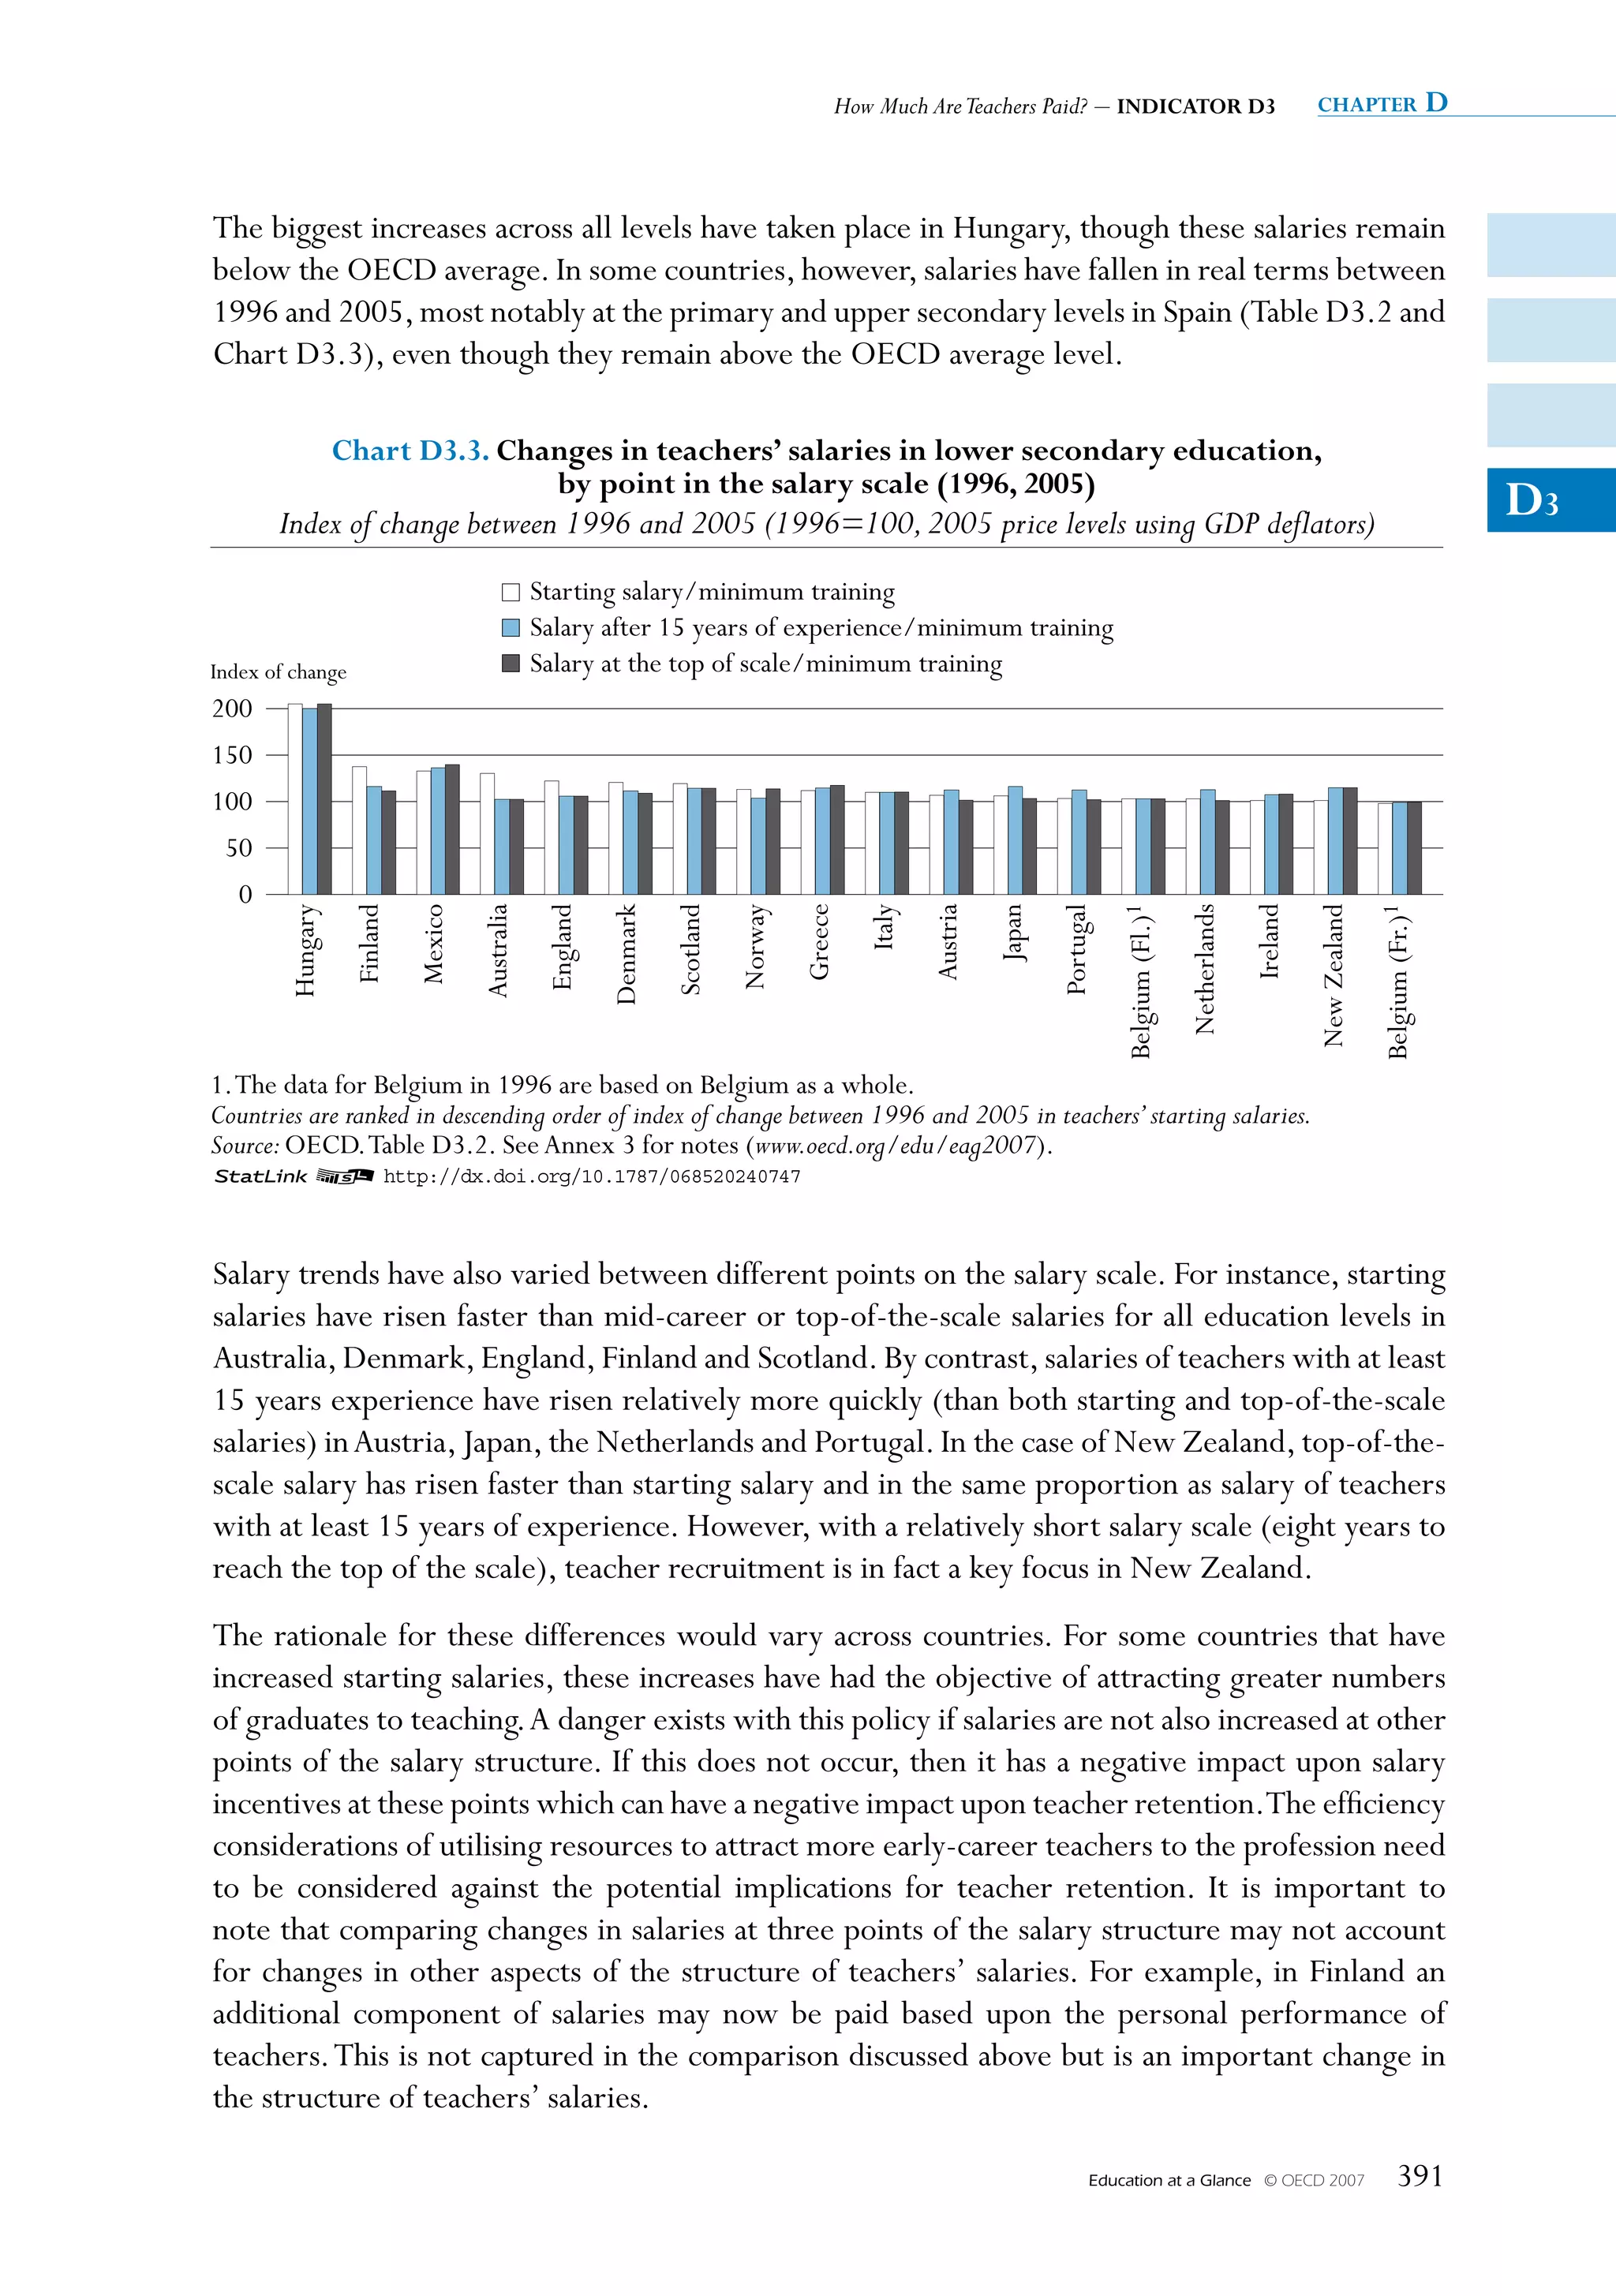
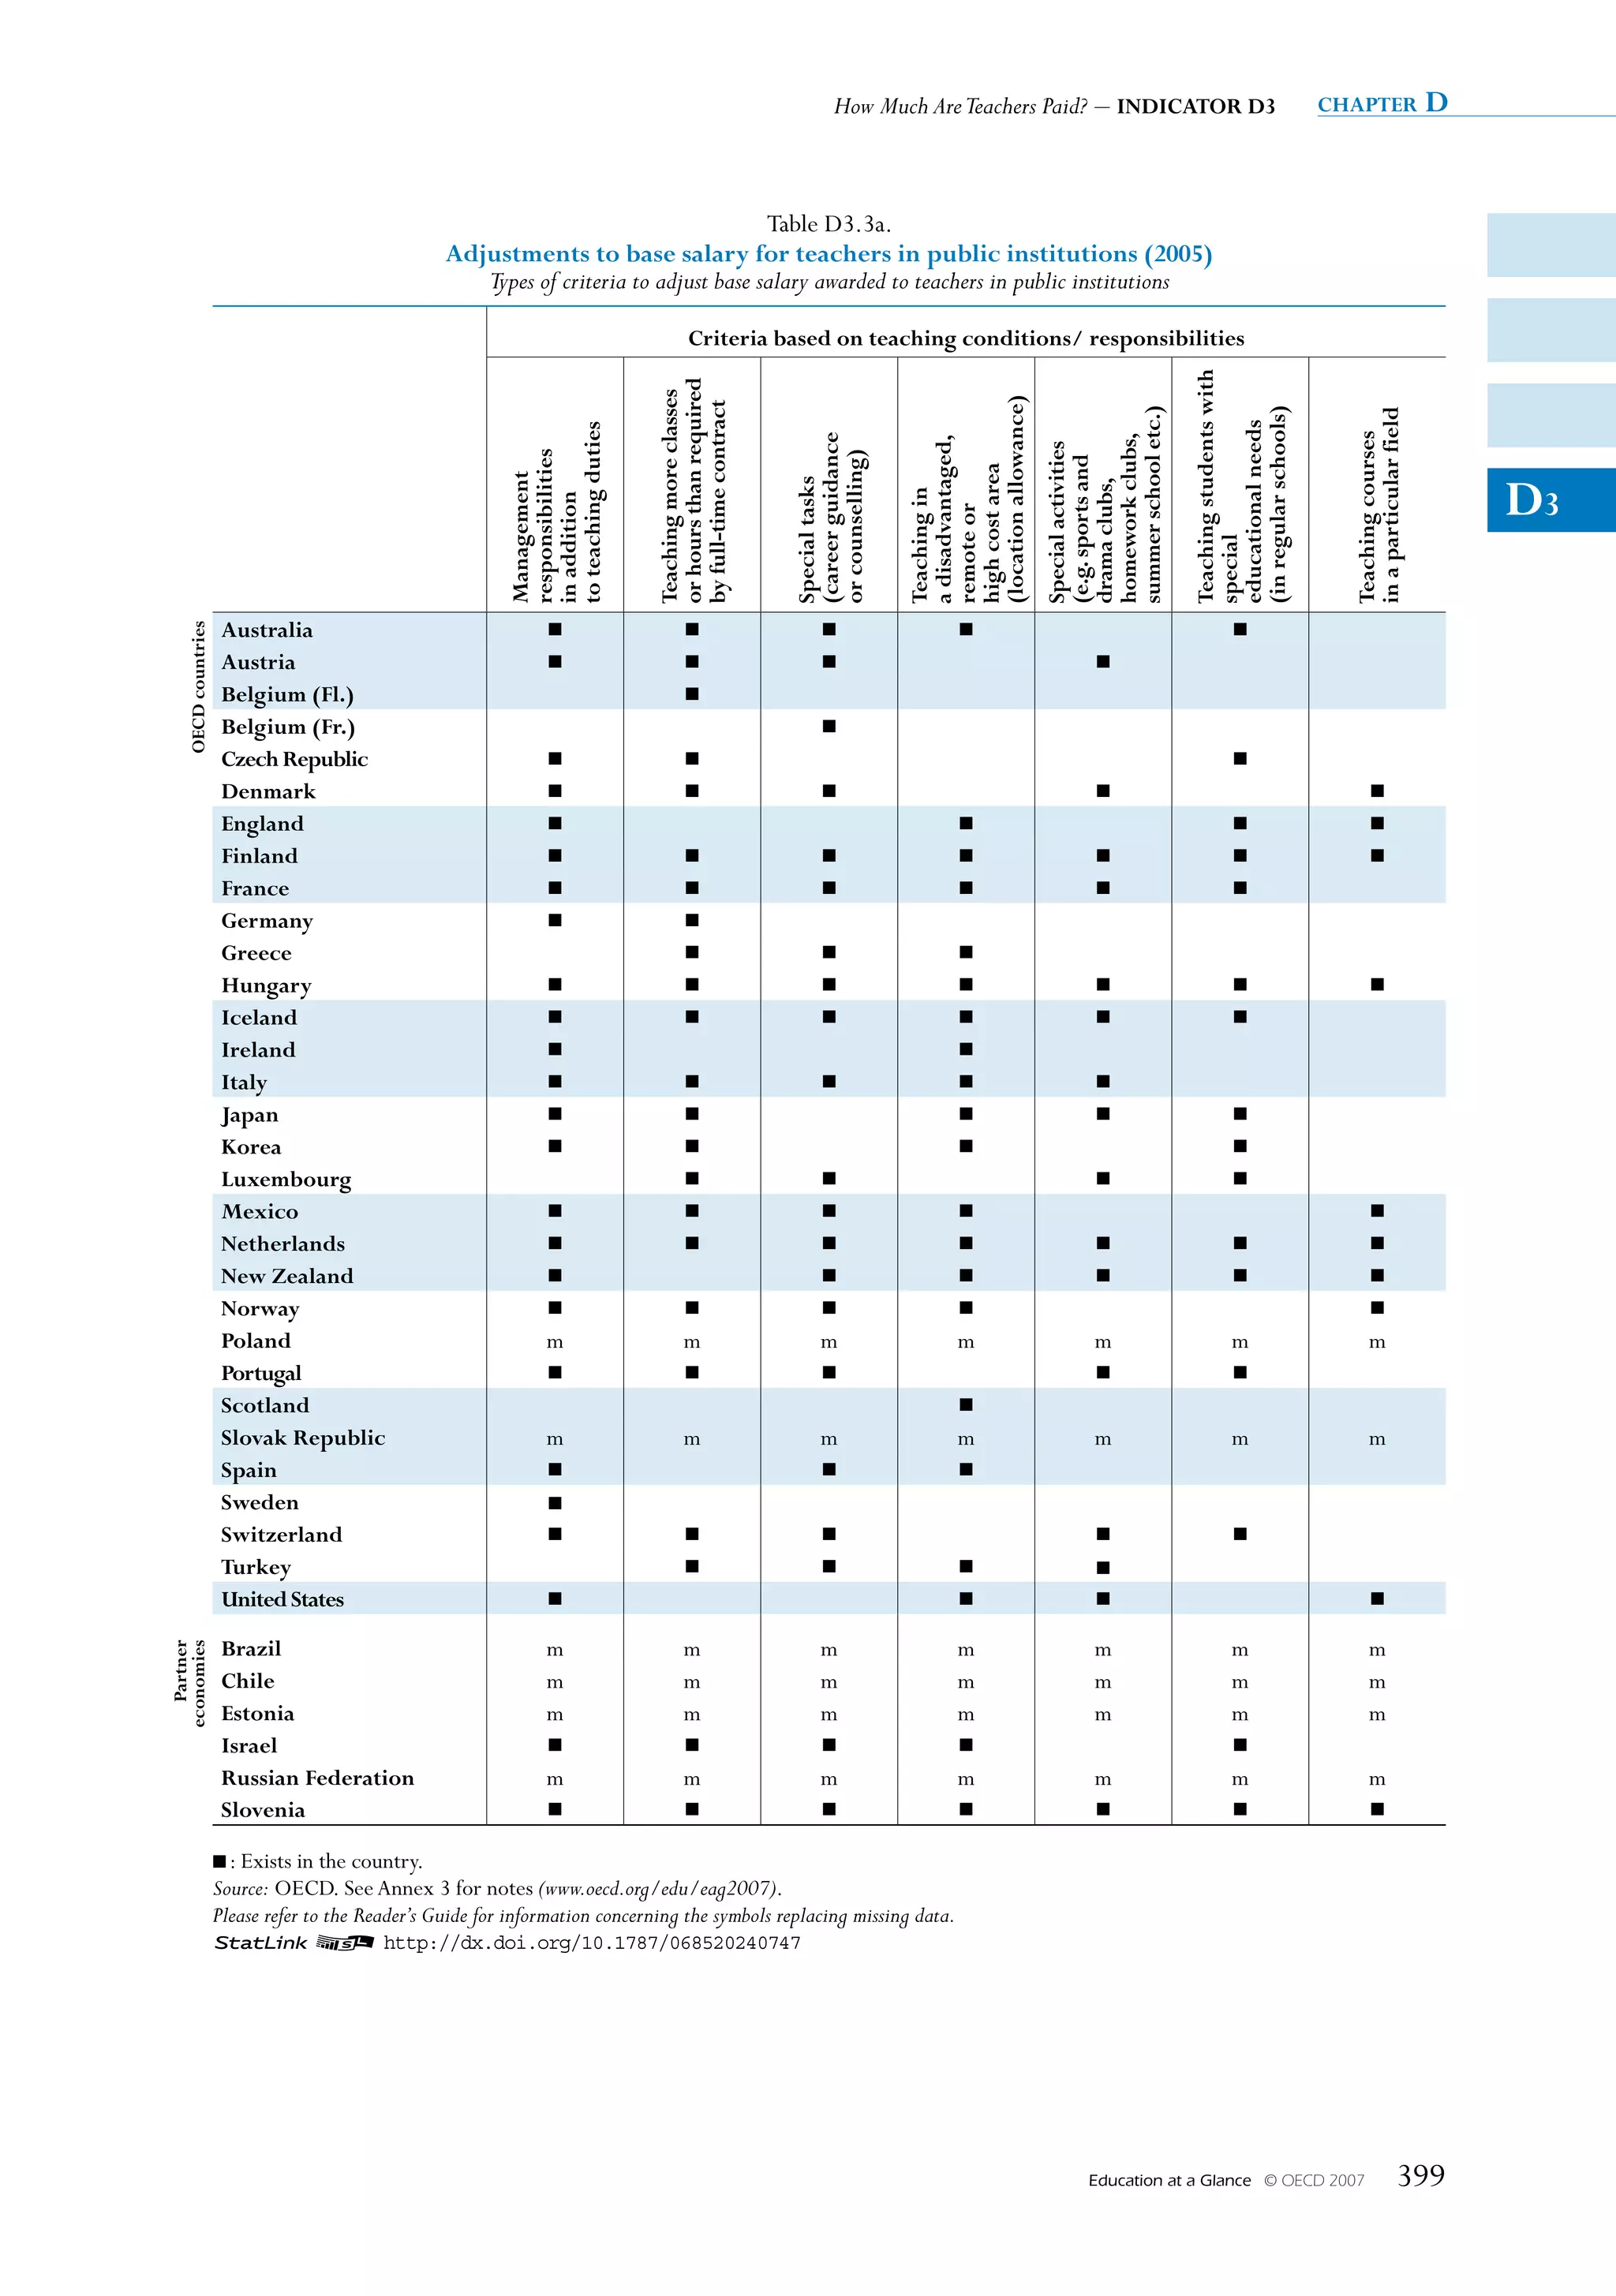
Additional payments: Incentives and allowances
In addition to basic pay scales, many school systems have developed schemes that offer additional
payments for teachers, which may take the form of financial remuneration and/or a reduction
in the number of teaching hours. Together with the starting salary, such additional payments may
affect a person’s decision to enter into or stay in the teaching profession. Early career additional
payments for graduate teachers may include family allowances and bonuses for working in
certain locations, and higher initial salaries for higher-than-minimum teaching certification or
D3 qualifications such as holding educational qualifications in multiple subjects or with certification
to teach students with special educational needs.
In some countries, the reduction of required teaching hours is used to reward experience or
long service (e.g. in Greece and Iceland). In other countries such as Portugal, teachers can be
compensated by a reduction of teaching hours for carrying out special tasks or activities (leading a
drama club, or acting as teacher supervisor of student teachers, etc.). Adjustments to base salary
may be awarded to teachers in public schools either by the head teacher or school principal, or
by government at the local, regional or national level.
Types of additional payments
Data on additional payments can be grouped into three broad areas:
1. Additional payments based on responsibilities assumed by teachers and particular conditions
of teaching (e.g. additional management responsibilities or teaching in high-need regions,
disadvantaged schools)
2. Additional payments based upon the demographic characteristics of teachers (e.g. age and/or
family status)
3. Additional payments based upon teachers’ qualifications, training and performance (e.g. holding
higher than the minimum qualifications and/or completing professional development activities)
Data have not been collected on payment amounts but on whether they are available to teachers
and at what level the decision to award such payments are taken (see Table D3.3a; see also
Tables D3.3b, D3.3c and D3.3d [available on line at: http://dx.doi.org/10.1787/068520240747] and
Annex 3 at www.oecd.org/edu/eag2007).
Additional payments are most often given for particular responsibilities or working conditions.
A clear example is teaching in more disadvantaged schools, particularly in schools that are
located in very poor neighbourhoods or have a large proportion of students that speak languages
other than the language of instruction, means teachers face particular demands on their job that
teachers in other schools may not encounter. It has been shown that these schools often have
trouble attracting teachers and that the least experienced teachers in an education system often
work in these schools (OECD, 2005). Additional payments for teaching in disadvantaged schools
are provided in about two-thirds of OECD and partner economies, and ten countries also offer
additional payments for teachers who teach in certain fields. These payments may be offered in
response to a shortage of teachers in these areas.
More than one-half of OECD countries offer additional payments based on demographic
characteristics of teachers. Additional payments to teachers based upon their qualifications,
training and performance are even more common across OECD countries and partner economies.
392 Education at a Glance © OECD 2007](https://image.slidesharecdn.com/educacionsegunocde2007-100705022559-phpapp01/75/Educacion-OCDE-2007-392-2048.jpg)


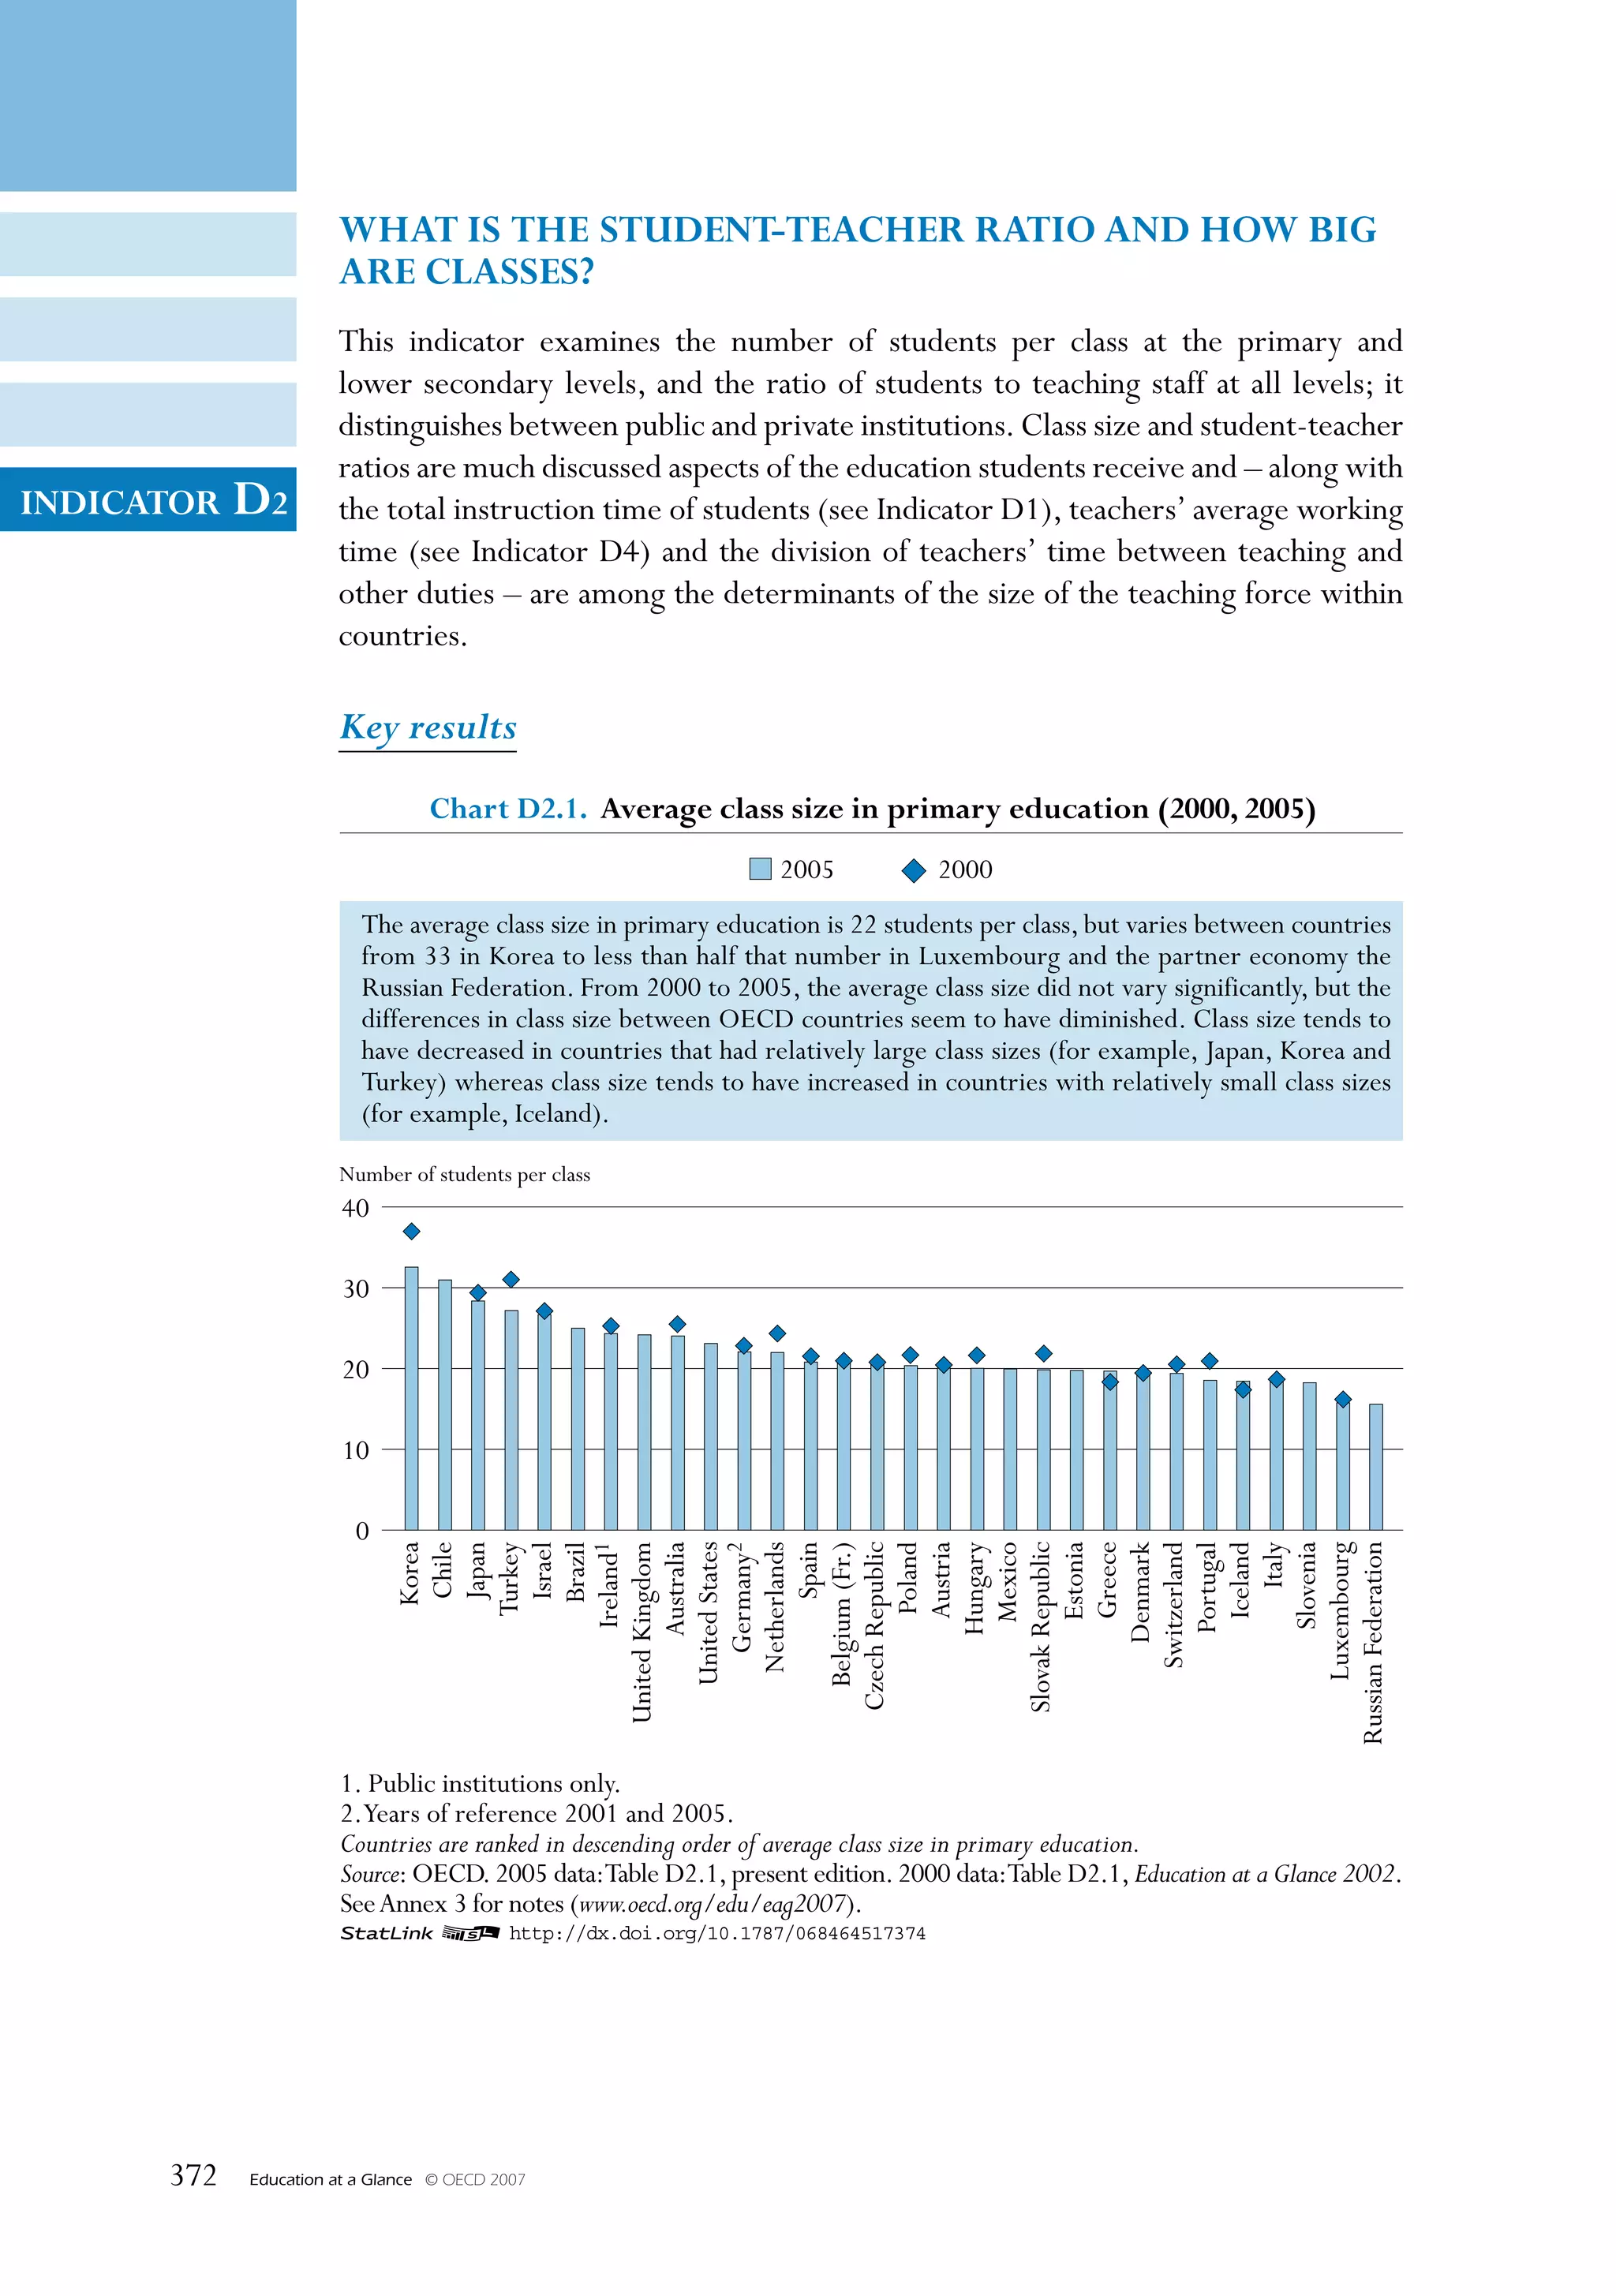
![HOW DO eDuCATION sysTems mONITOR sCHOOl
PeRFORmANCe?
This indicator focuses on the evaluation and accountability arrangements for
lower secondary public schools that exist across countries. The focus is upon the
collection, use and availability of student and school performance information. This
indicator complements the quantitative information relating to teacher salaries and
INDICATOR D5 working and teaching time (Indicators D3 and D4), instruction time of students
(Indicator D1), and the relationship between number of students and numbers of
teachers (Indicator D2) by providing qualitative information on the type and use of
particular school accountability and evaluation arrangements.
Key results
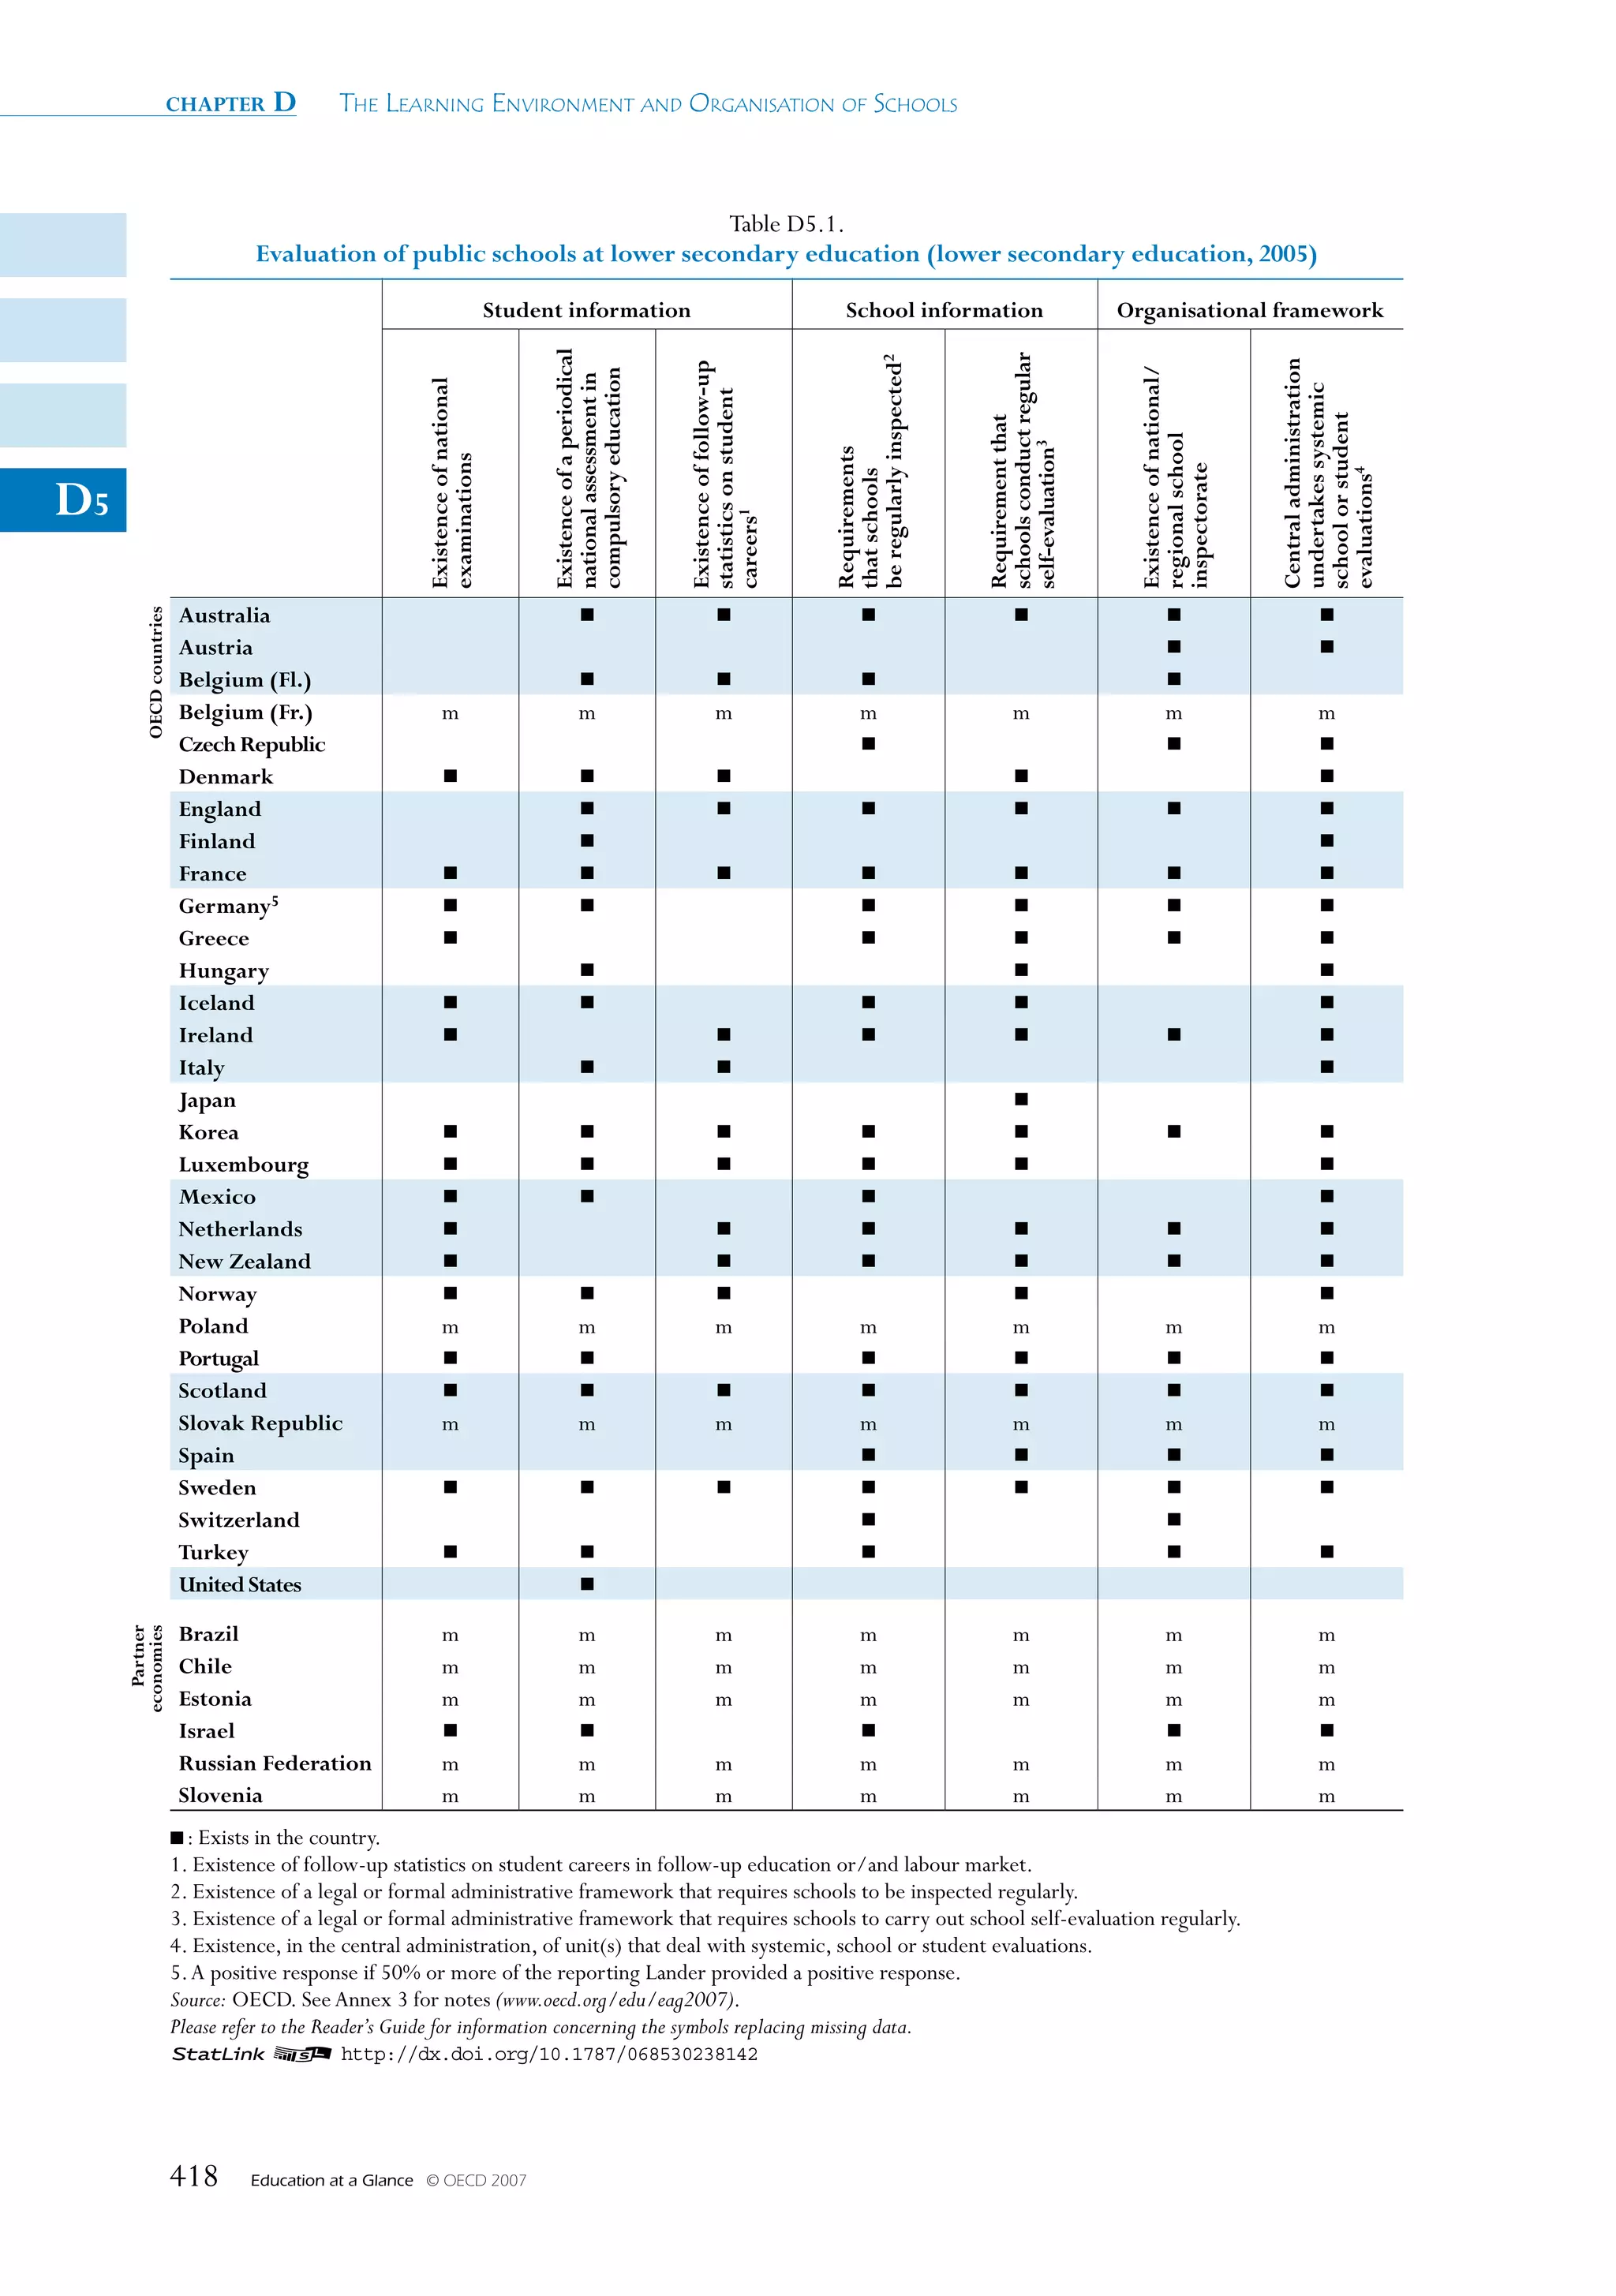
• Student assessments in school accountability and evaluation arrangements are
increasingly common across OECD countries. Just over half of OECD countries
and the partner economy Israel have national examinations that are completed by
lower-secondary school students. More common amongst OECD countries are
periodic national assessments of students in compulsory education.These occur in
two-thirds of OECD countries and the partner economy Israel. In some countries
such as Australia, schools implement standardised tests as a requirement to obtain
government funding.
• Two-thirds of OECD countries and partner economy Israel have regulations
that require lower-secondary schools to be inspected regularly. Slightly fewer
countries (19 OECD countries) have regulatory requirements for schools to
conduct periodic school self-evaluations.
• Only three OECD countries utilise school evaluation and accountability
information to provide financial rewards (Korea and the United States) and/or
sanctions to schools (Belgium [Fl.], Korea and the United States).
412 Education at a Glance © OECD 2007](https://image.slidesharecdn.com/educacionsegunocde2007-100705022559-phpapp01/75/Educacion-OCDE-2007-412-2048.jpg)


![chapter D The Learning environmenT and organisaTion of schooLs
will be conducted. Only in the case of unsatisfactory improvement, can a financial sanction may
be imposed.
Many more OECD countries use this information to motivate decisions on school improvement.
Indeed, nineteen OECD countries and the partner economy Israel utilise information on student
assessment and school evaluation for school improvement. The use of this information in this
manner is important, considering that the focus of discussion of school evaluation and national
D5 student testing is often upon school accountability. However, it should be noted that countries
that use information to provide financial rewards or sanctions to schools may also have the
ultimate objective of school improvement. A key aspect of these rewards and sanctions may be
the incentives created for school improvement. In fact, the three countries (Belgium [Fl.], Korea
and the United States) that provide financial rewards and sanctions from this information also
used the information to motivate decisions on support for school improvement. This may be an
indication of more comprehensive school improvement and accountability systems. However,
in some countries such as the United States, the focus may remain on school accountability
measures that aim to increase standards.
Definitions and methodologies
Data are from the 2006 OECD-INES Survey on Teachers and the Curriculum and refer to the
school year 2004-2005.
Public institutions
An institution is classified as public if it is:
• Controlled and managed directly by a public education authority or agency, or
• Controlled and managed either by a government agency directly or by a governing body
(a council, committee, etc.), most of whose members are either appointed by a public authority
or elected by public franchise.
National examinations, assessments and follow-up statistics
National examinations are to be seen as assessments that have a formal civil effect for students.
Countries were instructed to respond “Yes” irrespective of the scope of the examinations in
terms of subject matter areas covered; so the answer should be yes, even if the examinations
covers just one or two subject matter areas. As for examinations, national assessments are most
likely based on student achievement testing; however, where examinations have a formal civil
effect for students, this is not the case for national assessments.
Follow-up statistics may be based on census data, involving all students, or on representative
surveys.
School inspections and evaluations
Requirements for school inspection are the legal frameworks that may operate from the central
administrative level or from lower administrative levels, such as regional offices or municipalities.
A school inspection could be done by inspectors, visitation committees or review panels. School
self-evaluation is internal evaluation of schools to improve their own practice and/or to inform
parents and the local community.
416 Education at a Glance © OECD 2007](https://image.slidesharecdn.com/educacionsegunocde2007-100705022559-phpapp01/75/Educacion-OCDE-2007-416-2048.jpg)


This document provides information about the Organisation for Economic Co-operation and Development (OECD). It describes the OECD as a forum where 30 member country governments address challenges of globalization through cooperation on economic, social and environmental issues. The OECD studies policy experiences across countries to identify best practices and support policy reform efforts. Member countries contribute data to the OECD, which publishes comparative indicators and analysis on issues like education. The document also lists OECD member countries and describes how the OECD disseminates research findings.


