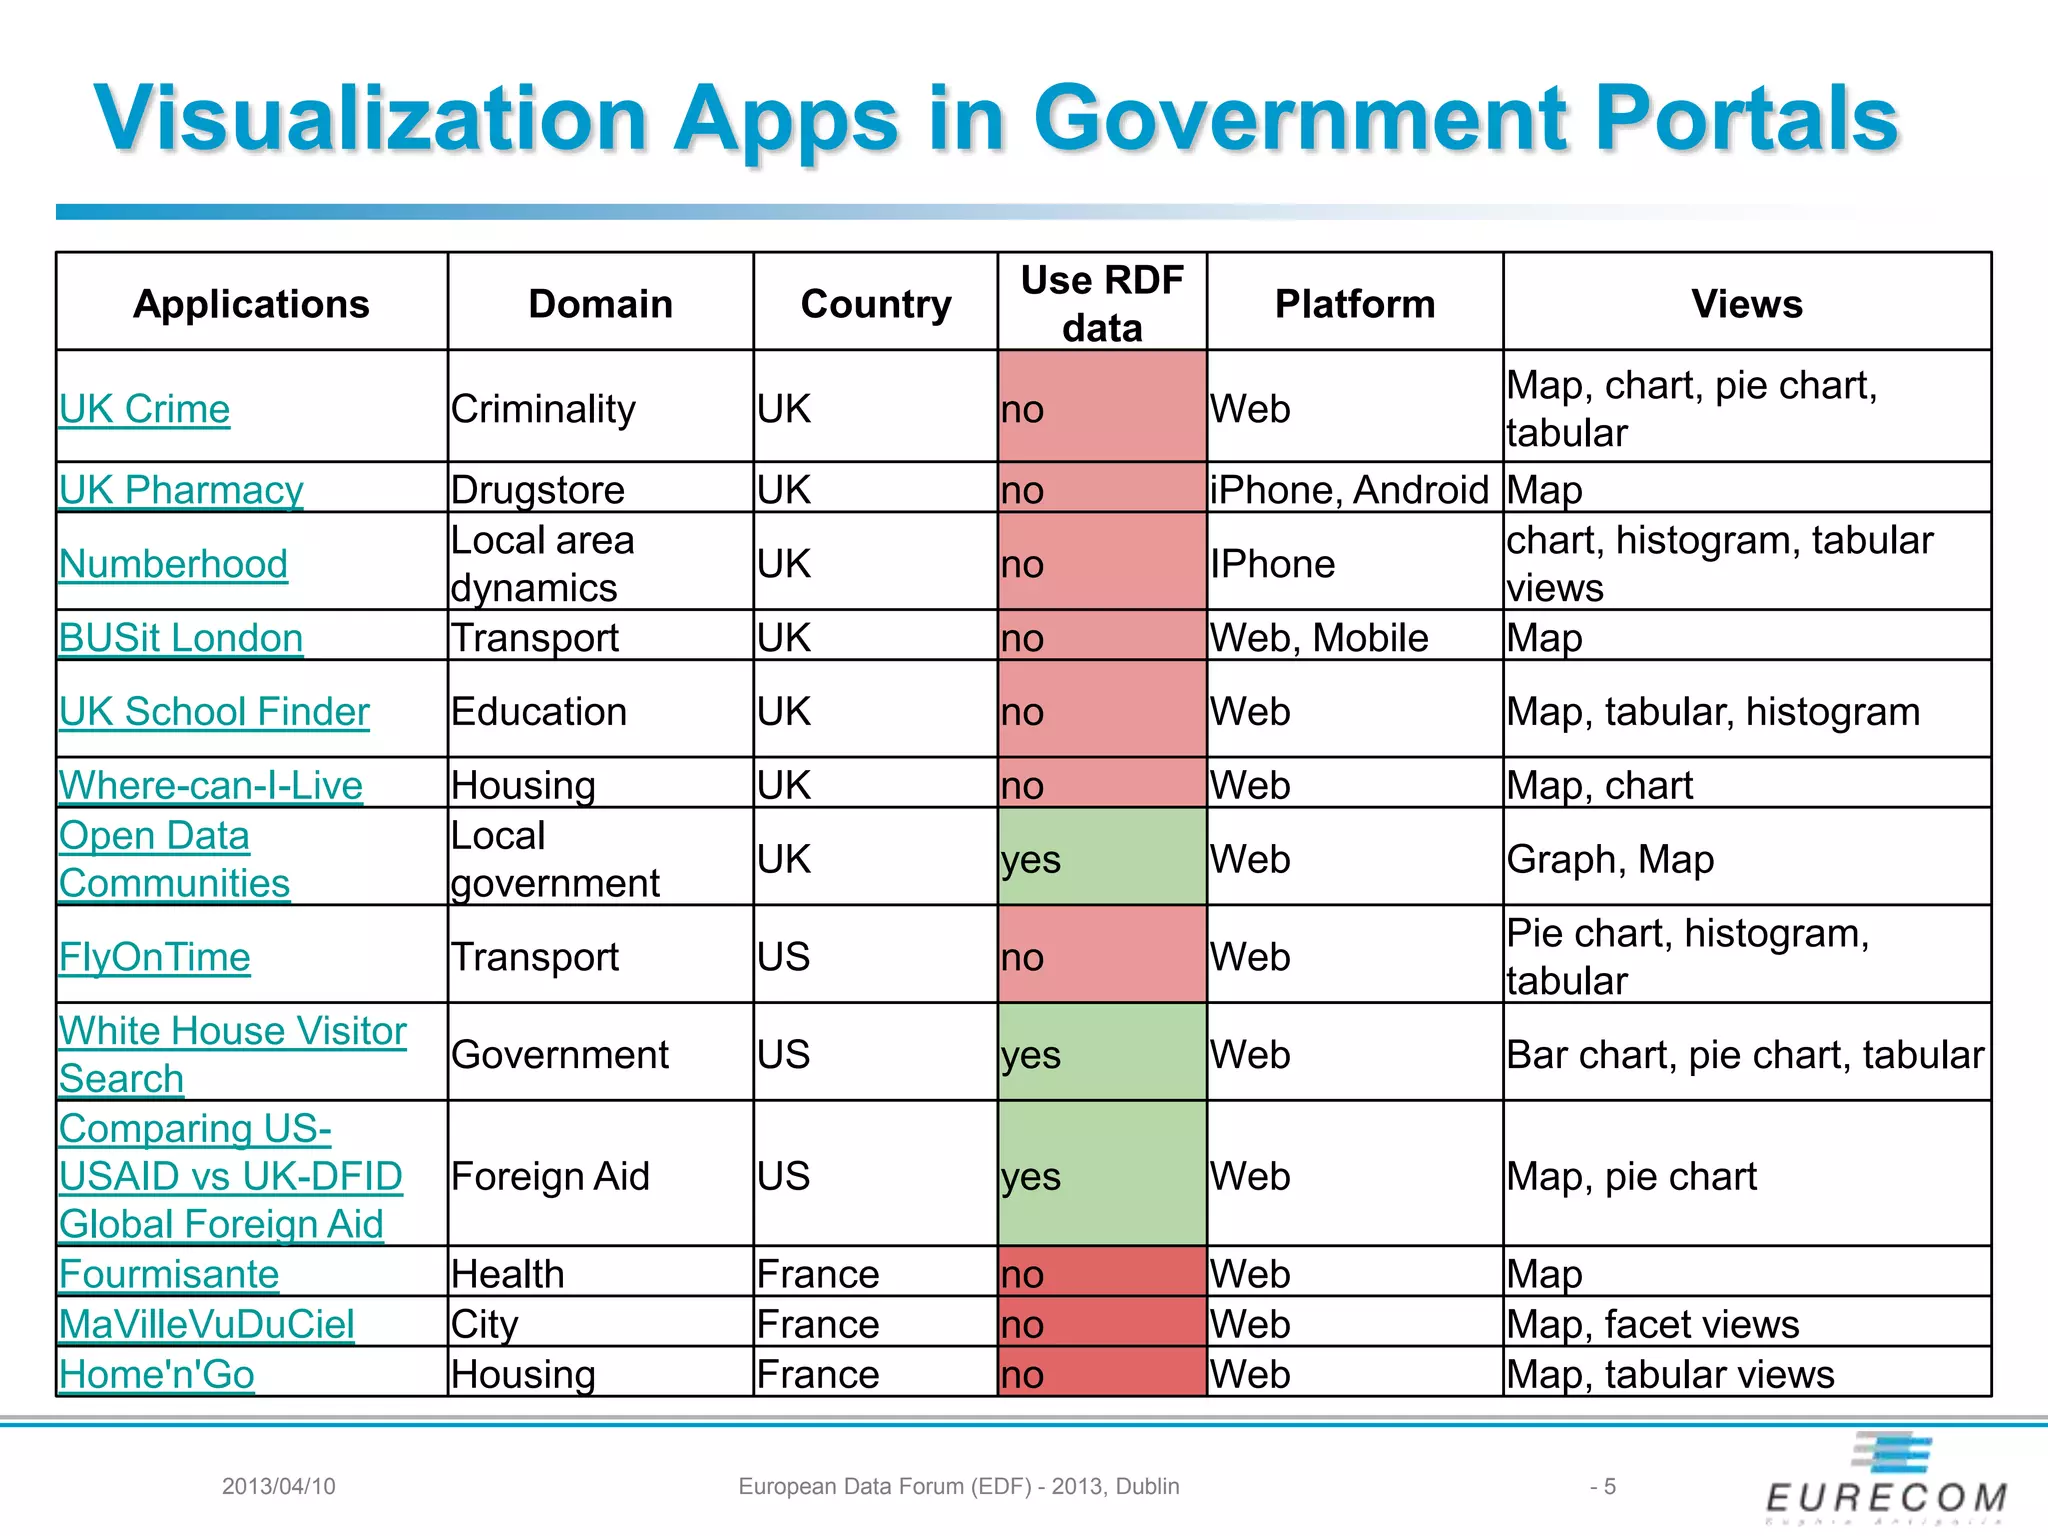
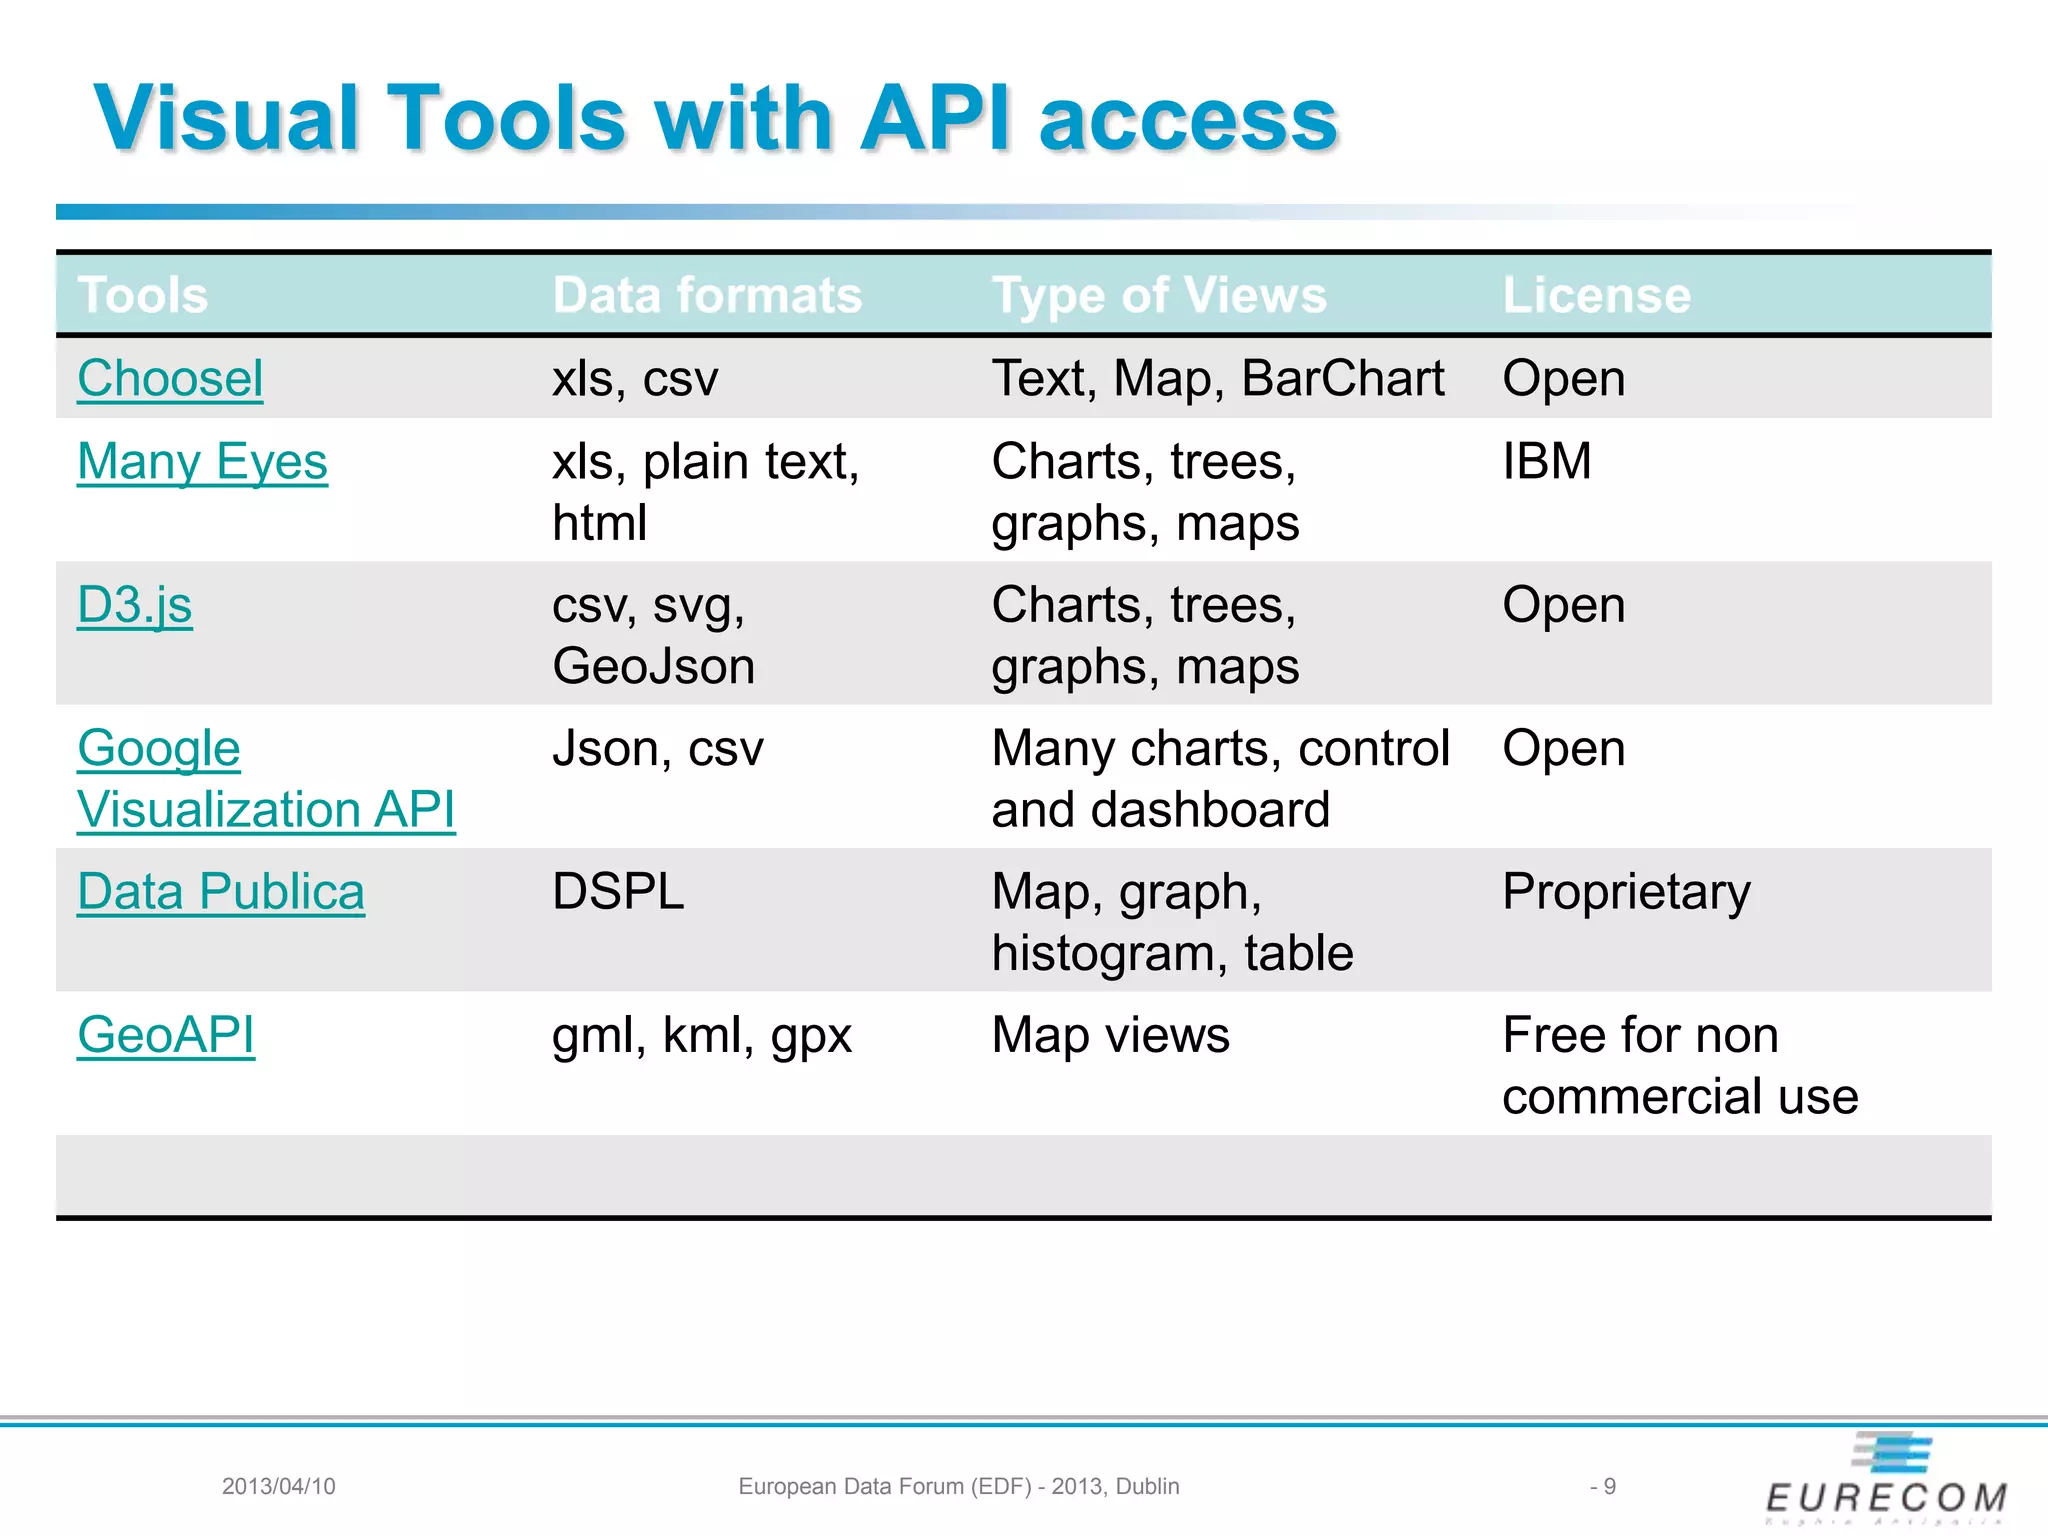
![Describing an Application: Opendatacom
2013/04/10 European Data Forum (EDF) - 2013, Dublin - 11
Scope/Domain: Department for Communities and Local
Government, datasets access
Description: visualize available datasets (finance, housing,
deprivation, geography) by authorities or postcode.
On the dashboard, it provides graphs showing the national
distribution of a district and how the values for this local
authority compare with others in England.
Supported Platform: Web
URL Policy: http://{domain}/id/{...} with redirection to the
corresponding document at: http://{domain}/doc/{...}.
Hampshire County Council is:
http://opendatacommunities.org/id/county-council/hampshire
Data Sources: 36 datasets from DCLG, Administrative
Geography and Postcodes from Ordnance Survey.
Type of View: Graph, Map views.
Visualization Tools: google visualization API, raphael.js
License: Open Government license [OGL]
Business Value: Non commercial](https://image.slidesharecdn.com/edf2013towards-interoperable-visualization-applications-over-linked-data-ghislainatemezing-130416132832-phpapp01/75/EDF2013-Selected-Talk-Ghislain-Atemezing-Towards-Interoperable-Visualization-Applications-Over-Linked-Data-11-2048.jpg)
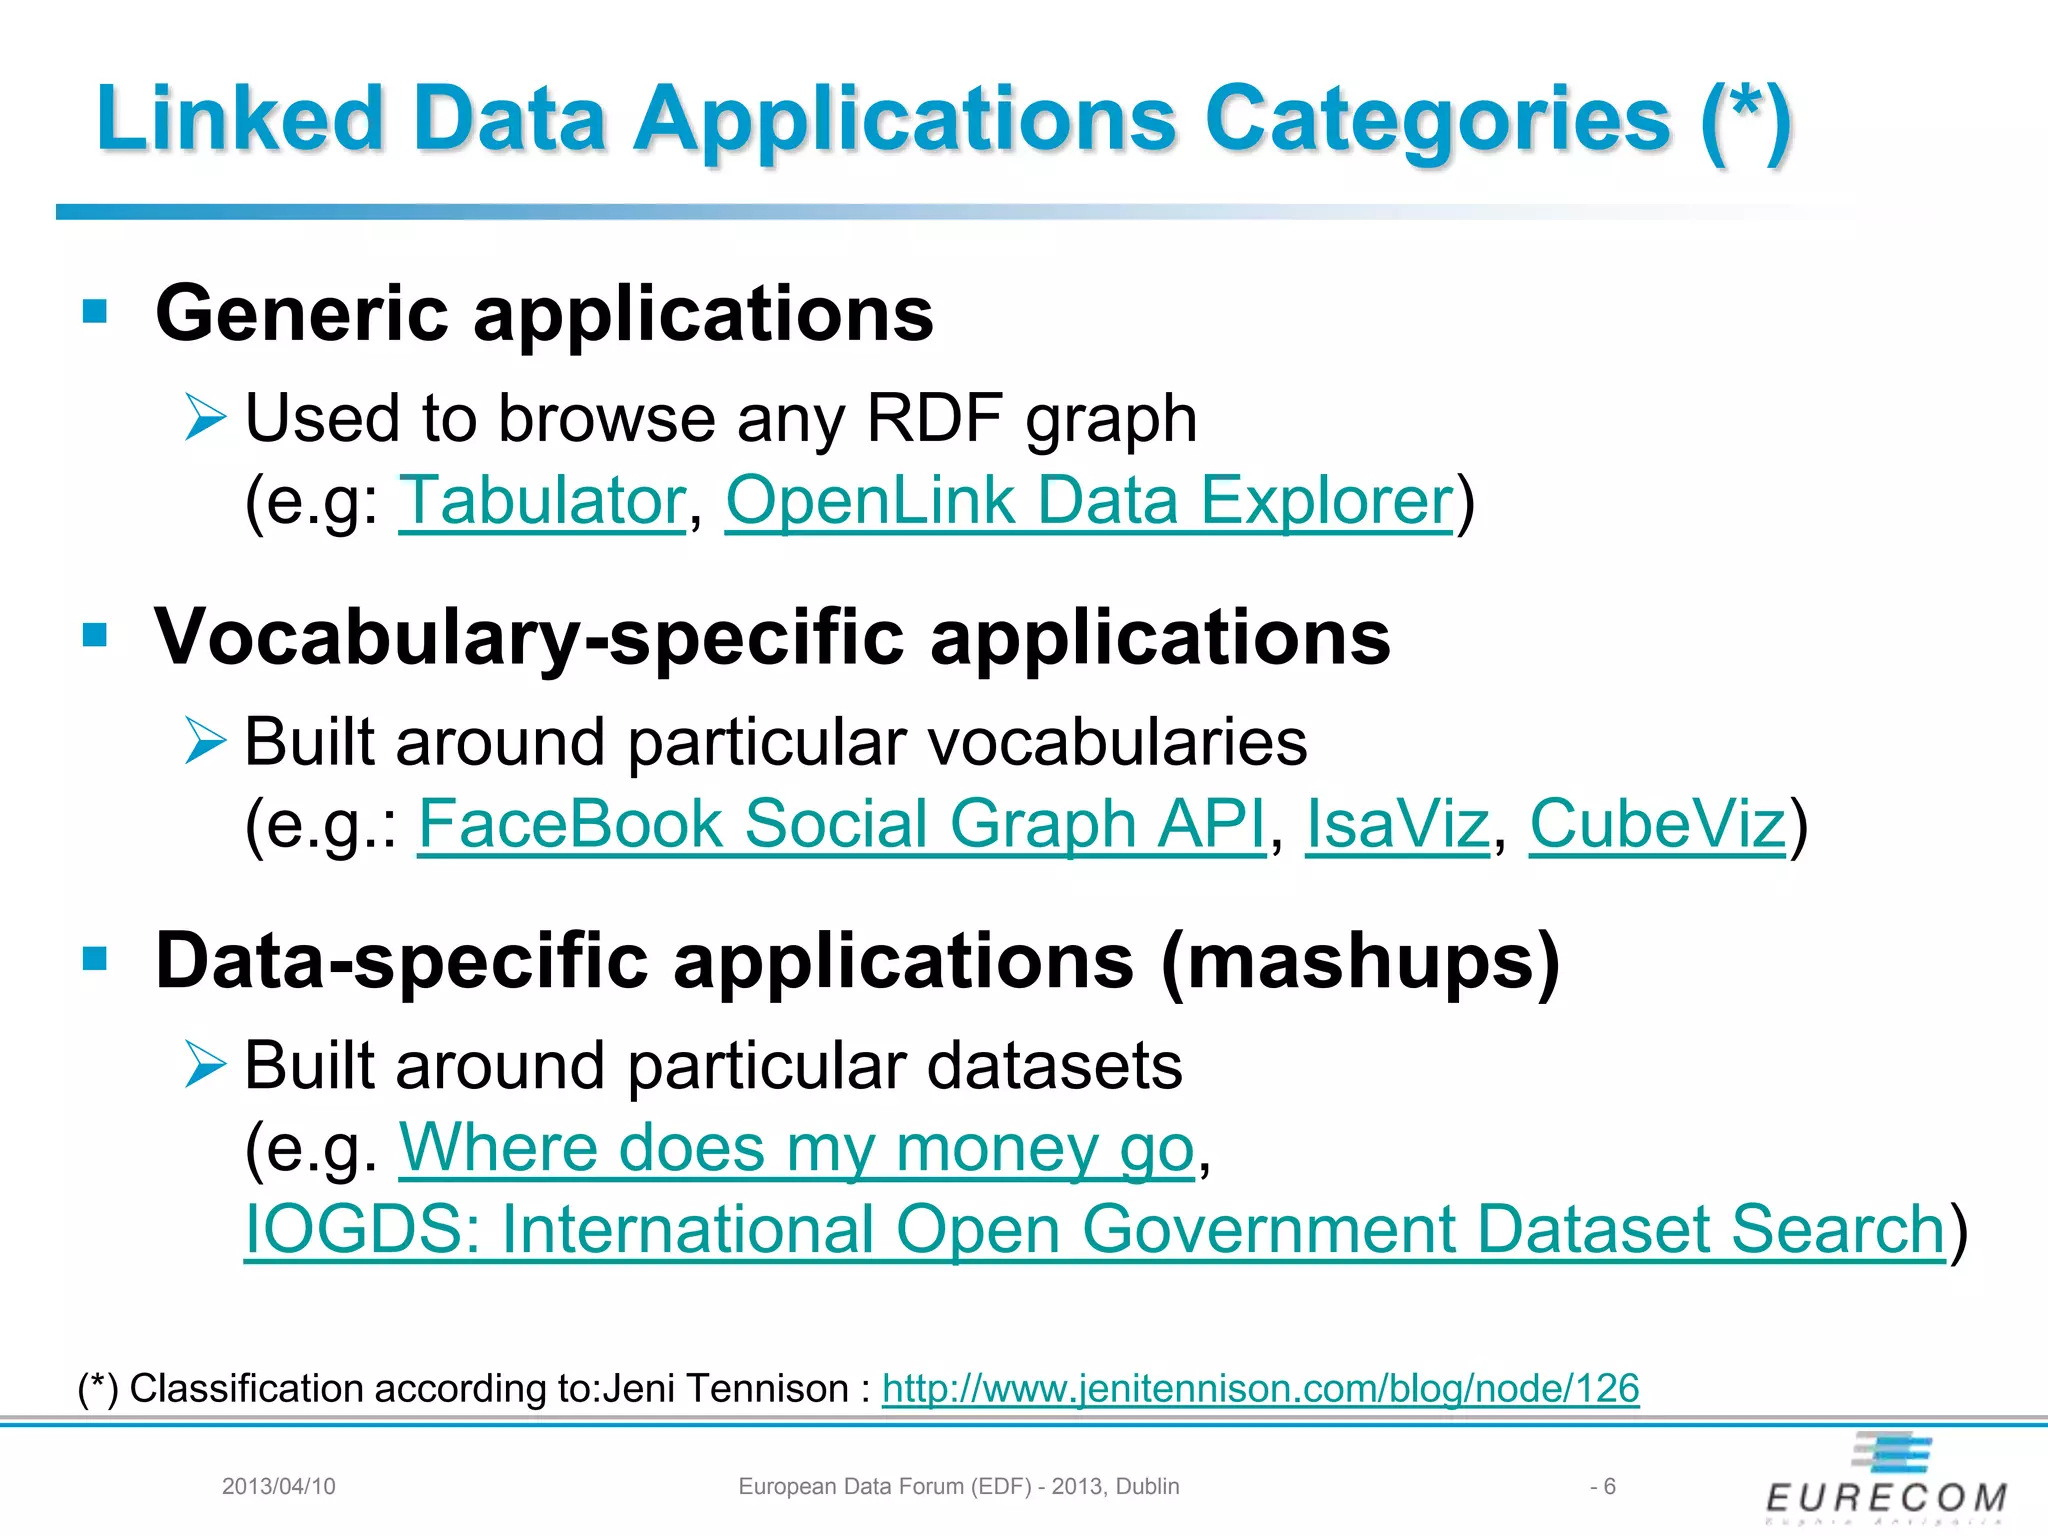
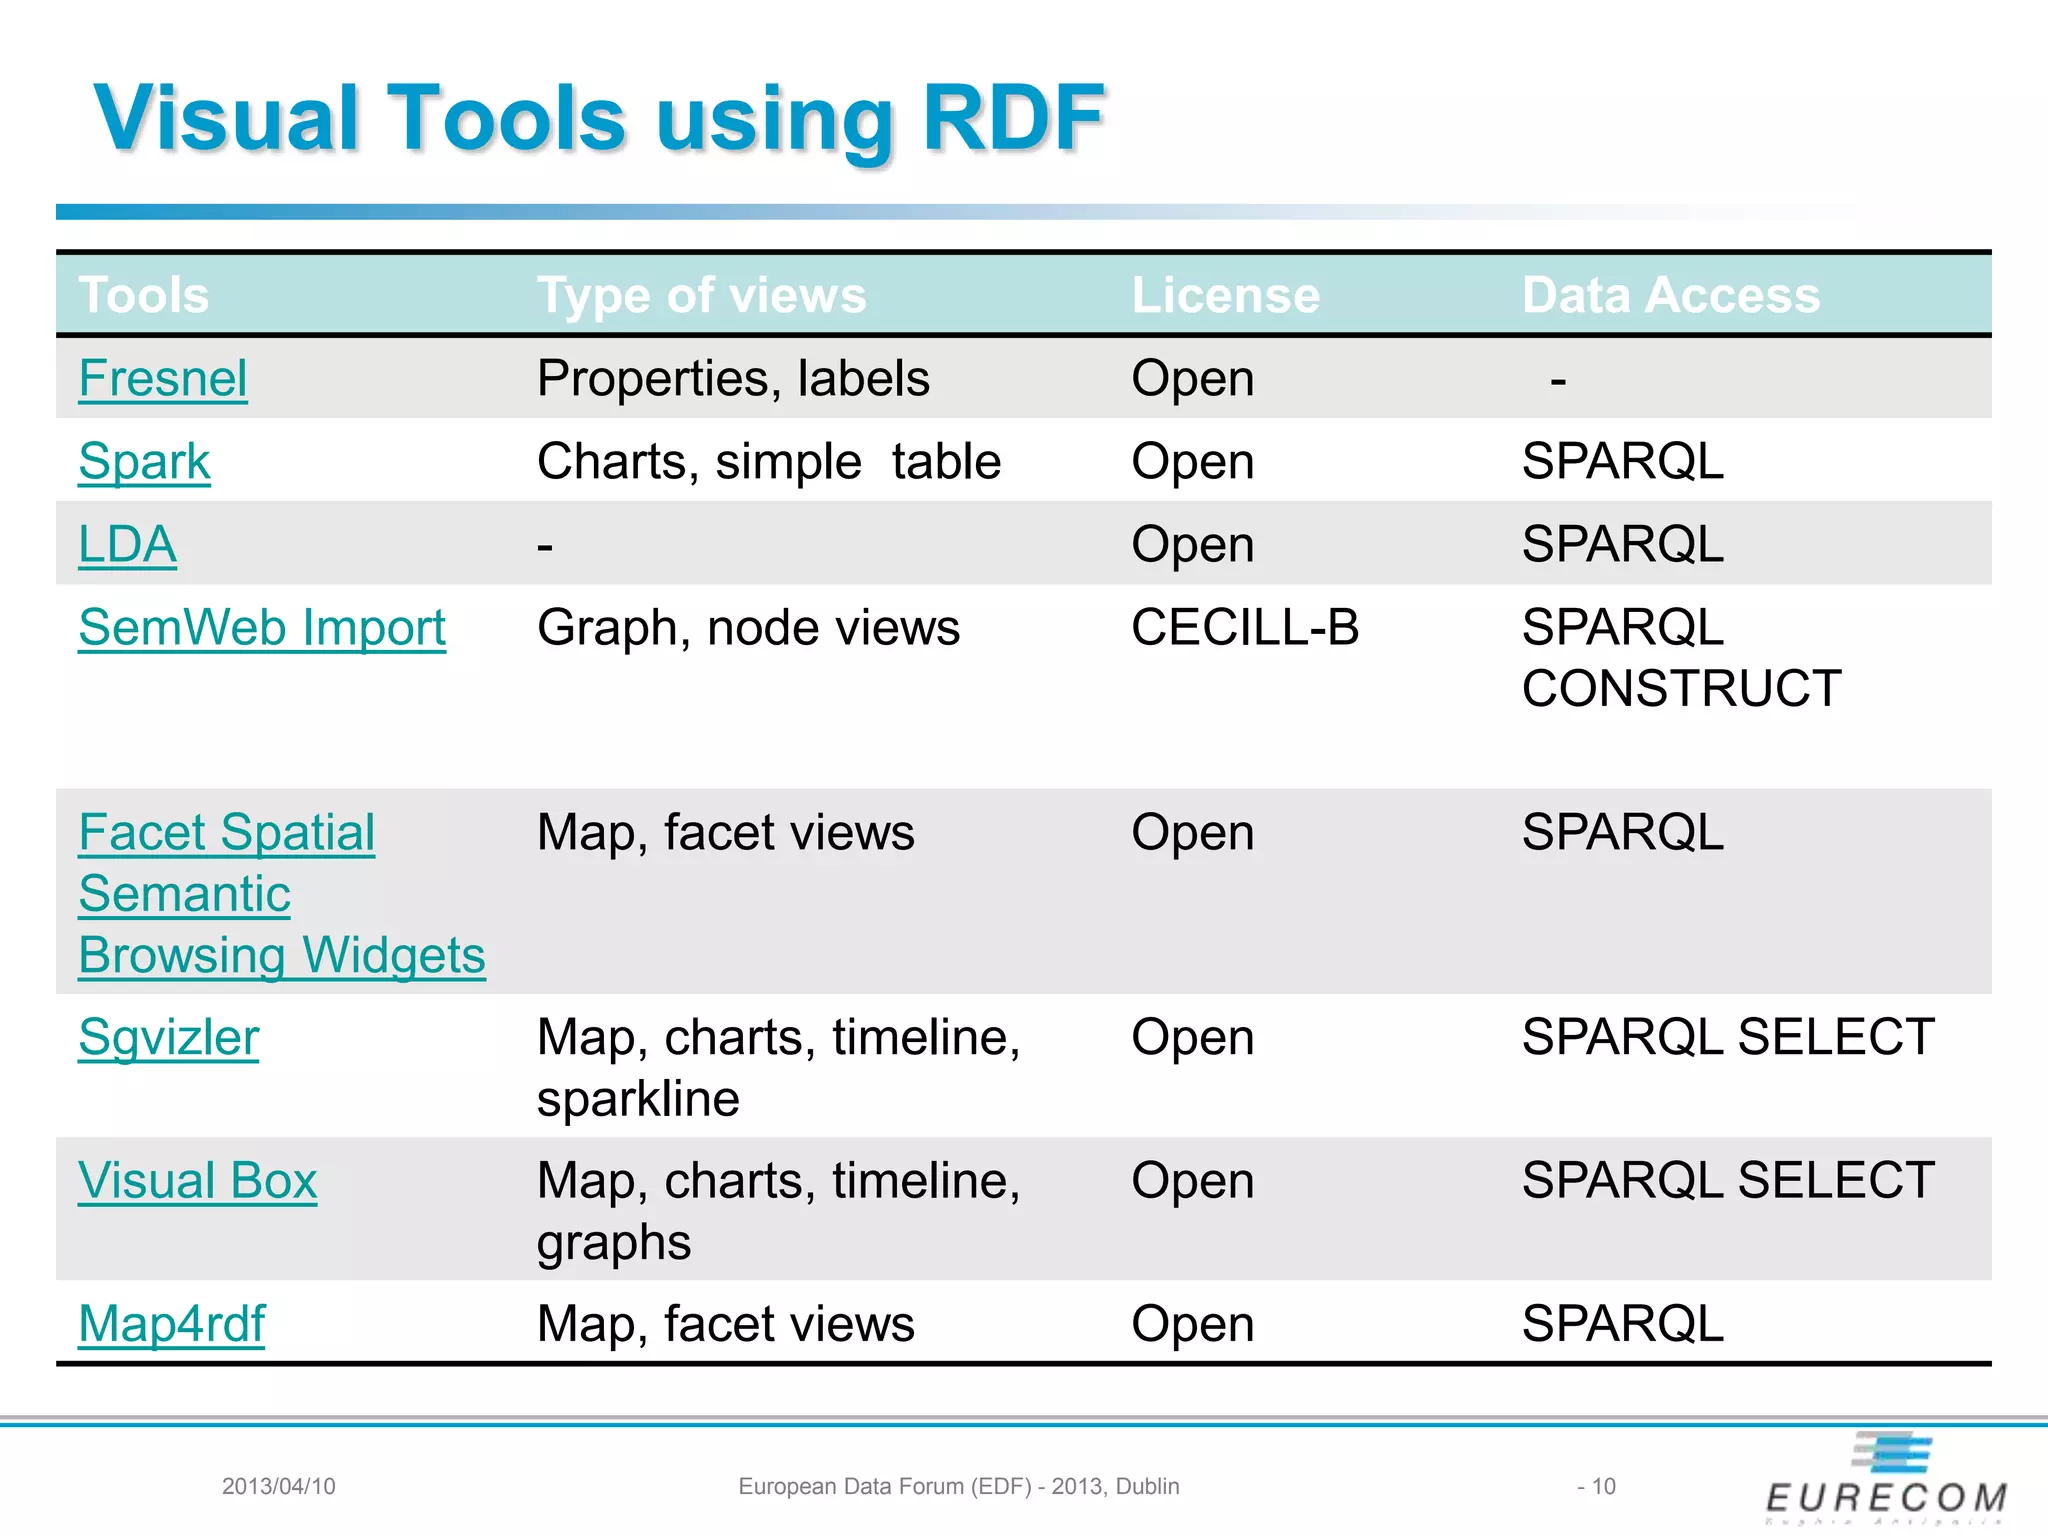
![Describing an Application: publicspending.gr
2013/04/10 European Data Forum (EDF) - 2013, Dublin - 12
Scope/Domain: Public spending, Government
Description The application helps visualizing the
most characteristic facts of the Greek public
spending, interconnected to foreign expenditure and
other data.
Supported Platform: Web
URL Policy:
http://publicspending.medialab.ntua.gr/en/{NAME-
CHART}.php. E.g:
http://publicspending.medialab.ntua.gr/en/toppayersday.php
Data Sources: http://opendata.diavgeia.gov.fr; Greek Tax
data (TAXIS).
Type of View: Bubble tree, column and bar charts
Visualization Tools: HighchartsJS, Bubble TreeJS
JqueryJS ; RaphaelJS
License: Open Government license [OGL]
Business Value: Non commercial ( Free)](https://image.slidesharecdn.com/edf2013towards-interoperable-visualization-applications-over-linked-data-ghislainatemezing-130416132832-phpapp01/75/EDF2013-Selected-Talk-Ghislain-Atemezing-Towards-Interoperable-Visualization-Applications-Over-Linked-Data-12-2048.jpg)


The document discusses creating interoperable visualization applications using linked data, focusing on reusable patterns from government data portals. It surveys visualization tools, highlights key features, and proposes a vocabulary (dvia) for application descriptions. The conclusion emphasizes the need for further evaluation and pattern detection in visualization tools to enhance data representation.


![[Srijan Wednesday Webinar] Leveraging the OGD Platform and Visualization Engine](https://cdn.slidesharecdn.com/ss_thumbnails/webinar-leveragingtheogdplatformandvisualizationengine-28-6-20171-170630114628-thumbnail.jpg?width=640&height=640&fit=bounds)


