This document is a report by Team 15 analyzing factors that influence demand for Ford vehicles in the US using multiple variable regression. It provides context on industry and company trends, describes the regression variables used in the analysis such as unemployment, consumer sentiment and gas prices, and lists the data sources. The report also outlines forecasts produced by the regression model and discusses implications for Ford, as well as emerging automotive technologies.
![Ford Automobile Multiple Variable Regression Team Report
Economic Analysis & Insights
Team 15 (Isha Mehta, Seth Harris, Lamya Barazi, Tony Garcia, and Phillip Pless)
December 5, 2015
5
classified as a type of durable good. During times of recession, durable goods expenditures tend to decrease. Thus, it
is expected that the recession indicator variable will have a negative sign with quantity demanded.
b. Data Sources
Monthly Civilian Unemployment Rate, Not Seasonally Adjusted, 1990-2015:
U.S. Department of Labor, Bureau of Labor Statistics. (2015, November 1). Civilian Unemployment Rate, Monthly,
Not Seasonally Adjusted [Data set]. Retrieved November 21, 2015, from
https://research.stlouisfed.org/fred2/series/UNRATENSA.
Quarterly Consumer Sentiment, Not Seasonally Adjusted, 1990-2015:
University of Michigan/Reuters. (2015, November 1). Consumer Sentiment, Quarterly, Not Seasonally Adjusted
[Data set]. Retrieved November 21, 2015, from https://research.stlouisfed.org/fred2/series/UMCSENT
Quarterly Effective Federal Funds Interest Rate, Not Seasonally Adjusted, 1990-2015:
Board of Governors of Federal Reserve System. (2015, November 1). Effective Federal Funds Interest Rate,
Quarterly, Not Seasonally Adjusted [Data set]. Retrieved November 21, 2015 from,
https://research.stlouisfed.org/fred2/series/DFF
Quarterly Gross Domestic Product, Seasonally Adjusted, Nominal Dollars, 1990-2015:
U.S. Department of Commerce, Bureau of Economic Analysis. (2015, November 1). Gross Domestic Product,
Quarterly, Seasonally Adjusted, Nominal Dollars [Data set]. Retrieved November 21, 2015, from,
http://www.bea.gov/national/index.htm#gdp
Annual Median Household Income, Not Seasonally Adjusted, 2014 Real Dollars, 1990-2015:
U.S. Census Bureau. (2015, November 1). Median Household Income, Annual, Not Seasonally Adjusted, 2014 Real
Dollars [Data set]. Retrieved November 21, 2015, from,
https://research.stlouisfed.org/fred2/series/MEHOINUSA672N
Quarterly Durable Goods Expenditures, Seasonally Adjusted, Nominal Dollars, 1990-2015:
U.S. Department of Commerce, Bureau of Economic Analysis (2015, October 29). Durable Goods Expenditures in
Billions of Dollars, Quarterly, Seasonally Adjusted, Nominal Dollars [Data set]. Retrieved November 21, 2015,
from, https://research.stlouisfed.org/fred2/series/PCEDG
Quarterly National Bureau of Economic Research Recession Indicators for the U.S. from the Period
Following the Peak through the Trough, Not Seasonally Adjusted:
Federal Reserve Bank of St. Louis, (2014, September 17). National Bureau of Economic Research Recession
Indicators for the U.S. from the Period Following the Peak through the Trough, Not Seasonally Adjusted [Data set].
Retrieved December 3, 2015, from, https://research.stlouisfed.org/fred2/series/USRECQ#
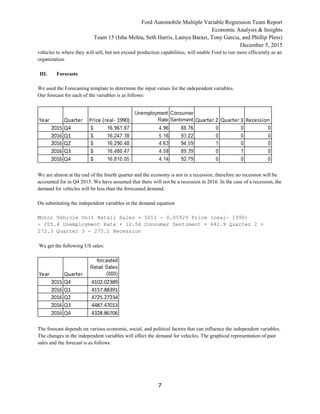
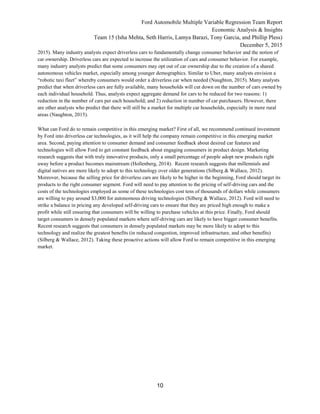
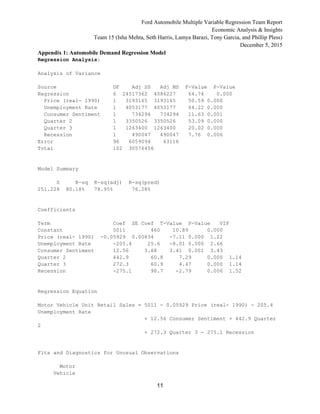
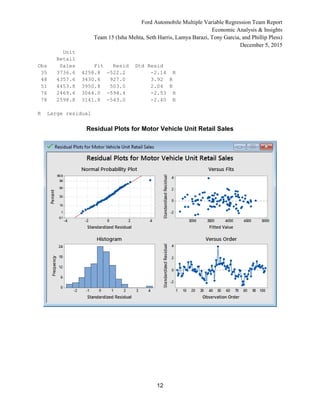
c. Multiple Variable Regression
The best demand equation to calculate the demand for the automobile sales is:
Motor Vehicle Unit Retail Sales = 5011 - 0.05929 Price (real- 1990)
- 205.4 Unemployment Rate + 12.56 Consumer Sentiment + 442.9 Quarter 2 +
272.3 Quarter 3 - 275.1 Recession](https://image.slidesharecdn.com/7010c86c-1bd9-4e54-8f99-bdd643196c8a-151216231221/85/EconomicAnalysisReportFinalSubmitted-5-320.jpg)


![Gm Marketing Strategy1[1]](https://cdn.slidesharecdn.com/ss_thumbnails/gmmarketingstrategy11-13351831663731-phpapp01-120423071640-phpapp01-thumbnail.jpg?width=640&height=640&fit=bounds)


