The economic outlook summary is as follows:
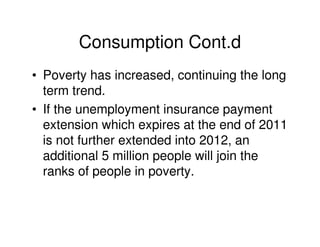
1) The US economy has slowed significantly with weak GDP growth and persistently high unemployment.
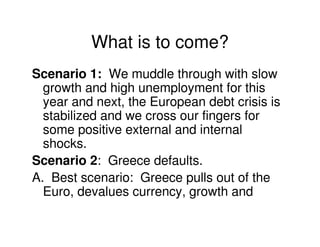
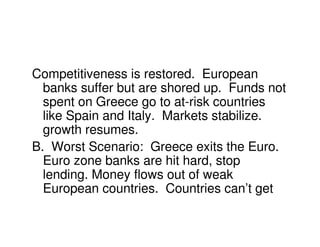
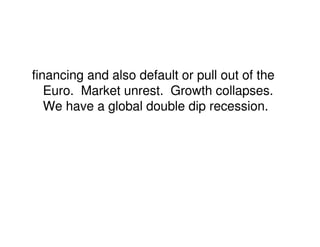
2) Even the slow recovery is threatened by the ongoing European sovereign debt crisis which could trigger a global recession.
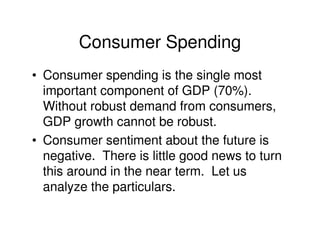
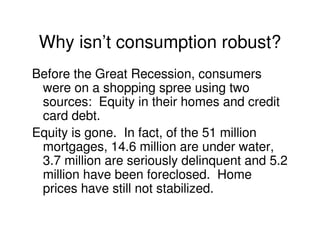
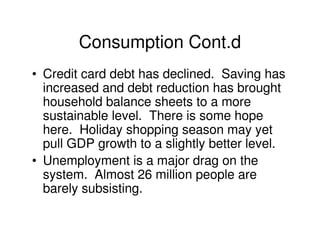
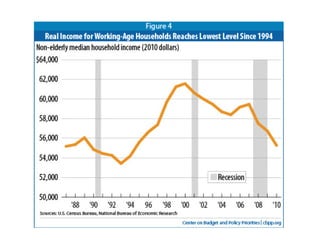
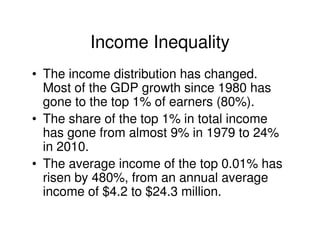
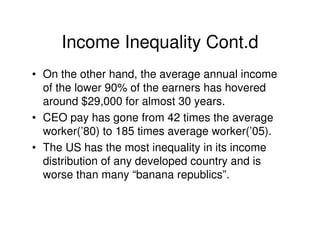
3) Domestic consumption, a major driver of GDP, remains subdued due to high unemployment, income inequality, and households focusing on debt reduction over spending.


![Economics presentation1[1]](https://cdn.slidesharecdn.com/ss_thumbnails/economicspresentation11-131216075459-phpapp01-thumbnail.jpg?width=640&height=640&fit=bounds)


![4th Qtr Year End 2011 Economic Review Feb 15 [Autosaved] [Autosaved]](https://cdn.slidesharecdn.com/ss_thumbnails/4thqtryearend2011economicreviewfeb15autosavedautosaved-13463731899543-phpapp02-120830193551-phpapp02-thumbnail.jpg?width=640&height=640&fit=bounds)
![4th Qtr Year End 2011 Economic Review Feb 15 [Autosaved] [Autosaved]](https://cdn.slidesharecdn.com/ss_thumbnails/4thqtryearend2011economicreviewfeb15autosavedautosaved-13329676670408-phpapp01-120328155136-phpapp01-thumbnail.jpg?width=640&height=640&fit=bounds)
![4th Qtr Year End 2011 Economic Review Feb 15 [Autosaved] [Autosaved]](https://cdn.slidesharecdn.com/ss_thumbnails/4thqtryearend2011economicreviewfeb15autosavedautosaved-13329663799627-phpapp01-120328152725-phpapp01-thumbnail.jpg?width=640&height=640&fit=bounds)
![4th Qtr Year End 2011 Economic Review Feb 15 [Autosaved] [Autosaved]](https://cdn.slidesharecdn.com/ss_thumbnails/4thqtryearend2011economicreviewfeb15autosavedautosaved-13439227651427-phpapp01-120802105911-phpapp01-thumbnail.jpg?width=640&height=640&fit=bounds)


