Download to read offline

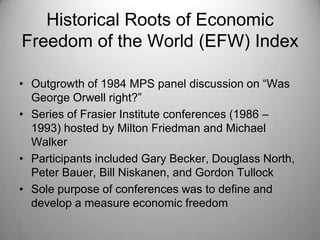
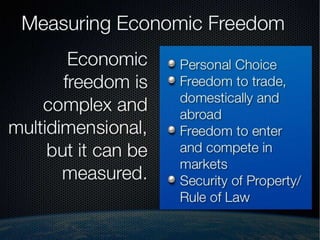
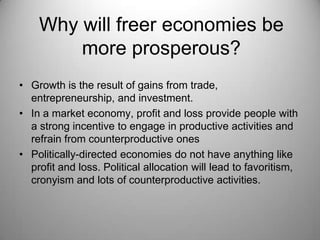
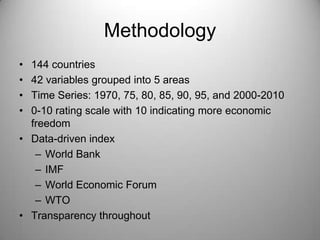
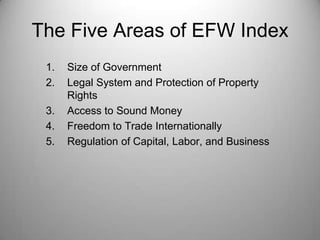
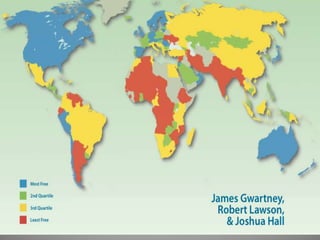
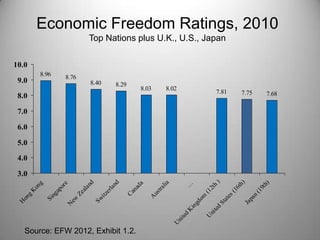
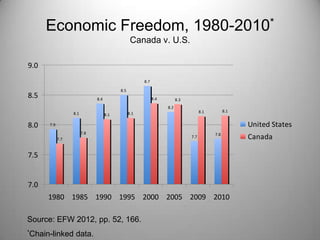


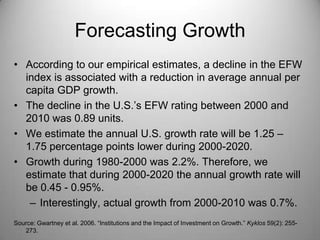
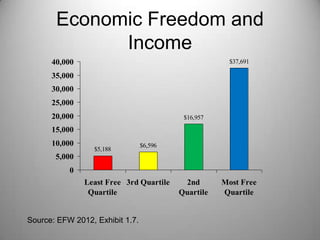
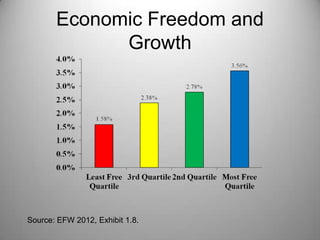
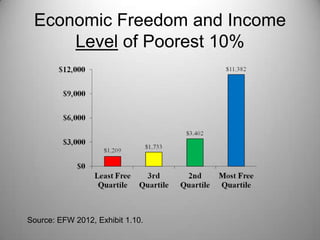
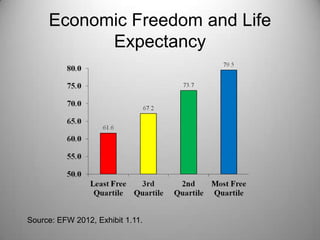
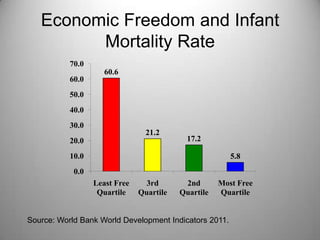
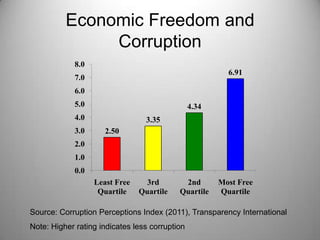


The document summarizes the 2012 Economic Freedom of the World annual report. It discusses the origins and methodology of the EFW index, which measures economic freedom across 5 areas in 144 countries from 1970-2010. The report finds that countries with higher economic freedom ratings have higher GDP growth, income levels, and life expectancy as well as lower corruption and infant mortality. The US economic freedom rating declined from 2000-2010, which may lower future growth rates according to the report's estimates.


