FUSION14 Session 302 | Optimizing the Tradeoff: Cost vs. Quality in IT SupportMetricNet
Cost vs. quality: It’s a perennial issue in technical service and support. Drive your costs too low, and you risk sacrificing the quality of service. Conversely, if you push quality too high (yes, that’s possible!), then you drive your costs through the roof. Understanding the cost/quality tradeoff is the most critical step toward optimizing your support model. Using data from more than 300 benchmarks worldwide, Jeff Rumburg will illustrate how top-performing service and support organizations strike an appropriate balance between the cost of service delivery and the quality of support provided. He’ll share simple yet powerful techniques that will enable organizations to pinpoint their position on the cost vs. quality curve, determine if higher (or lower) quality is justified, reduce costs without sacrificing quality, and improve quality without increasing costs. Finally, he’ll share an interactive scorecard that organizations can use to determine whether service and support has been optimized, and, if it hasn’t, to identify the tangible steps needed to achieve an optimized support model.
Presentatie voor een seminarie aan de HUB voor postgraduaten digitale communicatie. Aan de hand van een interactieve oefening een business model opstellen om gefundeerd e-business te introduceren.
Visualizing data has become one of the hottest trends in analytics not only because it works to more quickly identifying anomalies but in also explaining the results to management. In this case study focused webinar, you’ll learn how to translate unwieldy files of financial data into a single compact scattergraph, pie chart, or overlay—and then “sample with pictures” by picking out the key items that merit sampling and follow-up.
Specific learning objectives include:
o Understand graph types and their different analytical strengths from an audit perspective
o Learn best practices in dahsboarding results through a review of a variety of example dashboard templates
o Be able to score records based on various audit reports to improve your effectiveness and reduce false positives in your samples
o See how to quickly turn a visualization exercise into a sampling approach by sampling multiple categories to identify highest-risk items.
o Use auto-formatting and dynamic data-grabbing tools so new data can create new graphs each audit period, at the touch of a button
o Integrate statistics into your visualizations to extract the most exceptional sample units
Change Your Mindset: The Key to Growing Your Accounting PracticeAggregage
In the accounting profession, the post-COVID business model is surely on everyone's minds. Unmistakably, the way to forge ahead will look different than in years past. The biggest mistake that a majority of companies are making in regard to growth is holding onto old conventions, paradigms, and practices.
Whether re-integrating back to in-office life or staying digitally connected through remote work, the first step in determining how to spur growth comes with reevaluating your company's willingness to change mindset.
Join David Bergstein, Chief Innovation Officer at Bergstein CPA, as he shares insight on the accounting landscape, new trends, and practical tips for reevaluating your company's positionality.
This session will cover:
• What it means to challenge tradition and change your company mindset
• How to make sure you are set up to be as productive and efficient as possible
• Best practices for choosing the tools you will utilize
• Methods to measure and track your success so you can watch yourself improve!
...and more! Everyone who attends will walk away with the knowledge of what to do to be successful in the "New Normal."
How to improve your performance online - survey results Microsoft Dynamics Pa...Patrick Dalle
From a field research on the websites of 80 Microsoft Dynamics Partners in Belgium & the Netherlands, Lemarco discovered the real key drivers behind online performance
Webinar: Measuring Success of Your Product by fmr Amazon Sr PMProduct School
Main Takeaways:
- Aligning product success with company success
- Directly measurable metrics for your product
- Indirect impact of your product on your company's bottom-line
- Which metrics are important to Product Managers
dgm | Online Retailer Expo Sydney 2012 | Chris GarnerChris Garner
We have all read the news, we all know the facts on how fast the ecommerce industry is growing, and we all know how much Australians' spend online is growing every year. Let’s dig deeper around what are the successful digital strategies being deployed in the online marketing industry to power this phenomenal revolution. We will show you the inside story on which clients are making it look easy. We will show you the levers that can be pulled to influence the flow of the customer journey. These levers can increase conversion and lifetime value, and decrease wastage of your marketing dollars. We will show you practical ways that you can use these proven ideas in your business, to help garner incremental customers cost effectively.
Dynamic benchmarking overview for franchises.
Stack-up™ is an online benchmarking service that provides real-time performance comparisons of financial, operational, procedural and best practice metrics.
Stack-up for franchise systems offers franchisees and franchisors insight on financial, operational and key performance data points through dynamic peer comparisons and can be integral part of the franchise recipe for success.
Performance management problem and solution overview : GroSum GroSum
Overview of Performance Management issues and how GroSum is benefiting organization. By automating the entire Performance Management process, GroSum makes the work of HR much easier and saves time for other activities.
With Checkins and Instant Feedback, GroSum is eliminating non-engagement from Performance Management.
Topics covered here : Checkins, Instant Feedback, GroSum Review Cycle, Review Letters, Automated Email and notifications
Build a Winning Conversion Optimization StrategySavage Marketing
By Srikant Kotapalli – VWO
AB Testing has traditionally been one of the most commonly used methods to boost conversion rates. Many marketers have since used it tactically, that gets them some early wins but are unable to convert it into repeatable success. Building an effective optimization strategy needs an in-depth understanding of user behaviour, adopting a structured framework and constantly measuring and improving upon the results. This session will walk you through everything you need to know to transform your AB testing into a winning optimization engine.
Has your organization ever considered replacing a tester that did not write, for example, 15 test cases per day? Is the testing team blamed if defect leakage is greater than 5% into production? What drives decisions like these? The common thread in these examples is “Test Metrics”
Test Metrics... Everyone has an opinion about them. Some believe they are the most valuable way to communicate the results of testing. Some think that they are useless, misleading, and damaging to the communication of test results. Some believe that without measurement you are not managing the effort. And some believe that bad metrics are worse than no metrics at all.
Where does your organization fit in the metrics and measurement debates? Is your team aligned? Do you agree with the team? Do you use a reporting process for test results? Are you forced to report on metrics you don't believe are valuable? Do you have dozens of metrics that you are reporting periodically that no one looks at, and when they do look at them, there is room for misinterpretation?
In this session, Mike Lyles and Jay Philips will challenge the audience to discuss the topic of metrics and measurement, review multiple viewpoints on the topic, and address many of the questions that organizations have today around metrics and measurement.
Takeaways:
- Top metrics that are misused or misunderstood in most every organization.
- Metrics that you should you get rid of ASAP!
- Best and Worst metrics - based on opinions of the speakers & audience.
- Metrics that everyone should use – and how they compare to your organization’s metrics.
- Tools and processes that can help your organization better measure your testing.
** Presentation given at STPCon Spring 2014
Learn statistics and expert opinions on the state of the market regarding data quality in 2023.
Learn about:
- statistics and expert opinions
- the key focus of data quality in 2023
- the Data Maturity Model
- DevOps for data and CI/CD pipelines
- data validation and ETL testing
- test automation
According to Gartner, 70% of social implementations fail because they lack a business purpose. When it comes to harnessing the power of social software, a focus on business value is required. This whitepaper defines a strategic framework for gaining business value from social software. It outlines six successful rollout strategies. Each of the six approaches delivers different business results, and has a different level of risk. And most importantly, each has different requirements to succeed. To be successful with social software, you need to choose the rollout strategy that is best for your organization, and understand its requirements for success.
The key differences between the MDR and IVDR in the EUAllensmith572606
In the European Union (EU), two significant regulations have been introduced to enhance the safety and effectiveness of medical devices – the In Vitro Diagnostic Regulation (IVDR) and the Medical Device Regulation (MDR).
https://mavenprofserv.com/comparison-and-highlighting-of-the-key-differences-between-the-mdr-and-ivdr-in-the-eu/
RMD24 | Debunking the non-endemic revenue myth Marvin Vacquier Droop | First ...BBPMedia1
Marvin neemt je in deze presentatie mee in de voordelen van non-endemic advertising op retail media netwerken. Hij brengt ook de uitdagingen in beeld die de markt op dit moment heeft op het gebied van retail media voor niet-leveranciers.
Retail media wordt gezien als het nieuwe advertising-medium en ook mediabureaus richten massaal retail media-afdelingen op. Merken die niet in de betreffende winkel liggen staan ook nog niet in de rij om op de retail media netwerken te adverteren. Marvin belicht de uitdagingen die er zijn om echt aansluiting te vinden op die markt van non-endemic advertising.
Improving profitability for small businessBen Wann
In this comprehensive presentation, we will explore strategies and practical tips for enhancing profitability in small businesses. Tailored to meet the unique challenges faced by small enterprises, this session covers various aspects that directly impact the bottom line. Attendees will learn how to optimize operational efficiency, manage expenses, and increase revenue through innovative marketing and customer engagement techniques.
The world of search engine optimization (SEO) is buzzing with discussions after Google confirmed that around 2,500 leaked internal documents related to its Search feature are indeed authentic. The revelation has sparked significant concerns within the SEO community. The leaked documents were initially reported by SEO experts Rand Fishkin and Mike King, igniting widespread analysis and discourse. For More Info:- https://news.arihantwebtech.com/search-disrupted-googles-leaked-documents-rock-the-seo-world/
LA HUG - Video Testimonials with Chynna Morgan - June 2024Lital Barkan
Have you ever heard that user-generated content or video testimonials can take your brand to the next level? We will explore how you can effectively use video testimonials to leverage and boost your sales, content strategy, and increase your CRM data.🤯
We will dig deeper into:
1. How to capture video testimonials that convert from your audience 🎥
2. How to leverage your testimonials to boost your sales 💲
3. How you can capture more CRM data to understand your audience better through video testimonials. 📊
"𝑩𝑬𝑮𝑼𝑵 𝑾𝑰𝑻𝑯 𝑻𝑱 𝑰𝑺 𝑯𝑨𝑳𝑭 𝑫𝑶𝑵𝑬"
𝐓𝐉 𝐂𝐨𝐦𝐬 (𝐓𝐉 𝐂𝐨𝐦𝐦𝐮𝐧𝐢𝐜𝐚𝐭𝐢𝐨𝐧𝐬) is a professional event agency that includes experts in the event-organizing market in Vietnam, Korea, and ASEAN countries. We provide unlimited types of events from Music concerts, Fan meetings, and Culture festivals to Corporate events, Internal company events, Golf tournaments, MICE events, and Exhibitions.
𝐓𝐉 𝐂𝐨𝐦𝐬 provides unlimited package services including such as Event organizing, Event planning, Event production, Manpower, PR marketing, Design 2D/3D, VIP protocols, Interpreter agency, etc.
Sports events - Golf competitions/billiards competitions/company sports events: dynamic and challenging
⭐ 𝐅𝐞𝐚𝐭𝐮𝐫𝐞𝐝 𝐩𝐫𝐨𝐣𝐞𝐜𝐭𝐬:
➢ 2024 BAEKHYUN [Lonsdaleite] IN HO CHI MINH
➢ SUPER JUNIOR-L.S.S. THE SHOW : Th3ee Guys in HO CHI MINH
➢FreenBecky 1st Fan Meeting in Vietnam
➢CHILDREN ART EXHIBITION 2024: BEYOND BARRIERS
➢ WOW K-Music Festival 2023
➢ Winner [CROSS] Tour in HCM
➢ Super Show 9 in HCM with Super Junior
➢ HCMC - Gyeongsangbuk-do Culture and Tourism Festival
➢ Korean Vietnam Partnership - Fair with LG
➢ Korean President visits Samsung Electronics R&D Center
➢ Vietnam Food Expo with Lotte Wellfood
"𝐄𝐯𝐞𝐫𝐲 𝐞𝐯𝐞𝐧𝐭 𝐢𝐬 𝐚 𝐬𝐭𝐨𝐫𝐲, 𝐚 𝐬𝐩𝐞𝐜𝐢𝐚𝐥 𝐣𝐨𝐮𝐫𝐧𝐞𝐲. 𝐖𝐞 𝐚𝐥𝐰𝐚𝐲𝐬 𝐛𝐞𝐥𝐢𝐞𝐯𝐞 𝐭𝐡𝐚𝐭 𝐬𝐡𝐨𝐫𝐭𝐥𝐲 𝐲𝐨𝐮 𝐰𝐢𝐥𝐥 𝐛𝐞 𝐚 𝐩𝐚𝐫𝐭 𝐨𝐟 𝐨𝐮𝐫 𝐬𝐭𝐨𝐫𝐢𝐞𝐬."
Enterprise Excellence is Inclusive Excellence.pdfKaiNexus
Enterprise excellence and inclusive excellence are closely linked, and real-world challenges have shown that both are essential to the success of any organization. To achieve enterprise excellence, organizations must focus on improving their operations and processes while creating an inclusive environment that engages everyone. In this interactive session, the facilitator will highlight commonly established business practices and how they limit our ability to engage everyone every day. More importantly, though, participants will likely gain increased awareness of what we can do differently to maximize enterprise excellence through deliberate inclusion.
What is Enterprise Excellence?
Enterprise Excellence is a holistic approach that's aimed at achieving world-class performance across all aspects of the organization.
What might I learn?
A way to engage all in creating Inclusive Excellence. Lessons from the US military and their parallels to the story of Harry Potter. How belt systems and CI teams can destroy inclusive practices. How leadership language invites people to the party. There are three things leaders can do to engage everyone every day: maximizing psychological safety to create environments where folks learn, contribute, and challenge the status quo.
Who might benefit? Anyone and everyone leading folks from the shop floor to top floor.
Dr. William Harvey is a seasoned Operations Leader with extensive experience in chemical processing, manufacturing, and operations management. At Michelman, he currently oversees multiple sites, leading teams in strategic planning and coaching/practicing continuous improvement. William is set to start his eighth year of teaching at the University of Cincinnati where he teaches marketing, finance, and management. William holds various certifications in change management, quality, leadership, operational excellence, team building, and DiSC, among others.
Business Valuation Principles for EntrepreneursBen Wann
This insightful presentation is designed to equip entrepreneurs with the essential knowledge and tools needed to accurately value their businesses. Understanding business valuation is crucial for making informed decisions, whether you're seeking investment, planning to sell, or simply want to gauge your company's worth.
Cracking the Workplace Discipline Code Main.pptxWorkforce Group
Cultivating and maintaining discipline within teams is a critical differentiator for successful organisations.
Forward-thinking leaders and business managers understand the impact that discipline has on organisational success. A disciplined workforce operates with clarity, focus, and a shared understanding of expectations, ultimately driving better results, optimising productivity, and facilitating seamless collaboration.
Although discipline is not a one-size-fits-all approach, it can help create a work environment that encourages personal growth and accountability rather than solely relying on punitive measures.
In this deck, you will learn the significance of workplace discipline for organisational success. You’ll also learn
• Four (4) workplace discipline methods you should consider
• The best and most practical approach to implementing workplace discipline.
• Three (3) key tips to maintain a disciplined workplace.
2. E-Business Monitor offers a global benchmark to
analyze and improve E-Business strategy, organization
maturity & performance
Three simple steps to start improving performance!
3. E-Business Monitor delivers actionable insights to
digital marketing professionals worldwide
We focus on three areas to find out where you can
improve your business results
6. This is offers your main navigation
You can access:
» My survey: access to the four key sections of the E-
Business Monitor
» My report: access to your E-Business Monitor scores
» My benchmark: access to custom benchmarking
» My Company: available to professional & enterprise
members
7. And gives an overview of your progress in the 4 main
sections of the E-Business Monitor
1
2
3
4
8. Each questions progress is indicated by a color
Grey = not started
Green = completed
Yellow = started but not
yet complete
16. After completion of a section , your results will
become available in your ‘My Report’ tab
Starting point is the E-Business Monitor Index
17. The ‘E-Business Monitor Index’ allows you to compare
your organization to the global average, your sector
and your department results
18. And classifies your organization on the four levels of
the E-Business Monitor Index
The E-Business Monitor Index is the running average of all
participants. Your classification changes with each participant!
» Innovators:
the top 75-100% of
participant scores
» Professionals:
the 50-75% of
participant scores.
» Learners:
the 25-50% of
participant scores.
» Starters:
the low 25% of
participant scores.
19. ‘Readiness’ offers a deep dive in key areas of
organization maturity
Each of the readiness topics is detailed in: focus,
process and integration
20. ‘Readiness’ and offers an overview of your
organizations maturity level
Giving you an indication of where to start looking for
improvements
21. ‘Enablers’ allows you to deep dive in key drivers &
inhibitors of E-Business
Giving you an indication of where to start looking for
improvements
22. ‘Enablers’ and offers an overview of drivers and
inhibitors for E-Business performance
What a good E-Business Net Promoter Score is
depends on organization and sector
23. ‘My benchmark’ tab allows you to create standard
benchmarks for key performance indicators…
You can make selections based on key criteria. Only
KPI’s you answered will be presented
» Advanced custom
benchmarking is
available to Premium
members
» This offers the ability to
create peer groups
(minimum of 6
companies) and
bennchmark against
these
24. ‘My benchmark’ offers detailed insights on how you
compare on the selected performance indicators …
Your score is compared to the average of the
benchmark you selected
» 100% percentile means
your score is the highest
compared to your
selected benchmark
(nobody scored higher)
» 0% means your score is
the lowest compared to
your selected
benchmark (nobody
scored lower)
25. Key performance indicators available in the E-
Business Monitor
Financial perspective: Customer perspective: Organization Learning perspective:
» % online turnover » % of registered perspective: » % new employees
» % of online orders customers (on sales & » % on-time delivery of attracted through
» % online contribution service websites) online orders online channels
to overall profitability » % customer » % of issues with » % employee retention
» % costs per lead satisfaction online online orders in online team roles
» % costs per order » % of leads generated » % returns of online » % internal
» % online order value online orders commitment
» % average items » % average online » % of online (employee
ordered online lifetime value campaigns delivered satisfaction with E-
» % online profitability » % service on budget Business)
transactions online » % of campaigns » % channel
» % retention of online delivered in time effectiveness
compared to offline (+ » % online projects » % process
or – %) delivered on budget improvement
» % turnover from new » % online projects
E-Business initiatives delivered in time
» % process time
savings through
online self service
26. Key performance indicators available in the E-
Business Monitor
Channel contribution: Budget:
» % turnover owned stores » Total E-Business budget
» % turnover other stores » Strategy, planning & external consultancy budget
» % turnover contact center » Web marketing & campaigns (including ad
» % direct sales (account management) campaigns, search engine marketing, email
» % catalogue / direct mail campaigning, etc.) budget
» % indirect (partner / dealer channels) » Content management budget
» % door-to-door » Running E-Business channel(s) (including site
» % other channels development, etc.) budget
» % online orders in customer facing webshops » Research & benchmarking budget
» % of online orders through customers E- » Staffing (internal) budget
Procurement portals / webshops / back-office » Social media initiatives budget
systems » Innovation (E-Business related) budget
» Mobile initiatives budget
» Training & education (E-Business team + staff)
budget
» Channel platform development (only business
component) budget
» Web analytics & eCRM budget
» ICT budget external (incl. external staff) budget
» ICT budget internal (incl. internal staff) budget
27. Start benchmarking and improving your E-Business
performance now ….
» We are an independent organization
» We offer a stand-alone online platform (no consultants
involved)
» We offer direct reporting and benchmarking
» We offer a continuous benchmark, tracking progress over
time!
» Your data is your data and your data alone!
» We deliver valuable & actionable insights!
» We are exclusively aimed at client-side (brand) executives,
managers and specialists!
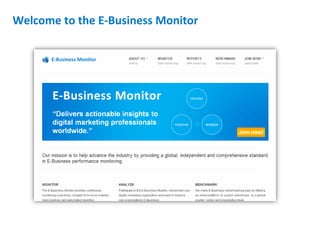
29. ABOUT US
E-BUSINESS MONITOR
Our mission is to help advance the industry by providing a global, independent
and comprehensive standard in E-Business strategy, organization maturity and
performance benchmarking.
E-Business Monitor| www.e-business-monitor.org | info@e-business-monitor.org | twitter: @ebusmonitor