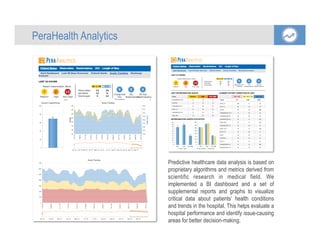
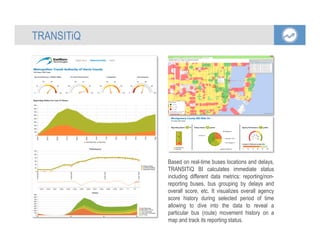
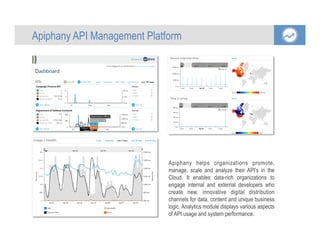
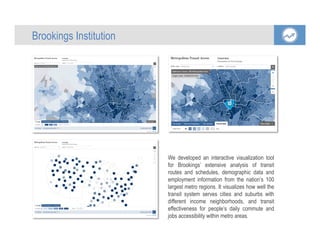
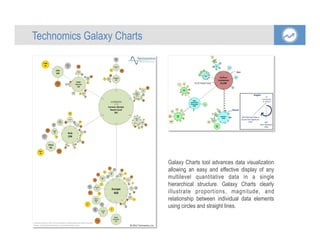
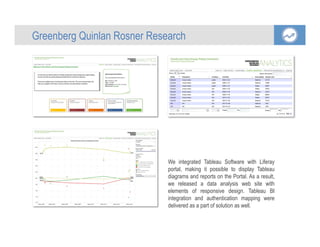
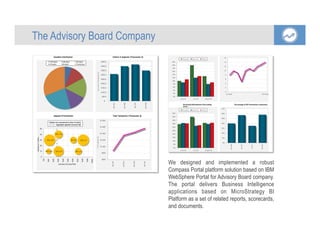
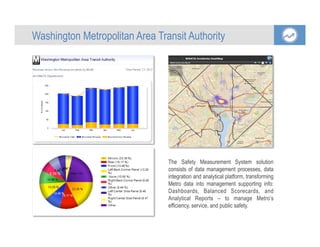
EastBanc Technologies
Data Visualization Portfolio
Data Visualization
Predictive healthcare data analysis is based on
proprietary algorithms and metrics derived from
scientific research in medical field. We
implemented a BI dashboard and a set of
supplemental reports and graphs to visualize
critical data about patients’ health conditions
and trends in the hospital. This helps evaluate a
hospital performance and identify issue-causing
areas for better decision-making.
	
  
PeraHealth Analytics
Based on real-time buses locations and delays,
TRANSITiQ BI calculates immediate status
including different data metrics: reporting/non-
reporting buses, bus grouping by delays and
overall score, etc. It visualizes overall agency
score history during selected period of time
allowing to dive into the data to reveal a
particular bus (route) movement history on a
map and track its reporting status.
TRANSITiQ
Apiphany helps organizations promote,
manage, scale and analyze their API’s in the
Cloud. It enables data-rich organizations to
engage internal and external developers who
create new, innovative digital distribution
channels for data, content and unique business
logic. Analytics module displays various aspects
of API usage and system performance.
Apiphany API Management Platform
We developed an interactive visualization tool
for Brookings’ extensive analysis of transit
routes and schedules, demographic data and
employment information from the nation’s 100
largest metro regions. It visualizes how well the
transit system serves cities and suburbs with
different income neighborhoods, and transit
effectiveness for people’s daily commute and
jobs accessibility within metro areas.
Brookings Institution
Galaxy Charts tool advances data visualization
allowing an easy and effective display of any
multilevel quantitative data in a single
hierarchical structure. Galaxy Charts clearly
illustrate proportions, magnitude, and
relationship between individual data elements
using circles and straight lines.
	
  
Technomics Galaxy Charts
Countries  with  less  than  2.5%  of  Continent’s  total  grouped  into  Other  Countries
Source: http://www.london2012.com/medals/medal-count/ © 2012 Technomics, Inc.
Summer Olympic
Medal Count
962
Africa
30
3%
Botswana
1
0.1
Egypt
2
0.2%
Ethiopia
7
0.8%
Gold
3
0.3
Silver
1
0.1%
Bronze
3
0.3%
Gabon
1
0.1%
Kenya
11
1%
Gold
2
0.2
Silver
4
0.5
Bronze
5
0.6
Morocco
1
0.1
South
Africa
3
0.3%
Gold
3
0.2
Silver
2
0.1
Bronze
1
0.1
Uganda
1
0.1%
Asia
238
25%
Other
Countries
37
3%
Azerbaijan
10
0.9%
Gold
2
0.2
Silver
2
0.2%
Bronze
6
0.5
China
88
8%
Gold
38
3%
Silver
27
2%
Bronze
23
2%
India
6
0.5%
Silver
2
0.2
Bronze
4
0.4
Iran
121%
Gold
4
0.4%
Silver
50.4%
Bronze
3
0.3
Japan
38 3%
Gold
7
0.6
Silver
14
1%
Bronze
17 2%
Kazakhstan
13
1%
Gold
7
0.6%
Silver
1 0.1
Bronze
5
0.4
North
Korea
6
0.5%
Gold
4
0.4%
Bronze
20.2
South Korea
28
3%
Gold
13
1%
Silver
8
0.7
Bronze
7
0.6%
Europe
450
47%
Other
Countries
111
9%
Belarus
12
1% Gold
2
0.2%
Silver
5
0.4%
Bronze
5
0.4%
France
34
3%Gold
11
0.9%
Silver
11
0.9%
Bronze
12
1%
Germany
44 4%
Gold
11
0.9%
Silver
19 2%
Bronze
14
1%
Great
Britain
65
5%
Gold
29
2%
Silver
17
1%
Bronze
19
2% Hungry
17
1%
Gold
8
0.7
Silver
4
0.3%
Bronze
5
0.4%
Italy
28
2%
Gold
8
0.7%
Silver
9
0.8%
Bronze
11
0.9%
Netherlands
20
2%
Gold
6
0.5%
Silver
6
0.5%
Bronze
8
0.7
Russia
82
7%
Gold
24
2%
Silver
26 2%
Bronze
32
3%
Spain
171%
Gold
3
0.3
Silver
100.8
Bronze
4
0.3%
Ukraine
20
2%
Gold
6
0.5
Silver
5
0.4%
Bronze
9
0.8%
North
America
165
17%
Other
Countries
10
1%
Canada
18
2%
Gold
1
0.1
Silver
5
0.5%
Bronze
12
1%
Cuba
14
1%
Gold
5
0.5%
Silver
3
0.3%
Bronze
6
0.6%
Jamaica
12
1%
Gold
4
0.4
Silver
4
0.4%
Bronze
4
0.4%
Mexico
7
0.7%
Gold
1
0.1%
Silver
3
0.3
Bronze
3
0.3%
USA
104
10%
Gold
46
5%
Silver
29
3%
Bronze
29
3%
Oceania
48
5%
Australia
35
4%
Gold
7
0.7%
Silver
16
2%
Bronze
12
1%
New
Zealand
13
1%
Gold
6
0.6
Silver
2
0.2%
Bronze
5
0.5%
South
America
31
3% Argentina
4
0.4%
Gold
10.1%
Silver
1
0.1
Bronze
2
0.2%
Brazil
17
2%
Gold
3
0.3%
Silver
5
0.5
Bronze
9
0.9%
Colombia
8
0.8%
Gold
1
0.1%
Silver
3
0.3%
Bronze
4
0.4%
Guatemala
1
0.1%
Venezuela
1 0.1
We integrated Tableau Software with Liferay
portal, making it possible to display Tableau
diagrams and reports on the Portal. As a result,
we released a data analysis web site with
elements of responsive design. Tableau BI
integration and authentication mapping were
delivered as a part of solution as well.
Greenberg Quinlan Rosner Research
We designed and implemented a robust
Compass Portal platform solution based on IBM
WebSphere Portal for Advisory Board company.
The portal delivers Business Intelligence
applications based on MicroStrategy BI
Platform as a set of related reports, scorecards,
and documents.
	
  
The Advisory Board Company
The Safety Measurement System solution
consists of data management processes, data
integration and analytical platform, transforming
Metro data into management supporting info:
Dashboards, Balanced Scorecards, and
Analytical Reports – to manage Metro’s
efficiency, service, and public safety.
Washington Metropolitan Area Transit Authority
•  Thousands of users around the globe enjoy working on our solutions.
•  We are your asset in unique projects that require successful business result.
•  We have comprehensive expertize in solving a wide range of business problems
using technology.
•  We are ready for presale activities, providing analytics, development and project
estimates.
We develop solutions that work
www.eastbanctech.com

EastBanc Technologies Data Visualization/BI Portfolio

  • 1.
  • 2.
  • 3.
    Predictive healthcare dataanalysis is based on proprietary algorithms and metrics derived from scientific research in medical field. We implemented a BI dashboard and a set of supplemental reports and graphs to visualize critical data about patients’ health conditions and trends in the hospital. This helps evaluate a hospital performance and identify issue-causing areas for better decision-making.   PeraHealth Analytics
  • 4.
    Based on real-timebuses locations and delays, TRANSITiQ BI calculates immediate status including different data metrics: reporting/non- reporting buses, bus grouping by delays and overall score, etc. It visualizes overall agency score history during selected period of time allowing to dive into the data to reveal a particular bus (route) movement history on a map and track its reporting status. TRANSITiQ
  • 5.
    Apiphany helps organizationspromote, manage, scale and analyze their API’s in the Cloud. It enables data-rich organizations to engage internal and external developers who create new, innovative digital distribution channels for data, content and unique business logic. Analytics module displays various aspects of API usage and system performance. Apiphany API Management Platform
  • 6.
    We developed aninteractive visualization tool for Brookings’ extensive analysis of transit routes and schedules, demographic data and employment information from the nation’s 100 largest metro regions. It visualizes how well the transit system serves cities and suburbs with different income neighborhoods, and transit effectiveness for people’s daily commute and jobs accessibility within metro areas. Brookings Institution
  • 7.
    Galaxy Charts tooladvances data visualization allowing an easy and effective display of any multilevel quantitative data in a single hierarchical structure. Galaxy Charts clearly illustrate proportions, magnitude, and relationship between individual data elements using circles and straight lines.   Technomics Galaxy Charts Countries  with  less  than  2.5%  of  Continent’s  total  grouped  into  Other  Countries Source: http://www.london2012.com/medals/medal-count/ © 2012 Technomics, Inc. Summer Olympic Medal Count 962 Africa 30 3% Botswana 1 0.1 Egypt 2 0.2% Ethiopia 7 0.8% Gold 3 0.3 Silver 1 0.1% Bronze 3 0.3% Gabon 1 0.1% Kenya 11 1% Gold 2 0.2 Silver 4 0.5 Bronze 5 0.6 Morocco 1 0.1 South Africa 3 0.3% Gold 3 0.2 Silver 2 0.1 Bronze 1 0.1 Uganda 1 0.1% Asia 238 25% Other Countries 37 3% Azerbaijan 10 0.9% Gold 2 0.2 Silver 2 0.2% Bronze 6 0.5 China 88 8% Gold 38 3% Silver 27 2% Bronze 23 2% India 6 0.5% Silver 2 0.2 Bronze 4 0.4 Iran 121% Gold 4 0.4% Silver 50.4% Bronze 3 0.3 Japan 38 3% Gold 7 0.6 Silver 14 1% Bronze 17 2% Kazakhstan 13 1% Gold 7 0.6% Silver 1 0.1 Bronze 5 0.4 North Korea 6 0.5% Gold 4 0.4% Bronze 20.2 South Korea 28 3% Gold 13 1% Silver 8 0.7 Bronze 7 0.6% Europe 450 47% Other Countries 111 9% Belarus 12 1% Gold 2 0.2% Silver 5 0.4% Bronze 5 0.4% France 34 3%Gold 11 0.9% Silver 11 0.9% Bronze 12 1% Germany 44 4% Gold 11 0.9% Silver 19 2% Bronze 14 1% Great Britain 65 5% Gold 29 2% Silver 17 1% Bronze 19 2% Hungry 17 1% Gold 8 0.7 Silver 4 0.3% Bronze 5 0.4% Italy 28 2% Gold 8 0.7% Silver 9 0.8% Bronze 11 0.9% Netherlands 20 2% Gold 6 0.5% Silver 6 0.5% Bronze 8 0.7 Russia 82 7% Gold 24 2% Silver 26 2% Bronze 32 3% Spain 171% Gold 3 0.3 Silver 100.8 Bronze 4 0.3% Ukraine 20 2% Gold 6 0.5 Silver 5 0.4% Bronze 9 0.8% North America 165 17% Other Countries 10 1% Canada 18 2% Gold 1 0.1 Silver 5 0.5% Bronze 12 1% Cuba 14 1% Gold 5 0.5% Silver 3 0.3% Bronze 6 0.6% Jamaica 12 1% Gold 4 0.4 Silver 4 0.4% Bronze 4 0.4% Mexico 7 0.7% Gold 1 0.1% Silver 3 0.3 Bronze 3 0.3% USA 104 10% Gold 46 5% Silver 29 3% Bronze 29 3% Oceania 48 5% Australia 35 4% Gold 7 0.7% Silver 16 2% Bronze 12 1% New Zealand 13 1% Gold 6 0.6 Silver 2 0.2% Bronze 5 0.5% South America 31 3% Argentina 4 0.4% Gold 10.1% Silver 1 0.1 Bronze 2 0.2% Brazil 17 2% Gold 3 0.3% Silver 5 0.5 Bronze 9 0.9% Colombia 8 0.8% Gold 1 0.1% Silver 3 0.3% Bronze 4 0.4% Guatemala 1 0.1% Venezuela 1 0.1
  • 8.
    We integrated TableauSoftware with Liferay portal, making it possible to display Tableau diagrams and reports on the Portal. As a result, we released a data analysis web site with elements of responsive design. Tableau BI integration and authentication mapping were delivered as a part of solution as well. Greenberg Quinlan Rosner Research
  • 9.
    We designed andimplemented a robust Compass Portal platform solution based on IBM WebSphere Portal for Advisory Board company. The portal delivers Business Intelligence applications based on MicroStrategy BI Platform as a set of related reports, scorecards, and documents.   The Advisory Board Company
  • 10.
    The Safety MeasurementSystem solution consists of data management processes, data integration and analytical platform, transforming Metro data into management supporting info: Dashboards, Balanced Scorecards, and Analytical Reports – to manage Metro’s efficiency, service, and public safety. Washington Metropolitan Area Transit Authority
  • 11.
    •  Thousands ofusers around the globe enjoy working on our solutions. •  We are your asset in unique projects that require successful business result. •  We have comprehensive expertize in solving a wide range of business problems using technology. •  We are ready for presale activities, providing analytics, development and project estimates. We develop solutions that work www.eastbanctech.com