EBSD tips presentation text only - Techniques, hints and tips.ppt
1.
The Business ofScience®
Oxford Instruments
Techniques, hints and tips for
maximizing EBSD data quality
Oxford Instruments
2.
The Business ofScience®
Oxford Instruments
Agenda
• Pre-SEM setup
Assessing prep quality
Placement in holder, sample orientation
Charging prevention
• SEM stage setup
Minimizing drift, choosing a working distance
• The speed / precision balance
• Setting SEM conditions
kV, probe current
• Setting up the EBSD system
Camera settings
Acquisition software settings: Bands, reflectors, Hough
Phase ID strategies
Mapping strategies
Oxford Instruments
3.
The Business ofScience®
Oxford Instruments
• Sample preparation critical to data quality
• Intrinsic strain and prep-introduced damage difficult to
distinguish
Prep-induced damage is strain
- Although, usually cold work
- Little recovery, except in some cases
Effect on EBSD: Cold-worked vs. recovered
- Cold worked: Imperfect crystal lattice = fuzzy EBSPs
- Recovered defect microstructure: Lattice orientation change
within grains = EBSP rotation
Recovered defect microstructure usually not due to sample
preparation
- Except in certain materials with relatively high room-
temperature diffusion rates
Pre-SEM set-up: Assessing prep quality
4.
The Business ofScience®
Oxford Instruments
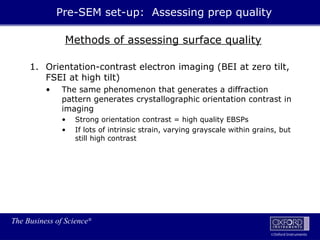
Methods of assessing surface quality
1. Orientation-contrast electron imaging (BEI at zero tilt,
FSEI at high tilt)
• The same phenomenon that generates a diffraction
pattern generates crystallographic orientation contrast in
imaging
Pre-SEM set-up: Assessing prep quality
5.
The Business ofScience®
Oxford Instruments
Methods of assessing surface quality
1. Orientation-contrast electron imaging (BEI at zero tilt,
FSEI at high tilt)
• The same phenomenon that generates a diffraction
pattern generates crystallographic orientation contrast in
imaging
• Strong orientation contrast = high quality EBSPs
• If lots of intrinsic strain, varying grayscale within grains, but
still high contrast
Pre-SEM set-up: Assessing prep quality
6.
The Business ofScience®
Oxford Instruments
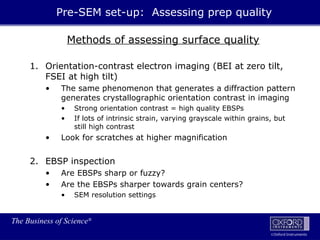
Methods of assessing surface quality
1. Orientation-contrast electron imaging (BEI at zero tilt,
FSEI at high tilt)
• The same phenomenon that generates a diffraction pattern
generates crystallographic orientation contrast in imaging
• Strong orientation contrast = high quality EBSPs
• If lots of intrinsic strain, varying grayscale within grains, but
still high contrast
• Look for scratches at higher magnification
2. EBSP inspection
• Are EBSPs sharp or fuzzy?
• Are the EBSPs sharper towards grain centers?
• SEM resolution settings
Pre-SEM set-up: Assessing prep quality
7.
The Business ofScience®
Oxford Instruments
Methods of assessing surface quality
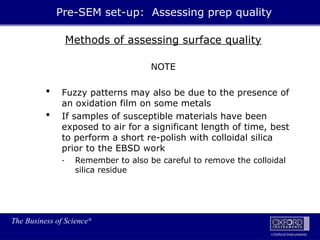
NOTE
Fuzzy patterns may also be due to the presence of
an oxidation film on some metals
If samples of susceptible materials have been
exposed to air for a significant length of time, best
to perform a short re-polish with colloidal silica
prior to the EBSD work
- Remember to also be careful to remove the colloidal
silica residue
Pre-SEM set-up: Assessing prep quality
8.
The Business ofScience®
Oxford Instruments
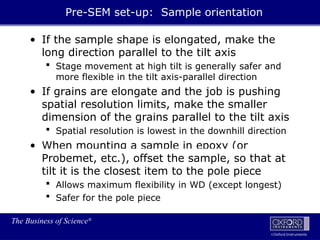
• If the sample shape is elongated, make the
long direction parallel to the tilt axis
Stage movement at high tilt is generally safer and
more flexible in the tilt axis-parallel direction
• If grains are elongate and the job is pushing
spatial resolution limits, make the smaller
dimension of the grains parallel to the tilt axis
Spatial resolution is lowest in the downhill direction
• When mounting a sample in epoxy (or
Probemet, etc.), offset the sample, so that at
tilt it is the closest item to the pole piece
Allows maximum flexibility in WD (except longest)
Safer for the pole piece
Pre-SEM set-up: Sample orientation
9.
The Business ofScience®
Oxford Instruments
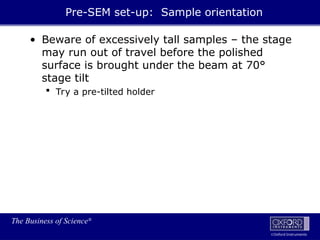
Pre-SEM set-up: Sample orientation
• Beware of excessively tall samples – the stage
may run out of travel before the polished
surface is brought under the beam at 70°
stage tilt
Try a pre-tilted holder
10.
The Business ofScience®
Oxford Instruments
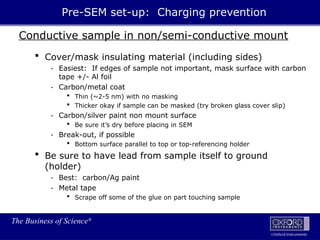
Conductive sample in non/semi-conductive mount
Cover/mask insulating material (including sides)
- Easiest: If edges of sample not important, mask surface with carbon
tape +/- Al foil
- Carbon/metal coat
Thin (~2-5 nm) with no masking
Thicker okay if sample can be masked (try broken glass cover slip)
- Carbon/silver paint non mount surface
Be sure it’s dry before placing in SEM
- Break-out, if possible
Bottom surface parallel to top or top-referencing holder
Be sure to have lead from sample itself to ground
(holder)
- Best: carbon/Ag paint
- Metal tape
Scrape off some of the glue on part touching sample
Pre-SEM set-up: Charging prevention
11.
The Business ofScience®
Oxford Instruments
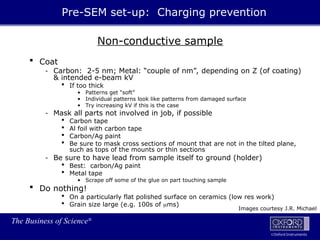
Non-conductive sample
Coat
- Carbon: 2-5 nm; Metal: “couple of nm”, depending on Z (of coating)
& intended e-beam kV
If too thick
• Patterns get “soft”
• Individual patterns look like patterns from damaged surface
• Try increasing kV if this is the case
- Mask all parts not involved in job, if possible
Carbon tape
Al foil with carbon tape
Carbon/Ag paint
Be sure to mask cross sections of mount that are not in the tilted plane,
such as tops of the mounts or thin sections
- Be sure to have lead from sample itself to ground (holder)
Best: carbon/Ag paint
Metal tape
• Scrape off some of the glue on part touching sample
Do nothing!
On a particularly flat polished surface on ceramics (low res work)
Grain size large (e.g. 100s of ms)
Pre-SEM set-up: Charging prevention
Images courtesy J.R. Michael
12.
The Business ofScience®
Oxford Instruments
Non-conductive sample (cont’d)
Miscellaneous tricks:
- Try lowering kV and probe current if charging remains an issue
- On samples with cracks/topographic grain boundaries (such as
geologic materials), try gold coating before final polishing step
Makes conductive network in cracks
- Tilt sample before turning beam on
Pre-SEM set-up: Charging prevention
13.
The Business ofScience®
Oxford Instruments
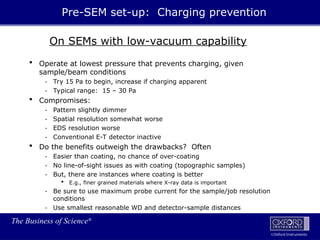
On SEMs with low-vacuum capability
Operate at lowest pressure that prevents charging, given
sample/beam conditions
- Try 15 Pa to begin, increase if charging apparent
- Typical range: 15 – 30 Pa
Compromises:
- Pattern slightly dimmer
- Spatial resolution somewhat worse
- EDS resolution worse
- Conventional E-T detector inactive
Do the benefits outweigh the drawbacks? Often
- Easier than coating, no chance of over-coating
- No line-of-sight issues as with coating (topographic samples)
- But, there are instances where coating is better
E.g., finer grained materials where X-ray data is important
- Be sure to use maximum probe current for the sample/job resolution
conditions
- Use smallest reasonable WD and detector-sample distances
Pre-SEM set-up: Charging prevention
14.
The Business ofScience®
Oxford Instruments
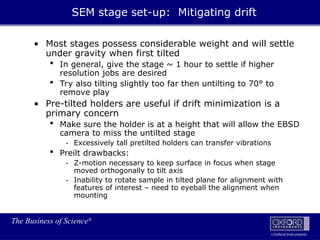
• Most stages possess considerable weight and will settle
under gravity when first tilted
In general, give the stage ~ 1 hour to settle if higher
resolution jobs are desired
Try also tilting slightly too far then untilting to 70° to
remove play
• Pre-tilted holders are useful if drift minimization is a
primary concern
Make sure the holder is at a height that will allow the EBSD
camera to miss the untilted stage
- Excessively tall pretilted holders can transfer vibrations
Preilt drawbacks:
- Z-motion necessary to keep surface in focus when stage
moved orthogonally to tilt axis
- Inability to rotate sample in tilted plane for alignment with
features of interest – need to eyeball the alignment when
mounting
SEM stage set-up: Mitigating drift
15.
The Business ofScience®
Oxford Instruments
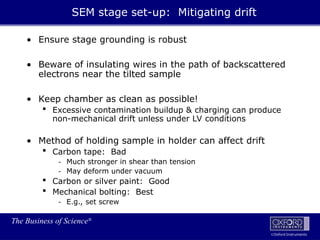
• Ensure stage grounding is robust
• Beware of insulating wires in the path of backscattered
electrons near the tilted sample
• Keep chamber as clean as possible!
Excessive contamination buildup & charging can produce
non-mechanical drift unless under LV conditions
• Method of holding sample in holder can affect drift
Carbon tape: Bad
- Much stronger in shear than tension
- May deform under vacuum
Carbon or silver paint: Good
Mechanical bolting: Best
- E.g., set screw
SEM stage set-up: Mitigating drift
16.
The Business ofScience®
Oxford Instruments
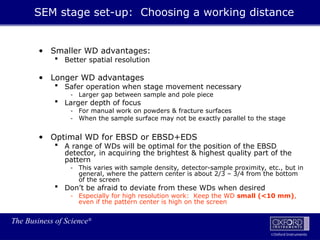
• Smaller WD advantages:
Better spatial resolution
• Longer WD advantages
Safer operation when stage movement necessary
- Larger gap between sample and pole piece
Larger depth of focus
- For manual work on powders & fracture surfaces
- When the sample surface may not be exactly parallel to the stage
• Optimal WD for EBSD or EBSD+EDS
A range of WDs will be optimal for the position of the EBSD
detector, in acquiring the brightest & highest quality part of the
pattern
- This varies with sample density, detector-sample proximity, etc., but in
general, where the pattern center is about 2/3 – 3/4 from the bottom
of the screen
Don’t be afraid to deviate from these WDs when desired
- Especially for high resolution work: Keep the WD small (<10 mm),
even if the pattern center is high on the screen
SEM stage set-up: Choosing a working distance
17.
The Business ofScience®
Oxford Instruments
• Speed vs. precision is probably the primary consideration in
setting up the EBSD system for a job
Higher speed: More data collected in session time available
- Smaller step size for better map resolution in a given area
- Larger area of sample covered
Higher precision: Orientations more precise!
- Often better phase discrimination
- Higher accuracy/precision grain boundary characterization
- Better resolution of substructure (less orientation “noise”)
• Generally, the analyst decides on what the goals for the job
are vs. the time available in the EBSD session
The EBSD settings should reflect these goals and efficiently fill out
the session time
- Often, single-setting standard procedures are inefficient
- Test maps are important for new materials and/or job goals
• Sometimes, the requirements are not obvious
E.g., for jobs that require extreme resolution (<20 nm step size),
the analyst needs to keep the probe current relatively high for fast
acquisition rates when drift is a factor
Speed / precision balance
18.
The Business ofScience®
Oxford Instruments
Many SEM & EBSD settings affect the speed / precision balance:
• SEM
kV
Probe current
• EBSD system
Band detection
Reflectors
Hough settings
Camera binning
Frame averaging
These should all be considered when preparing to collect EBSD
data
• Don’t be intimidated! You’ll find settings that work well for a particular sample/job and
be able to re-use with minimal preparation
• Some settings are insensitive beyond certain limits, i.e., you won’t need to explore lots
of range for each setting, probably just a couple when working with a new sample or
job type
Speed / precision balance
19.
The Business ofScience®
Oxford Instruments
• Higher kV advantages:
Higher electron yield from gun
More efficient scintillation effect on phosphor screen
Crisper/more well defined patterns
Brighter & narrower bands may be easier detect
• Lower kV advantages
Better spatial resolution
Sample may charge/damage less readily
For phase identification, broader bands will more clearly show subtle crystallographic differences
between candidate phases
• Typical settings:
Range: 10 - 30kV
Blind setting: 20kV
Large grained sample: 30kV
High resolution needed: 10kV
- Except for single grain-thick thin films with ~amorphous substrate, then go with high kV
Setting SEM conditions: kV
20.
The Business ofScience®
Oxford Instruments
• Higher Pc advantages:
Faster acquisition
- Shorter necessary camera exposure time
- May be important when drift is a factor
Higher precision acquisition
- Higher quality camera settings possible while maintaining reasonable cycle
time
Higher X-ray yield
• Lower Pc advantages (via condenser/aperture controls)
Better spatial resolution
Better depth of focus
Less charging & sample damage, if applicable
• General strategy & typical settings:
Essential strategy: Use as high a probe current as possible while
maintaining the spatial resolution required for the sample
(grain/crystallite size)
Range: 0.5 to 25+ nA
Large grained sample: As much as possible, within reason (e.g, don’t
flood the EDS if simultaneous EBSD+EDS is desired)
Fine grained sample: ~~2 nA
- But, try using reduced WD and kV first at a higher probe current
SEM set-up strategy: Probe current (Pc)
21.
The Business ofScience®
Oxford Instruments
• EBSD cameras use CCD chips comprised of light
sensitive pixels in an ~1000 X 1300 array
• “Superpixels”: Group of pixels that are effectively used
as a single pixel
• Using superpixels through binning allows more light to
be captured, at the expense of image resolution
E.g., 4X4 binning yields a 4X brighter image (->
lower CCD exposure time) than 2X2, but the image
is 4X more pixilated
Setting up the EBSD system: CCD binning
22.
The Business ofScience®
Oxford Instruments
• Advantages of higher CCD binning:
Brighter pattern
- Shorter exposure time (-> faster data acquisition)
Smaller image size from CCD, quicker to process
• Advantage of lower CCD binning:
Less pixilated pattern
- Higher precision indexing
- Better differentiation of different orientations and different
phases
- Nicer-looking pattern (e.g, for publication)
- Generally better indexing of difficult-to-index materials
• General strategy
8X8 binning: Highest speed for higher symmetry phases
4X4 binning: General “happy compromise” setting
2X2 binning: Best for Phase ID or for highest precision indexing
Note: For fast cameras, divide binnings listed here by 2
Setting up the EBSD system: CCD binning
23.
The Business ofScience®
Oxford Instruments
Remember
If the job/sample allows, use more
probe current before compromising
EBSD system settings
Setting up the EBSD system: CCD binning
24.
The Business ofScience®
Oxford Instruments
Advantages of high Hough resolution:
- Higher precision orientation determination
- May increase number of successfully indexed
points
- May improve phase discrimination
- Better performance on lower symmetry phases
Advantages of low Hough resolution
- Higher indexing speed
Typical settings (Channel):
- 60-70 for low symmetry materials, and where
precision is more important
- 50-60 for most jobs
- 40-50 for high speed jobs on cubic materials
Setting up the EBSD system: Hough Resolution
25.
The Business ofScience®
Oxford Instruments
Advantages of a higher number of detected bands
- Less chance for mis-indexing, if pattern quality good
(bands all correctly detected)
- Less chance for pseudo-symmetric indexing
- Better indexing on lower symmetry materials
- BUT: Too many bands can lead to reduced hit rate
Advantages of fewer detected bands
- Higher overall hit rate
- Faster indexing
- BUT: Too few detected bands can lead to mis-indexing
The number of bands should be tailored to the
material
Common settings (Channel):
- 5 max for single phase cubic metals
- 6 to 8 max for multi-phase materials in general
- 7 to 8 for low symmetry phases
Setting up the EBSD system: Number of detected bands
26.
The Business ofScience®
Oxford Instruments
The number of reflectors should be customized to suit
the phase(s) being indexed
Basic strategy: The simulated EBSP should contain
all bands that will be detected in the actual EBSP, not
more or fewer
- Too many: Greater chance for mis-indexing
- Too few: Reduced hit rate
In general, one can use default values for at least
reasonably good performance, e.g.:
- 50 is a good starting number
- 25-32 for FCC, BCC metals
- 50-75 for lower symmetry materials
The number can be correctly customized by looking at
the simulated pattern. Determine the minimum
number of reflectors that captures all bands in the
actual EBSP likely to be detected
Setting up the EBSD system: Number of reflectors
27.
The Business ofScience®
Oxford Instruments
Advantages of a larger number averaged frames
- Higher quality EBSPs
- Better indexing on difficult-to-index phases
Advantages of fewer averaged frames
- Higher indexing speed
In general, use the minimum amount of frame averaging that
still yields high quality data
- Use small test runs to determine this
The Hough transform allows robust band detection even in seemingly
noisy patterns, so try 1 or 2 frames first
- Remember, saved patterns will be only as high quality as the
pattern quality settings allow, thus will affect re-indexing
Common settings:
- Phase ID
As many as necessary to reach high quality “plateau”, usually 6+
- Mapping
High symmetry materials with high quality patterns, 1-2 frames
Normal starting setting: 2-3 frames
For highest quality indexing, 3+ frames
Setting up the EBSD system: Frame averaging
28.
The Business ofScience®
Oxford Instruments
Area of EBSP Hough transformed
- Normally, most of the phosphor screen will contain pattern of
reasonable contrast unless the detector is particularly close to
the sample
- Be sure to set the area transformed to match the area of the
EBSP with reasonable contrast
The farther apart detected bands are in diffraction space, the
higher quality and precision the indexing
Number of phases
- In general, the more phases, the slower the indexing process
- Consider indexing some of the phases offline on saved EBSPs, if
the sample contains many phases
Indexing can be customized to best settings for those particular
phases
Pattern saving
- Slight hit on cycle time but usually worth the bother
Simultaneous EDX collection
- Generally, need 100-300ms per point minimum for quality EDX
data (SiLi…SDDs need less dwell time)
- If perform simultaneous collection, be sure change the EBSD
indexing settings to highest accuracy that fits within the EDX
time delay
Setting up the EBSD system: Other
29.
The Business ofScience®
Oxford Instruments
• Use high quality/precision conditions
Speed is totally unimportant here
Suggested settings (Channel settings in parentheses):
- Low binning (2X2, low gain)
- Lots of probe current, if grain not too small
- Lots of frame averaging (5+)
- High Hough resolution (70+)
- High number of detected bands, to fit pattern quality (7+)
- Maximize the area of diffraction space captured
(Maximize Area Of Interest)
(Set detector position to fill screen with high quality pattern)
- (Use “Advanced Fit”, level 4)
• Don’t be afraid to load up match unit list; Flamenco is
good at phase discrimination
General strategies: Phase Identification
30.
The Business ofScience®
Oxford Instruments
Each new type of material or job goal will have optimal
settings, especially in tuning the speed / precision balance
In this case, try running small test jobs before the main job, to
determine the best run parameters
- Play primarily with the following settings:
Frame averaging
# of bands detected
# of reflectors
Hough resolution
AOI (area involved in Hough Transform)
- Try making adjustments on the fly, and noting the effect on indexing quality
and speed
- This process usually takes a few minutes to half an hour for particularly
challenging samples
- (Channel) Settings will be saved in current profile, so the optimal settings
will be ready the next time you run a similar job
Once optimal settings are established, note cycle time
- This will allow the actual run design to make most efficient use of
session time available
General strategies: Mapping


![5G Explained! A High Level Overview [Introduction]](https://cdn.slidesharecdn.com/ss_thumbnails/5gexplainedahighleveloverview-260119165306-cc137a3e-thumbnail.jpg?width=640&height=640&fit=bounds)


