Downloaded 24 times

![Israel Natural Gas Demand Growth
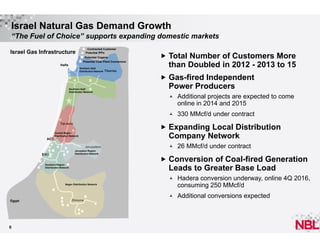
17% CAGR for 2013 - 2018
Israel Natural Gas Consumption
MMcf/d, gross
Historic
2,000
Demand Forecast
1,500
Unmet Demand
Extra Fuel Oil Burned
1,000
500
0
2004
2006
Power
2008
Other
2010
Industry
2012
2014
Coal Conversion [Hadera]
2016
2018
2020
2022
Potential Coal Conversion
Source: Poten and Partners, Israel Electric Corporation, Ministry of Energy and Water Resources, Noble Energy
Additional Domestic Market Opportunities
New desalination plant
Conversion to electric railroad system
7
Compressed Natural Gas for transportation
Methanol production](https://image.slidesharecdn.com/noble-131217124645-phpapp02/85/East-Med-Noble-pdf-9-320.jpg)
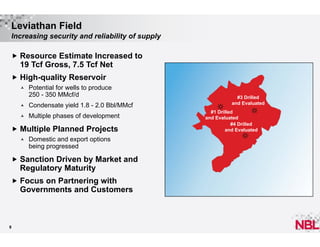
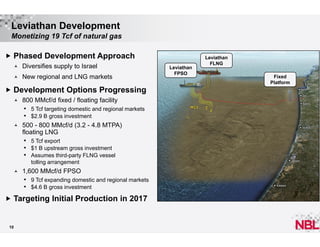
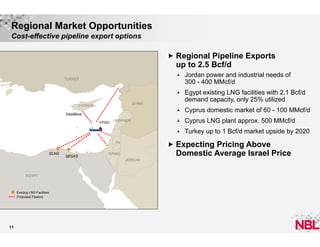
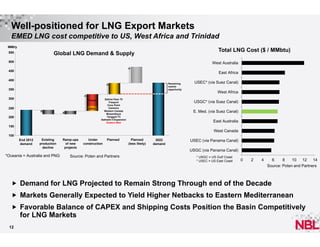
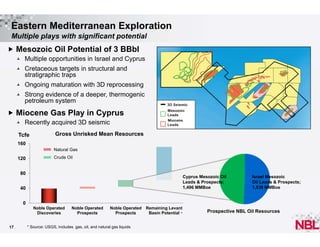


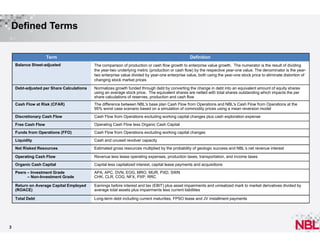

The document discusses Noble Energy's operations and discoveries in the Eastern Mediterranean region, including Israel and Cyprus. It provides resource estimates for fields such as Leviathan (19 Tcf), Tamar (10 Tcf), and Cyprus A-2 (5 Tcf). Demand for natural gas in Israel is growing at 17% annually to 2020 due to power generation, industry, and potential coal plant conversions. Noble is progressing development plans for fields like Leviathan and export opportunities to serve growing regional and LNG markets utilizing over 19 Tcf of identified export volumes.