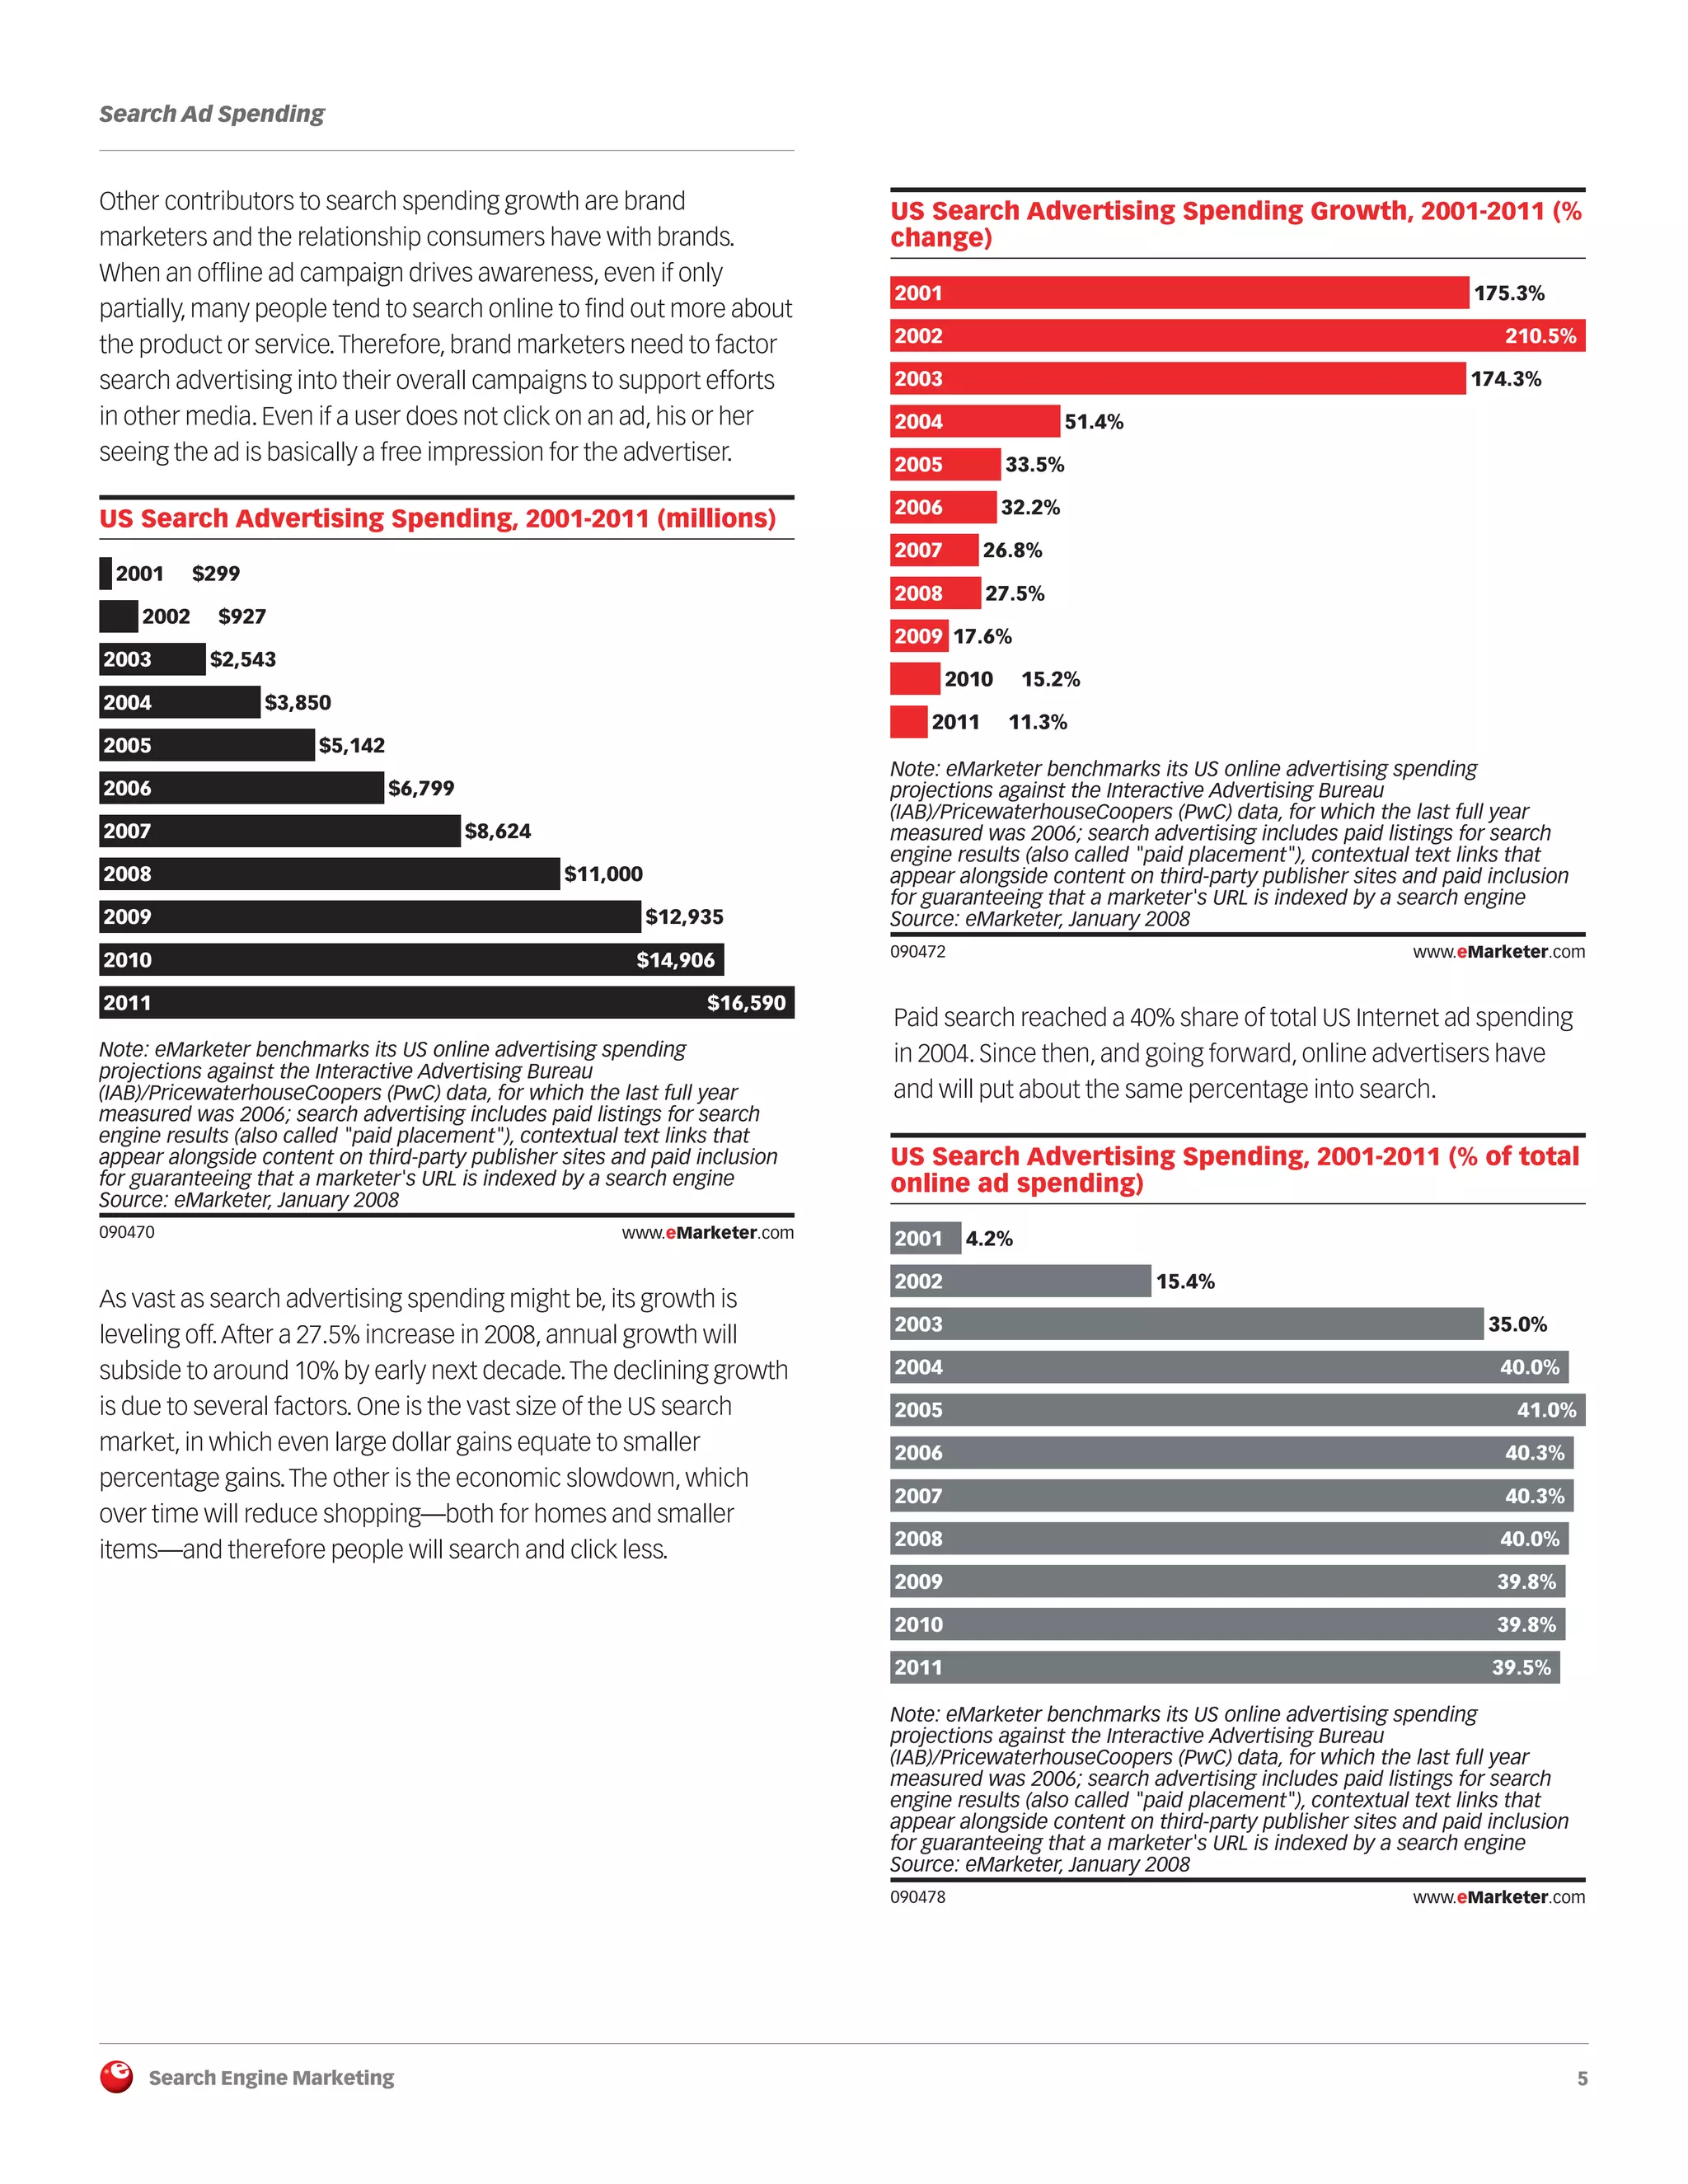
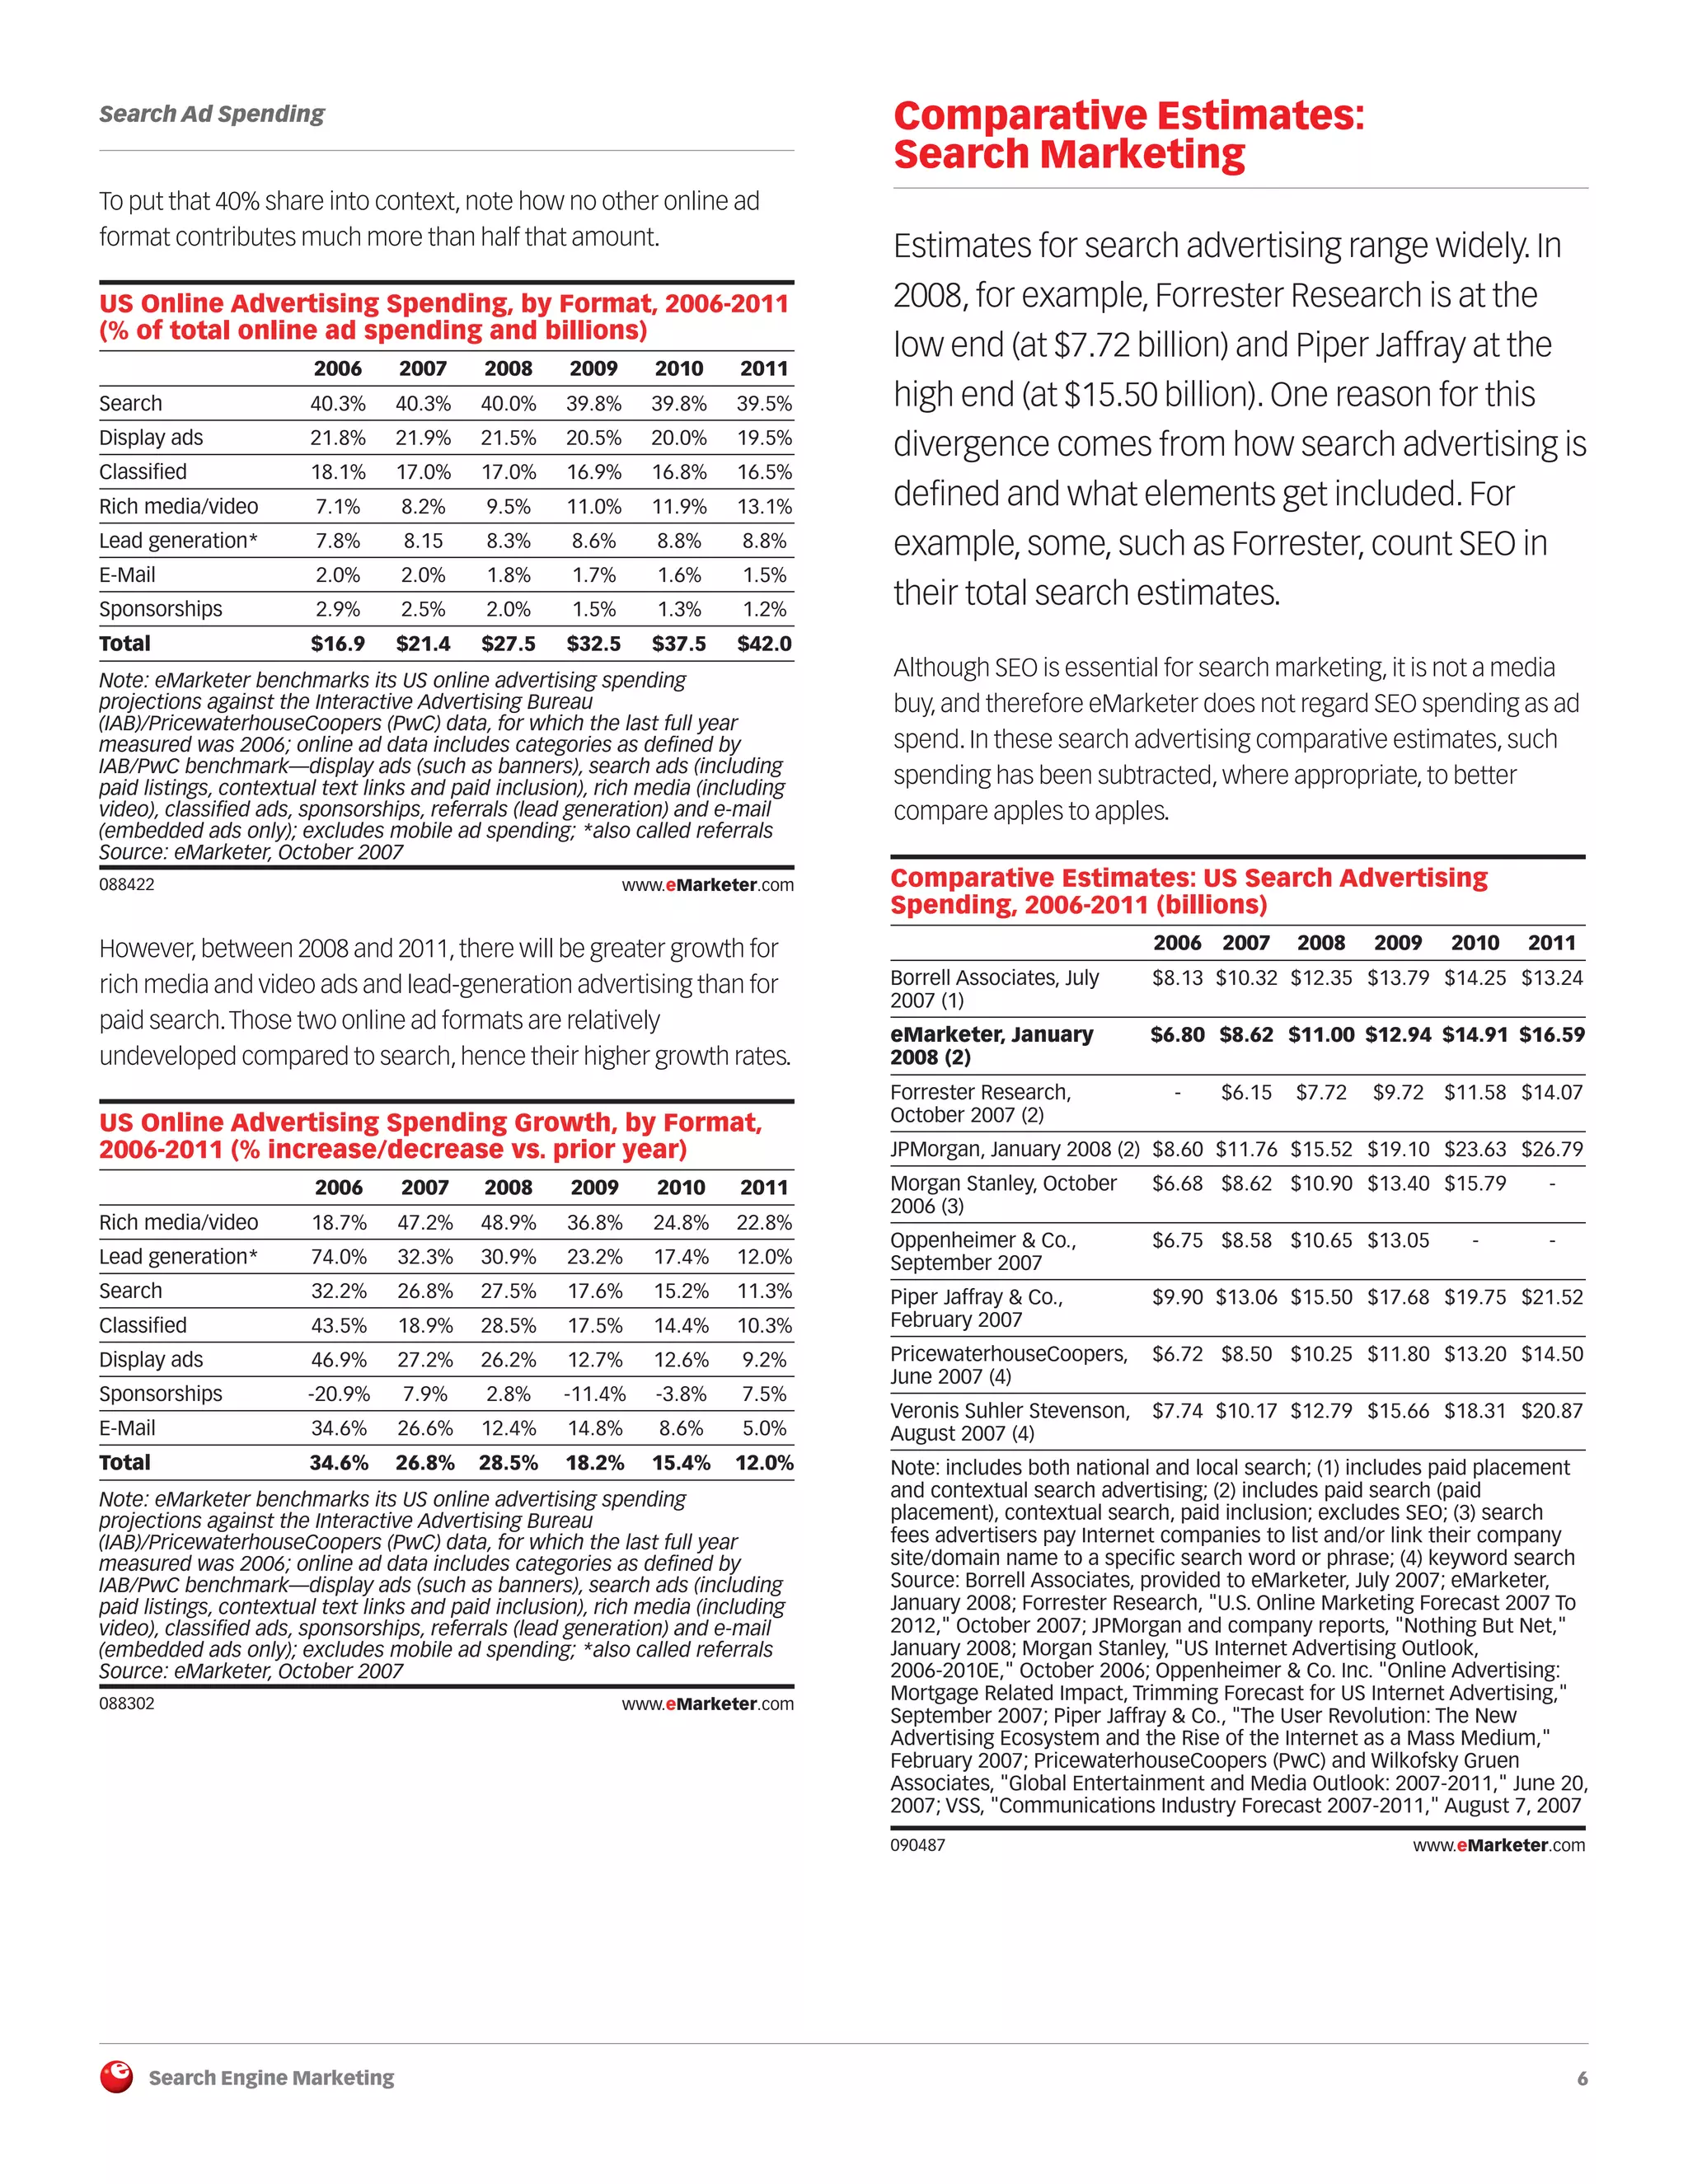
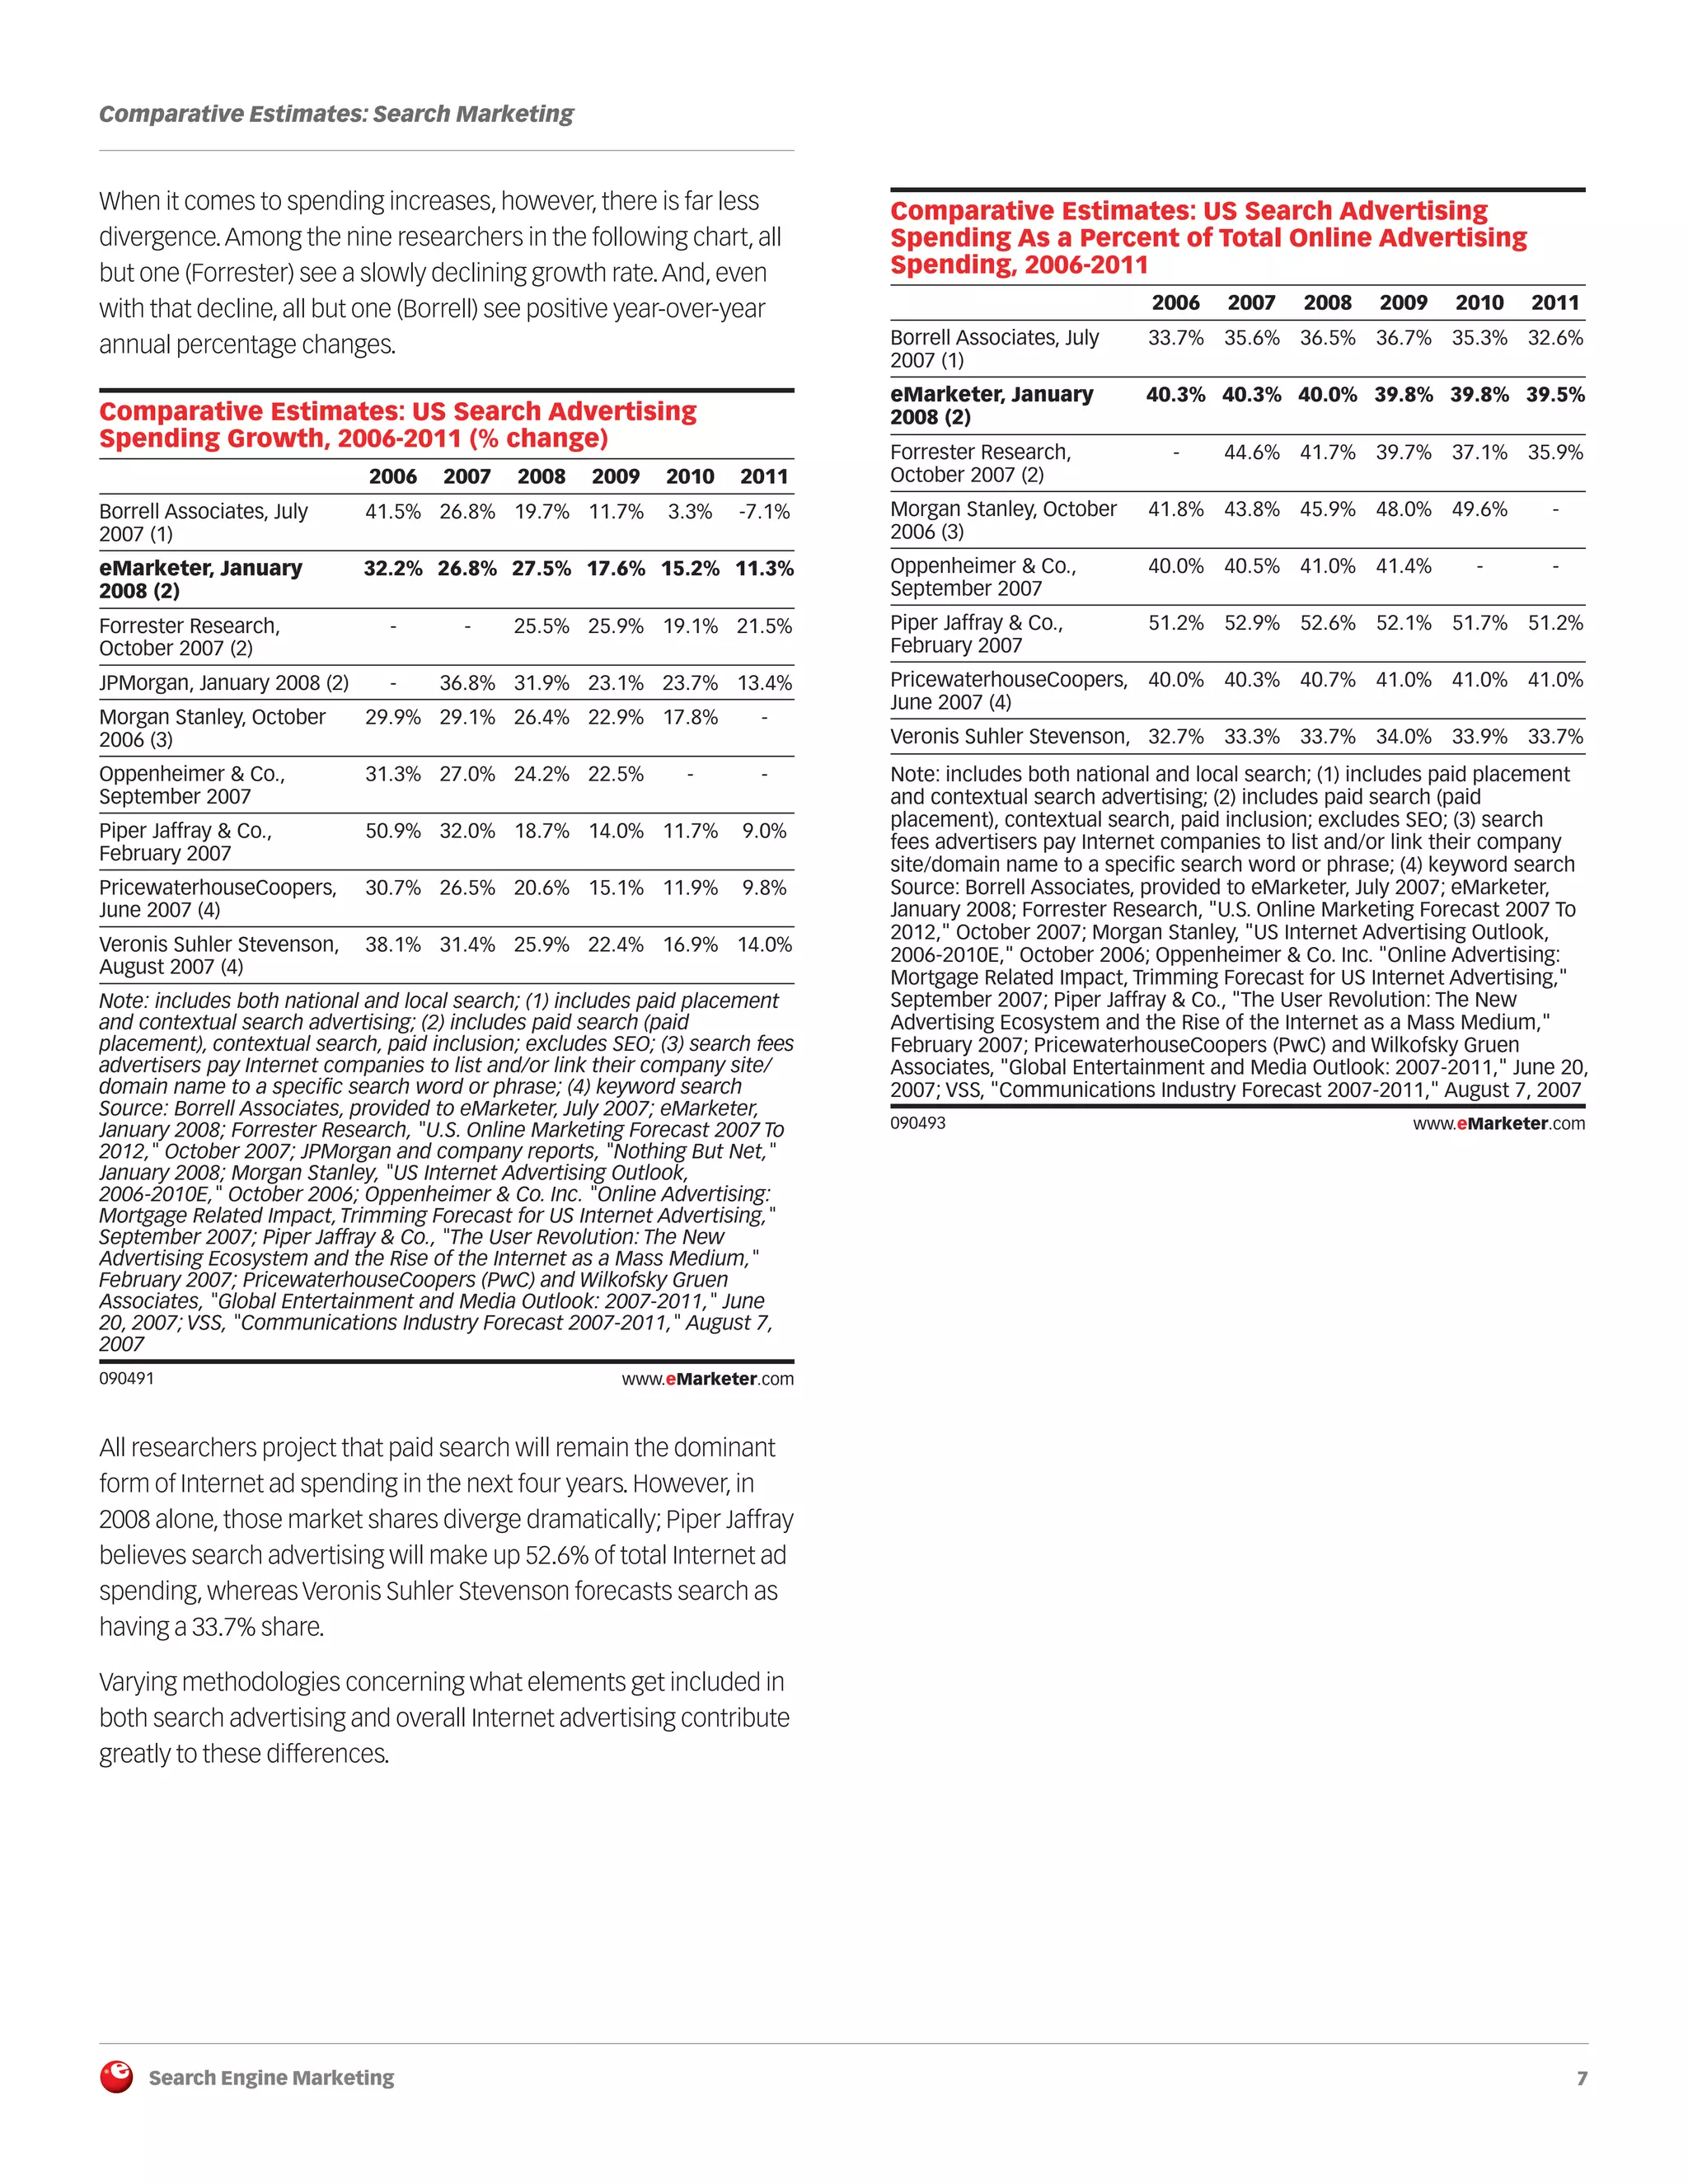
2. Search Engine Marketing 2
The eMarketer View
090505
The spectacular gains for US search advertising spending over 10
years, rising from less than $300 million in 2001 to almost $16.6
billion in 2011, represent a rare phenomenon in marketing—
namely, that of considerable customer satisfaction. Generally,
Internet users see paid search and contextual advertising as
sufficiently relevant and non-intrusive.That approval, or at least
tolerance, is why so many people click on these ads and why
advertisers increasingly spend to woo their clicks.
Search marketing is all about consumers.And where they go the
money follows.Search marketing can be likened to the Zen parable
about the tree falling in the forest:If no one hears it,does it make a
sound? In the same fashion,if a search engine serves up a text-link
ad and no one clicks on it,does it still make someone money?
The central position of the search audience in monetizing search
marketing means that the search engines and the advertisers
both rely on the user’s goodwill.
Another factor supporting search ad spending is
what happens after the click. Since advertisers can more
readily track the results of a search marketing campaign than one
using online display advertising, search can become self-
supporting, especially for retailers, with the cost of each click
translating to cost-plus-X dollars in sales.
Also contributing to search spending growth are brand marketers
and the relationship consumers have with brands.When an offline
ad campaign drives awareness,even if only partially,many people
tend to search online to find out more about the product or service.
Therefore,brand marketers need to factor search advertising into
their overall campaigns to support efforts in other media.
Besides advertising, the other side of search
marketing is search engine optimization (SEO), the
process of modifying a Web site so that it ranks higher in the
organic listings relative to relevant keywords. eMarketer estimates
that in 2007 paid search ads alone contributed 62% to all of search
engine marketing spending, with SEO spending contributing about
18% to the pie. By 2011, a greater focus on SEO will give it a nearly
23% share, while paid search spending will fall back to not quite
57% of the total.
Further, SEO tends to be less expensive than paid search.
Therefore, even small boosts in SEO spending relative to paid
search can indicate larger changes in marketing effectiveness
than might be indicated by dollars alone.
Behind that spending shift is the recognition that, even though
many people are willing to click on relevant paid search ads, they
prefer organic listings. One survey of online retailers found 46% of
respondents saying SEO performed best, compared with 37% who
preferred the performance of pay-per-click ads.
In addition,as brand advertisers increasingly make search a central
component of their online campaigns,the need to see those
brands with top natural rankings becomes ever more urgent.
What do people think about search engine results?
Surprisingly, it does not vary much depending on the degree of
search usage, according to a Forrester Research study. For
example, 59% of all respondents did not pay attention to paid
search ads. Further, 36% did not trust search engine ads.That
underscores the importance of increased SEO spending, which
spreads the marketing message through non-ad-based listings.
When viewed by the audience marketers look to
reach, the 40% share of total online advertising
dollars going to paid search can appear outlandish.
In fact, relative to the time people spend using search engines,
companies pour disproportionate sums into paid search ads
compared to display ads on content sites.
According to ongoing research from the Online Publishers
Association (OPA) and Nielsen//NetRatings, US Internet users in
2007 spent less than 5% of their online time using search versus
nearly 50% of their time on content sites.And yet paid search
advertisers spend $5.07 per hour of consumer search usage
compared with only 49 cents spent for display advertising relative
to each hour users spend on content sites.
Key eMarketer Numbers—Search Engine Marketing
$16.6 billion US search advertising spending in 2011, up from
$6.8 billion in 2006
11.3% US search advertising spending growth in 2011,
down from 32.2% in 2006
$21.5 billion US search engine marketing spending in 2011,
up from $8.2 billion in 2006
$4.9 billion US search engine optimization (SEO) spending in
2011, up from $1.4 billion in 2006
180.0 million US search engine users in 2011, up from 147.0
million in 2006
85.2% US search engine users as a percent of total
Internet users in 2011, up from 80.8% in 2006
Note: eMarketer benchmarks its US online advertising spending
projections against the Interactive Advertising Bureau (IAB)/
PricewaterhouseCoopers (PwC) data, for which the last full year
measured was 2006; search advertising includes paid listings for search
engine results (also called "paid placement"), contextual text links that
appear alongside content on third-party publisher sites and paid
inclusion for guaranteeing that a marketer's URL is indexed by a search
engine; search engine marketing includes both advertising and non-
advertising (non-media buy) components; the main search marketing
component is search engine optimization (SEO), which includes those
techniques used to create better placement in the natural, or organic,
search results; search engine users defined as ages 3+; based on usage
anytime during the year from all locations
Source: eMarketer, January 2008
3. Search Engine Marketing 3
The eMarketer View
Of course, when search is effective, people find what they need
and go away, and that greatly reduces the time spent on a site. But
when content is effective, people want to stick around.
Nevertheless, a 10-1 ratio between search and display dollars
points to the weight of Internet search engine users in contrast to
the brief time they spend searching.
Keeping the customer satisfied will keep the search
dollars flowing. Increasingly, consumer satisfaction with
search—and usage of the data created each time consumers
enter a search term—counts privacy as a valuable asset.The
“Digital Footprints” report, released in December 2007 by the Pew
Internet & American Life Project, showed that 39% of Internet
users expressed concern about how much information about
them was available online. However, only 21% of that segment
also took steps to limit the amount of information available.All
told, 57% of Pew respondents either had some worry about
personal data, took steps to limit what was available, or both.This
is the online population addressed by efforts such as Ask.com’s
AskEraser option.
Or, to view the same data another way, 60% of Internet users were
not worried about how much information was available about
them online, and a similar 61% did not bother to limit the amount
of information that could be found about them online.This is the
online population that might continue to be satisfied with Google
or Microsoft, both of which hold on to search data for months.
Still, data-privacy practices vary significantly at the five largest
search engine companies (as shown in the chart from CNET’s
News.com). Combine that with political concerns about how
search engines use consumer data—as raised in congressional
inquiries about the DoubleClick purchase—and AskEraser’s
consumer-privacy controls will be just the tip of the iceberg.
090739
Depending on who you ask, Americans conduct
between 50% (comScore) and 68% (Compete) of
their searches on Google, with figures from Hitwise and
Nielsen falling in between. Does Google’s dominance here imply
that marketers should follow the audience by placing most of their
paid search ad dollars on the search giant? Not necessarily so.
Google’s greater popularity among the search audience is
matched by its popularity among marketers.That causes most
search keywords to get, by auction, higher per-click prices than at
the other search engines.Therefore, just to be effective, a search
marketing campaign needs to consider how spreading its ad
budget among several search engines might give it greater reach
at the same time, or perhaps even at a lower cost.
Data Privacy Practices at the Five Largest Search
Engine Companies, December 2007 (% of
respondents)
Ask
AOL
Google
Microsoft
Yahoo!
Time
data
retained
Hours
13 months
18 months
18 months
13 months
Data
deleted
or
anonymized?
Deleted
Deleted
Partially
anonymized
Deleted
Partially
anonymized
User
info
linked?
No
No
No
Yes
Yes
Behavioral
targeting
(BT)?
No
Yes
No
Yes
Yes
Give
users
ability to
opt-out
of BT?
-
Yes
-
No*
No
Note: *can opt-out of behavioral targeting on third-party sites but not on
MSN.com
Source: CNET News.com as cited in press release, December 12, 2007
090739 www.eMarketer.com
4. Search Engine Marketing 4
The eMarketer View
The Four Elements of Search Marketing
The umbrella term “search engine marketing” covers four
related but distinct kinds of marketing.
Paid search advertising. These ads appear on search
engine results alongside natural, or organic, listings when
Internet users enter search queries.Typical paid search
ads are labeled “sponsored links” (Google) or “sponsor
results” (Yahoo!) or “sponsored sites” (MSN) or
“sponsored results” (Ask).This search format represents
the largest spending share of search engine marketing.
Contextual advertising. These ads appear alongside
related content on third-party publisher sites. Google is
the largest seller of these text-link ads with its AdSense
program.Yahoo! and MSN compete with their
ContentMatch and Content Ads programs, respectively,
while AOL’s recent purchase of Quigo puts it squarely in
the contextual-ad game, too. While not necessarily
initiated by search queries, contextual advertising is
typically tabulated as part of search engine marketing.
There are three key reasons for that. One, the vast
majority of contextual ads are sold by search engines;
two, these text-link ads are typically priced and placed by
advertiser bids; and, three, unless a user clicks on a
contextual ad, no money exchanges hands.
Paid inclusion. This search marketing procedure consists
of two main elements. One guarantees that a marketer’s
URL is indexed by a search engine.The listing is
determined by the engine’s search algorithms.The other,
as defined by Forrester Research, is “the amount spent on
submitting pages to paid directories (like Froogle or
Yahoo! Shopping) for cataloging.”
Search engine optimization (SEO). With this type of
marketing, companies and their search agencies use
various techniques to create better placement for their
Web site and specific pages in the natural, or organic,
search results.The best analogy to differentiate paid
search ads from SEO is the difference between a media
buy and public relations. And, as with most other forms of
advertising, a paid search ad can have immediate results,
while SEO typically takes months to bear fruit—if it even
does—just as with most PR campaigns.
Search Ad Spending
The gains for US search advertising spending this
decade are stunning, soaring from a mere $299
million in 2001 to nearly $6.8 billion only five years
later in 2006. Projecting out five years after that,
to 2011, all signs indicate even larger growth,
rising to not quite $16.6 billion—nearly $10 billion
more in that relatively brief timespan.
Behind this gold rush is a rare phenomenon in marketing—
namely, that of considerable customer satisfaction. Generally,
Internet users see paid search and contextual advertising as
relevant enough and non-intrusive.That acceptance is why people
click on these ads and why advertisers increasingly spend to woo
their clicks.
Another factor supporting search ad spending is what happens
after the click. Since advertisers can more readily track the results
of a search marketing campaign than one using online display
advertising, search can become self-supporting, especially for
retailers, with the cost of each click translating to cost-plus-X
dollars in sales.
5. Search Engine Marketing 5
Search Ad Spending
Other contributors to search spending growth are brand
marketers and the relationship consumers have with brands.
When an offline ad campaign drives awareness, even if only
partially, many people tend to search online to find out more about
the product or service.Therefore, brand marketers need to factor
search advertising into their overall campaigns to support efforts
in other media. Even if a user does not click on an ad, his or her
seeing the ad is basically a free impression for the advertiser.
090470
As vast as search advertising spending might be, its growth is
leveling off.After a 27.5% increase in 2008, annual growth will
subside to around 10% by early next decade.The declining growth
is due to several factors. One is the vast size of the US search
market, in which even large dollar gains equate to smaller
percentage gains.The other is the economic slowdown, which
over time will reduce shopping—both for homes and smaller
items—and therefore people will search and click less.
090472
Paid search reached a 40% share of total US Internet ad spending
in 2004. Since then, and going forward, online advertisers have
and will put about the same percentage into search.
090478
US Search Advertising Spending, 2001-2011 (millions)
2001 $299
2002 $927
2003 $2,543
2004 $3,850
2005 $5,142
2006 $6,799
2007 $8,624
2008 $11,000
2009 $12,935
2010 $14,906
2011 $16,590
Note: eMarketer benchmarks its US online advertising spending
projections against the Interactive Advertising Bureau
(IAB)/PricewaterhouseCoopers (PwC) data, for which the last full year
measured was 2006; search advertising includes paid listings for search
engine results (also called "paid placement"), contextual text links that
appear alongside content on third-party publisher sites and paid inclusion
for guaranteeing that a marketer's URL is indexed by a search engine
Source: eMarketer, January 2008
090470 www.eMarketer.com
US Search Advertising Spending Growth, 2001-2011 (%
change)
2001 175.3%
2002 210.5%
2003 174.3%
2004 51.4%
2005 33.5%
2006 32.2%
2007 26.8%
2008 27.5%
2009 17.6%
2010 15.2%
2011 11.3%
Note: eMarketer benchmarks its US online advertising spending
projections against the Interactive Advertising Bureau
(IAB)/PricewaterhouseCoopers (PwC) data, for which the last full year
measured was 2006; search advertising includes paid listings for search
engine results (also called "paid placement"), contextual text links that
appear alongside content on third-party publisher sites and paid inclusion
for guaranteeing that a marketer's URL is indexed by a search engine
Source: eMarketer, January 2008
090472 www.eMarketer.com
US Search Advertising Spending, 2001-2011 (% of total
online ad spending)
2001 4.2%
2002 15.4%
2003 35.0%
2004 40.0%
2005 41.0%
2006 40.3%
2007 40.3%
2008 40.0%
2009 39.8%
2010 39.8%
2011 39.5%
Note: eMarketer benchmarks its US online advertising spending
projections against the Interactive Advertising Bureau
(IAB)/PricewaterhouseCoopers (PwC) data, for which the last full year
measured was 2006; search advertising includes paid listings for search
engine results (also called "paid placement"), contextual text links that
appear alongside content on third-party publisher sites and paid inclusion
for guaranteeing that a marketer's URL is indexed by a search engine
Source: eMarketer, January 2008
090478 www.eMarketer.com
6. Search Engine Marketing 6
Search Ad Spending
To put that 40% share into context, note how no other online ad
format contributes much more than half that amount.
088422
However,between 2008 and 2011,there will be greater growth for
rich media and video ads and lead-generation advertising than for
paid search.Those two online ad formats are relatively
undeveloped compared to search,hence their higher growth rates.
088302
Comparative Estimates:
Search Marketing
Estimates for search advertising range widely. In
2008, for example, Forrester Research is at the
low end (at $7.72 billion) and Piper Jaffray at the
high end (at $15.50 billion). One reason for this
divergence comes from how search advertising is
defined and what elements get included. For
example, some, such as Forrester, count SEO in
their total search estimates.
Although SEO is essential for search marketing, it is not a media
buy, and therefore eMarketer does not regard SEO spending as ad
spend. In these search advertising comparative estimates, such
spending has been subtracted, where appropriate, to better
compare apples to apples.
090487
US Online Advertising Spending, by Format, 2006-2011
(% of total online ad spending and billions)
2006 2007 2008 2009 2010 2011
Search 40.3% 40.3% 40.0% 39.8% 39.8% 39.5%
Display ads 21.8% 21.9% 21.5% 20.5% 20.0% 19.5%
Classified 18.1% 17.0% 17.0% 16.9% 16.8% 16.5%
Rich media/video 7.1% 8.2% 9.5% 11.0% 11.9% 13.1%
Lead generation* 7.8% 8.15 8.3% 8.6% 8.8% 8.8%
E-Mail 2.0% 2.0% 1.8% 1.7% 1.6% 1.5%
Sponsorships 2.9% 2.5% 2.0% 1.5% 1.3% 1.2%
Total $16.9 $21.4 $27.5 $32.5 $37.5 $42.0
Note: eMarketer benchmarks its US online advertising spending
projections against the Interactive Advertising Bureau
(IAB)/PricewaterhouseCoopers (PwC) data, for which the last full year
measured was 2006; online ad data includes categories as defined by
IAB/PwC benchmark—display ads (such as banners), search ads (including
paid listings, contextual text links and paid inclusion), rich media (including
video), classified ads, sponsorships, referrals (lead generation) and e-mail
(embedded ads only); excludes mobile ad spending; *also called referrals
Source: eMarketer, October 2007
088422 www.eMarketer.com
US Online Advertising Spending Growth, by Format,
2006-2011 (% increase/decrease vs. prior year)
2006 2007 2008 2009 2010 2011
Rich media/video 18.7% 47.2% 48.9% 36.8% 24.8% 22.8%
Lead generation* 74.0% 32.3% 30.9% 23.2% 17.4% 12.0%
Search 32.2% 26.8% 27.5% 17.6% 15.2% 11.3%
Classified 43.5% 18.9% 28.5% 17.5% 14.4% 10.3%
Display ads 46.9% 27.2% 26.2% 12.7% 12.6% 9.2%
Sponsorships -20.9% 7.9% 2.8% -11.4% -3.8% 7.5%
E-Mail 34.6% 26.6% 12.4% 14.8% 8.6% 5.0%
Total 34.6% 26.8% 28.5% 18.2% 15.4% 12.0%
Note: eMarketer benchmarks its US online advertising spending
projections against the Interactive Advertising Bureau
(IAB)/PricewaterhouseCoopers (PwC) data, for which the last full year
measured was 2006; online ad data includes categories as defined by
IAB/PwC benchmark—display ads (such as banners), search ads (including
paid listings, contextual text links and paid inclusion), rich media (including
video), classified ads, sponsorships, referrals (lead generation) and e-mail
(embedded ads only); excludes mobile ad spending; *also called referrals
Source: eMarketer, October 2007
088302 www.eMarketer.com
Comparative Estimates: US Search Advertising
Spending, 2006-2011 (billions)
Borrell Associates, July
2007 (1)
eMarketer, January
2008 (2)
Forrester Research,
October 2007 (2)
JPMorgan, January 2008 (2)
Morgan Stanley, October
2006 (3)
Oppenheimer & Co.,
September 2007
Piper Jaffray & Co.,
February 2007
PricewaterhouseCoopers,
June 2007 (4)
Veronis Suhler Stevenson,
August 2007 (4)
Note: includes both national and local search; (1) includes paid placement
and contextual search advertising; (2) includes paid search (paid
placement), contextual search, paid inclusion; excludes SEO; (3) search
fees advertisers pay Internet companies to list and/or link their company
site/domain name to a specific search word or phrase; (4) keyword search
Source: Borrell Associates, provided to eMarketer, July 2007; eMarketer,
January 2008; Forrester Research, "U.S. Online Marketing Forecast 2007 To
2012," October 2007; JPMorgan and company reports, "Nothing But Net,"
January 2008; Morgan Stanley, "US Internet Advertising Outlook,
2006-2010E," October 2006; Oppenheimer & Co. Inc. "Online Advertising:
Mortgage Related Impact, Trimming Forecast for US Internet Advertising,"
September 2007; Piper Jaffray & Co., "The User Revolution: The New
Advertising Ecosystem and the Rise of the Internet as a Mass Medium,"
February 2007; PricewaterhouseCoopers (PwC) and Wilkofsky Gruen
Associates, "Global Entertainment and Media Outlook: 2007-2011," June 20,
2007; VSS, "Communications Industry Forecast 2007-2011," August 7, 2007
2006
$8.13
$6.80
-
$8.60
$6.68
$6.75
$9.90
$6.72
$7.74
2007
$10.32
$8.62
$6.15
$11.76
$8.62
$8.58
$13.06
$8.50
$10.17
2008
$12.35
$11.00
$7.72
$15.52
$10.90
$10.65
$15.50
$10.25
$12.79
2009
$13.79
$12.94
$9.72
$19.10
$13.40
$13.05
$17.68
$11.80
$15.66
2010
$14.25
$14.91
$11.58
$23.63
$15.79
-
$19.75
$13.20
$18.31
2011
$13.24
$16.59
$14.07
$26.79
-
-
$21.52
$14.50
$20.87
090487 www.eMarketer.com
7. Search Engine Marketing 7
Comparative Estimates: Search Marketing
When it comes to spending increases, however, there is far less
divergence.Among the nine researchers in the following chart, all
but one (Forrester) see a slowly declining growth rate.And, even
with that decline, all but one (Borrell) see positive year-over-year
annual percentage changes.
090491
All researchers project that paid search will remain the dominant
form of Internet ad spending in the next four years. However, in
2008 alone, those market shares diverge dramatically; Piper Jaffray
believes search advertising will make up 52.6% of total Internet ad
spending, whereas Veronis Suhler Stevenson forecasts search as
having a 33.7% share.
Varying methodologies concerning what elements get included in
both search advertising and overall Internet advertising contribute
greatly to these differences.
090493
Comparative Estimates: US Search Advertising
Spending Growth, 2006-2011 (% change)
Borrell Associates, July
2007 (1)
eMarketer, January
2008 (2)
Forrester Research,
October 2007 (2)
JPMorgan, January 2008 (2)
Morgan Stanley, October
2006 (3)
Oppenheimer & Co.,
September 2007
Piper Jaffray & Co.,
February 2007
PricewaterhouseCoopers,
June 2007 (4)
Veronis Suhler Stevenson,
August 2007 (4)
2006
41.5%
32.2%
-
-
29.9%
31.3%
50.9%
30.7%
38.1%
2007
26.8%
26.8%
-
36.8%
29.1%
27.0%
32.0%
26.5%
31.4%
2008
19.7%
27.5%
25.5%
31.9%
26.4%
24.2%
18.7%
20.6%
25.9%
2009
11.7%
17.6%
25.9%
23.1%
22.9%
22.5%
14.0%
15.1%
22.4%
2010
3.3%
15.2%
19.1%
23.7%
17.8%
-
11.7%
11.9%
16.9%
2011
-7.1%
11.3%
21.5%
13.4%
-
-
9.0%
9.8%
14.0%
090491 www.eMarketer.com
Note: includes both national and local search; (1) includes paid placement
and contextual search advertising; (2) includes paid search (paid
placement), contextual search, paid inclusion; excludes SEO; (3) search fees
advertisers pay Internet companies to list and/or link their company site/
domain name to a specific search word or phrase; (4) keyword search
Source: Borrell Associates, provided to eMarketer, July 2007; eMarketer,
January 2008; Forrester Research, "U.S. Online Marketing Forecast 2007 To
2012," October 2007; JPMorgan and company reports, "Nothing But Net,"
January 2008; Morgan Stanley, "US Internet Advertising Outlook,
2006-2010E," October 2006; Oppenheimer & Co. Inc. "Online Advertising:
Mortgage Related Impact, Trimming Forecast for US Internet Advertising,"
September 2007; Piper Jaffray & Co., "The User Revolution: The New
Advertising Ecosystem and the Rise of the Internet as a Mass Medium,"
February 2007; PricewaterhouseCoopers (PwC) and Wilkofsky Gruen
Associates, "Global Entertainment and Media Outlook: 2007-2011," June
20, 2007; VSS, "Communications Industry Forecast 2007-2011," August 7,
2007
Comparative Estimates: US Search Advertising
Spending As a Percent of Total Online Advertising
Spending, 2006-2011
Borrell Associates, July
2007 (1)
eMarketer, January
2008 (2)
Forrester Research,
October 2007 (2)
Morgan Stanley, October
2006 (3)
Oppenheimer & Co.,
September 2007
Piper Jaffray & Co.,
February 2007
PricewaterhouseCoopers,
June 2007 (4)
Veronis Suhler Stevenson,
Note: includes both national and local search; (1) includes paid placement
and contextual search advertising; (2) includes paid search (paid
placement), contextual search, paid inclusion; excludes SEO; (3) search
fees advertisers pay Internet companies to list and/or link their company
site/domain name to a specific search word or phrase; (4) keyword search
Source: Borrell Associates, provided to eMarketer, July 2007; eMarketer,
January 2008; Forrester Research, "U.S. Online Marketing Forecast 2007 To
2012," October 2007; Morgan Stanley, "US Internet Advertising Outlook,
2006-2010E," October 2006; Oppenheimer & Co. Inc. "Online Advertising:
Mortgage Related Impact, Trimming Forecast for US Internet Advertising,"
September 2007; Piper Jaffray & Co., "The User Revolution: The New
Advertising Ecosystem and the Rise of the Internet as a Mass Medium,"
February 2007; PricewaterhouseCoopers (PwC) and Wilkofsky Gruen
Associates, "Global Entertainment and Media Outlook: 2007-2011," June 20,
2007; VSS, "Communications Industry Forecast 2007-2011," August 7, 2007
2006
33.7%
40.3%
-
41.8%
40.0%
51.2%
40.0%
32.7%
2007
35.6%
40.3%
44.6%
43.8%
40.5%
52.9%
40.3%
33.3%
2008
36.5%
40.0%
41.7%
45.9%
41.0%
52.6%
40.7%
33.7%
2009
36.7%
39.8%
39.7%
48.0%
41.4%
52.1%
41.0%
34.0%
2010
35.3%
39.8%
37.1%
49.6%
-
51.7%
41.0%
33.9%
2011
32.6%
39.5%
35.9%
-
-
51.2%
41.0%
33.7%
090493 www.eMarketer.com
8. Search Engine Marketing 8
Search Spending by Type
In 2007, paid search ads will contribute 62% to all
search engine marketing spending, with SEO
spending contributing about 18% to the pie. By
2011, however, a greater focus on SEO means
that form of search marketing will represent
nearly 23%, while paid search will fall back to not
quite 57%.
Behind that shift is the recognition that, even though most people
are ready to click on relevant paid search ads, they prefer organic
listings even more and tend to equate higher organic search
rankings with better brands. Further, as brand advertisers
increasingly make search a central component of their online
campaigns, the need to see those brands with top natural
rankings becomes ever more urgent.
Contextual advertising will also expand in the next four years,
moving up from a 14% share in 2007 to 17% in 2011.This spending
swing will be due to two factors: one, better algorithms that more
effectively target the context, creating more relevant ads, and,
two, more Web publishers will look to bulk up their revenues by
greater use of their ad inventory space.
090485
According to Forrester, a similar but more dramatic shift will occur
in search marketing spending. However, the research firm sees
paid search with only a 44% share in 2011, whereas SEO will
contribute 33% to the whole.
090460
In dollar terms, the paid search market share will surpass $6.5
billion in 2007 and nearly double to almost $12.2 billion in 2011.
Over the same period, spending for SEO and contextual
advertising will more than double.
Overall, search engine marketing spending will rise spectacularly
from $10.6 billion in 2007 to $21.5 billion in 2011.
090480
US Search Engine Marketing Spending, by Type,
2006-2011 (% of total and millions)
2006 2007 2008 2009 2010 2011
Paid search
advertising
63.5% 62.0% 61.2% 59.4% 58.0% 56.7%
Contextual
advertising
12.9% 13.9% 14.7% 15.5% 16.5% 16.9%
Paid inclusion 6.3% 5.7% 4.8% 4.5% 3.9% 3.6%
Search engine
optimization
(SEO)
17.4% 18.4% 19.3% 20.6% 21.6% 22.8%
Total $8,229 $10,574 $13,625 $16,285 $19,006 $21,490
Note: Search engine marketing includes both advertising and
non-advertising (non-media buy) components; search advertising includes
paid listings for search engine results (also called "paid placement"),
contextual text links that appear alongside content on third-party publisher
sites and paid inclusion for guaranteeing that a marketer's URL is indexed
by a search engine; search engine optimization (SEO) includes those
techniques used to create better placement in the natural, or organic,
search results; numbers may not add up to 100% due to rounding
Source: eMarketer, January 2008
090485 www.eMarketer.com
US Search Marketing Spending Share, by Type,
2007-2012 (% of total and millions)
2007 2008 2009 2010 2011 2012
Paid search 56% 54% 53% 49% 44% 40%
Paid inclusion 10% 10% 9% 8% 7% 7%
Contextual ads 10% 10% 11% 12% 16% 18%
SEO 24% 26% 27% 31% 33% 35%
Total (millions) $8,056 $10,432 $13,310 $16,775 $20,993 $25,323
Note: paid search defined as amount spent on paid search media on
search engines; paid inclusion defined as amount spent on submitting
pages to paid directories (like Froogle orYahoo! Shopping) for cataloging;
contextual ads defined as amount spent buying contextual ads across
content sites in different search engine or aggregator networks; SEO
defined as search engine optimization, or amount spent for techniques to
boost natural or organic rankings for various keywords
Source: Forrester Research, "U.S. Online Marketing Forecast 2007 To 2012,"
October 2007 as cited in Advertising Age, "Search Marketing Fact Pack
2007," November 2007; eMarketer calculations, December 2007
090460 www.eMarketer.com
US Search Engine Marketing Spending Growth, by
Type, 2006-2011 (millions)
2006 2007 2008 2009 2010 2011
Paid search
advertising
$5,222 $6,554 $8,333 $9,675 $11,031 $12,194
Contextual
advertising
$1,061 $1,466 $2,008 $2,522 $3,130 $3,633
Paid inclusion $517 $604 $660 $737 $745 $763
Search engine
optimization
(SEO)
$1,430 $1,950 $2,625 $3,350 $4,100 $4,900
Total $8,229 $10,574 $13,625 $16,285 $19,006 $21,490
Note: Search engine marketing includes both advertising and
non-advertising (non-media buy) components; search advertising includes
paid listings for search engine results (also called "paid placement"),
contextual text links that appear alongside content on third-party publisher
sites and paid inclusion for guaranteeing that a marketer's URL is indexed
by a search engine; search engine optimization (SEO) includes those
techniques used to create better placement in the natural, or organic,
search results; numbers may not add up total due to rounding
Source: eMarketer, January 2008
090480 www.eMarketer.com
9. Search Engine Marketing 9
Search Spending by Type
The Forrester perspective shows a similar curve, with total search
marketing at only $8.1 billion in 2007 and $21 billion in 2011.The
2012 projection shows a steep jump, however, rising to over $25.3
billion by the end of that year.
090457
In comparing the eMarketer and Forrester Research growth rates,
note the following.
■ Both firms project paid search advertising to have the greatest
increase in 2008, with declining gains in subsequent years.
■ Although eMarketer expects increases for contextual
advertising to have reached their peak—at 38.2%—in 2007,
Forrester sees up-and-down gains, with a 66.9% high in 2011.
■ The largest increase for SEO spending will happen in 2007,
eMarketer projects, or in 2010, according to Forrester.
090484
090461
A greater spending shift to SEO relative to paid search is
supported by research that shows people tend to click more on
organic listings than ads. From the marketer perspective, or at
least that of the retailer, paid search is used only somewhat more
than natural search.
082606
However,an Internet Retailer survey of chain retailers,catalog
companies,Web-only merchants and consumer brand
manufacturers showed 46.1% of respondents saying SEO performed
best compared with 37.3% for pay-per-click advertisements.
US Search Marketing Spending, by Type, 2007-2012
(millions)
2007 2008 2009 2010 2011 2012
Paid search $4,496 $5,633 $7,054 $8,220 $9,237 $10,129
Paid inclusion $818 $1,043 $1,198 $1,342 $1,469 $1,773
Contextual ads $838 $1,043 $1,464 $2,013 $3,359 $4,558
SEO $1,904 $2,712 $3,594 $5,200 $6,928 $8,863
Total $8,056 $10,432 $13,310 $16,775 $20,993 $25,323
Note: paid search defined as amount spent on paid search media on
search engines; paid inclusion defined as amount spent on submitting
pages to paid directories (like Froogle orYahoo! Shopping) for cataloging;
contextual ads defined as amount spent buying contextual ads across
content sites in different search engine or aggregator networks; SEO
defined as search engine optimization, or amount spent for techniques to
boost natural or organic rankings for various keywords
Source: Forrester Research, "U.S. Online Marketing Forecast 2007 To 2012,"
October 2007 as cited in Advertising Age, "Search Marketing Fact Pack
2007," November 2007
090457 www.eMarketer.com
US Search Engine Marketing Spending Growth, by
Type, 2007-2011 (% change)
2007 2008 2009 2010 2011
Paid search advertising 25.5% 27.1% 16.1% 14.0% 10.5%
Contextual advertising 38.2% 36.9% 25.6% 24.1% 16.1%
Paid inclusion 16.8% 9.3% 11.7% 1.1% 2.4%
Search engine optimization (SEO) 36.4% 34.6% 27.6% 22.4% 19.5%
Total 28.5% 28.9% 19.5% 16.7% 13.1%
Note: Search engine marketing includes both advertising and
non-advertising (non-media buy) components; search advertising includes
paid listings for search engine results (also called "paid placement"),
contextual text links that appear alongside content on third-party publisher
sites and paid inclusion for guaranteeing that a marketer's URL is indexed
by a search engine; search engine optimization (SEO) includes those
techniques used to create better placement in the natural, or organic,
search results
Source: eMarketer, January 2008
090484 www.eMarketer.com
US Search Marketing Spending Growth, by Type,
2008-2012 (% change)
2008 2009 2010 2011 2012
Paid search 25.3% 25.2% 16.5% 12.4% 9.7%
Paid inclusion 27.5% 14.9% 12.0% 9.5% 20.7%
Contextual ads 24.5% 40.4% 37.5% 66.9% 35.7%
SEO 42.4% 32.5% 44.7% 33.2% 27.9%
Total 29.5% 27.6% 26.0% 25.1% 20.6%
Note: paid search defined as amount spent on paid search media on
search engines; paid inclusion defined as amount spent on submitting
pages to paid directories (like Froogle orYahoo! Shopping) for cataloging;
contextual ads defined as amount spent buying contextual ads across
content sites in different search engine or aggregator networks; SEO
defined as search engine optimization, or amount spent for techniques to
boost natural or organic rankings for various keywords
Source: Forrester Research, "U.S. Online Marketing Forecast 2007 To 2012,"
October 2007 as cited in Advertising Age, "Search Marketing Fact Pack
2007," November 2007; eMarketer calculations, December 2007
090461 www.eMarketer.com
Type of Search Engine Marketing Used by US
Retailers, March 2007 (% of respondents)
Note: n=245; numbers may not add up to 100% due to rounding
Source: Internet Retailer with WebSurveyor, April 2007
082606 www.eMarketer.com
Both equally
26.1%
More natural search
than paid search
34.7%
More paid search than
natural search
39.2%
10. Search Engine Marketing 10
Search Spending by Type
Considering, too, how SEO tends to be less expensive than paid
search, then even small boosts in SEO spending relative to paid
search can indicate a larger shift in marketing effectiveness than
might be indicated by dollars alone.
082609
People Who Search
How much do advertisers spend for paid search
relative to the audience for those ads?
Viewed by the people marketers look to reach, the 40% share for
paid search can appear outlandish. In fact, when it comes to paid
search advertising, there is an extreme disconnect between the
dollars advertisers spend and the time consumers spend with the
medium.That gap is greater for paid search than nearly any other
form of advertising, which sometimes makes the ad form seem
counterintuitive, especially for traditional marketers.
That’s all to say that, relative to the time people spend using
search engines, companies pour disproportionate sums into paid
search ads compared to display ads on content sites.According to
ongoing research from the Online Publishers Association (OPA)
and Nielsen//NetRatings, US Internet users in 2007 will spend less
than 5% of their online time using search versus nearly 50% of
their time on content sites.
090392
And yet in 2007, paid search advertisers spent $5.07 per hour of
consumer search usage compared with only 49 cents for display
advertising relative to each hour users spent on content sites.
(Note that while display ads also appear on communications and
commerce sites, the following chart does not include such sites in
its formula. If it did, the figure for display spending per hour would
be even smaller.)
Of course when search is effective, people find what they need
and go away, and that greatly reduces the time spent on sites. But
when content is effective, people want to stick around.
Nevertheless, a 10-1 ratio between search and display dollars
points to the importance of Internet search engine users in
contrast to their brief time spent searching.
The growth of paid search spending per hour (up by 6.5% in 2007)
also surpassed that of display advertising, which dropped by
11.6% in 2007. If nothing else, the data point to how even with the
sharp increase in consumer time spent on content sites,
advertisers have not caught up.
Best Performing Type of Search Engine Marketing for
Conversion Rates according to US Retailers, March
2007 (% of respondents)
Note: n=245; numbers may not add up to 100% due to rounding
Source: Internet Retailer with WebSurveyor, April 2007
082609 www.eMarketer.com
Both equally
16.6%
Natural
search engine
optimization
46.1%
Pay-per-click
37.3%
Average Share of Time US Internet Users Spend
Online, by Site Category, Q1 2006-Q2 2007 (% of total)
Q1
2006
Q2
2006
Q3
2006
Q4
2006
Q1
2007
Q2
2007
Content 38.3% 39.4% 41.4% 44.7% 46.0% 48.1%
Communications 38.6% 38.7% 37.6% 33.6% 33.5% 32.7%
Commerce 17.6% 16.5% 15.9% 16.9% 15.8% 14.5%
Search 5.4% 5.4% 5.0% 4.8% 4.7% 4.6%
Note: excludes .gov and .edu Web sites, as well as pornographic domains;
numbers may not add up to 100% due to rounding
Source: Online Publishers Association (OPA) and Nielsen//NetRatings,
"Internet Activity Index (IAI)," October 2007; eMarketer calculations,
November 2007
090392 www.eMarketer.com
11. Search Engine Marketing 11
People Who Search
But, to the point of this report, the increase in paid search
spending per search hour does not come close to the overall
Internet ad spending gain of 26.8% for 2007.The audience is far
ahead of the advertiser.
090740
Who is the audience for search engines and the advertisers who
love them? The following sections help paint a fuller picture of the
search audience by answering these questions:
■ Who searches?
■ How many people search?
■ How often do they search?
■ Where do people search?
■ Where do searchers come from? Where do they go?
■ How many searches do people conduct?
■ How do people use keywords?
■ Why do people search?
Who Searches?
A demographic profile of US search engine users from
Nielsen//NetRatings indicated that searchers were much like
Internet users in general, except for some salient differences.
For example,while 20% of the online population was younger than
18,a lower percentage used each of the five search engines
included.Similarly,while 28% of the online population was between
35 and 49,a higher percentage used the five search engines.
However, household income and gender among search
engine users more or less tracked the overall figures for each
category shown.
082314
What do people think about search engine results? Surprisingly,
user responses do not vary much according to the degree of
usage, Forrester Research found.
Advertising Dollars Spent per Hour of US Consumer
Internet Usage*, by Type, 2006 & 2007
Paid search spending** per search hours
$4.76
$5.07
Total Internet ad spending per total hours
$0.79
$0.78
Display ad spending*** per content hours
$0.55
$0.49
2006 2007
Note: based on eMarketer ad spending estimates divided by total time
spent online by site category (Online Publishers Association and
Nielsen//NetRatings), with the last reported month for Internet usage as
October 2007; *consumer usage for Internet content sites (display), search
sites (paid search) and total time spent online; **includes paid search ads
only on search engines and excludes contextual advertising and paid
inclusion; ***includes static display ads, rich media and video ads
Source: eMarketer, December 2007; Online Publishers Association and
Nielsen//NetRatings, December 2007
090740 www.eMarketer.com
Demographic Profile of US Search Engine Users, by
Search Engine, October 2006
Unique users (millions)
Audience reach
Gender
Male
Female
Age
<18
18+
18-21
21-34
35-49
50-64
65+
Household Income
<$25,000
$25,000-$49,999
$50,000-$74,999
$75,000-$99,999
$100,000-$149,000
$150,000+
No response
Google
93.0
59%
50%
50%
18%
82%
4%
17%
33%
22%
6%
5%
19%
27%
21%
17%
9%
2%
Yahoo!
55.1
35%
49%
51%
13%
87%
3%
18%
34%
25%
7%
6%
22%
28%
19%
16%
8%
1%
MSN
40.2
25%
48%
52%
12%
88%
3%
14%
35%
28%
8%
5%
21%
27%
20%
16%
9%
2%
Ask.com
38.8
24%
47%
53%
17%
83%
3%
15%
33%
25%
7%
8%
24%
26%
19%
14%
7%
2%
AOL
25.3
16%
43%
57%
14%
86%
3%
12%
31%
28%
13%
6%
22%
26%
19%
17%
10%
1%
Online
Population
157.1
100%
48%
52%
20%
80%
4%
17%
28%
23%
9%
6%
23%
27%
19%
16%
8%
3%
Source: Nielsen//NetRatings appearing in Piper Jaffray & Co., February
2007
082314 www.eMarketer.com
12. Search Engine Marketing 12
People Who Search
For example—and this points to the importance of increased
spending on SEO—59% of all respondents to Forrester’s study
said they did not pay attention to paid search ads. Further, 36% did
not trust search engine ads.Though it cannot be deduced from
this figure that 64% of search engine users do trust those ads, it
would seem that there is more trust than not.
082203
Even if search ads are not central for most search users,the search
engines themselves get high grades from US consumers.In a Harris
Interactive poll from July 2007,84% of respondents cited search
engines for good customer service,topped only by supermarkets.
However, the term “customer service” is likely used broadly here,
since one would guess that the vast majority of people who have
used a search engine have never actually spoken with or e-mailed
the people running that engine. Most probably, these results imply
that people like what they get from search sites.
086389
Looking specifically at search engines and portals, the American
Customer Satisfaction Index (ACSI) research for 2007 showed that
only Yahoo! and Google got ranked higher than average on its 100-
point scale.
086448
Attitudes of Search Engine Users in North America
toward Search Results, by Frequency of Search
Engine Usage, Q2 2006 (% of respondents)
I don't pay attention to the advertise-
ments that appear around search results
There seem to be more advertisements
on search engines now compared with
last year
I don't trust search engine
advertisements
Search engine advertisements are less
relevant now compared with last year
When I see a search advertisement
featuring a brand I recognize, I think
more highly of that brand
I often find the advertisements just as
relevant as the search results
I often click on the advertisements that
appear next to the results
Occa-
sion-
ally*
62%
54%
38%
19%
13%
11%
10%
Moder-
ately**
63%
56%
38%
19%
13%
12%
11%
Fre-
quent-
ly***
62%
59%
38%
20%
15%
14%
13%
All
respon-
dents
59%
51%
36%
18%
12%
11%
10%
Note: *use search engines once a month to several times a month; **use
search engines once a week to several times a week; ***use search
engines daily
Source: Forrester Research, December 2006
082203 www.eMarketer.com
Customer Service Quality according to US Adult
Consumers, by Industry, July 2007 (% of respondents)
Good Bad Not sure
or refused
Supermarkets 92% 8% *
Online search engines 84% 7% 9%
Computer hardware companies 78% 14% 7%
Hospitals 78% 20% 2%
Banks 78% 22% *
Computer software companies 77% 16% 8%
Packaged food companies 77% 22% 1%
Car manufacturers 72% 26% 1%
Electric and gas utilities 71% 29% *
Internet service providers 70% 24% 5%
Investment and brokerage firms 70% 25% 5%
Online retailers 69% 21% 11%
Telephone companies 67% 32% 1%
Airlines 61% 35% 4%
Pharmaceutical and drug companies 60% 39% *
Life insurance companies 57% 39% 4%
Cable companies 48% 49% 2%
Health insurance companies 39% 60% 1%
Managed care companies (eg HMOs) 37% 57% 6%
Oil companies 33% 66% 2%
Tobacco companies 26% 72% 1%
Note: n=1,010; numbers may not add up to 100% due to rounding; *<0.5%
Source: Harris Interactive, "Harris Poll" as cited in press release, August 8,
2007
086389 www.eMarketer.com
US Customer Satisfaction with Portals and Search
Engines, 2002-2007 (based on a 100-point scale*)
2002 2003 2004 2005 2006 2007
Yahoo! 76 78 78 80 76 79
Google 80 82 82 82 81 78
Ask.com 62 69 71 72 71 75
MSN 72 74 75 75 74 75
AOL 59 65 67 71 74 67
All others 72 78 78 77 78 75
Portals and search engines average 68 71 72 76 77 75
Note: figures are for Q2 of each year; *satisfaction measured on a scale of
1 to 100, using the American Customer Satisfaction Index (ACSI)
methodology
Source: American Customer Satisfaction Index (ACSI) and ForeSee Results,
"Annual E-Business Report," provided to eMarketer, August 14, 2007
086448 www.eMarketer.com
13. Search Engine Marketing 13
People Who Search
Consumer attitudes about search—and the data created each
time people enter a search term—increasingly count privacy as a
valuable asset.The “Digital Footprints”report,released in
December 2007 by the Pew Internet & American Life Project,
studied the connections between online personal information and
search.Though the report did not focus on search query data,it is a
useful guide to understanding how much concern people have
about their personal information and its availability on the Internet.
Though 39% of respondents expressed concern about the degree
of information about them available online, only 21% of that
segment also took steps to limit the amount of information
available.This was called the “Concerned and Careful” group.
Another 17%, dubbed the “Confident Creatives,” may not have
been worried but did limit the data connected with them.
All told, 56% of respondents either had some worry about
personal data, took steps to limit what was available, or both.This
is the online population addressed by efforts such as Ask.com’s
AskEraser option.
Or,to view the same data another way,60% of Internet users were
not worried about how much information was available about
them online,and a similar 61% did not bother to limit the amount of
information that could be found about them online.This is the
online population that might continue to be very satisfied with
Google orYahoo!,both of which hold on to search data for months.
090737
A demographic portrait of these Internet users shows a
correlation between higher education and greater concern and
care regarding personal information. Further, more women than
men expressed anxiety about how much information about them
might be available online.
090738
But perhaps the concerns regarding search privacy are not as
pervasive as they might appear.
US Adult Internet Users Who Are Concerned about
Their Personal Information Being Available Online,
December 2006 (% of respondents in each group)
% of adult Internet users
Worry about how much
information is available
about you online?
Take steps to limit the amount
of information available about
you online?
Concerned
and
careful
(1)
21%
Yes
Yes
Worried
by the
Confident
creatives
(3)wayside
(2)
18%
Yes
No
17%
No
Yes
Unfazed
and
inactive
(4)
43%
No
No
090737 www.eMarketer.com
Note: n=1,623 ages 18+; (1) defined as those who "fret about the personal
information available about them online and take steps to proactively limit
their own online data"; (2) defined as those who "despite being anxious
about how much information is available about them, do not actively limit
their online information"; (3) defined as those who "do not worry about the
availability of their online data and actively upload content, but still take
steps to limit their personal information"; (4) defined as those who "neither
worry about their personal information nor limit the amount of information
that can be found out about them online"
Source: Pew Internet & American Life Project, "Digital Footprints: Online
Identity Management and Search in the Age of Transparency," December
16, 2007
Gender
Age
Education
Annual household income
Internet experience
Male
Female
18-29
30-49
50-64
65+
Less than high school
High school graduate
Some college
College graduate
<$30,000
$30,000-$49,999
$50,000-$74,999
$75,000+
% with broadband at home
Average number of years
online
Concerned
and
careful
(1)
46%
54%
25%
46%
23%
6%
6%
26%
29%
39%
22%
24%
25%
29%
68%
9
Worried
by the
way-
side (2)
46%
54%
20%
46%
28%
6%
8%
32%
27%
33%
21%
23%
20%
35%
63%
8
52%
48%
31%
44%
19%
5%
6%
30%
30%
34%
28%
27%
14%
31%
65%
8
UnfazedConfident
creatives
(3)
and
inactive
(4)
50%
50%
21%
41%
28%
10%
7%
30%
27%
36%
22%
28%
18%
32%
60%
8
090738 www.eMarketer.com
Demographic Profile of US Adult Internet Users Who
Are Concerned about Their Personal Information
Being Available Online, December 2006 (% of
respondents in each group)
Note: n=1,623 ages 18+; (1) defined as those who "fret about the personal
information available about them online and take steps to proactively limit
their own online data"; (2) defined as those who "despite being anxious
about how much information is available about them, do not actively limit
their online information"; (3) defined as those who "do not worry about
the availability of their online data and actively upload content, but still
take steps to limit their personal information"; (4) defined as those who
"neither worry about their personal information nor limit the amount of
information that can be found out about them online"
Source: Pew Internet & American Life Project, "Digital Footprints: Online
Identity Management and Search in the Age of Transparency," December
16, 2007
14. Search Engine Marketing 14
People Who Search
Only 27% of respondents in a Ponemon Institute survey
commissioned by Vontu, a data-security company, cited search
terms as a type of personal information whose loss or theft would
concern them.
085452
Such concerns appear to be extremely colored by age, however. In
the same Ponemon-Vontu survey, 34% of those ages 18 to 25
would be disturbed by the loss of search term data more than any
other type.
085454
Types of Personal Information that US Consumers Are
Most Concered about Losing via Theft or Data Loss,
2007 (% of respondents)
Medical records
40%
Pharmaceutical history
38%
Credit card number
35%
Debit card number
34%
Social security number
33%
Credit report (credit score)
27%
Search terms on a search engine (eg Google)
27%
Bank account/routing number
27%
Tax return information
23%
Court or legal history (including criminal record)
21%
Note: n=786
Source: Vontu, “2007 Consumer Survey on Data Security” conducted by
Poneman Institute, June 25, 2007
085452 www.eMarketer.com
Types of Personal Information that US Consumers Are
Most Concered about Losing via Theft or Data Loss, by
Age, 2007 (% of respondents in each group)
Search terms
34%
14%
Debit card number
32%
46%
Bank account/routing number
24%
42%
Employment history
19%
7%
Social security number
17%
41%
Credit report
13%
29%
Tax return information
11%
39%
Movie (video) rentals
7%
45%
Home (real estate) value
1%
30%
Marital status
1%
19%
18-25 (n=111) 65+ (n=69)
Note: includes responses with the maximum differences between younger
and older respondents
Source: Vontu, “2007 Consumer Survey on Data Security” conducted by
Poneman Institute, June 25, 2007
085454 www.eMarketer.com
15. Search Engine Marketing 15
People Who Search
Earlier data indicated that AskEraser, or equivalent programs from
other search engines, could win more users.The Center for Survey
Research and Analysis at the University of Connecticut found that
60% of US adults somewhat or strongly opposed search engines
permanently storing user search behaviors.
070847
Trust is limited.At least that’s true among the 51% of respondents
who expressed some degree of apprehension that information
collected by search engines would remain private.
070848
How Many People Search?
Trust might be limited, but that has not held many back from
searching.At least 155 million people in the United States used
search engines in 2007.That group will rise by 25 million by 2011.
090496
In fact, search engine use is growing faster than overall Internet
users and will continue along those lines.That means that even
some portion of existing Internet users who do not search will
start to.
090501
Even so, although most Internet users search, not all do.
eMarketer estimates show 83.5% of US Internet users as search
users in 2008, inching up to 85.2% in 2011.
US Adults' Opinions Regarding Whether or Not Search
Engine Companies Should Permanently Store Users'
Search Behaviors, February 2006 (% of respondents)
Strongly support 13%
Somewhat support 19%
Somewhat oppose 27%
Strongly oppose 33%
Don't know/no answer 8%
Note: n=800
Source: Center for Survey Research and Analysis at the University of
Connecticut, February 2006
070847 www.eMarketer.com
US Adults' Level of Confidence that Information
Collected by Search Engine Companies Will Remain
Private, February 2006 (% of respondents)
Extremely confident 5%
Very confident 8%
Somewhat confident 34%
Not too confident 30%
Not confident at all 21%
Don't know/no answer 2%
Note: n=800
Source: Center for Survey Research and Analysis at the University of
Connecticut, February 2006
070848 www.eMarketer.com
US Search Engine Users, 2006-2011 (millions)
2006 147.0
2007 155.2
2008 161.9
2009 168.5
2010 174.9
2011 180.0
Note: ages 3+; based on usage anytime during the year from all locations
Source: eMarketer, January 2008
090496 www.eMarketer.com
US Search Engine User Growth vs. Total Internet User
Growth, 2006-2011 (% change)
2006
8.7%
3.7%
2007
5.6%
3.4%
2008
4.3%
3.1%
2009
4.1%
3.2%
2010
3.8%
3.0%
2011
3.0%
2.5%
Search engine users Internet users
Note: ages 3+; based on usage anytime during the year from all locations
Source: eMarketer, January 2008
090501 www.eMarketer.com
16. Search Engine Marketing 16
People Who Search
Perhaps more important for marketers is the penetration of
search among the total US population, at more than 55% in 2008
and surpassing 60% in 2011.
090504
The OPA-Nielsen data showed a similar figure for search engine
use, with 83.4% reach in the second quarter of 2007. However,
more Internet users visited content and communications sites
than those who searched.That greater reach on non-search sites
is one reason for contextual ad programs and deals between
search engines and social network sites.
090413
Counting search users by search engine sites finds Google at the
top of the heap. However, while comScore’s qSearch 2.0 service
said there were 142.1 million unique users on Google in
September 2007, Nielsen Online’s MegaView Search service put
that month’s figure at 105 million.
The main reason for the difference is one of definition.The higher
comScore data are based on what it calls “expanded search
rankings.”That means the count includes not just what the
company deems the five “core search engines” in the US—Google
sites,Yahoo! sites, Microsoft sites, the Ask network and the Time
Warner network—but also the following.
■ Partner search: searches initiated at partner sites that redirect
the visitor to a search engine site.
■ Cross-channel search: multiple searches when employing
more than one search tab (e.g.,Web, images, news) for a single
search term.
■ Local search: maps, directions and local directory listings.
■ Major “vertical” search locations, such as eBay and Amazon in
retail and Expedia in travel.
US Search Engine Users As a Percent of Total Internet
Users and Total Population, 2006-2011
2006
80.8%
51.4%
2007
82.5%
53.8%
2008
83.5%
55.6%
2009
84.2%
57.3%
2010
84.8%
59.0%
2011
85.2%
60.2%
Total Internet users Total population
Note: ages 3+; based on usage anytime during the year from all locations
Source: eMarketer, January 2008
090504 www.eMarketer.com
Average Web Site Reach among US Internet Users, by
Site Category, Q1 2006-Q2 2007 (% of total users)
Q1
2006
Q2
2006
Q3
2006
Q4
2006
Q1
2007
Q2
2007
Content 88.8% 89.0% 89.5% 91.7% 92.2% 92.7%
Communications 82.4% 82.0% 83.2% 84.7% 85.7% 85.5%
Search 80.4% 79.9% 79.2% 81.8% 83.0% 83.4%
Commerce 75.2% 74.6% 74.7% 77.2% 77.0% 78.5%
Average total 81.7% 81.4% 81.6% 83.8% 84.5% 85.0%
Note: excludes .gov and .edu Web sites, as well as pornographic domains
Source: Online Publishers Association (OPA) and Nielsen//NetRatings,
"Internet Activity Index (IAI)," October 2007; eMarketer calculations,
November 2007
090413 www.eMarketer.com
17. Search Engine Marketing 17
People Who Search
On the other side, Nielsen counts just search engine providers but
does go beyond the five core sites.
090343
089458
With those different approaches to defining the search engine
universe, not only does the number of people searching differ but
growth rates differ as well. For example, while comScore pegged
the September 2007 searcher growth at the Ask network at only
1.6%, Nielsen saw searcher growth at the core Ask.com site at a
strong 10.5%.
090348
089485
How Often Do People Search?
When it comes to consumer activity online, search is a mass of
seeming contradictions. People do it often but not for too long.
However, no matter what the age group, over 90% of US
consumers use search engines or portals weekly, according to the
“State of Media Democracy” survey from Deloitte & Touche.
By conflating search and portals, however, those estimates offer
fuzzy math. More likely, the questions labeled “seek personal
interest information”—at 72% or higher—and “seek product
reviews, conduct shopping research”—ranging from 53% to
74%—better represent the weekly search engine audience.
Number of US Unique Searchers, by Search Engine
Provider*, April-September 2007 (millions)
Apr May Jun Jul Aug Sep
Google 101.6 100.8 101.5 103.7 105.4 105.0
Yahoo! 57.6 57.6 59.6 61.2 61.1 60.0
MSN/Windows Live 41.3 38.9 49.0 57.6 48.2 44.8
AOL 23.8 22.7 23.8 23.5 22.8 23.1
Ask.com 15.9 16.7 18.3 17.1 17.0 18.8
Smarter Search 6.8 - 8.1 9.9 10.9 11.6
NexTag 9.2 7.9 10.2 10.6 10.9 10.0
MapQuest 7.2 7.5 7.9 8.1 7.2 7.6
Local.com 8.1 8.4 7.9 9.1 8.3 7.3
SBC Yellow Pages 7.7 7.5 8.6 - 7.2 6.8
Shopzilla - 6.4 - 7.2 - -
Total unique searchers 131.4 130.9 133.0 135.8 135.4 134.7
Note: among home and work users; total among individual search engine
providers is greater than total unique searchers since many unique
searchers visit more than one search provider each month; *top 10 for
each month
Source: Nielsen Online, “MegaView Search," provided to eMarketer,
November 2007; eMarketer calculations, November 2007
089458 www.eMarketer.com
Number of US Unique Searchers, by Search Engine
Provider, April-September 2007 (millions)
Apr May Jun Jul Aug Sep
Google sites 133.0 135.0 138.6 139.9 142.3 142.1
Yahoo! sites 97.8 99.3 101.6 104.1 103.8 102.1
Time Warner Network 81.8 83.6 85.2 85.4 83.8 79.8
Microsoft sites 65.3 64.6 67.2 69.9 68.8 65.2
Ask Network 39.5 40.4 43.4 43.6 42.8 43.5
Total Internet 179.4 182.9 184.8 184.6 184.9 184.9
Note: total among individual search engine providers is greater than total
unique searchers since many unique searchers visit more than one search
provider each month
Source: comScore qSearch 2.0, "Expanded Search Report for the US,"
provided to eMarketer, November 2007
090343 www.eMarketer.com
Growth of US Unique Searchers, by Search Engine
Provider, May-September 2007 (% change)
May Jun Jul Aug Sep
Google sites 1.5% 2.6% 1.0% 1.7% -0.1%
Yahoo! sites 1.6% 2.3% 2.5% -0.3% -1.6%
Time Warner Network 2.2% 2.0% 0.2% -1.9% -4.8%
Microsoft sites -1.1% 4.1% 4.0% -1.6% -5.1%
Ask Network 2.3% 7.4% 0.6% -1.8% 1.6%
Total Internet 1.9% 1.0% -0.1% 0.1% 0.0%
Source: comScore qSearch 2.0, "Expanded Search Report for the US,"
provided to eMarketer, November 2007; eMarketer calculations,
November 2007
090348 www.eMarketer.com
Growth of US Unique Searchers, by Search Engine
Provider*, May-September 2007 (% change)
May Jun Jul Aug Sep
Ask.com 5.5% 9.2% -6.4% -0.6% 10.5%
Smarter Search - - 23.1% 10.1% 6.1%
MapQuest 3.9% 5.4% 1.7% -10.5% 5.8%
AOL -4.5% 4.9% -1.4% -2.7% 1.1%
Google -0.8% 0.7% 2.2% 1.6% -0.4%
Yahoo! 0.1% 3.5% 2.6% 0.0% -1.8%
SBC Yellow Pages -2.4% 15.1% - - -5.1%
MSN/Windows Live -5.7% 25.8% 17.6% -16.3% -7.1%
NexTag -14.7% 29.3% 3.9% 2.7% -7.8%
Local.com 4.8% -6.0% 14.6% -9.3% -11.2%
Shopzilla - - - - -
Total unique searchers -0.4% 1.6% 2.1% -0.3% -0.5%
Note: among home and work users; *top 10 for each month
Source: Nielsen Online, “MegaView Search," provided to eMarketer,
November 2007; eMarketer calculations, November 2007
089485 www.eMarketer.com
18. Search Engine Marketing 18
People Who Search
Note again that eMarketer puts search reach, and not just weekly
reach, at 82.5% for 2007, while the OPA-Nielsen data for the
second quarter of 2007 are 83.4%.
086517
In contrast, 68% of North American Internet users told Forrester
Research that they used search engines once a week or
more frequently.
082202
Among olderAmericans,search engine use is nearly as ubiquitous
as e-mail use,according to Pew Internet & American Life Project
research.This is another indicator of how marketers need to target
search engine marketing at nearly all demographics.
087210
Where Do People Search?
Though the comScore and Nielsen numbers disagree about how
many people have been using search engines,there is more
coherence regarding the share of users searching on specific sites.
For example, looking just at September 2007, either 76.9%
(comScore) or 77.9% (Nielsen) of unique searchers used Google.
Similarly, either 35.3% or 33.2% used Microsoft sites or
MSN/Windows Live, according to the two researchers.
Online Activities Performed Weekly* according to US
Consumers, by Age, February 23, 2007-March 6, 2007
(% of respondents in each group)
Use search engines or portals
Read about local news,
weather or current events
Read national/world news,
weather or current events
Seek personal interest
information
Check out new Web sites that
have never visited before
Purchase products
Seek product reviews, conduct
shopping research
Read entertainment/celebrity
news
Research for work/school
Read sports news/information
Read travel/leisure information
Millen-
nials
13-24
94%
64%
59%
72%
72%
52%
53%
62%
85%
48%
33%
Gen X
25-41
93%
88%
82%
77%
73%
78%
74%
69%
61%
54%
59%
Baby
boomers
42-60
91%
87%
81%
72%
75%
77%
73%
58%
52%
56%
59%
Matures
61-75
90%
86%
88%
73%
70%
79%
70%
46%
30%
57%
63%
All
13-75
92%
82%
77%
73%
73%
72%
69%
61%
59%
54%
54%
Note: n=2,200 ages 13-75; *frequently/occasionally
Source: Deloitte & Touche, "State of the Media Democracy" conducted by
Harris Group, provided to eMarketer, August 2007
086517 www.eMarketer.com
Internet Users in North America Who Use Search
Engines, by Frequency, Q2 2006 (% of respondents)
Daily 32%
Several times a week 29%
Once a week 7%
Several times a month 14%
Once a month 7%
Less than once a month 7%
Never 3%
Source: Forrester Research, December 2006
082202 www.eMarketer.com
Online Activities of US Older Adults and Seniors, 2006
& 2007 (% of respondents)
E-Mail*
Use a search engine**
Search for maps or driving directions**
Research hobbies or interests*
News*
Buy a product***
Visit state, local or federal government sites***
Travel purchase or reservations***
Get financial information***
Instant messaging***
Research spiritual or religious information*
Upload and share photos***
Research family history or genealogy***
Rated a product, service or person using an online
rating system**
Play online games***
Used online classified sites, Craigslist***
Online auction***
Online auctions***
Sell products or services***
Download podcasts***
Create or work on personal Web page**
Social networking***
50-64
91%
90%
82%
77%
70%
69%
68%
61%
46%
36%
32%
30%
28%
28%
26%
23%
21%
19%
13%
12%
8%
4%
65+
88%
74%
76%
62%
58%
50%
50%
48%
35%
28%
29%
35%
31%
22%
23%
16%
9%
11%
7%
4%
2%
1%
Note: respondents answering if they had ever conducted the following
activities online; *survey conducted in February-March, 2007; **survey
conducted in December 2006; ***survey conducted in August 2006
Source: Pew Internet & American Life Project, "Usage Over Time," June 15,
2007
087210 www.eMarketer.com
19. Search Engine Marketing 19
People Who Search
Although shares differ for Yahoo!, the Time Warner network
(mainly AOL) and Ask, those three, in addition to Google and
Microsoft, get the greatest share of searchers.
090345
090316
In fact, among all types of Web sites—not just search—Google
had the second greatest share of visits in September 2007,
according to Hitwise. Other search sites that ranked highly in the
entire US Web universe in that month included Yahoo! Search
(seventh) and MSN Search (12th).
090324
Where Do Searchers Come From? Where Do They Go?
Tracking where search engine visitors come from and where they
go can help marketers understand patterns to improve their
search advertising. Research from Hitwise indicates clear
distinctions between upstream search engine visitors (the URL
visited immediately before) and much more uniformity among
downstream travels (the URL visited immediately after a search).
For Google and Ask, the top 10 upstream sites delivered 37.7%
and 43% of their October 2007 US visitors, respectively.
However, for Yahoo! Search and MSN Search, their top 10
upstream sites were far more concentrated, delivering 73.5% and
80.7% of their October 2007 US visitors, respectively.
Share of US Unique Searchers, by Search Engine
Provider, April-September 2007 (% of total and
millions)
Apr May Jun Jul Aug Sep
Google sites 74.2% 73.8% 75.0% 75.8% 77.0% 76.9%
Yahoo! sites 54.5% 54.3% 55.0% 56.4% 56.1% 55.2%
Time Warner Network 45.6% 45.7% 46.1% 46.2% 45.3% 43.1%
Microsoft sites 36.4% 35.3% 36.4% 37.9% 37.2% 35.3%
Ask Network 22.0% 22.1% 23.5% 23.6% 23.2% 23.5%
Total Internet (millions) 179.4 182.9 184.8 184.6 184.9 184.9
Note: total percentage among individual search engine providers is greater
than 100% since many unique searchers visit more than one search
provider each month
Source: comScore qSearch 2.0, "Expanded Search Report for the US,"
provided to eMarketer, November 2007
090345 www.eMarketer.com
Most Popular Web Sites* in the US, Ranked by Market
Share of Visits**, April-September 2007
Apr May Jun Jul Aug Sep
MySpace 5.86% 6.22% 6.71% 6.33% 5.76% 5.17%
Google 4.64% 4.77% 4.79% 4.80% 4.79% 5.03%
mail.yahoo.com 4.27% 4.45% 4.35% 4.47% 4.67% 4.91%
Yahoo! 4.04% 3.97% 4.17% 3.94% 3.84% 3.94%
eBay 1.62% 1.59% 1.57% 1.57% 1.59% 1.81%
mail.live.com - 0.33% 0.41% 0.51% 1.07% 1.75%
search.yahoo.com 1.40% 1.48% 1.52% 1.56% 1.60% 1.68%
MSN 1.69% 1.54% 1.54% 1.48% 1.56% 1.55%
Hotmail 1.95% 1.85% 1.70% 1.64% 1.42% 1.00%
Facebook 0.84% 0.92% 1.01% 1.03% 1.05% 0.96%
YouTube 0.65% 0.75% 0.84% 0.77% 0.70% 0.69%
search.msn.com 0.77% 0.73% 0.72% 0.62% 0.55% 0.56%
images.google.com 0.53% 0.54% 0.50% 0.47% 0.44% 0.49%
Gmail 0.34% 0.37% 0.37% 0.40% 0.43% 0.46%
Wikipedia 0.42% 0.42% 0.37% 0.37% 0.38% 0.45%
my.yahoo.com 0.34% 0.33% - 0.32% 0.34% 0.37%
mail.aol.com 0.33% 0.35% 0.35% 0.34% 0.35% 0.34%
www.pogo.com - - - - 0.32% 0.33%
news.yahoo.com - - - - - 0.33%
address.yahoo.com - - - - - 0.33%
mail.myspace.com 3.76% 3.90% 4.34% 4.02% 3.52% -
blog.myspace.com 0.42% 0.43% 0.45% 0.41% 0.36% -
music.myspace.com 0.36% 0.40% 0.44% 0.36% - -
Photobucket - - 0.35% - - -
AOL 0.34% - - - - -
Note: *top 20 for each month; **in September 2007
Source: Hitwise, "US Data Center," May-October 2007
090324 www.eMarketer.com
Share of US Unique Searchers, by Search Engine
Provider*, April-September 2007 (% of total and
millions)
Apr May Jun Jul Aug Sep
Google 77.3% 77.0% 76.3% 76.4% 77.8% 77.9%
Yahoo! 43.8% 44.0% 44.8% 45.0% 45.1% 44.6%
MSN/Windows Live 31.4% 29.7% 36.8% 42.4% 35.6% 33.2%
AOL 18.1% 17.3% 17.9% 17.3% 16.9% 17.1%
Ask.com 12.1% 12.8% 13.7% 12.6% 12.6% 14.0%
NexTag 7.0% 6.0% 7.6% 7.8% 8.0% 7.4%
Local.com 6.1% 6.5% 6.0% 6.7% 6.1% 5.4%
SBC Yellow Pages 5.8% 5.7% 6.5% - 5.3% 5.1%
MapQuest 5.5% 5.7% 6.0% 5.9% 5.6% 5.7%
Smarter Search 5.2% - 6.1% 7.3% 8.1% 8.6%
Shopzilla - 4.9% - 5.3% - -
Total unique searchers 131.4 130.9 133.0 135.8 135.4 134.7
Note: among home and work users; total among individual search engine
providers is greater than 100% since many unique searchers visit more
than one search provider each month; *top 10 for each month
Source: Nielsen Online, “MegaView Search," provided to eMarketer,
November 2007; eMarketer calculations, November 2007
090316 www.eMarketer.com
20. Search Engine Marketing 20
People Who Search
The percentages for downstream visits among all four search
engines were far more alike, ranging from 13% to 14.8% among
the top 10 sites in that same month.
090415
The largest share of Google visitors from August to October 2007
came from MySpace, the most-visited US Web site, according to
Hitwise data (see previous section). However, many Google
visitors also came from both Yahoo! and MSN, the next three sites,
which implies that those two portals are not capturing enough of
their own users when they’re ready to search.
090416
That the greatest share of Ask.com visitors came from Google in
the three months shown implies the smaller search engine is a
key second choice when people don’t find what they need on
Google.That is something marketers should evaluate when
considering which search engines to advertise on.
090432
In contrast, there’s far greater imbalance among visitors to Yahoo!
Search and MSN Search.“Captive audience” might be one term to
describe how more than 50% of Yahoo! Search visitors came from
the main portal, while 67% or more of MSN Search visitors came
from its portal.
Top Six Upstream* Sites that US Internet Users Visit
Immediately before Visiting Ask.com, Ranked by
Visitor Share, August-October 2007
Aug Sep Oct
Google (www.google.com) 12.25% 13.31% 13.67%
MySpace (www.myspace.com) 9.38% 9.60% 8.70%
Yahoo! (www.yahoo.com) 4.49% 4.33% 4.34%
Yahoo! Search (search.yahoo.com) 4.00% 4.30% 4.16%
Yahoo! Mail (mail.yahoo.com) 3.64% 3.53% 3.57%
MSN (www.msn.com) 2.68% 2.65% 2.69%
Total, top six 36.45% 37.72% 37.12%
Note: *upstream sites are those visited immediately prior to individual
search engine visit
Source: Hitwise, provided to eMarketer, December 2007; eMarketer
calculations, December 2007
090432 www.eMarketer.com
Top Six Upstream* Sites that US Internet Users Visit
Immediately before Visiting Google, Ranked by Visitor
Share, August-October 2007
Aug Sep Oct
MySpace (www.myspace.com) 12.44% 12.35% 11.67%
Yahoo! Mail (mail.yahoo.com) 5.28% 5.44% 5.55%
Yahoo! (www.yahoo.com) 4.31% 4.40% 4.45%
MSN (www.msn.com) 3.56% 3.54% 3.54%
Windows Live Mail (mail.live.com) 2.08% 2.07% 3.16%
eBay (www.ebay.com) 2.59% 2.83% 2.87%
Total, top Six 30.26% 30.63% 31.24%
Note: *upstream sites are those visited immediately prior to individual
search engine visit
Source: Hitwise, provided to eMarketer, December 2007; eMarketer
calculations, December 2007
090416 www.eMarketer.com
Total US Internet User Visitor Shares at the Top 10
Upstream and Downstream Sites*, by Search Engine,
May-October 2007
May Jun Jul Aug Sep Oct
Upstream
Google
(www.google.com)
37.8% 38.7% 37.3% 36.1% 37.1% 37.7%
Ask (www.ask.com) 46.4% 44.9% 43.1% 43.1% 44.3% 43.0%
Yahoo! Search
(search.yahoo.com)
69.6% 69.0% 70.7% 72.8% 73.0% 73.5%
MSN Search
(search.msn.com)
72.2% 72.4% 76.4% 80.6% 81.5% 80.7%
Downstream
Ask (www.ask.com) 14.0% 13.7% 12.3% 12.3% 12.8% 13.0%
Yahoo! Search
(search.yahoo.com)
14.1% 14.5% 14.0% 13.8% 13.8% 13.7%
MSN Search
(search.msn.com)
16.8% 17.3% 16.1% 15.1% 14.9% 14.9%
Google
(www.google.com)
15.8% 15.7% 14.9% 14.9% 14.8% 14.8%
Note: *upstream sites are those visited immediately prior to individual
search engine visit; downstream sites are those visited immediately after
individual search engine visit
Source: Hitwise, provided to eMarketer, December 2007; eMarketer
calculations, December 2007
090415 www.eMarketer.com
21. Search Engine Marketing 21
People Who Search
For search marketers, the implication here might be to
accompany search ads on those two engines with display ads on
the related portals, considering how many people go from one to
the other.
090417
090431
Downstream activity—that is, where people go after leaving a
search engine—is far more spread out than upstream traffic
patterns.Therefore, sites that appear often on search results—
notably Wikipedia and eBay—appear on the top six list for all four
large search engines.
090433
090434
090435
Top Six Upstream* Sites that US Internet Users Visit
Immediately before Visiting Yahoo! Search, Ranked by
Visitor Share, August-October 2007
Aug Sep Oct
Yahoo! (www.yahoo.com) 50.33% 50.36% 50.90%
Yahoo! Mail (mail.yahoo.com) 10.64% 11.06% 11.13%
MySpace (www.myspace.com) 4.23% 4.28% 3.97%
My Yahoo! (my.yahoo.com) 2.02% 2.11% 2.20%
Google (www.google.com) 1.11% 1.17% 1.20%
eBay (www.ebay.com) - 1.08% 1.06%
Yahoo! Image Search
(images.search.yahoo.com)
1.32% - -
Total, top 6 69.65% 70.06% 70.45%
Note: *upstream sites are those visited immediately prior to individual
search engine visit
Source: Hitwise, provided to eMarketer, December 2007; eMarketer
calculations, December 2007
090417 www.eMarketer.com
Top Six Upstream* Sites that US Internet Users Visit
Immediately before Visiting MSN Search, Ranked by
Visitor Share, August-October 2007
Aug Sep Oct
MSN (www.msn.com) 67.41% 69.28% 69.72%
Windows Live Mail (mail.live.com) 1.06% 1.82% 2.55%
MySpace (www.myspace.com) 1.86% 1.70% 1.63%
Windows Live Hotmail (www.hotmail.com) 5.76% 3.97% 1.62%
My MSN (my.msn.com) 1.07% 1.31% 1.29%
MSN Image Search (search.msn.com/images) - - 0.98%
Google (www.google.com) 0.94% 0.90% -
Total, top six 78.10%78.97%77.80%
Note: *upstream sites are those visited immediately prior to individual
search engine visit
Source: Hitwise, provided to eMarketer, December 2007; eMarketer
calculations, December 2007
090431 www.eMarketer.com
Top Six Downstream* Sites that US Internet Users
Visit Immediately after Visiting Google, by Visitor
Shares, August-October 2007 (% of total)
Aug Sep Oct
Google Image Search (images.google.com) 4.34% 4.45% 4.53%
Wikipedia (www.wikipedia.org) 1.81% 2.12% 2.16%
MySpace (www.myspace.com) 2.50% 2.17% 2.03%
Gmail (www.gmail.com) 1.33% 1.35% 1.36%
eBay (www.ebay.com) 1.03% 1.04% 1.03%
Yahoo! Mail (mail.yahoo.com) - 0.81% 0.80%
YouTube (www.youtube.com) 0.84% - -
Total, top six 11.85% 11.94% 11.91%
Note: *downstream sites are those visited immediately after individual
search engine visit
Source: Hitwise, provided to eMarketer, December 2007; eMarketer
calculations, December 2007
090433 www.eMarketer.com
Top Six Downstream* Sites that US Internet Users
Visit Immediately after Visiting Yahoo! Search,Ranked
by Visitor Share, August-October 2007
Aug Sep Oct
MySpace (www.myspace.com) 3.43% 3.00% 2.82%
Yahoo! Image Search
(images.search.yahoo.com)
1.92% 1.98% 2.02%
Wikipedia (www.wikipedia.org) 1.54% 1.76% 1.80%
Google (www.google.com) 1.51% 1.59% 1.61%
eBay (www.ebay.com) 1.19% 1.29% 1.32%
Yahoo! Mail (mail.yahoo.com) 1.13% 1.16% 1.08%
Total, top six 10.73% 10.79% 10.66%
Note: *downstream sites are those visited immediately after individual
search engine visit
Source: Hitwise, provided to eMarketer, December 2007; eMarketer
calculations, December 2007
090434 www.eMarketer.com
Top Six Downstream* Sites that US Internet Users
Visit Immediately after Visiting MSN Search, Ranked
by Visitor Share, August-October 2007
Aug Sep Oct
MySpace (www.myspace.com) 3.92% 3.49% 3.03%
Google (www.google.com) 2.88% 2.99% 2.65%
MSN Image Search (search.msn.com/images) - - 1.70%
Wikipedia (www.wikipedia.org) 1.22% 1.44% 1.42%
eBay (www.ebay.com) 1.71% 1.69% 1.32%
Yahoo! (www.yahoo.com) 1.30% 1.30% 1.15%
Yahoo! Mail (mail.yahoo.com) 1.05% 0.97% -
Total, top six 12.07%11.88%11.28%
Note: *downstream sites are those visited immediately after individual
search engine visit
Source: Hitwise, provided to eMarketer, December 2007; eMarketer
calculations, December 2007
090435 www.eMarketer.com
22. Search Engine Marketing 22
People Who Search
090436
How Many Searches Do People Conduct?
When it comes to reckoning shares of total searches—and not just
unique-visitor shares, where there can be overlap—Google is the
clear preference among US Internet users.
In data from Hitwise, people conducted up to 65% of their monthly
searches on Google in the April to September 2007 period.Yahoo!
Search trailed each month with about one-third of Google’s total,
and, in that light, every other search engine collected a minuscule
proportion of searches.
090322
The next two charts from Compete indicate relatively profound shifts
in where people search.In the first 10 months of 2006,about 54% of
searches took place on Google,with about 27% onYahoo! Search.
090437
However, in the corresponding months of 2007, Google’s monthly
search share grew as high as 68%, while Yahoo! Search slipped to
a mere 18% share. Some might say that Google is pulling away
from the pack.
090451
Top Six Downstream* Sites that US Internet Users
Visit Immediately after Visiting Ask.com, Ranked by
Visitor Share, August-October 2007
Aug Sep Oct
Ask Images (images.ask.com) 3.59% 4.09% 4.39%
Google (www.google.com) 1.92% 2.03% 2.13%
MySpace (www.myspace.com) 2.13% 2.01% 1.90%
Wikipedia (www.wikipedia.org) 1.01% 1.29% 1.33%
Yahoo! (www.yahoo.com) 0.76% 0.75% 0.72%
Yahoo! Mail (mail.yahoo.com) - 0.60% 0.58%
eBay (www.ebay.com) 0.68% - -
Total, top six 10.09% 10.76% 11.05%
Note: *downstream sites are those visited immediately after individual
search engine visit
Source: Hitwise, provided to eMarketer, December 2007; eMarketer
calculations, December 2007
090436 www.eMarketer.com
Share of Online Searches in the US, by Search Engine,
April-September 2007 (% of total)
Apr May Jun Jul Aug Sep
www.google.com 65.3% 65.1% 63.9% 64.4% 64.0% 63.6%
search.yahoo.com 20.7% 20.9% 21.3% 22.1% 22.9% 22.6%
search.msn.com 7.8% 7.6% 7.7% 7.0% 6.5% 6.3%
www.ask.com 3.7% 3.9% 3.4% 3.2% 3.5% 4.3%
www.live.com* 0.7% 0.8% 2.1% 1.8% 1.5% 1.6%
www.aolsearch.com 0.4% 0.4% 0.3% 0.4% 0.4% 0.4%
Other search engines 1.4% 1.3% 1.2% 1.2% 1.3% 1.4%
Note: April period=4 weeks ending April 28; May period=4 weeks ending
May 26; June period=4 weeks ending June 30; July period=4 weeks ending
July 28; August period=4 weeks ending September 1; September period=4
weeks ending September 29; *the search volume share reported for
www.live.com starting week ending June 9 through July 9 includes
searches automatically generated from a promotion on club.live.com
Source: Hitwise, provided to eMarketer, November 2007
090322 www.eMarketer.com
Share of Online Searches in the US, by Search Engine
Provider, January-October 2006
Google Yahoo! MSN/Live Ask Other
Jan 51.1% 27.7% 11.0% 5.0% 5.2%
Feb 53.0% 26.0% 11.0% 5.0% 5.0%
Mar 53.0% 26.0% 12.0% 5.0% 4.0%
Apr 53.2% 26.8% 10.7% 4.7% 4.6%
May 54.4% 26.3% 10.3% 4.8% 4.2%
Jun 55.2% 26.7% 10.1% 4.1% 3.9%
Jul 54.8% 27.7% 10.2% 3.7% 3.6%
Aug 54.9% 27.9% 9.9% 3.7% 3.6%
Sep 54.3% 29.2% 8.9% 4.4% 3.2%
Oct 54.4% 29.6% 8.5% 4.3% 3.2%
Note: excludes affiliate or syndicated search
Source: Compete Inc. as cited in company blog, February-November 2007;
eMarketer calculations, December 2007
090437 www.eMarketer.com
Share of Online Searches in the US, by Search Engine
Provider, January-October 2007
Google Yahoo! MSN/Live* Ask Other
Jan 61.7% 23.1% 8.5% 3.6% 3.1%
Feb 63.0% 21.0% 9.0% 3.0% 4.0%
Mar 64.7% 19.7% 9.5% 3.4% 2.7%
Apr 66.1% 20.4% 8.1% 3.2% 2.2%
May 67.0% 19.7% 8.4% 3.5% 1.4%
Jun 65.6% 20.5% 9.1% 3.5% 1.3%
Jul 65.9% 19.7% 10.1% 3.1% 1.2%
Aug 66.6% 19.8% 9.4% 3.1% 1.1%
Sep 67.0% 19.0% 9.2% 3.6% 1.2%
Oct 68.0% 18.1% 9.2% 3.9% 0.8%
Note: excludes affiliate or syndicated search; *excludes MSN/Live's
ClubLive promotion in June 2007
Source: Compete Inc. as cited in company blog, February-November 2007;
eMarketer calculations, December 2007
090451 www.eMarketer.com
23. Search Engine Marketing 23
People Who Search
Search query share data from Nielsen and comScore also peg
Google as No. 1 and Yahoo! Search as No. 2, but not by as large
margins as Hitwise or Compete. In September 2007, Google’s
share was either 54% (Nielsen) or 57% (comScore).
090319
090339
Even with comScore’s “expanded search rankings,” which
measure a larger search universe, people conducted 50.6% of
their searches on Google sites in September 2007.
090354
Does Google’s dominance here imply marketers should just follow
the audience by placing most of their paid search ad dollars on the
search giant? Not necessarily so.
Google’s greater popularity among the search audience is
matched by its popularity among marketers.That causes most
search keywords to get, by auction, higher per-click prices than at
the other search engines.Therefore, just to be effective, a search
marketing campaign needs to consider how spreading its ad
budget among several search engines might give greater reach at
the same, or perhaps even at a lower cost.
In absolute numbers, how many searches do people in the US do
monthly? The Nielsen data say nearly 7.4 billion in September
2007, up from about 6.8 billion in April.
090317
Share of Search Queries Performed by US Internet
Users, by Search Engine Provider*, April-September
2007 (% of total and billions)
Apr May Jun Jul Aug Sep
Google 55.2% 56.3% 52.7% 53.3% 53.6% 54.0%
Yahoo! 21.9% 21.5% 20.2% 20.1% 19.9% 19.5%
MSN/Windows Live 9.0% 8.4% 13.3% 13.6% 12.9% 12.0%
AOL 5.4% 5.3% 5.5% 5.2% 5.6% 6.0%
Ask.com 1.8% 2.0% 2.1% 1.8% 1.7% 2.2%
My Web 1.0% 0.9% 1.0% 0.9% 0.9% 0.8%
Comcast 0.5% 0.5% 0.4% 0.5% 0.4% 0.5%
BellSouth - 0.4% 0.4% 0.5% 0.5% 0.5%
My Way 0.4% - 0.5% 0.3% 0.4% 0.4%
SBC Yellow Pages - - - - 0.4% 0.4%
Dogpile.com 0.4% 0.4% 0.4% 0.3% - -
EarthLink 0.4% 0.5% - - - -
Other 3.9% 3.8% 3.6% 3.4% 3.5% 3.6%
Total (billions) 6.84 7.17 7.41 7.77 7.83 7.39
Note: among home and work users; *top 10 for each month
Source: Nielsen Online, “MegaView Search," provided to eMarketer,
November 2007; eMarketer calculations, November 2007
090319 www.eMarketer.com
Share of Search Queries Performed by US Internet
Users, by Search Engine Provider*, June-September
2007 (% of total and billions)
Jun Jul Aug Sep
Google sites 54.9% 55.2% 56.5% 57.0%
Yahoo! sites 23.8% 23.5% 23.3% 23.7%
Microsoft sites 12.2% 12.3% 11.3% 10.3%
Ask Network 4.6% 4.7% 4.5% 4.7%
Time Warner Network 4.5% 4.4% 4.5% 4.3%
Total (billions) 9.71 9.90 9.82 9.40
Note: among home, work and university users; *comScore's "core search
report" is based on the five major search engines, and includes partner
searches and cross-channel searches for each property; excludes searches
for mapping, local directory and user-generated video sites that are not in
the core domain of the five search engines
Source: comScore qSearch 2.0 as cited in press releases, July-October
2007
090339 www.eMarketer.com
Share of Search Queries Performed by US Internet
Users, by Search Engine Provider, April-September
2007 (% of total and billions)
Apr May Jun Jul Aug Sep
Google sites 48.1% 48.6% 47.7% 48.3% 49.7% 50.6%
Yahoo! sites 19.9% 20.0% 18.9% 18.4% 18.0% 18.3%
Time Warner Network 7.6% 7.2% 7.3% 7.0% 6.8% 6.5%
Microsoft sites 7.2% 7.3% 9.1% 9.1% 8.3% 7.7%
Ask Network 3.3% 3.3% 3.4% 3.4% 3.2% 3.4%
Top five 86.1% 86.4% 86.3% 86.3% 86.1% 86.5%
Other 13.9% 13.6% 13.7% 13.7% 13.9% 13.5%
Total Internet (billions) 12.07 12.48 13.39 13.70 13.70 13.02
Source: comScore qSearch 2.0, "Expanded Search Report for the US,"
provided to eMarketer, November 2007; eMarketer calculations,
November 2007
090354 www.eMarketer.com
Number of Search Queries Performed by US Internet
Users, by Search Engine Provider*, April-September
2007 (millions)
Apr May Jun Jul Aug Sep
Google 3,773.0 4,033.3 3,906.9 4,143.8 4,199.5 3,994.2
Yahoo! 1,497.2 1,540.9 1,496.1 1,559.7 1,561.9 1,443.2
MSN/Windows Live 612.5 605.4 985.7 1,057.1 1,011.4 890.7
AOL 371.0 382.0 404.0 408.0 435.1 444.5
Ask.com 126.3 142.4 152.3 143.5 136.9 159.0
My Web 68.0 61.8 76.8 69.1 71.7 61.9
Comcast 35.2 34.9 30.5 37.3 34.7 38.9
BellSouth - 30.1 30.9 40.4 37.8 35.7
SBC Yellow Pages - - - - 31.9 29.4
My Way 26.8 - 35.6 24.5 32.5 26.8
Dogpile.com 28.6 26.3 30.5 25.7 - -
EarthLink 30.0 33.5 - - - -
Other 268.5 274.8 264.1 265.1 276.1 269.0
Total 6,837.1 7,165.4 7,413.4 7,774.2 7,829.4 7,393.3
Note: among home and work users; *top 10 for each month
Source: Nielsen Online, “MegaView Search," provided to eMarketer,
November 2007; eMarketer calculations, November 2007
090317 www.eMarketer.com
24. Search Engine Marketing 24
People Who Search
Despite its focus on just the top four search engines, the Compete
monthly figure for September 2007 is almost 7.7 billion, with about
1.2 billion more searches at Google alone than in the Nielsen data.
090452
Even with its narrowed focus on the five core search engines,
comScore put September 2007 US search queries at 9.4 billion, a
lesser figure than during any of the three prior months.
090329
Within its “expanded search rankings,” the September 2007 total
jumps to more than 13 billion search queries, a nearly 1 billion gain
over the April figure of 12.1 billion.
090351
With the significant variations in the number of search queries
among the three researchers shown, the question naturally arises:
Whose number is most accurate? Perhaps a better perspective,
though, is gained by looking at search query share, as in the charts
leading off this section.
Likely more than any other data in this report, the average number
of queries per user per month demonstrates the pervasive nature
of search. From Nielsen’s perspective, that figure hit 54.9 per
person in September 2007; comScore pegged it at 70.4 searches
on average. In either case, and no matter how they’re counted, the
majority of all search queries represent potential marketing
opportunities, whether through ads or natural rankings boosted
by SEO.
090320
090374
Number of Searches in the US, by Search Engine
Provider, July-October 2007 (millions)
Google Yahoo! MSN/Live Ask Total, top
four
Jul 4,798 1,438 739 224 7,199
Aug 4,965 1,477 703 228 7,373
Sep 5,214 1,483 717 277 7,691
Oct 5,448 1,453 737 316 7,954
Note: excludes affiliate or syndicated search; top 4 total represents 98.8%
of all searches (July), 98.9% (August), 98.8% (September), 99.2% (October)
Source: Compete Inc. as cited in company blog, February-November 2007;
eMarketer calculations, December 2007
090452 www.eMarketer.com
Number of Search Queries Performed by US Internet
Users, by Search Engine Provider*, June-September
2007 (millions)
Jun Jul Aug Sep
Google sites 5,330 5,459 5,545 5,356
Yahoo! sites 2,307 2,325 2,290 2,227
Microsoft sites 1,181 1,214 1,106 969
Ask Network 449 462 438 444
Time Warner Network 440 436 441 405
Total 9,707 9,896 9,820 9,401
Note: among home, work and university users; *comScore's "core search
report" is based on the five major search engines, and includes partner
searches and cross-channel searches for each property; excludes searches
for mapping, local directory and user-generated video sites that are not in
the core domain of the five search engines
Source: comScore qSearch 2.0 as cited in press releases, July-October
2007
090329 www.eMarketer.com
Number of Search Queries Performed by US Internet
Users, by Search Engine Provider, April-September
2007 (millions)
Google sites
Yahoo! sites
Time Warner Network
Microsoft sites
Ask Network
Other
Total Internet
Apr
5,812
2,402
915
864
397
1,681
12,072
May
6,066
2,494
897
906
418
1,699
12,480
Jun
6,385
2,524
971
1,223
449
1,837
13,388
Jul
6,614
2,524
959
1,251
462
1,881
13,692
Aug
6,809
2,473
937
1,144
439
1,900
13,703
Sep
6,593
2,381
843
999
445
1,758
13,018
Source: comScore qSearch 2.0, "Expanded Search Report for the US,"
provided to eMarketer, November 2007; eMarketer calculations,
November 2007
090351 www.eMarketer.com
Average Number of Online Searches per US Unique
Searcher, by Search Engine Provider*,
April-September 2007
Apr May Jun Jul Aug Sep
Google 28.7 30.8 29.4 30.5 31.0 29.7
Yahoo! 11.4 11.8 11.2 11.5 11.5 10.7
MSN/Windows Live 4.7 4.6 7.4 7.8 7.5 6.6
AOL 2.8 2.9 3.0 3.0 3.2 3.3
Ask.com 1.0 1.1 1.1 1.1 1.0 1.2
My Web 0.5 0.5 0.6 0.5 0.5 0.5
Comcast 0.3 0.3 0.2 0.3 0.3 0.3
BellSouth - 0.2 0.2 0.3 0.3 0.3
My Way 0.2 - 0.3 0.2 0.2 0.2
SBC Yellow Pages - - - - 0.2 0.2
Dogpile.com 0.2 0.2 0.2 0.2 - -
EarthLink 0.2 0.3 - - - -
Other 2.0 2.1 2.0 2.0 2.0 2.0
Total 52.0 54.7 55.7 57.2 57.8 54.9
Note: among home and work users; *top 10 for each month
Source: Nielsen Online, “MegaView Search," provided to eMarketer,
November 2007; eMarketer calculations, November 2007
090320 www.eMarketer.com
Average Number of Online Searches per US Unique
Searcher, by Search Engine Provider, April-September
2007
Apr May Jun Jul Aug Sep
Google sites 43.7 44.9 46.1 47.3 47.8 46.4
Yahoo! sites 24.6 25.1 24.8 24.2 23.8 23.3
Time Warner Network 11.2 10.7 11.4 11.2 11.2 10.6
Microsoft sites 13.2 14.0 18.2 17.9 16.6 15.3
Ask Network 10.1 10.4 10.4 10.6 10.3 10.2
Total Internet 67.3 68.2 72.5 74.2 74.1 70.4
Source: comScore qSearch 2.0, "Expanded Search Report for the US,"
provided to eMarketer, November 2007; eMarketer calculations,
November 2007
090374 www.eMarketer.com
25. Search Engine Marketing 25
People Who Search
One last take on counting queries:Ask.com showed an
exceptionally large uptick in the average number of searches per
searcher in September 2007. In that same month, the search
engine also started a cross-media ad campaign to encourage use.
The two facts are most likely connected. Marketing might be a key
differentiator for competition among search engines, especially
with every site other than Google being an also-ran.
090321
How Do People Use Keywords?
When people enter search queries, what keywords do they use?
As a starting point, keywords—and their pricing—form the pivotal
core for search marketing campaigns.
So, what keywords do people use most? According to
Wordtracker, a keyword analysis firm that derives its data from
Infospace, a search aggregator, 23.2% of all keywords or search
terms entered in the August to October 2007 period were
entertainment related.Within that keyword category, only a
portion might be appropriate for search marketing campaigns.
At the other end, only 2.3% of keywords came from either the
health or the money and personal finance categories.Those are
two verticals in which many companies use search advertising to
boost traffic.And yet, with people searching for a limited number
of keywords, that implies greater pricing competition for related
search terms.
090385
A view of the top five keywords that people entered in each
category indicates several factors about the ways people use
search engines.Take the social networking category, for example.
Both MySpace and YouTube were searched for at least two
different ways.That indicates how various spellings need to be bid
on for any set of keywords.
Looking at the same category—or at the search sites,
communication or e-commerce categories—it seems that the top
searches might not be used so much to find things as they are to
index things, a substitute for Web browser bookmarks. Do people
really need to search for “Google” or “Hotmail.com” or “eBay” as
terms? That is doubtful.
Growth of Average Number of Online Searches per US
Unique Searcher, by Search Engine Provider*,
May-September 2007 (% change)
May Jun Jul Aug Sep
Ask.com 13.2% 5.2% -7.7% -4.4% 16.8%
Comcast -0.6% -14.1% 20.0% -6.7% 12.8%
AOL 3.3% 4.1% -1.1% 7.0% 2.7%
Google 7.3% -4.7% 3.9% 1.6% -4.4%
BellSouth - 0.8% 28.1% -6.2% -4.8%
Yahoo! 3.3% -4.5% 2.1% 0.4% -7.1%
SBC Yellow Pages - - - - -7.3%
MSN/Windows Live -0.8% 60.2% 5.0% -4.0% -11.5%
My Web -8.7% 22.3% -11.8% 4.0% -13.2%
My Way - - -32.6% 32.8% -17.2%
Dogpile.com -7.6% 13.9% -17.4% - -
EarthLink 11.9% - - - -
Other 2.7% -5.5% -1.7% 4.5% -2.0%
Total 5.2% 1.8% 2.7% 1.0% -5.1%
Note: among home and work users; *top 10 for each month
Source: Nielsen Online, “MegaView Search," provided to eMarketer,
November 2007; eMarketer calculations, November 2007
090321 www.eMarketer.com
Top 25 Keywords' Share of Each Category's Total
Keywords on Infospace, August-October 2007
Entertainment
23.2%
Search
13.9%
Social networking
13.5%
E-Commerce/shopping/product
13.1%
General information/general topics
7.9%
News
6.7%
Travel
6.5%
Communication
6.2%
Sports
4.2%
Health
2.3%
Money/personal finance
2.3%
Note: Percents calculated by taking the total number of search queries for
the top 25 keywords in each category generated within 90 days on
Infospace and dividing by the total number of search queries for the top 25
keywords in all of the 11 categories; no overtly "adult" elements have been
included
Source: Wordtracker, November 2007; eMarketer calculations, November
2007
090385 www.eMarketer.com
26. Search Engine Marketing 26
People Who Search
Categories such as health and money and personal finance tend
to garner more general terms.That implies that more searches,
rather than user laziness, are taking place.
090387
Over time,people do tend to enter more complex search queries.In
data comparing the average number of keywords per query in July
2004 with July 2006,one- and two-word queries both decreased,
while more Internet users went to three-or-more-word queries.
082318
Top Five Keywords per Category on Infospace,
August-October 2007 (% of each category's keywords)
Social
networking
% share
Search sites
% share
Commun-
ication
% share
Travel
% share
% share
News
Money/
personal
finance
% share
General
information/
general
topics
% share
Entertainment
% share
E-Commerce/
shopping/
product
% share
Health
% share
Sports
% share
#1
Myspace
25.04%
Google
19.26%
Hotmail
13.60%
Map-
quest
22.93%
Bank of
America
11.61%
Obituaries
12.08%
Baby boy
names
12.61%
Play
game
12.13%
eBay
17.57%
Doctor's
Excuse
9.11%
ESPN
7.30%
#2
Myspace.
com
14.76%
Yahoo
16.55%
Hotmail.
com
12.81%
Maps
7.14%
Jobs
9.06%
News-
paper
obituaries
8.66%
Dictionary
8.61%
Play
games
9.34%
Craigslist
7.95%
Finding
dental
care
7.12%
WWE
7.03%
#2
You-
tube
13.07%
Yahoo.com
10.33%
Yahoo
mail
11.17%
Map
quest
6.87%
Mortgage
calculator
8.99%
Helmsley's
trouble
7.95%
Wikipedia
8.48%
Vanessa
Hudgens
7.87%
Wallmart
4.90%
Web
md
6.58%
John
Sena
6.82%
#4
You
tube
8.14%
Google.com
4.56%
Gmail
5.33%
Airline
tickets
5.83%
Insur-
ance
7.85%
Weather
7.55%
Free
English
course
6.50%
Music
lyrics
6.91%
Home
Depot
4.79%
Web
MD
6.40%
NFL
Schedule
6.78%
#5 Top
five
total
Face
book
7.52%
MSN
4.52%
Comcast.
net
4.89%
Google
Earth
4.84%
Realtor.
com
6.48%
Local
newspaper
7.25%
Dogs
6.27%
Game
cheats
for ps2
5.27%
Webkinz
4.37%
Hearts
4.80%
Football
5.64%
68.53%
55.23%
47.79%
47.61%
44.00%
43.49%
42.47%
41.51%
39.58%
34.02%
33.58%
Note: Percents calculated by taking the total number of search queries for
the top 25 keywords in each category generated within 90 days on
Infospace and dividing by the total number of search queries for the top 25
keywords in all of the 11 categories; no overtly "adult" elements have been
included
Source: Wordtracker, November 2007; eMarketer calculations, November
2007
090387 www.eMarketer.com
Average Number of Keywords per Search Query Used
by Internet Users Worldwide, July 2004 & July 2006
One word
17%
11%
Two words
30%
29%
Three words
27%
28%
Four words
15%
17%
Five words
7%
8%
Six words
3%
4%
Seven words
1%
2%
July 2004 July 2006
Source: OneStat.com appearing in Piper Jaffray & Co., February 2007
082318 www.eMarketer.com