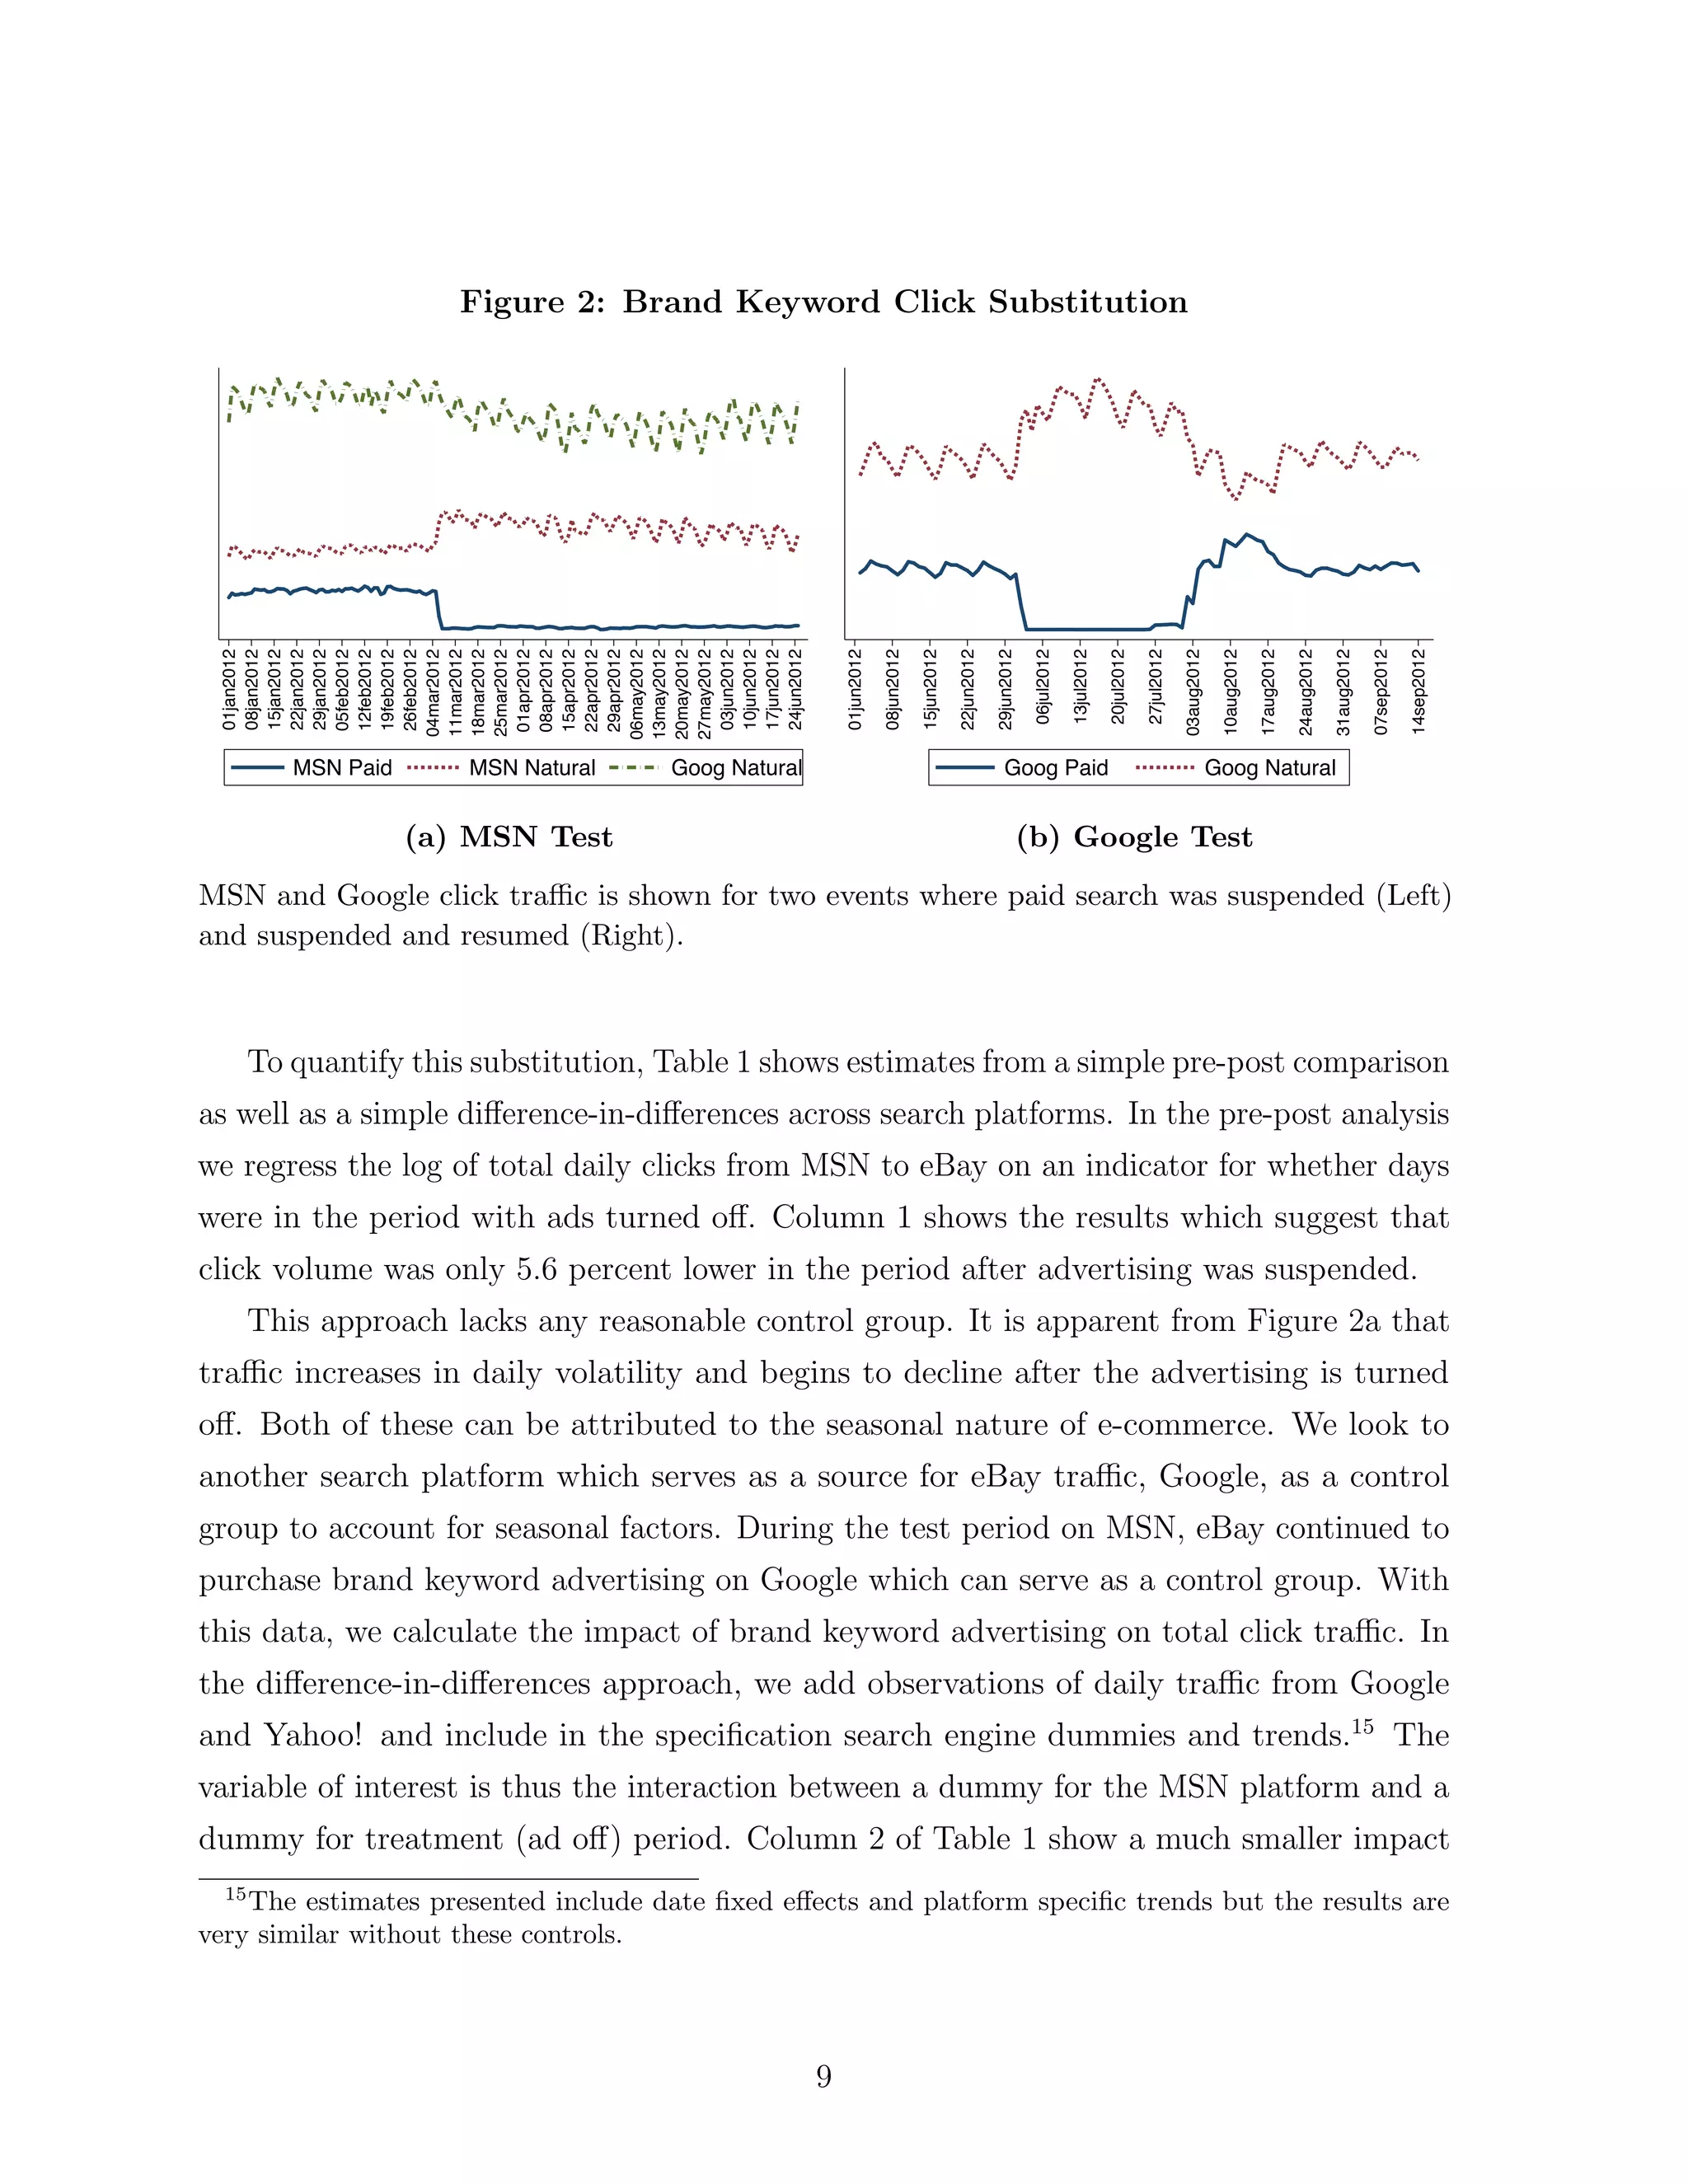
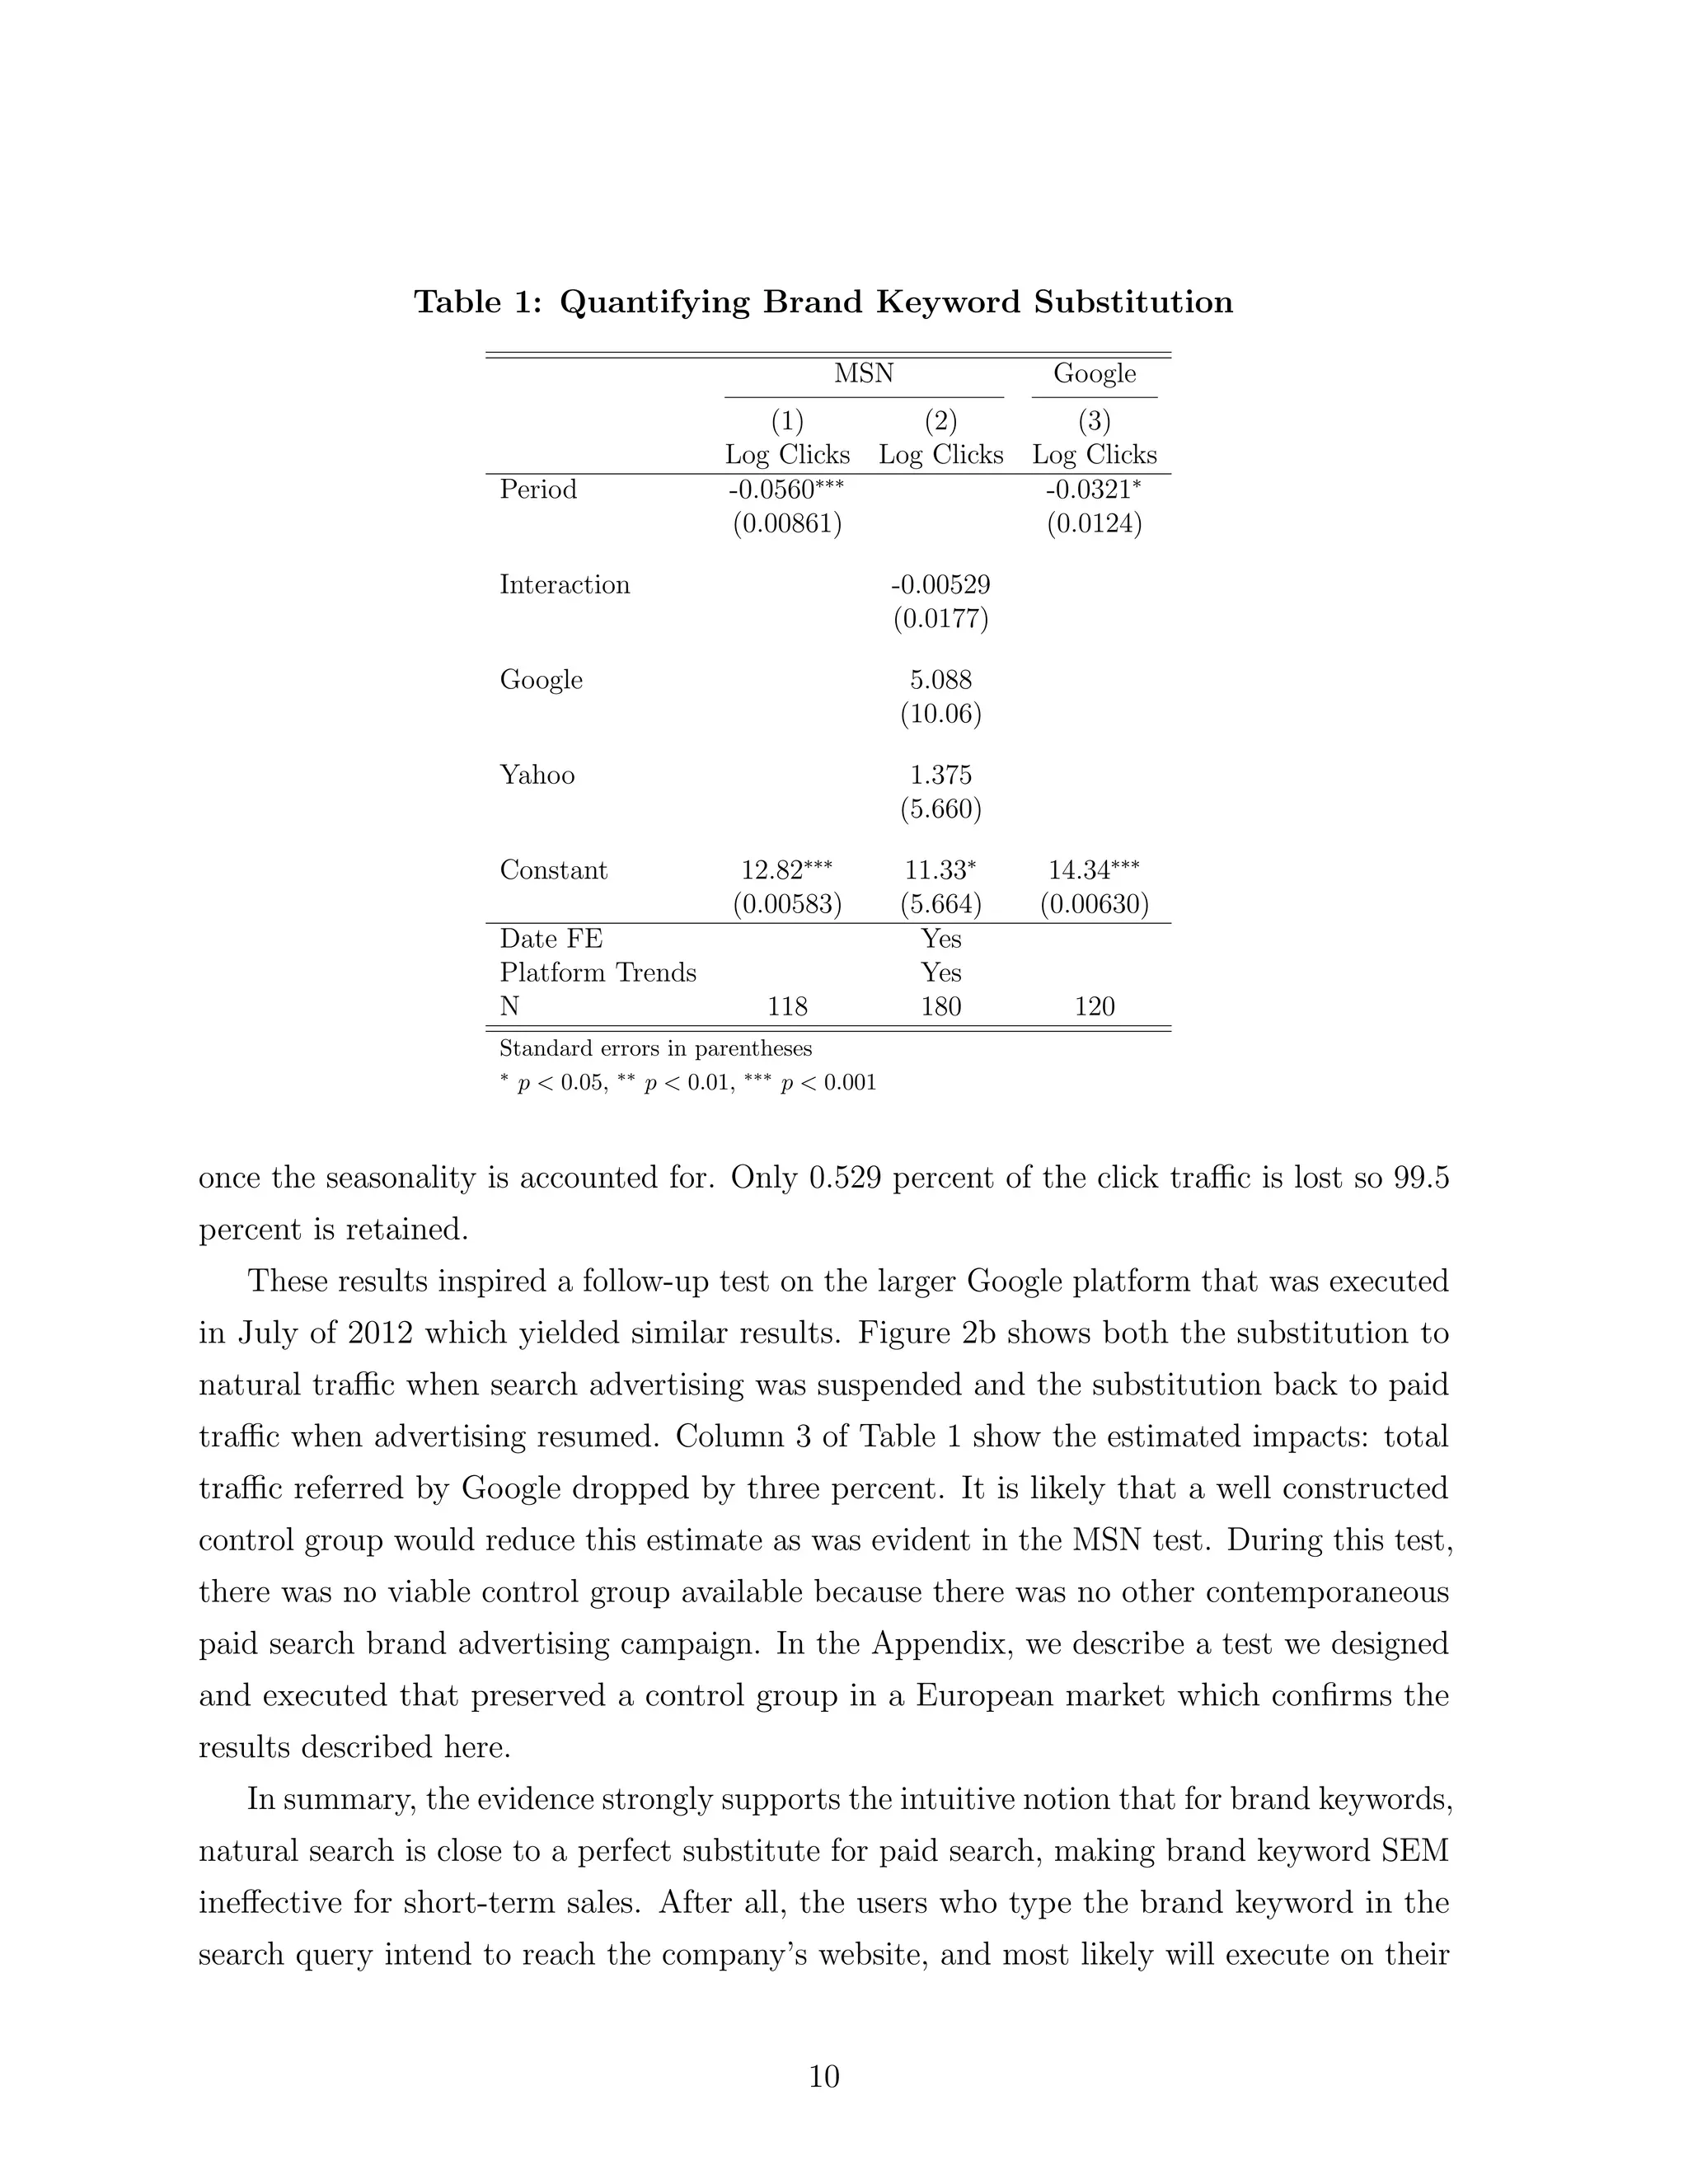
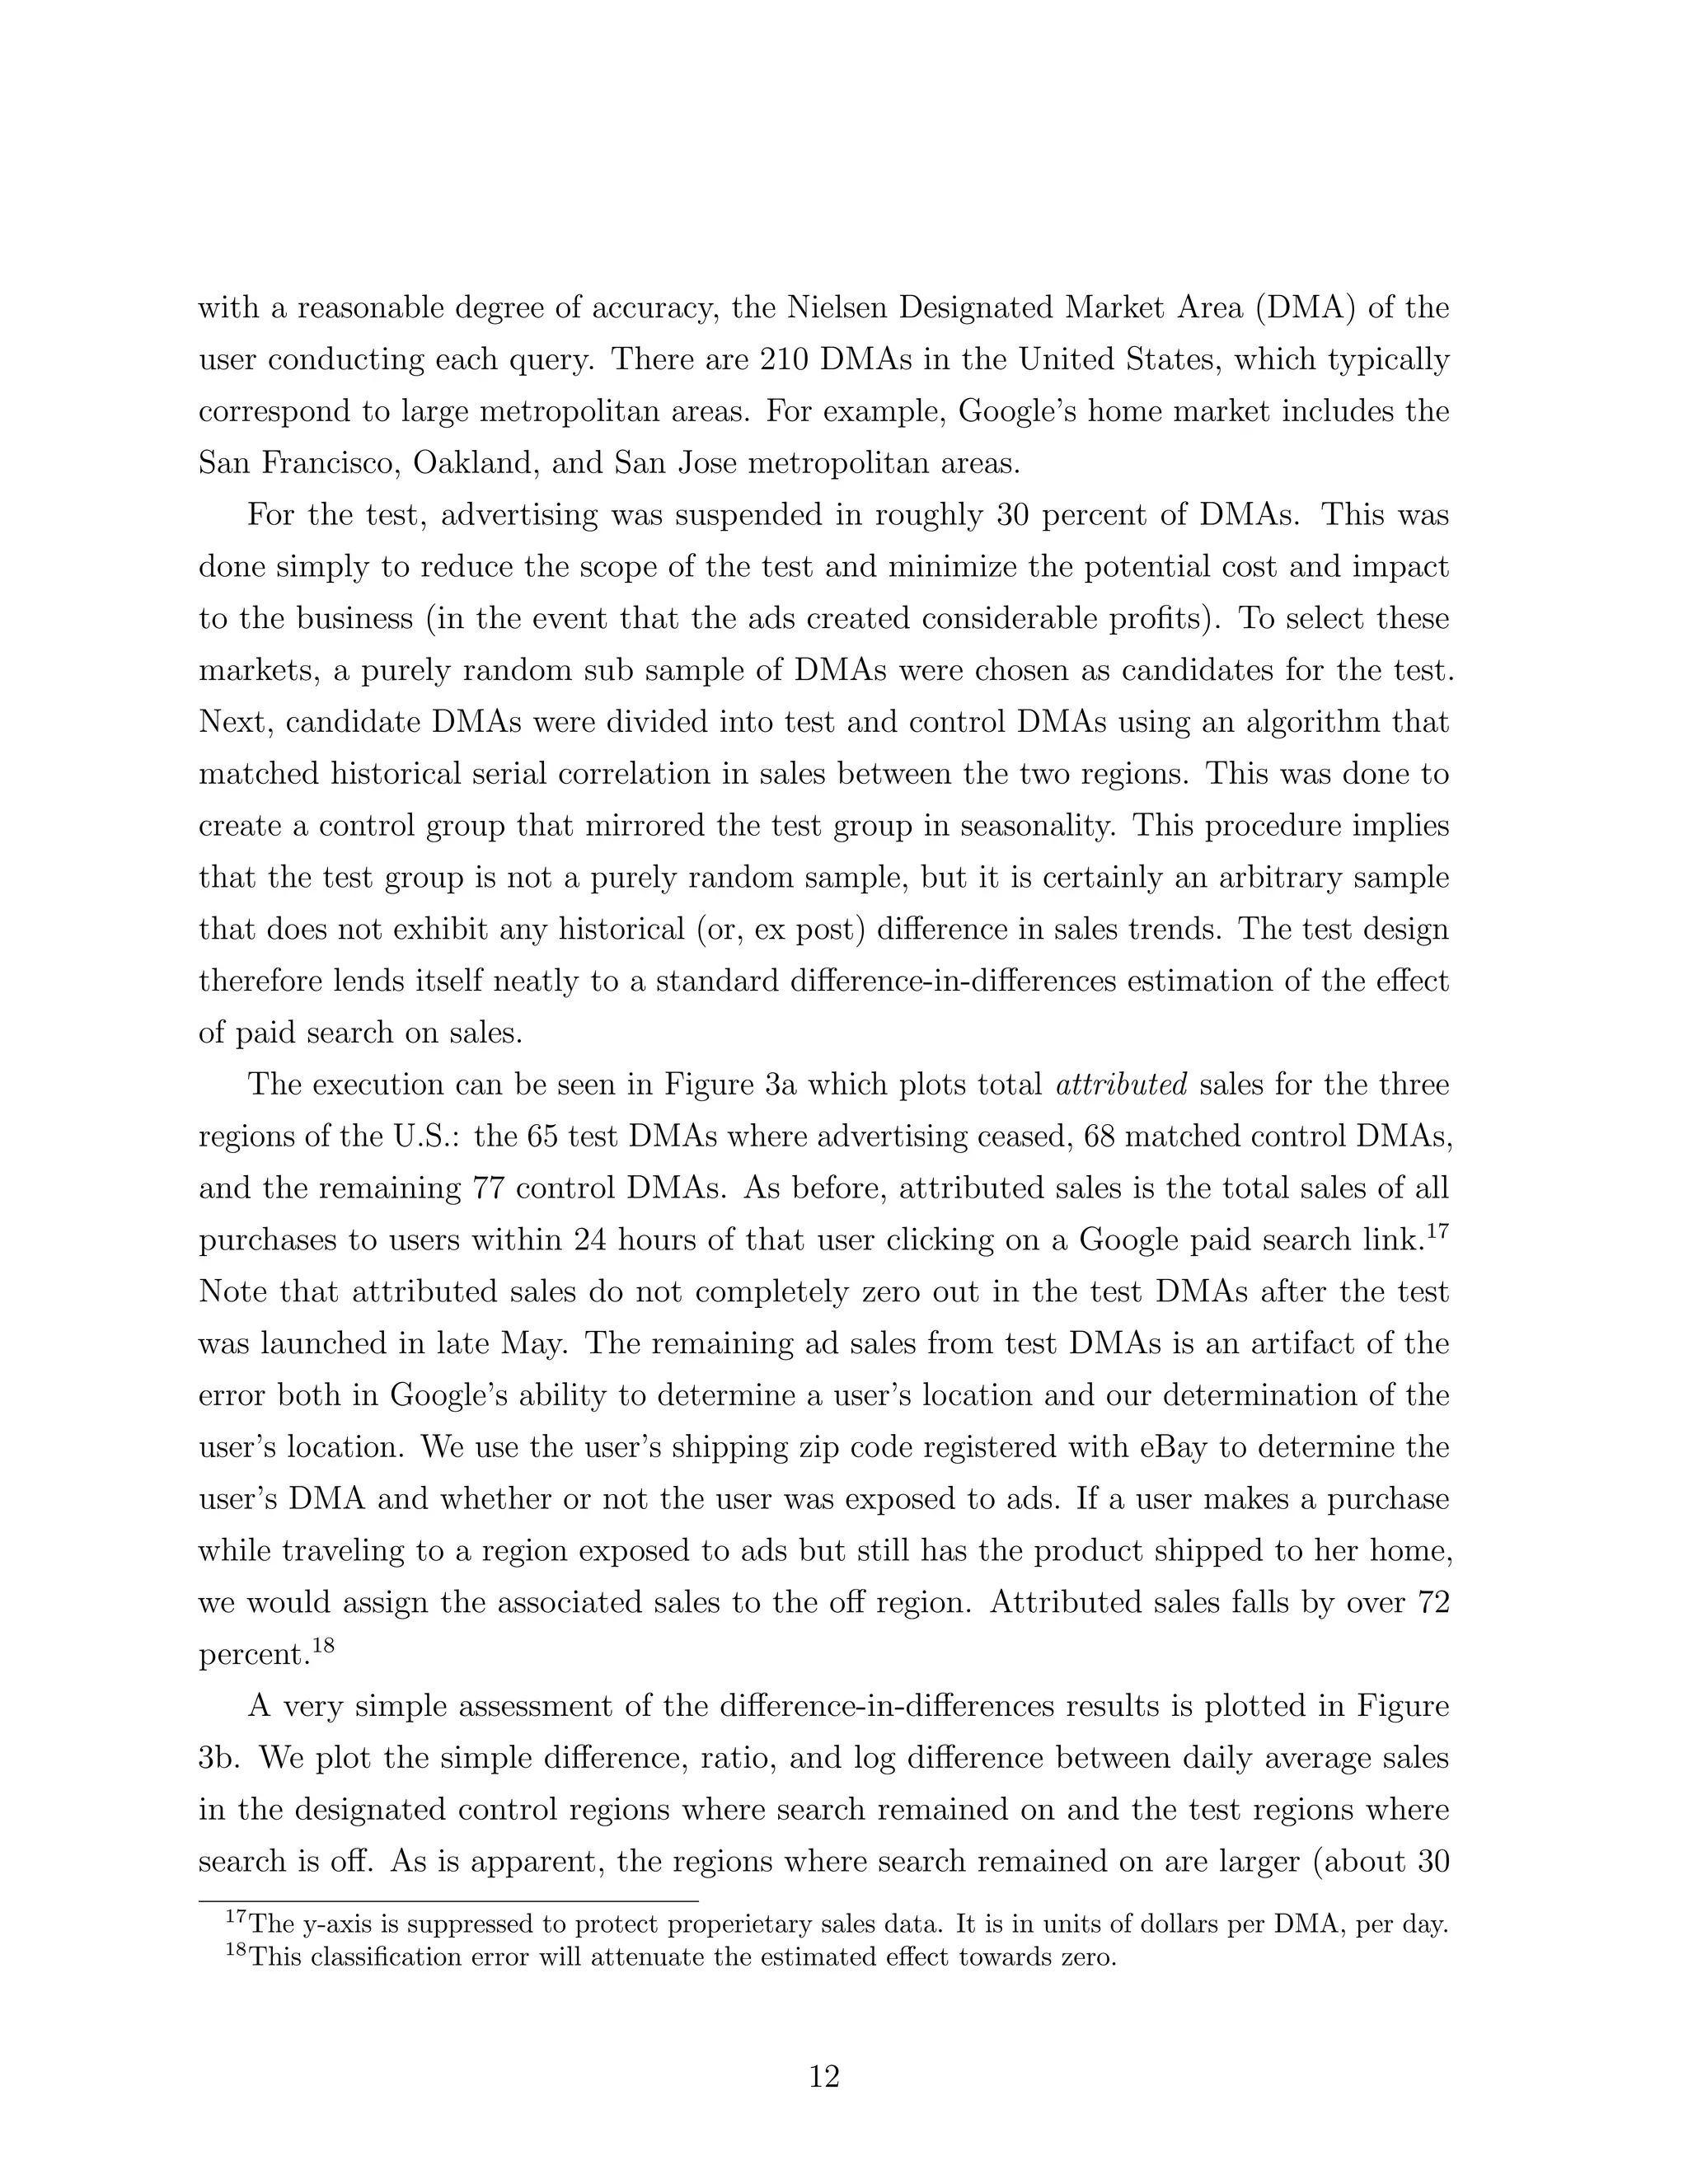
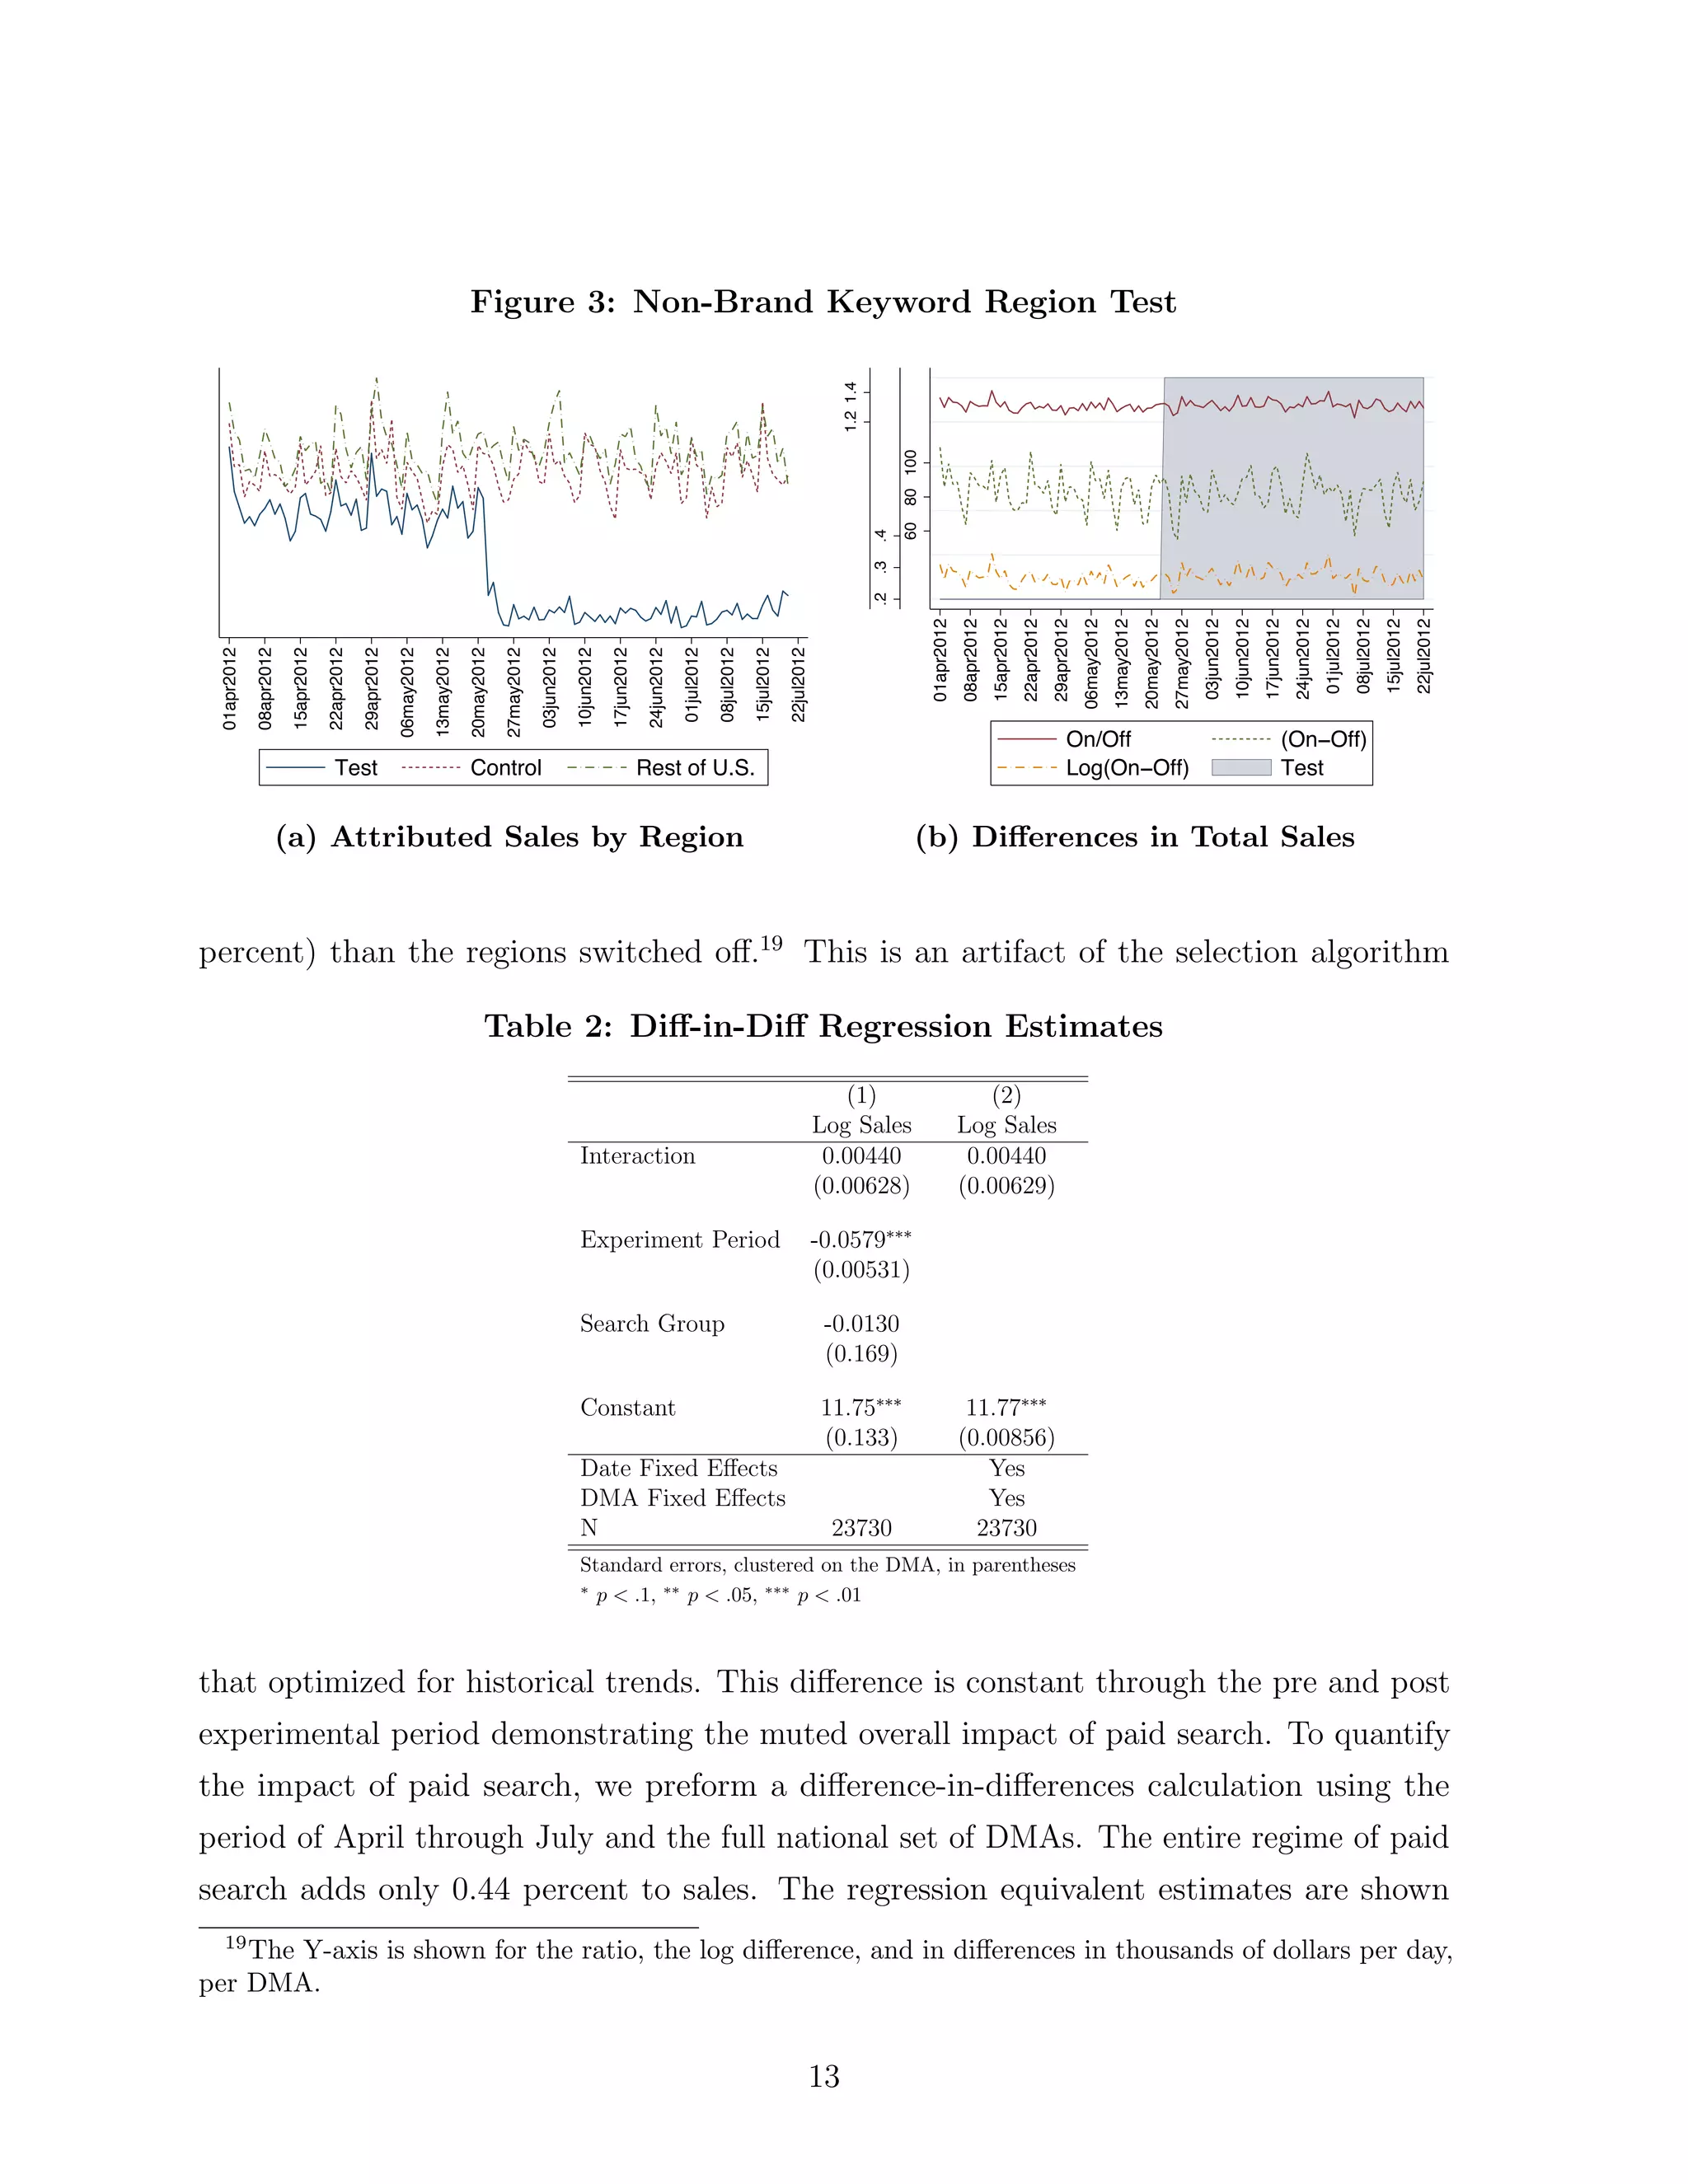
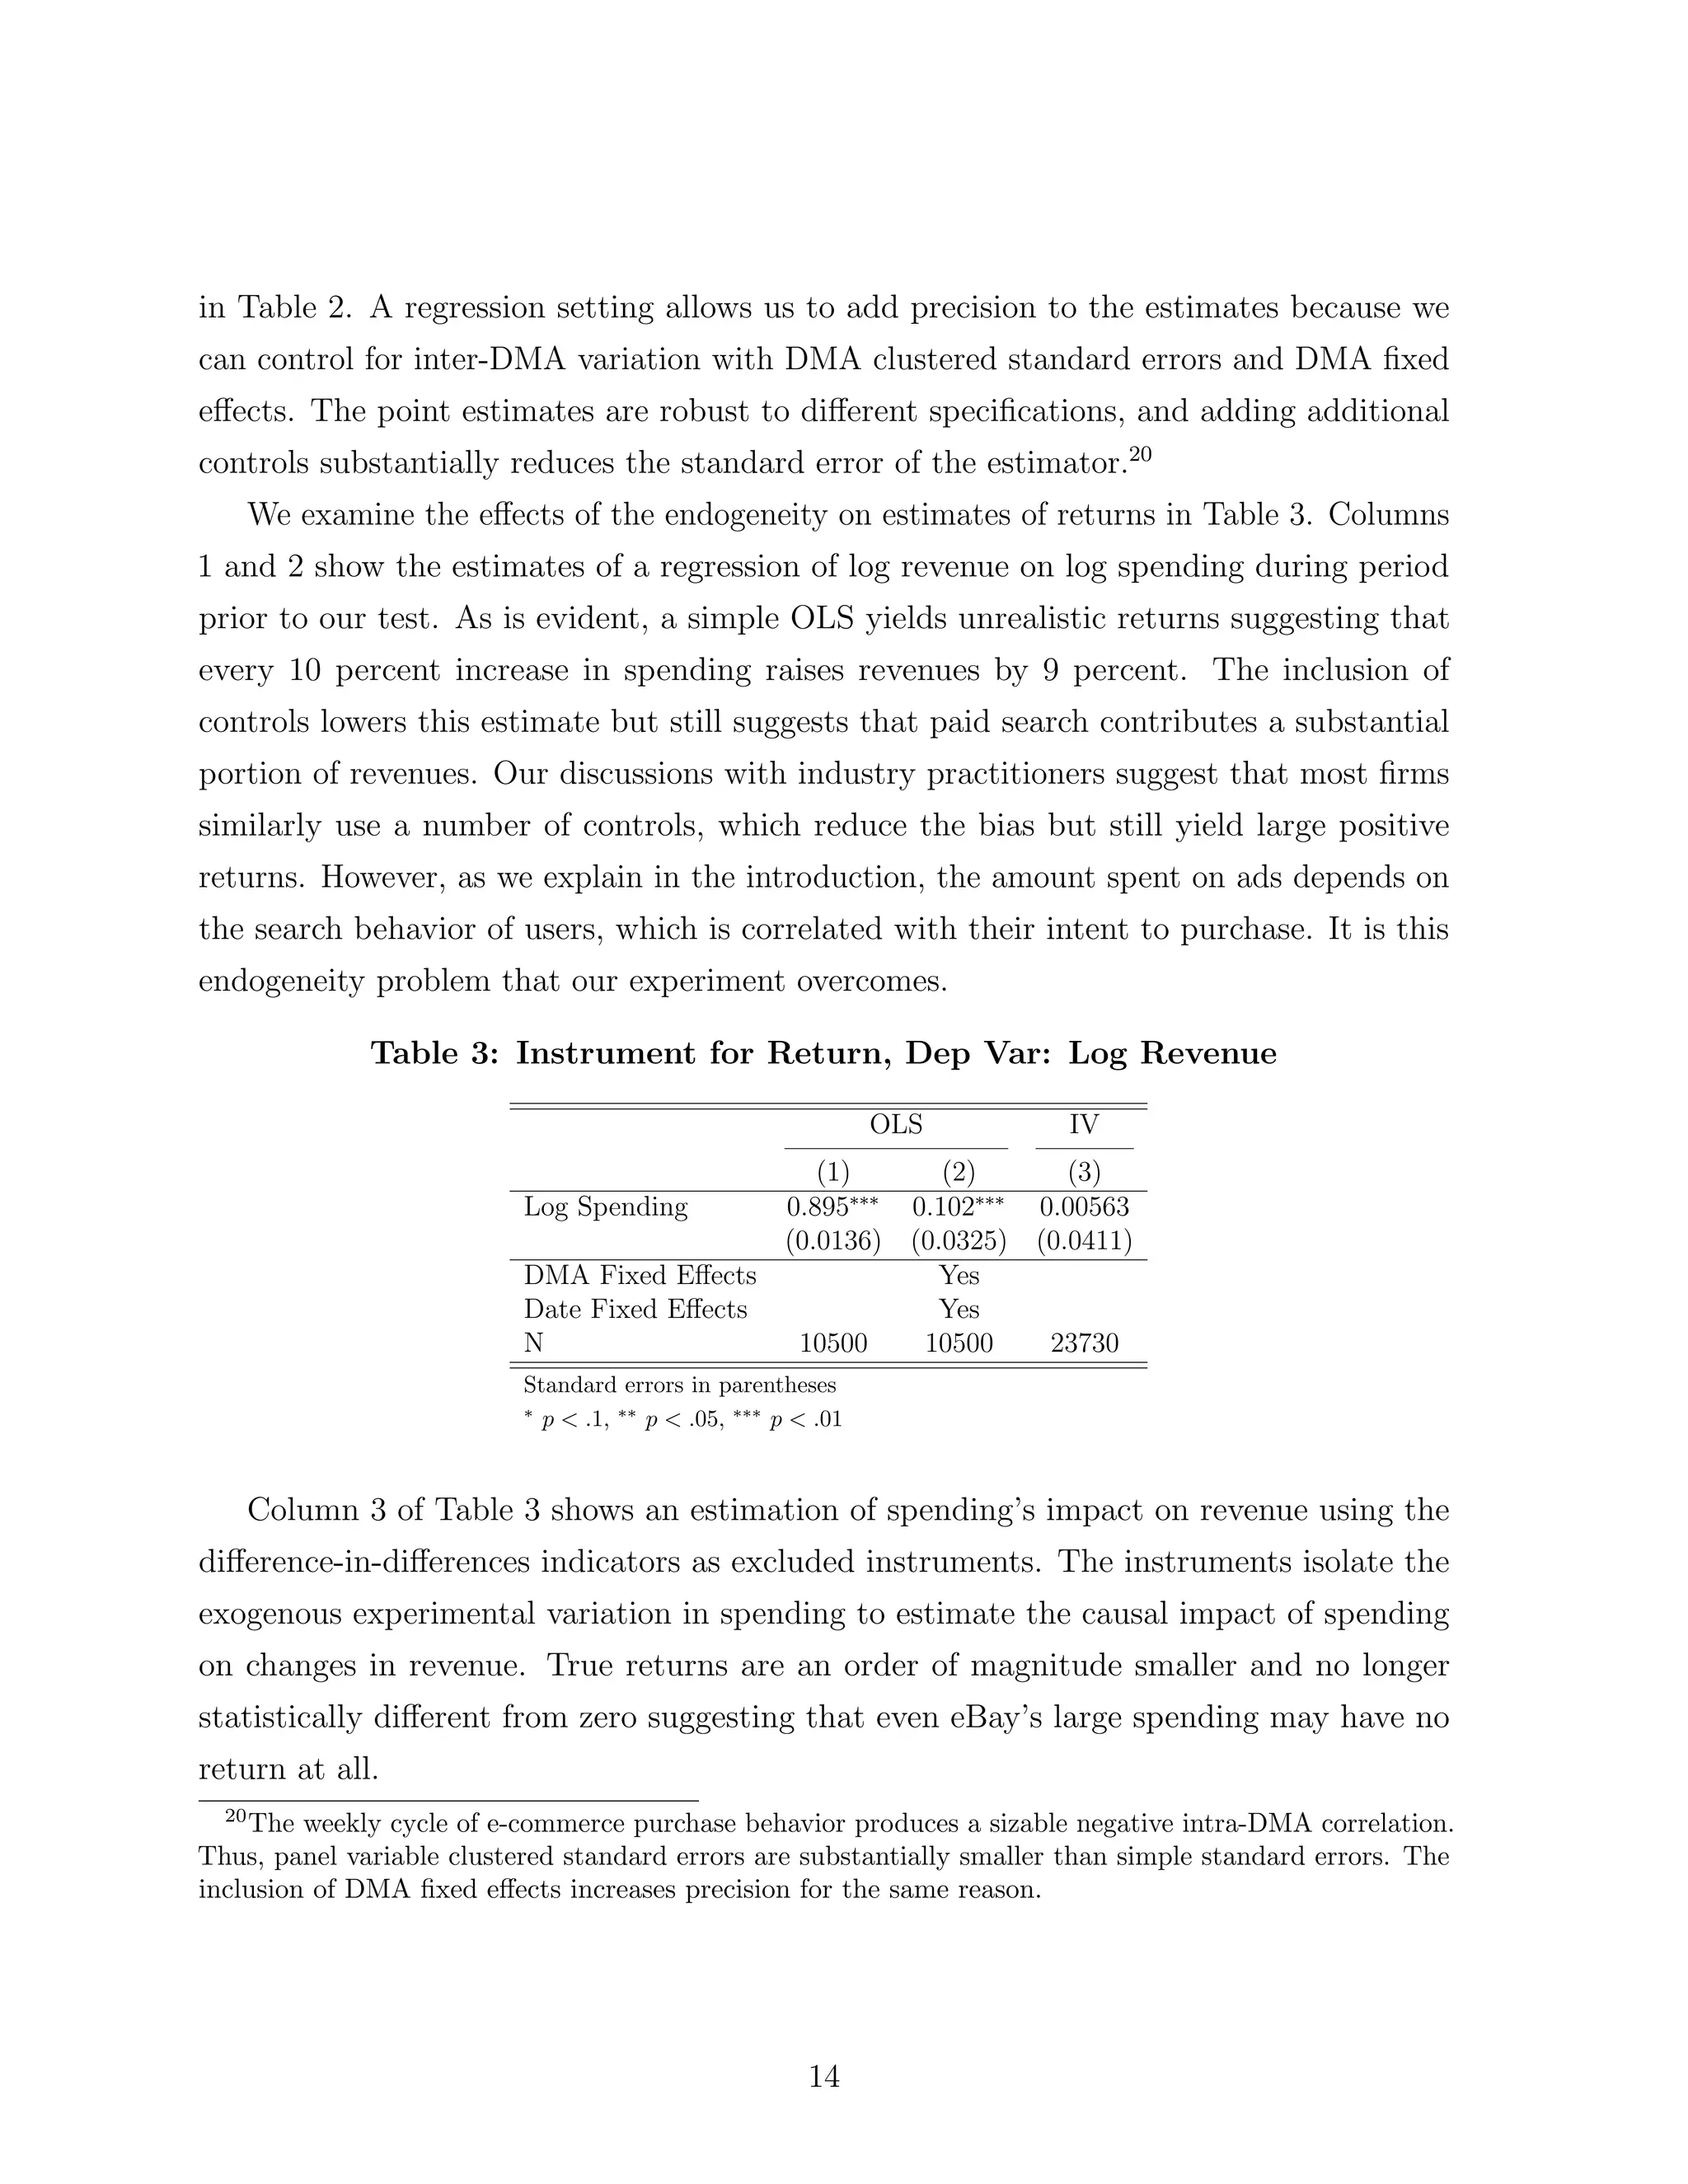
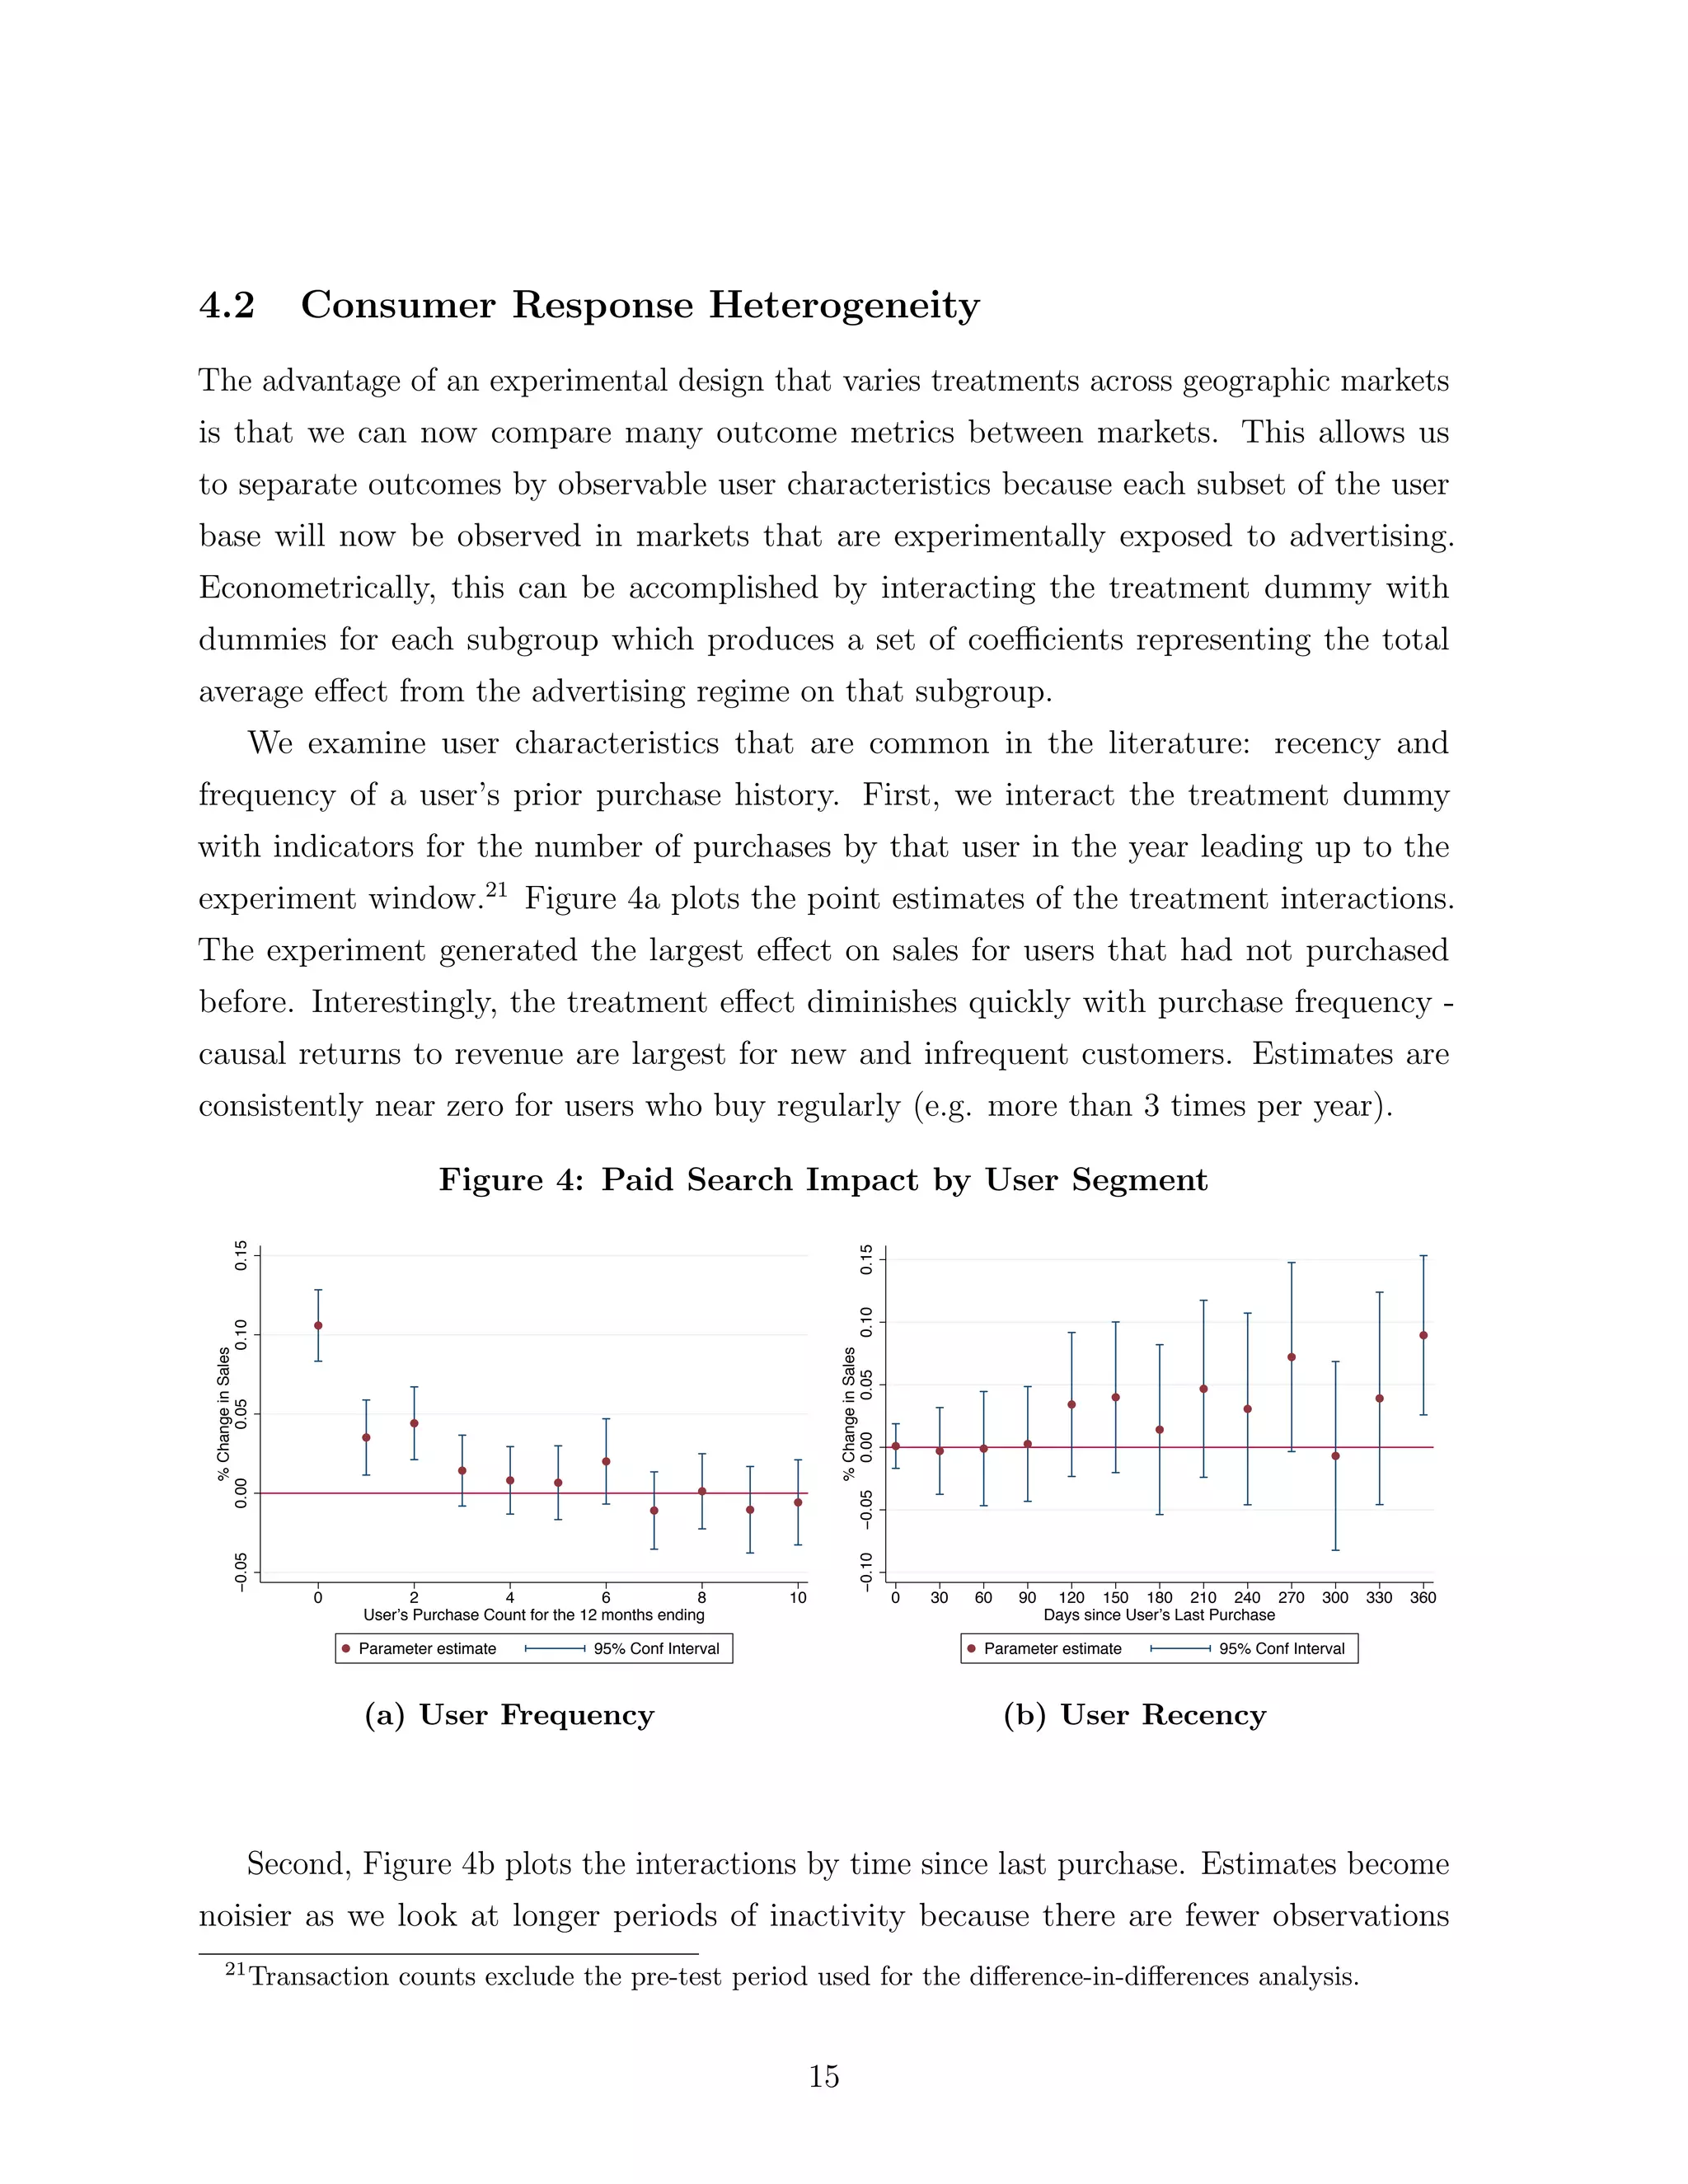
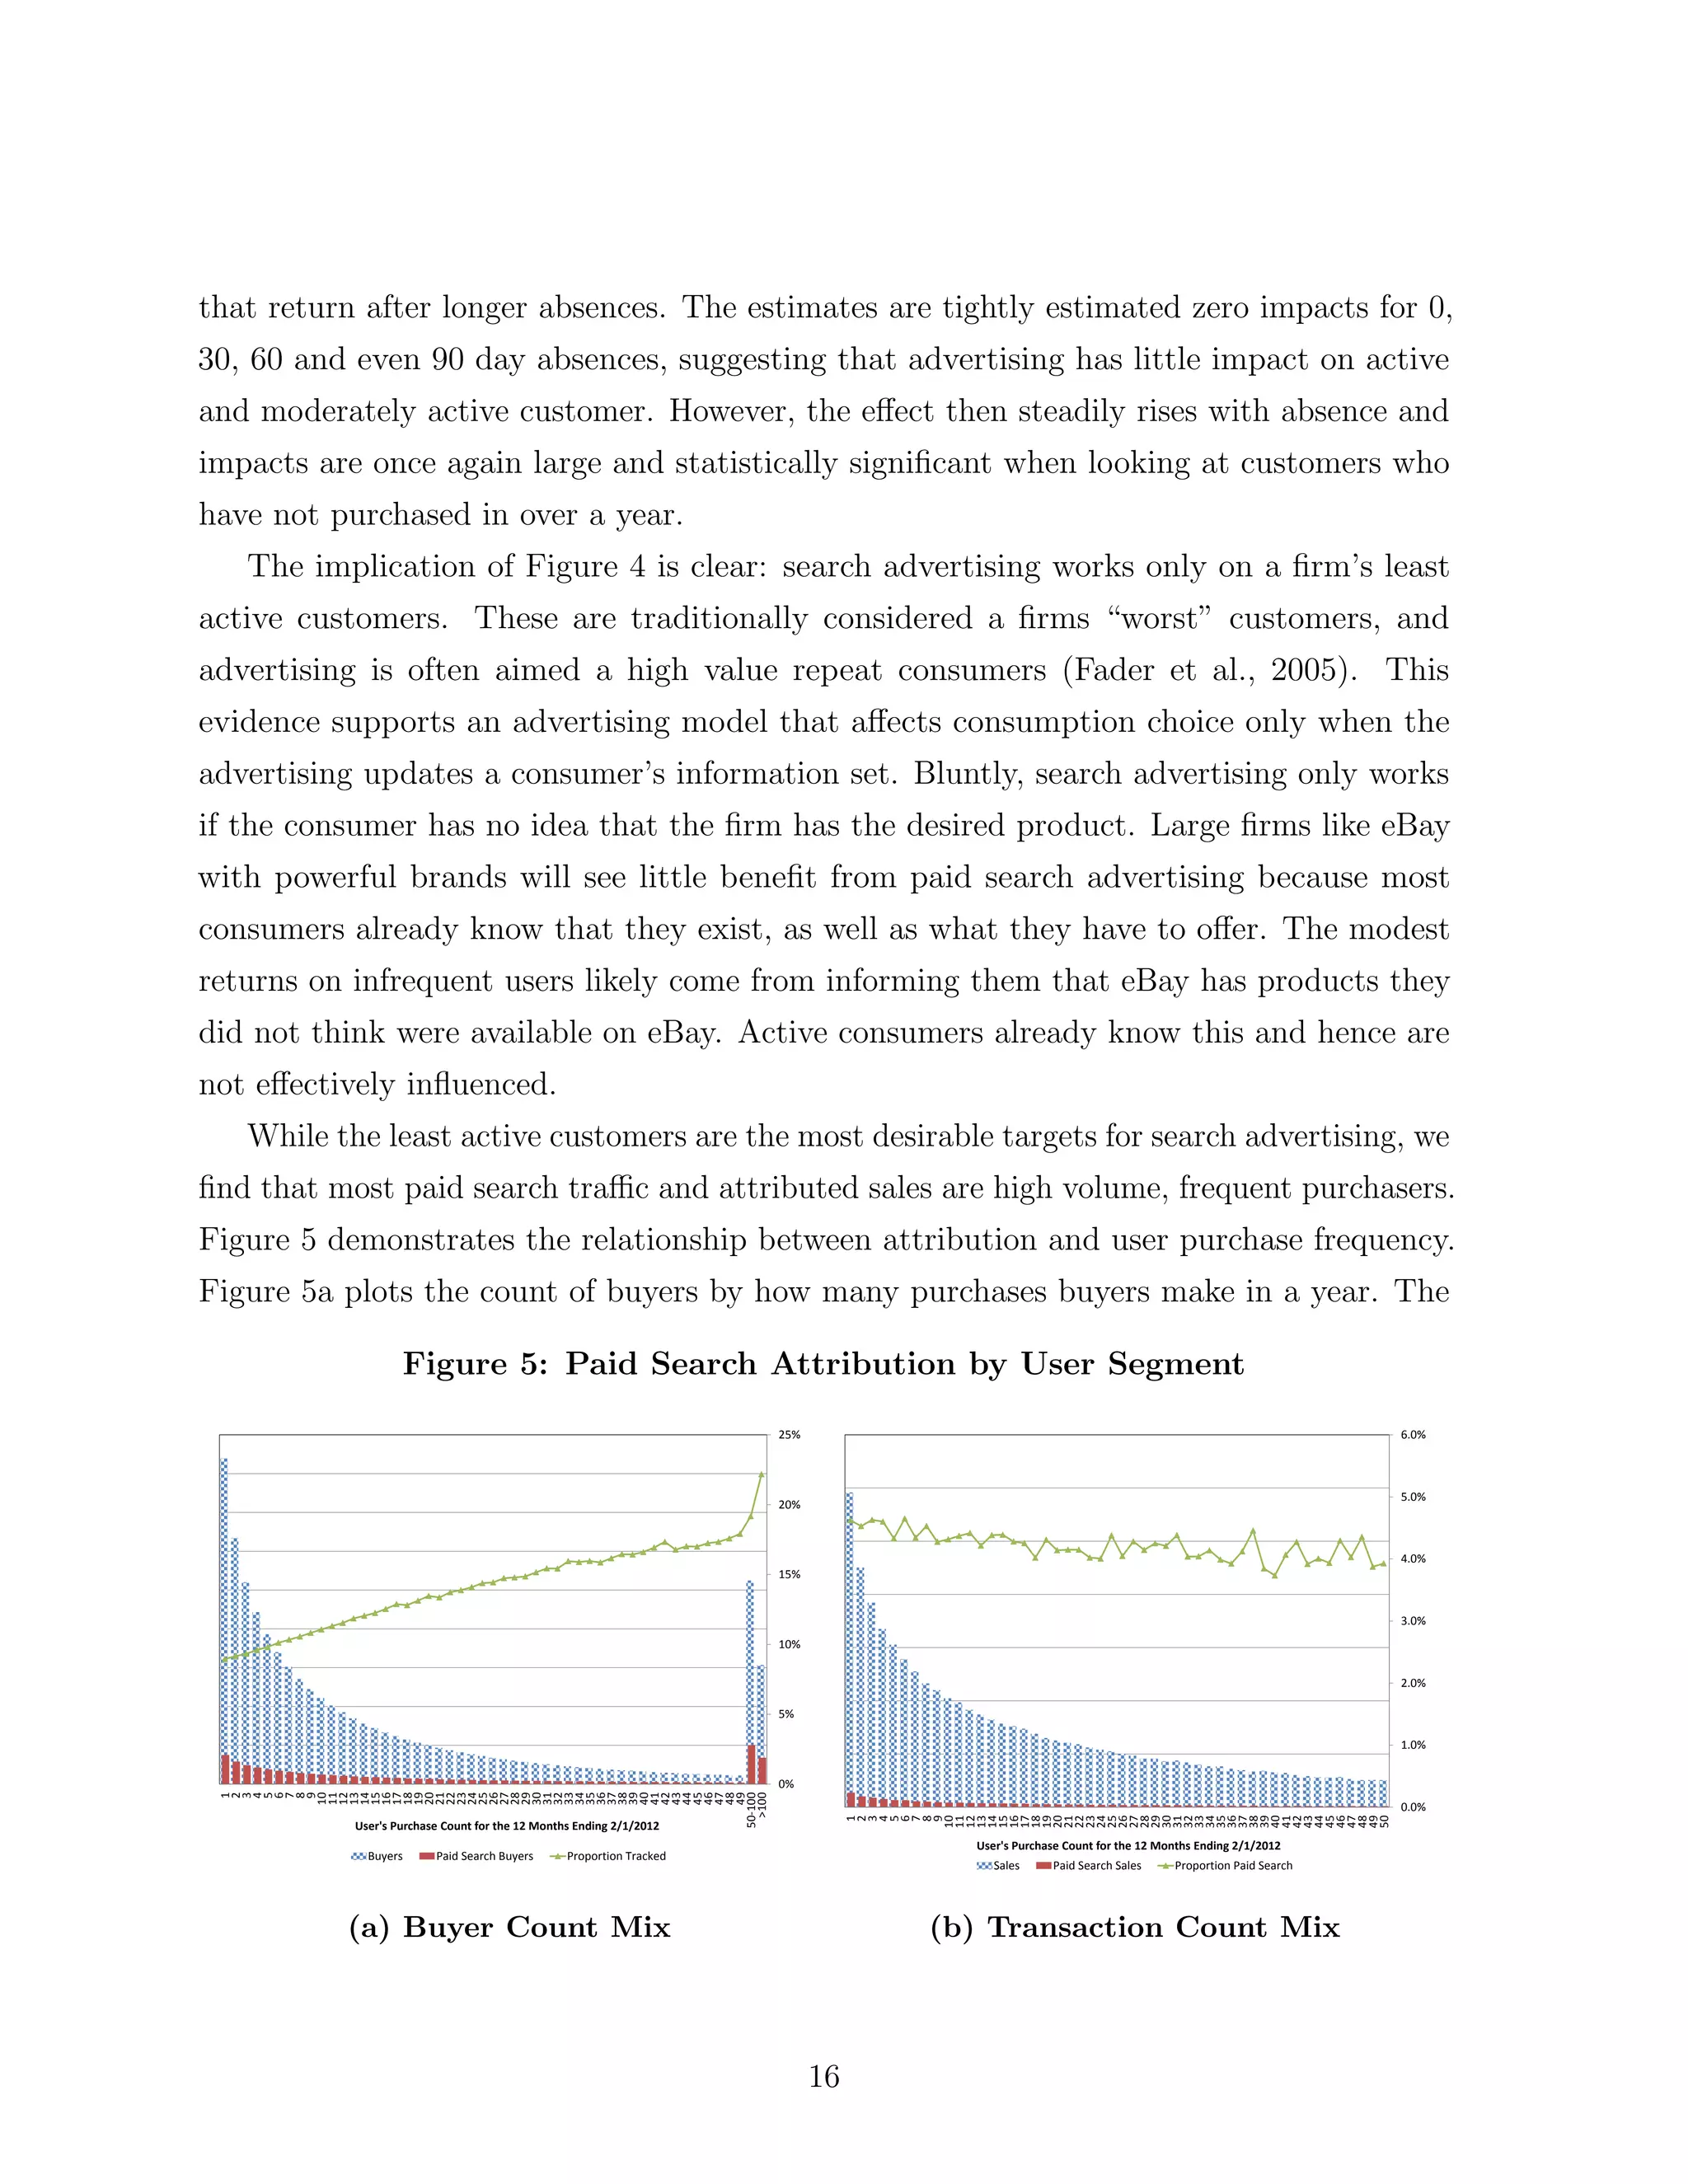
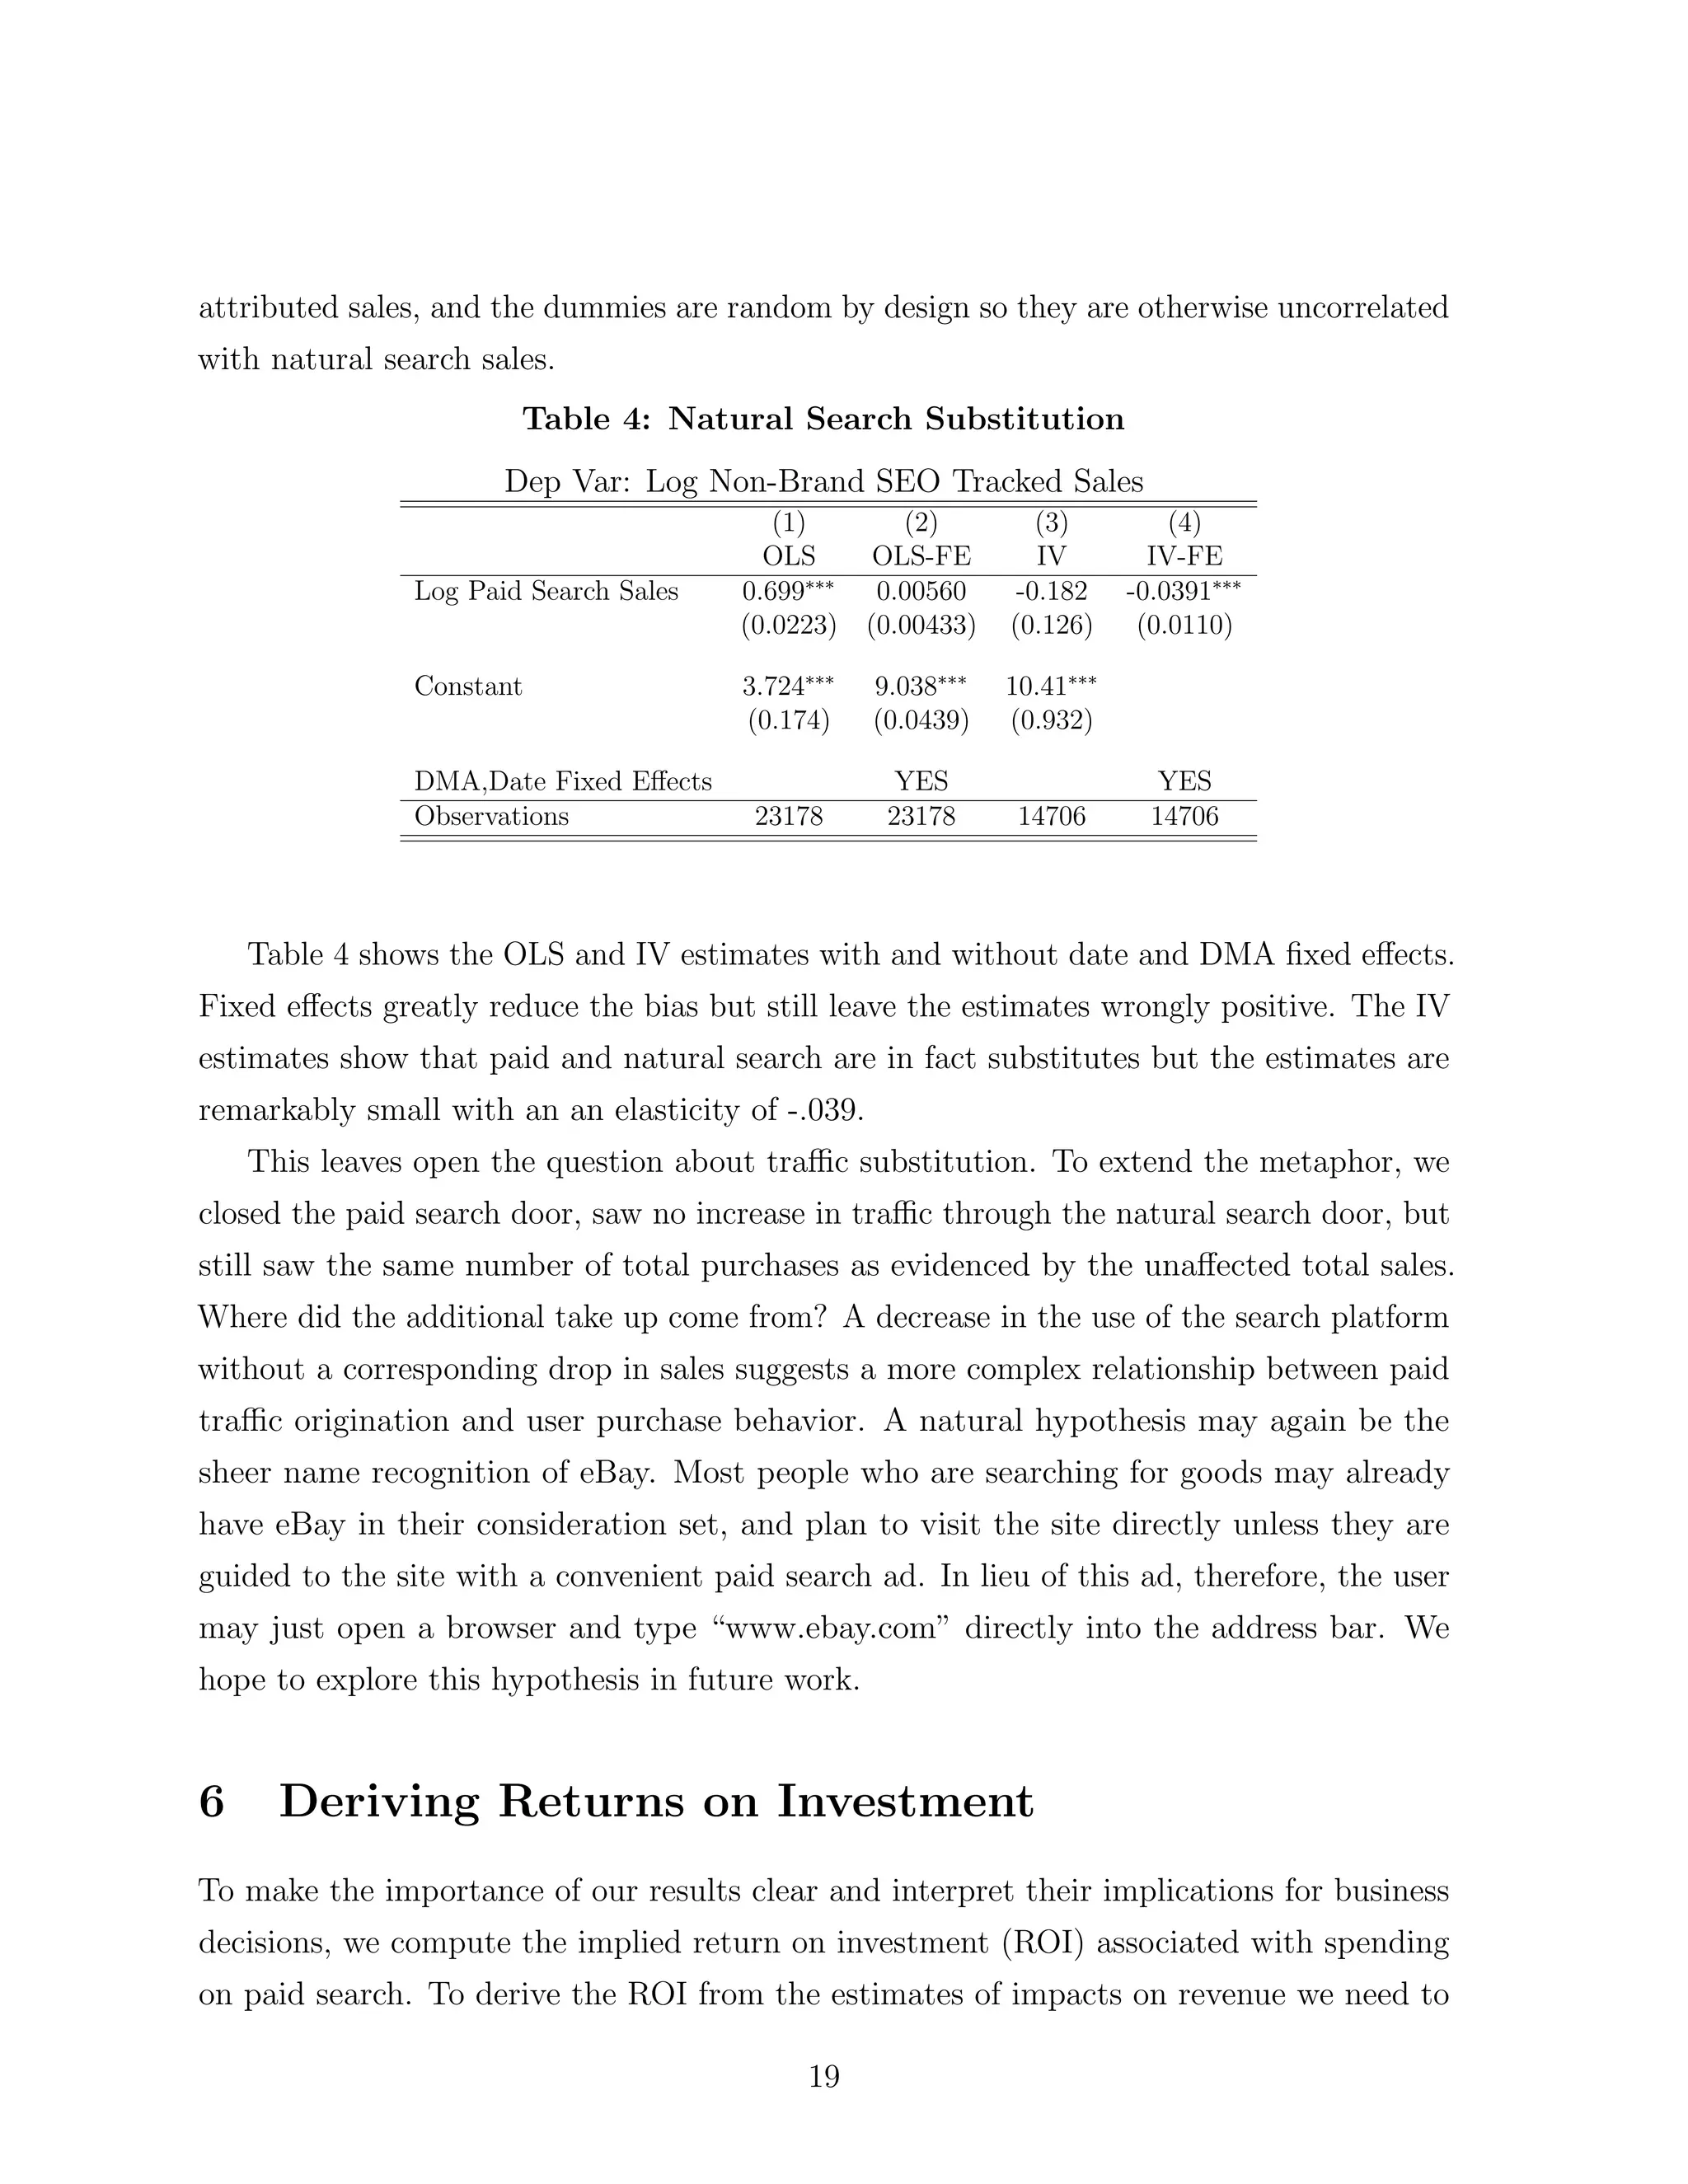
SlideShare a Scribd company logo
1 of 26
Consumer Heterogeneity and Paid Search
     E↵ectiveness: A Large Scale Field Experiment


                                       Thomas Blake⇤
                                        Chris Nosko†
                                       Steven Tadelis‡

                                       March 6, 2013§


                                            Abstract

        Internet advertising has been the fastest growing advertising channel in recent years
    with paid advertisements on search platforms (e.g., Google and Bing) comprising the bulk of
    this revenue. We present results from a series of large-scale field experiments done at eBay
    that are designed to detect the causal e↵ectiveness of paid search advertisements. Results
    show that brand-keyword ads have no short-term benefits, and that returns from all other
    keywords are a fraction of conventional estimates. We find that new and infrequent users are
    positively influenced by ads but that existing loyal users whose purchasing behavior is not
    influenced by paid search account for most of the advertising expenses, resulting in average
    returns that are negative. We discuss substitution to other channels and implications for
    advertising decisions in large firms.


⇤
  eBay Research Labs. Email: thblake@ebay.com
†
  University of Chicago and eBay Research Labs. Email: cnosko@chicagobooth.edu
‡
  UC Berkeley and eBay Research Labs. Email: stadelis@ebay.com
§
  Work in progress - preliminary and incomplete.
1         Introduction
Advertising expenses account for a sizeable portion of costs for many firms and corpo-
rations across the globe. In recent years the internet advertising industry has grown
disproportionately, with revenues in the United States alone totaling $31.7 billion for 2011,
up 21.9 percent from 2010. Of the di↵erent forms of internet advertising, paid search
advertising, also known in industry as “search engine marketing” (SEM) remains the
largest online advertising revenue format, accounting for 46.5 percent of 2011 revenues, or
$14.8 billion, up almost 27 percent from $11.7 billion in 2010.1 Google Inc., the leading
SEM provider, registered $37.9 billion in global revenues in 2011, of which $36.5 billion, or
96 percent, were attributed to advertising.2
        In this study we report the results from a series of controlled experiments conducted
at eBay Inc., where large-scale SEM campaigns were randomly executed across the U.S.
Our contributions can be summarized by three main findings. First, “brand” keyword
advertising (where firms purchase advertisements on searches for their own brand name),
a practice used by many companies, is ine↵ective because, absent paid search links,
consumers simply substitute to (unpaid) organic search links. This implies that brand
keyword advertising expenses have neither persuasive nor informative value to well known
corporations, and arguably, for other companies as well. Second, the e↵ectiveness of
SEM for non-branded keywords is small for a large and well-known brand like eBay and
the channel has been ine↵ective on average. Finally, we show that there is a small yet
detectable positive impact of SEM on new user acquisition and on informing infrequent
users about the value of using eBay. This last finding supports the informative view of
advertising and implies that targeting uninformed users is a critical factor for successful
advertising.
        The actual e↵ects of advertising on business performance have always been considered
hard to measure. A famous quote attributed to the late 19th century retailer John
Wannamaker states that “I know half the money I spend on advertising is wasted, but I
can never find out which half.” Traditional advertising channels such as TV, radio, print
and billboards have somewhat limited targeting capabilities, and advertisers often waste
    1
     These estimates were reported in the IAB Internet Advertising Revenue Report conducted by PwC
and Sponsored by the Interactive Advertising Bureau (IAB) 2011 Full Year Results published in April 2012.
See http://www.iab.net/media/file/IAB_Internet_Advertising_Revenue_Report_FY_2011.pdf
   2
     See Google’s webpage http://investor.google.com/financial/tables.html


                                                   1
valuable marketing dollars on “infra-marginal” consumers who are not a↵ected by ads to
get to those marginal consumers who are. The advent of internet marketing channels has
been lauded as the answer to this long-standing dilemma for two main reasons.
       First, the technology allows advertisers to target their ads to the activity that potential
consumers are engaged in (Goldfarb (2012) argues this is the main di↵erentiator between
online and o✏ine advertising channels). For instance, when a person is reading content
related to sports, like ESPN.com or Yahoo! Sports, advertisers can bid to have display
ads appear on the pages that are being read. Similarly, if a user is searching Google or
Bing for information about flat-screen TVs, retailers and manufacturers of these goods
can bid for sponsored search ads that are related to the user’s query. The belief is that
these ads will better target the intent of the user, and not waste valuable resources on
uninterested shoppers.
       Second, the technology allows advertisers to track variables that are supposed to help
measure the e cacy of the ads. An online advertiser will receive detailed data on which of
its website’s visitors were directed by the ad, how much was paid for the ad, and using its
own internal data flow, whether or not the visitor purchased anything from the website.
In theory, this should allow the advertiser to compute the returns on investment because
both cost and revenue data is available at the individual visitor level.
       Despite these advantages, endogeneity concerns present serious challenges to correctly
detecting the causal returns from internet advertising. Traditionally, economists have
focused on endogeneity stemming from firm decisions to increase advertising during times
of high demand (e.g., advertising during the Holidays) or when revenues are high (e.g.,
advertising budgets that are set as a percentage of previous-quarter revenue).3 Our concern,
instead, is that the amount spent on SEM (and many other internet marketing channels) is
a function not only of the advertiser’s campaign, but is also determined by the behavior and
intent of consumers. For example, the amount spent by an advertiser on an ad in the print
edition of the New York Times is independent of consumer response to that advertisement
(regardless of whether this response is correlated or causal). In contrast, if an advertiser
purchases SEM ads, expenditures rise with usage (i.e., consumer click-through).4 Our
research highlights one potential drawback inherent in this form of targeting: While these
   3
    See Berndt (1991), Chapter 8, for a survey of this literature.
   4
    Pay per click and pay per impression models are the predominant pricing regimes for these channels.
Many of the problems of evaluating the causal returns from pay-per-click advertising also apply to tracking
coupon usage.


                                                    2
consumers may look like good targets for advertising campaigns, they are also the types
of consumer that are already informed about the advertiser’s product, making them the
less susceptible to informative advertising channels. In many cases, the consumers who
choose to click on these SEM ads are loyal brand customers or otherwise already informed
about a firm’s product. Advertising may appear like it is successfully attracting these
consumers, when in reality they would have found other channels to the firm’s website. It
is this challenging endogeneity concern that we are able to alleviate with the design of our
controlled experiments.
    We begin our analysis with experiments that test the e cacy of what is referred to as
“brand” keyword advertising, a practice that has been used by most major corporations to
date. For example, when this paragraph was written (February 16, 2013), Google searches
for the keywords “AT&T”, “Macy”, “Safeway”, “Ford” and “Amazon” resulted in paid ads
at the top of the search results page directly above natural (also known as organic) unpaid
links to the companies’ sites. Arguably, consumers who query such a narrow term intend
to go to that firm’s website and are seeking the easiest route there. Paid search links
simply intercept consumers at the last point in their navigational process. Thus, brand
keyword advertising highlights an extreme version of the endogeneity concern described
above. We seek to quantify any value from advertising in this setting and then generalize
to non-brand advertising, where these concerns might be less extreme but still present.5
    Our brand keyword experiments show that there is no short-term value in brand
keyword advertising. In March of 2012, eBay conducted a test to study the returns of
brand keyword advertising (all queries that included the term eBay, including multi-word
terms such as “ebay shoes”) by halting SEM queries on these keywords on both Yahoo!
and Microsoft (MSN), while continuing to pay for these terms on Google, which we use
as a control in our estimation routine. The results show that almost all of the forgone
click tra c and attributed sales was immediately captured by natural search.6 That
is, substitution between paid and unpaid tra c was nearly complete. Removal of these
advertisements simply raised the prominence of the eBay natural search result. Shutting
    5
      A quick search for the term “brand keyword advertising” will yield dozens of sites many from online
ad service agencies that discuss the importance of paying for your own branded keywords. Most of the
discussions are somewhat obfuscated, but one reasonable argument is that competitors may bid on a
company’s branded keywords in an attempt to “steal” visitor tra c. Such behavior was absent in our
studies and we discuss this issue further in section 6.
    6
      Throughout, we refer to sales as the total dollar value of goods purchased by users on eBay. Revenue
is close to a constant fraction of sales, so percentage changes in the two are equivalent.


                                                    3
o↵ paid search advertisements closed one (costly) path to a firm’s website but diverted
tra c to the next easiest path (natural search), which is free to the advertiser. We confirm
this result further using a geography-based experiment on Google’s search platform in
Europe. Halting brand keyword advertising also resulted in no detectable drop in tra c
and sales.
       Non-branded keyword advertising presents a more general problem. eBay historically
managed over 170 million keywords and keyword combinations using algorithms that
are updated daily and automatically feed into Google’s, Microsoft’s and Yahoo!’s search
platforms.7 Examples of such keyword strings are “memory”, “cell phone” and “used
gibson les paul”. Unlike branded search, where a firm’s website is usually in the top organic
search slot, organic placement for non-branded terms vary widely. Furthermore, even if
substitution between paid and organic search does not occur (for instance, if eBay does
not appear in the organic search results), consumers may use other channels to navigate to
a firm’s website, such as directly typing in the website name or navigating through other
internet advertising channels. Hence, with non-branded search, we suspect that organic
search substitution may be less of a problem but substitution to other channels could
continue to drive purchases even in the absence of SEM. To address this question, we
designed a controlled experiment using Google’s geographic bid feature that can determine,
with a reasonable degree of accuracy, the geographic area of the user conducting each query.
We designate a random sample of 30 percent of eBay’s U.S. tra c in which we stopped
all bidding for eBay’s non-brand keywords for 60 days. The test design we implemented
lends itself to a standard di↵erence-in-di↵erences estimation of the e↵ect of paid search on
sales. This design allows us to explore heterogeneous responses across a wider consumer
base, not just those searching for eBay directly.8
       The non-brand keyword experiments show that SEM had a very small and statistically
insignificant e↵ect on sales. This suggests that on average, U.S. consumers do not shop
more on eBay when they are exposed to paid search ads on Google. To explore this
further, we segmented users according to the frequency at which they visited eBay the year
before the test. We find that SEM accounted for a statistically significant increase in new
   7
     see “Inside eBay’s business intelligence” by Jon Tullett, news analysis editor for
ITWeb at http://www.itweb.co.za/index.php?option=com_content&view=article&id=60448:
Inside-eBay-s-business-intelligence&catid=218
   8
     A number of papers have looked at topics related to paid search advertising. See Sahni (2011), Rutz
and Bucklin (2011), Yao and Mela (2011), Chan et al. (2011), and Yang and Ghose (2010).


                                                   4
registered users and purchases made by users who bought only one or two items the year
before. For consumers who bought more frequently, SEM does not have a significant e↵ect
on their purchasing behavior. We calculate that the short-term returns on investment for
SEM were negative because more frequent eBay shoppers are accountable for most of paid
search sales.
       To interpret our results in light of the economics literature, consider the informative view
of advertising, which suggests that advertising informs consumers of the characteristics,
location and prices of products and services that they may otherwise be ignorant about.
This will promote competition among producers, and allow consumers to find better and/or
cheaper products for purchase. Intuitively, SEM is an advertising medium that a↵ects the
information that people have, and is unlikely to play a persuasive role.9 It is possible that
display ads, which appear on pages without direct consumer queries, may play more of a
persuasive role, a↵ecting the demand of people who are interested in certain topics.10
       The heterogeneous response of di↵erent customer segments to paid search advertising
supports the intuition that SEM plays an informative role. Consumers who have completed
at least three eBay transactions in the year before our experiment are likely to be familiar
with eBay’s o↵erings and value proposition, and are una↵ected by the presence of paid
search advertising. In contrast, more new users sign up when they are exposed to these
ads, and users who only purchased one or two items in the previous year increase their
purchases when exposed to SEM. These results echo findings in Ackerberg (2001) who
considers the e↵ects of ads on the purchasing behavior of consumers and shows, using a
reduced form model, that consumers who were not experienced with the product were
more responsive to ads than consumers who had experienced the product. To the best of
our knowledge, our analysis o↵ers the first large scale field experiment that documents the
heterogeneous behavior of customers as a causal response to changes in advertising. We
are also able to demonstrate a more refined set of responses based on purchase recency
and frequency.
   9
     A recent survey by Bagwell (2007) gives an excellent review of the economics literature on advertising
as it evolved over more than a century. Aside from the informational view, two other views were advocated.
The persuasive view of advertising suggests that consumers who are exposed to persuasive advertising will
develop a preference for the advertised brand, increasing the advertiser’s market power. The complementary
view posits that advertising enters directly into the utility function of consumers.
  10
     A few papers have explored the e↵ects of display ads on oflline and online sales: Manchanda et al.
(2006), Goldfarb and Tucker (2011a) and Lewis and Reiley (2010).


                                                    5
A simple rationalization of our results is that a large majority of potential consumers
have fairly good information about eBay’s site and its o↵erings, and they receive no
additional information from paid search ads. Only a relatively small fraction of consumers
are unaware of the brand, or have used it infrequently enough to not fully understand the
scope of its o↵erings. It is this small set of consumers who are impacted positively by ads
because of their interest in purchasing once they become informed of the products and
prices o↵ered.
       The results and arguments laid out above, and the analysis described in detail in
sections 3-5 below, suggest that the e cacy of SEM is weak, a conclusion that is likely
to apply to other large brands that together spend billions of dollars a year on internet
marketing. Of the $31.7 billion that was spent in the U.S. in 2011 on internet advertising,
estimates project that the top 10 spenders in this channel account for about $2.36 billion.11
If, as we suspect, our results generalize to other well known brands that are in most
consumers’ considerations sets, then our study suggests that the amount spend on internet
advertising overall is beyond the peak of its e cacy. We discuss the challenges that
companies face in choosing optimal levels of advertising, as well as some of the reasons
that they seem to overspend on internet marketing in Section 7.


2        An Overview of Search Engine Marketing
SEM has been celebrated for allowing advertisers to place ads that directly relate to the
queries entered by consumers in search platforms such as Google, Microsoft (Bing) and
Yahoo!, to name a few.12 SEM ads link to a landing page on the advertiser’s website,
which typically showcases a product that is relevant to the search query.
       Figure 1a shows a Google search results page for the query “used gibson les paul”. The
results fall into two categories: paid (or sponsored) search ads that appear in the shaded
upper area (two ads) and on the right (seven ads), and unpaid (also called “natural” or
“organic”) search results that appear below the shaded area.
  11
     These include, in order of dollars spent, IAC/Interactive Group; Experian Group; GM; AT&T;
Progressive; Verizon; Comcast; Capital One; Amazon; and eBay. See the press release by Kantar Me-
dia on 3/12/2012, http://kantarmediana.com/sites/default/files/kantareditor/Kantar_Media_
2011_Full_Year_US_Ad_Spend.pdf
  12
     These di↵er from Display (or banner) ads that appear on websites that the consumer is browsing, and
are not a response to a search query entered by the consumer. We focus most of our discussion on Google
primarily because it is the leading search platform.


                                                   6
Figure 1: Google Ad Examples


           (a) Used Gibson Les Paul                                   (b) Macys


       The ranking of the unpaid results is determined by Google’s “PageRank” algorithm,
which ranks the results based on relevance, while the ranking of the paid search ads depend
on the bids made by advertisers for appearing when the particular query is typed by a
user, and on a proprietary “quality score” that depends on the click-through rate of the
bidder’s previous ads. For a more detailed explanation of the bidding and scoring process
of SEM, see Edelman et al. (2007) and Varian (2007).
       Advertisers pay only when a user clicks on the paid search ad, implying that ad expenses
are only made on consumers who respond to the ad. Furthermore, because firms pay when
a consumer clicks on their ad, and because they must bid higher in order to appear more
prominently above other paid listings, it has been argued that these “position auctions”
align advertiser incentives with consumer preferences. Namely, lower-quality firms that
expect clicks on their ads not to convert will not bid for positions, while higher-quality
firms will submit higher bids and receive higher positions, expecting more satisfied users
who will convert their clicks to purchases.13
  13
    Indeed, Athey and Ellison (2011) suggest that, sponsored link auctions create surplus by providing
consumers with information about the quality of sponsored links which allows consumers to search more
e ciently.


                                                  7
The example in Figure 1a describes what is referred to as a non-brand keyword search,
despite the fact that a particular branded product (Gibson Les Paul) is part of the query.
The reason is that many retailers with their own brand names will o↵er this guitar for
sale as the search results clearly show. This is in contrast to a branded keyword such as
“macys”. Figure 1b shows the results page from searching for “macys” on Google, and as
the figure shows there is only one paid ad that links to Macy’s main webpage. Notice,
however, that right below the paid ad is the natural search result that links to the same
page. In this case, if a user clicks on the first paid search result then Macy’s will have to
pay Google for this referral, while if the user clicks on the link below then Macy’s will
attract this user without paying Google.


3        Brand Search Advertising - A Natural Experiment
In March of 2012, eBay conducted a test to study the returns of brand keyword search
advertising. Brand terms are any queries that include the term eBay such as “ebay
shoes.” It is our hypothesis that users searching for “eBay” are in fact using Google as a
navigational tool with the intent to go to ebay.com. If so, there would be little need to
advertise for these terms and “intercept” those searches because the natural search results
provided by Google will serve as a perfect substitute. To test this hypothesis, eBay halted
advertising for its brand related terms on a smaller search advertising platform (MSN).
As suspected, almost all of the forgone click tra c from turning o↵ brand keyword paid
search was immediately captured by natural search tra c from the platform, in this case
Bing. That is, substitution between paid and unpaid tra c was nearly complete.14 Figure
2a plots the paid and natural clicks originating from the search platform. By design, paid
clicks were driven to zero when advertising spending was suspended. At the same time,
there was a noticeable uptake in natural clicks. This is strong evidence that the removal
of the advertisement raises the prominence of the eBay natural search result. Since users’
intent is to find eBay, it is not surprising that shutting down the paid search path to their
desired destination simply diverts tra c to the next easiest path, natural search, which is
free to the advertiser.
  14
     In a recent paper, Yang and Ghose (2010) similarly switched o↵ and back on paid search advertising
for a random set of 90 keywords. We find much smaller di↵erences in total tra c, most likely because we
experimented with a brand term where the substitution e↵ect is much larger.


                                                  8
Figure 2: Brand Keyword Click Substitution
  01jan2012
  08jan2012
  15jan2012
  22jan2012
  29jan2012
  05feb2012
  12feb2012
  19feb2012
  26feb2012
 04mar2012
 11mar2012
 18mar2012
 25mar2012
  01apr2012
  08apr2012
  15apr2012
  22apr2012
  29apr2012
 06may2012
 13may2012
 20may2012
 27may2012
  03jun2012
  10jun2012
  17jun2012
  24jun2012


                                                         01jun2012

                                                                     08jun2012

                                                                                 15jun2012

                                                                                             22jun2012

                                                                                                         29jun2012

                                                                                                                      06jul2012

                                                                                                                                  13jul2012

                                                                                                                                              20jul2012

                                                                                                                                                          27jul2012

                                                                                                                                                                      03aug2012

                                                                                                                                                                                   10aug2012

                                                                                                                                                                                               17aug2012

                                                                                                                                                                                                           24aug2012

                                                                                                                                                                                                                       31aug2012

                                                                                                                                                                                                                                   07sep2012

                                                                                                                                                                                                                                               14sep2012
          MSN Paid      MSN Natural   Goog Natural                                                          Goog Paid                                                             Goog Natural


                     (a) MSN Test                                                                                    (b) Google Test
MSN and Google click tra c is shown for two events where paid search was suspended (Left)
and suspended and resumed (Right).


       To quantify this substitution, Table 1 shows estimates from a simple pre-post comparison
as well as a simple di↵erence-in-di↵erences across search platforms. In the pre-post analysis
we regress the log of total daily clicks from MSN to eBay on an indicator for whether days
were in the period with ads turned o↵. Column 1 shows the results which suggest that
click volume was only 5.6 percent lower in the period after advertising was suspended.
       This approach lacks any reasonable control group. It is apparent from Figure 2a that
tra c increases in daily volatility and begins to decline after the advertising is turned
o↵. Both of these can be attributed to the seasonal nature of e-commerce. We look to
another search platform which serves as a source for eBay tra c, Google, as a control
group to account for seasonal factors. During the test period on MSN, eBay continued to
purchase brand keyword advertising on Google which can serve as a control group. With
this data, we calculate the impact of brand keyword advertising on total click tra c. In
the di↵erence-in-di↵erences approach, we add observations of daily tra c from Google
and Yahoo! and include in the specification search engine dummies and trends.15 The
variable of interest is thus the interaction between a dummy for the MSN platform and a
dummy for treatment (ad o↵) period. Column 2 of Table 1 show a much smaller impact
  15
    The estimates presented include date fixed e↵ects and platform specific trends but the results are
very similar without these controls.


                                                     9
Table 1: Quantifying Brand Keyword Substitution

                                                        MSN                 Google
                                                 (1)       (2)         (3)
                                             Log Clicks Log Clicks Log Clicks
                       Period                -0.0560⇤⇤⇤             -0.0321⇤
                                             (0.00861)              (0.0124)

                       Interaction                              -0.00529
                                                                (0.0177)

                       Google                                    5.088
                                                                (10.06)

                       Yahoo                                     1.375
                                                                (5.660)

                       Constant                12.82⇤⇤⇤         11.33⇤      14.34⇤⇤⇤
                                              (0.00583)         (5.664)    (0.00630)
                       Date FE                                    Yes
                       Platform Trends                            Yes
                       N                         118              180        120
                       Standard errors in parentheses
                       ⇤
                         p < 0.05, ⇤⇤ p < 0.01, ⇤⇤⇤ p < 0.001


once the seasonality is accounted for. Only 0.529 percent of the click tra c is lost so 99.5
percent is retained.
   These results inspired a follow-up test on the larger Google platform that was executed
in July of 2012 which yielded similar results. Figure 2b shows both the substitution to
natural tra c when search advertising was suspended and the substitution back to paid
tra c when advertising resumed. Column 3 of Table 1 show the estimated impacts: total
tra c referred by Google dropped by three percent. It is likely that a well constructed
control group would reduce this estimate as was evident in the MSN test. During this test,
there was no viable control group available because there was no other contemporaneous
paid search brand advertising campaign. In the Appendix, we describe a test we designed
and executed that preserved a control group in a European market which confirms the
results described here.
   In summary, the evidence strongly supports the intuitive notion that for brand keywords,
natural search is close to a perfect substitute for paid search, making brand keyword SEM
ine↵ective for short-term sales. After all, the users who type the brand keyword in the
search query intend to reach the company’s website, and most likely will execute on their


                                                      10
intent regardless of the appearance of a paid search ad. This substitution is less likely to
happen for non-brand keywords, which we explore in the next section.


4        Non-Brand Terms Controlled Experiment
When typing queries for non-brand terms, users may be searching for information on goods
and services that they wish to explore further, or even to purchase. If ads appear for users
who do not know the these products are available at the advertiser’s website, then there is
greater potential to bring these users to the site, which in turn might generate additional
sales that would not have occurred without the ads.
       Because eBay bids on a universe of over 170 million keywords, it provides an ideal
environment to test the e↵ectiveness of paid search ads for non-brand keywords. The
broad set of keywords place ads in front of a wider set of users: anyone searching for
queries related to millions of products and not just those searching specifically for eBay.
Measuring the e↵ects of the full keyword set more directly addresses the value of informative
advertising because we can examine how consumers with di↵erent levels of familiarity
with the site respond to advertising. In particular, we have past purchase behavior for
users who visit and purchase items on eBay, and we can use measures of past activity
to segment users into groups that would be more or less familiar with eBay’s o↵erings.
Non-brand ads have the ability to attract users that are not directly searching for eBay
but the endogeneity remains because the ads may attract users who are already familiar
with eBay for which the ad provided little or no information. In short, these users may
have visited eBay eventually if the ad were not present.


4.1       Experimental Design and Basic Results
To determine the impact of advertising on the broader set of search queries we designed
and implemented a large scale field experiment that exposes a random subset of users to
ads and preserves a control group of users who did not see ads.16 This was accomplished
by leveraging Google’s relatively new technology that allows advertisers to target their ads
to the geography of the user. We use Google’s geographic bid feature that can determine,
  16
    Whereas the previous section referred to a test of advertising for branded keywords and their variants,
this test specifically excluded brand terms. That is, eBay continued to purchase brand ads nationally
until roughly 6 weeks into the geographic test when the brand ads were halted nationwide.


                                                   11
with a reasonable degree of accuracy, the Nielsen Designated Market Area (DMA) of the
user conducting each query. There are 210 DMAs in the United States, which typically
correspond to large metropolitan areas. For example, Google’s home market includes the
San Francisco, Oakland, and San Jose metropolitan areas.
      For the test, advertising was suspended in roughly 30 percent of DMAs. This was
done simply to reduce the scope of the test and minimize the potential cost and impact
to the business (in the event that the ads created considerable profits). To select these
markets, a purely random sub sample of DMAs were chosen as candidates for the test.
Next, candidate DMAs were divided into test and control DMAs using an algorithm that
matched historical serial correlation in sales between the two regions. This was done to
create a control group that mirrored the test group in seasonality. This procedure implies
that the test group is not a purely random sample, but it is certainly an arbitrary sample
that does not exhibit any historical (or, ex post) di↵erence in sales trends. The test design
therefore lends itself neatly to a standard di↵erence-in-di↵erences estimation of the e↵ect
of paid search on sales.
      The execution can be seen in Figure 3a which plots total attributed sales for the three
regions of the U.S.: the 65 test DMAs where advertising ceased, 68 matched control DMAs,
and the remaining 77 control DMAs. As before, attributed sales is the total sales of all
purchases to users within 24 hours of that user clicking on a Google paid search link.17
Note that attributed sales do not completely zero out in the test DMAs after the test
was launched in late May. The remaining ad sales from test DMAs is an artifact of the
error both in Google’s ability to determine a user’s location and our determination of the
user’s location. We use the user’s shipping zip code registered with eBay to determine the
user’s DMA and whether or not the user was exposed to ads. If a user makes a purchase
while traveling to a region exposed to ads but still has the product shipped to her home,
we would assign the associated sales to the o↵ region. Attributed sales falls by over 72
percent.18
      A very simple assessment of the di↵erence-in-di↵erences results is plotted in Figure
3b. We plot the simple di↵erence, ratio, and log di↵erence between daily average sales
in the designated control regions where search remained on and the test regions where
search is o↵. As is apparent, the regions where search remained on are larger (about 30
 17
      The y-axis is suppressed to protect properietary sales data. It is in units of dollars per DMA, per day.
 18
      This classification error will attenuate the estimated e↵ect towards zero.


                                                      12
Figure 3: Non-Brand Keyword Region Test


                                                                                                                                                                                                                  1.2 1.4


                                                                                                                                                                                                                                 80 100
                                                                                                                                                                                                                                 60
                                                                                                                                                                                                                            .4
                                                                                                                                                                                                                            .3
                                                                                                                                                                                                                            .2


                                                                                                                                                                                                                                          01apr2012
                                                                                                                                                                                                                                                      08apr2012
                                                                                                                                                                                                                                                                  15apr2012
                                                                                                                                                                                                                                                                              22apr2012
                                                                                                                                                                                                                                                                                          29apr2012
                                                                                                                                                                                                                                                                                                      06may2012
                                                                                                                                                                                                                                                                                                                  13may2012
                                                                                                                                                                                                                                                                                                                              20may2012
                                                                                                                                                                                                                                                                                                                                          27may2012
                                                                                                                                                                                                                                                                                                                                                      03jun2012
                                                                                                                                                                                                                                                                                                                                                                  10jun2012
                                                                                                                                                                                                                                                                                                                                                                              17jun2012
                                                                                                                                                                                                                                                                                                                                                                                          24jun2012
                                                                                                                                                                                                                                                                                                                                                                                                      01jul2012
                                                                                                                                                                                                                                                                                                                                                                                                                  08jul2012
                                                                                                                                                                                                                                                                                                                                                                                                                              15jul2012
                                                                                                                                                                                                                                                                                                                                                                                                                                          22jul2012
  01apr2012

              08apr2012

                          15apr2012

                                      22apr2012

                                                  29apr2012

                                                              06may2012

                                                                          13may2012

                                                                                      20may2012

                                                                                                  27may2012

                                                                                                              03jun2012

                                                                                                                          10jun2012

                                                                                                                                      17jun2012

                                                                                                                                                   24jun2012

                                                                                                                                                               01jul2012

                                                                                                                                                                           08jul2012

                                                                                                                                                                                       15jul2012

                                                                                                                                                                                                   22jul2012
                                                                                                                                                                                                                                                                                                On/Off                                                                                (On−Off)
                                         Test                                         Control                                                     Rest of U.S.                                                                                                                                  Log(On−Off)                                                                           Test


                      (a) Attributed Sales by Region                                                                                                                                                                                 (b) Di↵erences in Total Sales


percent) than the regions switched o↵.19 This is an artifact of the selection algorithm

                                                                                            Table 2: Di↵-in-Di↵ Regression Estimates

                                                                                                                                                                                                                  (1)                                    (2)
                                                                                                                                                                                                               Log Sales                              Log Sales
                                                                                                                           Interaction                                                                          0.00440                                0.00440
                                                                                                                                                                                                               (0.00628)                              (0.00629)

                                                                                                                           Experiment Period                                                                   -0.0579⇤⇤⇤
                                                                                                                                                                                                               (0.00531)

                                                                                                                           Search Group                                                                         -0.0130
                                                                                                                                                                                                                (0.169)

                                                                                                                           Constant                                                                            11.75⇤⇤⇤                                11.77⇤⇤⇤
                                                                                                                                                                                                               (0.133)                                (0.00856)
                                                                                                                           Date Fixed E↵ects                                                                                                             Yes
                                                                                                                           DMA Fixed E↵ects                                                                                                              Yes
                                                                                                                           N                                                                                     23730                                  23730
                                                                                                                           Standard errors, clustered on the DMA, in parentheses
                                                                                                                           ⇤
                                                                                                                             p < .1, ⇤⇤ p < .05, ⇤⇤⇤ p < .01


that optimized for historical trends. This di↵erence is constant through the pre and post
experimental period demonstrating the muted overall impact of paid search. To quantify
the impact of paid search, we preform a di↵erence-in-di↵erences calculation using the
period of April through July and the full national set of DMAs. The entire regime of paid
search adds only 0.44 percent to sales. The regression equivalent estimates are shown
   19
    The Y-axis is shown for the ratio, the log di↵erence, and in di↵erences in thousands of dollars per day,
per DMA.


                                                                                                                                                                                                           13
in Table 2. A regression setting allows us to add precision to the estimates because we
can control for inter-DMA variation with DMA clustered standard errors and DMA fixed
e↵ects. The point estimates are robust to di↵erent specifications, and adding additional
controls substantially reduces the standard error of the estimator.20
       We examine the e↵ects of the endogeneity on estimates of returns in Table 3. Columns
1 and 2 show the estimates of a regression of log revenue on log spending during period
prior to our test. As is evident, a simple OLS yields unrealistic returns suggesting that
every 10 percent increase in spending raises revenues by 9 percent. The inclusion of
controls lowers this estimate but still suggests that paid search contributes a substantial
portion of revenues. Our discussions with industry practitioners suggest that most firms
similarly use a number of controls, which reduce the bias but still yield large positive
returns. However, as we explain in the introduction, the amount spent on ads depends on
the search behavior of users, which is correlated with their intent to purchase. It is this
endogeneity problem that our experiment overcomes.

               Table 3: Instrument for Return, Dep Var: Log Revenue

                                                               OLS            IV
                                                        (1)         (2)        (3)
                           Log Spending              0.895⇤⇤⇤    0.102⇤⇤⇤   0.00563
                                                     (0.0136)    (0.0325)   (0.0411)
                           DMA Fixed E↵ects                        Yes
                           Date Fixed E↵ects                       Yes
                           N                           10500      10500      23730
                           Standard errors in parentheses
                           ⇤
                             p < .1, ⇤⇤ p < .05, ⇤⇤⇤ p < .01


       Column 3 of Table 3 shows an estimation of spending’s impact on revenue using the
di↵erence-in-di↵erences indicators as excluded instruments. The instruments isolate the
exogenous experimental variation in spending to estimate the causal impact of spending
on changes in revenue. True returns are an order of magnitude smaller and no longer
statistically di↵erent from zero suggesting that even eBay’s large spending may have no
return at all.
  20
    The weekly cycle of e-commerce purchase behavior produces a sizable negative intra-DMA correlation.
Thus, panel variable clustered standard errors are substantially smaller than simple standard errors. The
inclusion of DMA fixed e↵ects increases precision for the same reason.


                                                        14
4.2                          Consumer Response Heterogeneity
The advantage of an experimental design that varies treatments across geographic markets
is that we can now compare many outcome metrics between markets. This allows us
to separate outcomes by observable user characteristics because each subset of the user
base will now be observed in markets that are experimentally exposed to advertising.
Econometrically, this can be accomplished by interacting the treatment dummy with
dummies for each subgroup which produces a set of coe cients representing the total
average e↵ect from the advertising regime on that subgroup.
                       We examine user characteristics that are common in the literature: recency and
frequency of a user’s prior purchase history. First, we interact the treatment dummy
with indicators for the number of purchases by that user in the year leading up to the
experiment window.21 Figure 4a plots the point estimates of the treatment interactions.
The experiment generated the largest e↵ect on sales for users that had not purchased
before. Interestingly, the treatment e↵ect diminishes quickly with purchase frequency -
causal returns to revenue are largest for new and infrequent customers. Estimates are
consistently near zero for users who buy regularly (e.g. more than 3 times per year).

                                           Figure 4: Paid Search Impact by User Segment
              0.15


                                                                                                        0.15   0.10
                      0.10
     % Change in Sales


                                                                                             % Change in Sales
                                                                                                       0.05
          0.05


                                                                                               0.00
 0.00


                                                                                                        −0.05
              −0.05


                                                                                                        −0.10


                             0         2           4              6           8    10                                 0   30   60    90    120 150 180 210 240 270          300   330   360
                                 User’s Purchase Count for the 12 months ending                                                           Days since User’s Last Purchase

                                 Parameter estimate            95% Conf Interval                                                Parameter estimate            95% Conf Interval


                                 (a) User Frequency                                                                                 (b) User Recency


                       Second, Figure 4b plots the interactions by time since last purchase. Estimates become
noisier as we look at longer periods of inactivity because there are fewer observations
       21
                        Transaction counts exclude the pre-test period used for the di↵erence-in-di↵erences analysis.


                                                                                        15
that return after longer absences. The estimates are tightly estimated zero impacts for 0,
30, 60 and even 90 day absences, suggesting that advertising has little impact on active
and moderately active customer. However, the e↵ect then steadily rises with absence and
impacts are once again large and statistically significant when looking at customers who
have not purchased in over a year.
   The implication of Figure 4 is clear: search advertising works only on a firm’s least
active customers. These are traditionally considered a firms “worst” customers, and
advertising is often aimed a high value repeat consumers (Fader et al., 2005). This
evidence supports an advertising model that a↵ects consumption choice only when the
advertising updates a consumer’s information set. Bluntly, search advertising only works
if the consumer has no idea that the firm has the desired product. Large firms like eBay
with powerful brands will see little benefit from paid search advertising because most
consumers already know that they exist, as well as what they have to o↵er. The modest
returns on infrequent users likely come from informing them that eBay has products they
did not think were available on eBay. Active consumers already know this and hence are
not e↵ectively influenced.
   While the least active customers are the most desirable targets for search advertising, we
find that most paid search tra c and attributed sales are high volume, frequent purchasers.
Figure 5 demonstrates the relationship between attribution and user purchase frequency.
Figure 5a plots the count of buyers by how many purchases buyers make in a year. The

                   Figure 5: Paid Search Attribution by User Segment
                                                                      25%                                                                      6.0%


                                                                                                                                               5.0%
                                                                      20%


                                                                                                                                               4.0%
                                                                      15%


                                                                                                                                               3.0%
                                                                      10%


                                                                                                                                               2.0%

                                                                      5%

                                                                                                                                               1.0%


                                                                      0%
     10
     11
     12
     13
     14
     15
     16
     17
     18
     19
     20
     21
     22
     23
     24
     25
     26
     27
     28
     29
     30
     31
     32
     33
     34
     35
     36
     37
     38
     39
     40
     41
     42
     43
     44
     45
     46
     47
     48
     49
      1
      2
      3
      4
      5
      6
      7
      8
      9


   >100
 50-100


                                                                                                                                               0.0%
                                                                                 10
                                                                                 11
                                                                                 12
                                                                                 13
                                                                                 14
                                                                                 15
                                                                                 16
                                                                                 17
                                                                                 18
                                                                                 19
                                                                                 20
                                                                                 21
                                                                                 22
                                                                                 23
                                                                                 24
                                                                                 25
                                                                                 26
                                                                                 27
                                                                                 28
                                                                                 29
                                                                                 30
                                                                                 31
                                                                                 32
                                                                                 33
                                                                                 34
                                                                                 35
                                                                                 36
                                                                                 37
                                                                                 38
                                                                                 39
                                                                                 40
                                                                                 41
                                                                                 42
                                                                                 43
                                                                                 44
                                                                                 45
                                                                                 46
                                                                                 47
                                                                                 48
                                                                                 49
                                                                                 50
                                                                                  1
                                                                                  2
                                                                                  3
                                                                                  4
                                                                                  5
                                                                                  6
                                                                                  7
                                                                                  8
                                                                                  9


           User's Purchase Count for the 12 Months Ending 2/1/2012
                                                                                   User's Purchase Count for the 12 Months Ending 2/1/2012
             Buyers      Paid Search Buyers      Proportion Tracked
                                                                                      Sales     Paid Search Sales     Proportion Paid Search


          (a) Buyer Count Mix                                                    (b) Transaction Count Mix


                                                                            16
counts are shown separately for all buyers and for that subset of buyers that buy, at
any point in the year, after clicking on a paid search ad. The ratio of the two rises with
purchase frequency because frequent purchasers are more likely to use paid search at some
point. Figure 5b shows the same plot for shares of transaction counts. Even users who buy
more than 50 times in a year (i.e. once a week) still use paid search clicks for 4 percent of
their purchases. The large share of heavy users suggests that most of paid search spending
is wasted because the majority of spending on Google is related to clicks by those users
that would purchase anyway. This explains the large negative ROI computed in Section 4.
   We have searched for other indicators of consumer’s propensity to respond in localized
demographic data. Although randomization was done at the DMA level, we can measure
outcomes at the zip code level, and so we estimate a zip code level regression where we
interact zip code demographic data with our treatment indicator. We find no di↵erential
response across several demographic measures that is statistically significant: income,
population size, unemployment rates, household size, and eBay user penetration. The
coe cient on user eBay penetration (the proportion of registered eBay users per DMA) is
negative, which complements the finding that uninformed and potential customers are
more responsive than regular users.


4.3    Product Response Heterogeneity
As argued above, a consumer’s susceptibility to internet search ads depends on how well
informed they are about where such products are available. Given that the availability
of products varies widely, the e↵ectiveness of paid search may vary by product type.
As a large e-commerce platform, eBay’s paid search advertising campaigns present an
opportunity to test the returns to advertising across product categories which vary in
competitiveness, market thickness and general desirability. To our surprise, di↵erent
product attributes did not o↵er any significant variation in paid search e↵ectiveness.
   As in Section 4.2, we decompose the response by interacting the treatment indicator
with dummies for sub-groupings of revenue using the category of sales. We found no
systematic relationship between returns and category. The estimates center around zero
and are generally not statistically significant. At the highest level, only one category is
significant, but with 38 coe cients, at least one will be significant by chance.
   We explored multiple layers of categorization, ranging from the broadest groupings of
hundreds of categories. The extensive inventory eBay o↵ers suggests that some categories

                                             17
would generate returns because customers would be unaware of their availability on eBay.
However, we have looked for di↵erential responses in very granular product categories and
found no consistent pattern of response. Moreover, less than 5 percent of categories are
statistically significant at the 5 percent confidence level. Moreover, in an examination of
the estimates at finer levels of categorization, we found no connection between ordinal
ranking of treatment impact product features like sales volume or availability. It is thus
evident that for a well known company like eBay, product attributes are less important in
search advertising than user intent and, more importantly, user information.


5     Channel Substitution
The brand query tests demonstrated that causal (incremental) returns were small because
users easily substituted paid search clicks for natural search clicks. Metaphorically, we
closed one door and users simply switched to the next easiest door. This substitution was
expected because users were using brand queries as simple navigational tools. Unbranded
queries are not simply navigational because users are using the search platform to find
any destination that has the desired product. Only experimental variation can quantify
the number of users who are actually informed by the presence of search advertising.
    Such experimentation can also measure the extent to which paid and natural search
are substitutes for non-brand terms. This substitution exists because non-brand searches
for many products that eBay sells should produce some amount of natural search tra c.
For example, in Figure 1a we showed Google’s search results page for the query “used
gibson les paul”. Notice that the second ad from the top, as well as the center image of
the guitar below it, are both paid ads that link to eBay. At the same time, the two bottom
results of the natural search part of the page also link to eBay. Hence, some substitution
from paid to natural search may occur for non-brand keywords as well.
    We measure this potential substitution by regressing natural search attributed sales on
paid search attributed sales. The two are naturally highly correlated because shocks to
purchase intent are common to both channels. We again use the experimental treatment
dummies as excluded instruments to measure the causal impact of increases in paid search
sales on natural search sales. The experimental dummies are correlated with paid search
sales because paid search spending, which was turned o↵ in the experiment is a driver of


                                            18
attributed sales, and the dummies are random by design so they are otherwise uncorrelated
with natural search sales.
                       Table 4: Natural Search Substitution
                      Dep Var: Log Non-Brand SEO Tracked Sales
                                          (1)         (2)         (3)         (4)
                                         OLS        OLS-FE        IV        IV-FE
               Log Paid Search Sales   0.699⇤⇤⇤     0.00560     -0.182    -0.0391⇤⇤⇤
                                       (0.0223)    (0.00433)   (0.126)     (0.0110)

               Constant                3.724⇤⇤⇤    9.038⇤⇤⇤    10.41⇤⇤⇤
                                       (0.174)     (0.0439)    (0.932)

               DMA,Date Fixed E↵ects                 YES                     YES
               Observations             23178       23178       14706       14706


    Table 4 shows the OLS and IV estimates with and without date and DMA fixed e↵ects.
Fixed e↵ects greatly reduce the bias but still leave the estimates wrongly positive. The IV
estimates show that paid and natural search are in fact substitutes but the estimates are
remarkably small with an an elasticity of -.039.
    This leaves open the question about tra c substitution. To extend the metaphor, we
closed the paid search door, saw no increase in tra c through the natural search door, but
still saw the same number of total purchases as evidenced by the una↵ected total sales.
Where did the additional take up come from? A decrease in the use of the search platform
without a corresponding drop in sales suggests a more complex relationship between paid
tra c origination and user purchase behavior. A natural hypothesis may again be the
sheer name recognition of eBay. Most people who are searching for goods may already
have eBay in their consideration set, and plan to visit the site directly unless they are
guided to the site with a convenient paid search ad. In lieu of this ad, therefore, the user
may just open a browser and type “www.ebay.com” directly into the address bar. We
hope to explore this hypothesis in future work.


6     Deriving Returns on Investment
To make the importance of our results clear and interpret their implications for business
decisions, we compute the implied return on investment (ROI) associated with spending
on paid search. To derive the ROI from the estimates of impacts on revenue we need to

                                            19
add information on spending. Imagine that initially the amount spent on paid search
was S 0 associated with revenues equal to R0 . Let            R = R1        R0 be the di↵erence in
revenues as a consequence of a di↵erence in spending,             S = S1      S 0 , and by definition,
             R
ROI =        S
                 1.
                            R
       Let   =   ln(R) ⇡   R0
                                be our estimated coe cient on paid search e↵ectiveness, that is,
the e↵ect of an increase in spend on revenues as estimated in tables 2 and 3.22 After some
simple algebra on this approximation we have,            R⇡    (1+ )
                                                                       ⇤ R0 . Using the definition of
ROI and setting S 0 = 0 (no spending on paid search), we have,


                                                      R0
                                       ROI ⇡                  1                                    (1)
                                               (1 + ) S 0

       It should be noted that this calculation of ROI considers only short term, immediate
revenues. The long term benefits of adding customers or informing customers of new
product holdings that leads to future returns are not accounted for. We discuss this further
in Section 7.
       In order to actually calculate the ROI from paid search we would need to use actual
revenues and costs from the DMAs used for the experiment (or total revenues and costs of
paid search), but these are proprietary information that we cannot reveal due to company
policy. Instead, we use revenues and costs from public sources regarding eBay’s operations.
Revenue in the U.S. is derived from eBay’s financial disclosures using Marketplaces net
revenue prorated to U.S. levels using the ratio of gross market volume (sales) in the U.S.
to global levels, which results in U.S. gross revenues of $2,880.64 (in millions).23 We obtain
paid search spending from the release of information about the expenditures of several top
advertising spenders on Google. Our estimate of eBay’s yearly paid search spending for
the U.S. is $51 million.24
       Table 5 presents the ROI estimates using our experimental results, coe cients from
Tables 2 and 3, and the publicly available reports on revenue and spending as described
above.
  22
     Recall that = ln(R1 ) ln(R0 ) = ln(1 + RR ) which for small values of RR equals approximately RR .
                                             0                              0                       0
  23
     Total revenues for 2012 were $7,398 and the share of eBay’s activity in the U.S. was
$26,424/$67,763.      See http://files.shareholder.com/downloads/ebay/2352190750x0x628825/
e8f7de32-e10a-4442-addb-3fad813d0e58/EBAY_News_2013_1_16_Earnings.pdf
  24
     The information reports a monthly spend of $4.25 million, which we impute to be $51 million. See
http://mashable.com/2010/09/06/brand-spending-google/


                                                  20
Table 5: Return on Investment

                                            OLS             IV       DnD
                                          (1)      (2)      (3)      (4)
                                          0.895    0.102 0.00563    0.0044    A
               Spend (Millions of $)    $ 51.00 $ 51.00 $ 51.00 $ 51.00       B
               Gross Revenue (R0 )     2,880.64 2,880.64 2,880.64 2,880.64    C
               Net Revenue (R0 )       1,520.13 2,614.01 2,864.51 2,868.02 D=C/(1+A)
                R                      1,360.51   266.63    16.13    12.62  E=C-D
               ROI                     2568%      423%     -68%      -75%      F=E/A-1


       As is evident, simple OLS estimation yields unrealistic returns of over 2500 percent and
even accounting for daily and geographic e↵ects implies returns that are greater than 400
percent, as shown in Column 2. The IV estimation reduces the ROI estimate significantly
below zero to negative 68 percent and our best estimate of average ROI using the direct
di↵erence-in-di↵erences estimation is negative 75 percent as shown in Column 4.25


7        Discussion
The results of our study show that for a well-known brand like eBay, the e cacy of SEM is
limited at best. For the most part, paid-search expenditures are concentrated on consumers
who would shop on eBay regardless of whether they were shown paid search ads. As we
outline in the introduction, of the $31.7 billion that was spent in the U.S. in 2011 on
internet advertising, the top 10 spenders in this channel account for about $2.36 billion.
These companies generally use the same methods and the same consulting firms to design
their ad campaigns and there are many reasons to think that the results we presented
above would generalize to these large and well known corporations. This would most likely
not be true for small and new entities that have no brand recognition, which must pay in
order to appear at the top of a search page for any given query.26
  25
     As described above, this calculation is done for revenue and spending obtained from public sources
about the U.S. portion of eBay. We can instead use reported global revenue from eBay’s 10K together
with spending estimates from Kantar Media as a robustness calculation (http://kantarmediana.com/
sites/default/files/kantareditor/Kantar_Media_2011_Full_Year_US_Ad_Spend.pdf). Since they
report total internet marketing expenditures globally, we can pro-rate the amount spent on paid search
using the IAB report, which states that paid search is about 46.5% of total internet marketing spend.
This places ROI at negative 60 percent, which is close to the negative 75 percent reported above in column
4. Columns 1 through 3 use a coe cient that is log-log and hence requires a slightly di↵erent derivation.
  26
     If you were to start a new online presence selling a high quality and low-priced widget, someone
querying the word “widget” would still most likely not see your site. This is a consequence of the PageRank


                                                    21
This begs the question: why do well-known branded companies spend such large
amounts of money on what seems to be a rather ine↵ective marketing channel? We believe
that the reason is the challenges that these companies face in generating causal measures
of the returns to advertising. As the results in Table 5 demonstrate, a naive regression
of sales on advertising spend would result in an ROI estimate of 2500 percent, while a
more thoughtful regression that accounts for seasonal and geographic variation would drop
that number to about 400 percent. Still, this vastly overestimates the negative 75 percent
that we estimate using the experiments. This is in line with other experimental results
obtained recently by Lewis et al. (2011) regarding the e↵ectiveness of display ads.27
    Of course, this overstated e↵ect from using regressions on observational data should
not be a surprise. It is precisely for this reason that scholars resort to natural experiments
(e.g., Goldfarb and Tucker (2011b)) or controlled experiments (e.g., Lewis et al. (2011)), in
order to correctly assess a variety of e↵ects related to internet marketing. This is, however,
not the norm in industry. Not only do most consulting firms who provide marketing
analytics services use observational data, recommendations from Google o↵er analytical
advice that is not consistent with true causal estimates of ad e↵ectiveness. As an example,
consider the advice that Google o↵ers its customers to calculate ROI:

      “Determining your AdWords ROI can be a very straightforward process if your
      business goal is web-based sales. You’ll already have the advertising costs for
      a specific time period for your AdWords account in the statistics from your
      Campaigns tab. The net profit for your business can then be calculated based
      on your company’s revenue from sales made via your AdWords advertising,
      minus the cost of your advertising. Divide your net profit by the advertising
      costs to get your AdWords ROI for that time period.”28

    This advice is very much akin to running a regression of sales on adwords expenditures,
which is not too di↵erent from the approach that result in the inflated ROIs that we report
in columns 1 and 2 of Table 5. It does not, however account for the endogeneity concern
algorithm that relies on established links to webpages. Only after many websites link to your site, related
to the word widget, will you stand a chance of rising to the top of the organic search results.
  27
     Using a controlled experiment they demonstrated that displaying a certain brand ad resulted in an
increase of 5.4 percent in the number of users performing searches on a set of keywords related to that
brand. They then compared the experimental estimate to an observational regression estimate, which
resulted in an increase ranging from 871 percent to 1198 percent.
  28
     See http://support.google.com/adwords/answer/1722066


                                                    22
that our study highlights where consumers who use paid search advertising on their way
to a purchase may have completed that purchase even without the paid search ads. The
only way to circumvent this measurement concern is to adopt a controlled test that is able
to distinguish between the behavior of consumers who see ads and those who don’t. As
we have shown, once this is done correctly, estimates of ROI shrink dramatically, and for
our case become very negative.29
       The experimental design that we use exploits the ability of an advertiser to geograph-
ically control the ad expenses across DMAs, thus yielding a large-scale test-bed for ad
e↵ectiveness. The idealized experiment would have been conducted on a more refined
user-level randomization, which would allow us to control for a host of observable user-level
characteristics.30 Still, given the magnitude of our experiment and our ability to aggregate
users by measures of recency, frequency, and other characteristics, we are able to detect
heterogeneous responses that shed light on the way users respond to ads. As targeting
technology is developed further in the near future, individual-level experiments can be
performed and more insights will surely be uncovered.


  29
     As mentioned earlier, this is only a short term estimate. Still, to overcome the short-term negative
ROI of 75% it is possible to calculate the lifetime value of a customer acquired that would be required to
make the investment worthwhile. This is beyond the scope of our current research.
  30
     For example, Anderson and Simester (2010) analyze results from experiments using direct mailing
catalogs which are addressed to specific individuals for which the company has lots of demographic
information. This level of targeting is not currently feasible with online ads.


                                                   23
References
Ackerberg, Daniel A, “Empirically distinguishing informative and prestige e↵ects of advertising,”
  RAND Journal of Economics, 2001, pp. 316–333.

Anderson, Eric T and Duncan I Simester, “Price stickiness and customer antagonism,” The Quarterly
 Journal of Economics, 2010, 125 (2), 729–765.

Athey, Susan and Glenn Ellison, “Position auctions with consumer search,” The Quarterly Journal
  of Economics, 2011, 126 (3), 1213–1270.

Bagwell, Kyle, “The economic analysis of advertising,” Handbook of industrial organization, 2007, 3,
  1701–1844.

Berndt, Ernst R, The practice of econometrics: classic and contemporary, Addison-Wesley Reading,
  MA, 1991.

Chan, Tat Y, Chunhua Wu, and Ying Xie, “Measuring the lifetime value of customers acquired
  from google search advertising,” Marketing Science, 2011, 30 (5), 837–850.

Edelman, Benjamin, Michael Ostrovsky, and Michael Schwarz, “Internet advertising and the
  generalized second price auction: Selling billions of dollars worth of keywords,” The American Economic
  Review, 2007, 97 (1), 242–259.

Fader, P.S., B.G.S. Hardie, and K.L. Lee, “RFM and CLV: Using iso-value curves for customer
  base analysis,” Journal of Marketing Research, 2005, pp. 415–430.

Goldfarb, A., “What is di↵erent about online advertising?,” Review of Industrial Organization, forth-
 coming, 2012.

Goldfarb, Avi and Catherine Tucker, “Online display advertising: Targeting and obtrusiveness,”
 Marketing Science, 2011, 30 (3), 389–404.

   and     , “Search engine advertising: Channel substitution when pricing ads to context,” Management
  Science, 2011, 57 (3), 458–470.

Lewis, R.A., J.M. Rao, and D.H. Reiley, “Here, there, and everywhere: correlated online behaviors
  can lead to overestimates of the e↵ects of advertising,” in “Proceedings of the 20th international
  conference on World wide web” ACM 2011, pp. 157–166.

Lewis, Randall and David Reiley, “Does retail advertising work: Measuring the e↵ects of advertising
  on sales via a controlled experiment on Yahoo!,” Technical Report, Working paper 2010.

Manchanda, Puneet, Jean-Pierre Dub´, Khim Yong Goh, and Pradeep K Chintagunta, “The
                                          e
 e↵ect of banner advertising on internet purchasing,” Journal of Marketing Research, 2006, pp. 98–108.

Rutz, Oliver J and Randolph E Bucklin, “From Generic to Branded: A Model of Spillover in Paid
 Search Advertising,” Journal of Marketing Research, 2011, 48 (1), 87–102.

Sahni, Navdeep, “E↵ect of Temporal Spacing between Advertising Exposures: Evidence from an Online
  Field Experiment,” 2011.

Varian, Hal R, “Position auctions,” International Journal of Industrial Organization, 2007, 25 (6),
  1163–1178.


                                                   24
Yang, S. and A. Ghose, “Analyzing the relationship between organic and sponsored search advertising:
  Positive, negative, or zero interdependence?,” Marketing Science, 2010, 29 (4), 602–623.

Yao, Song and Carl F Mela, “A dynamic model of sponsored search advertising,” Marketing Science,
  2011, 30 (3), 447–468.


                                                25

More Related Content

What's hot

Bye, Bye Research. Hello Data Mining!
Bye, Bye Research.  Hello Data Mining!Bye, Bye Research.  Hello Data Mining!
Bye, Bye Research. Hello Data Mining!cgomez10
 
NRF Big Show: The Digital Channel
NRF Big Show: The Digital ChannelNRF Big Show: The Digital Channel
NRF Big Show: The Digital ChannelResource/Ammirati
 
Amex Training 10 08 V3
Amex Training 10 08 V3Amex Training 10 08 V3
Amex Training 10 08 V3guestd38fb8
 
The World’s 50 Most Influential CMOs Study 2015
The World’s 50 Most Influential CMOs Study 2015The World’s 50 Most Influential CMOs Study 2015
The World’s 50 Most Influential CMOs Study 2015ScribbleLive
 
Sip digital certification couse ppt
Sip digital certification couse   pptSip digital certification couse   ppt
Sip digital certification couse pptArham Bothra
 
MYTH-BUSTING SOCIAL MEDIA ADVERTISING - Convertro social media_report_final2
MYTH-BUSTING  SOCIAL MEDIA ADVERTISING - Convertro social media_report_final2MYTH-BUSTING  SOCIAL MEDIA ADVERTISING - Convertro social media_report_final2
MYTH-BUSTING SOCIAL MEDIA ADVERTISING - Convertro social media_report_final2Abdallah Nabulsi
 
Evaluating True Value Vs Hype In Bto B Media
Evaluating True Value Vs Hype In Bto B MediaEvaluating True Value Vs Hype In Bto B Media
Evaluating True Value Vs Hype In Bto B Mediaelanorafagan
 
The consumer decision journey mc kinsey quarterly - marketing - strategy
The consumer decision journey   mc kinsey quarterly - marketing - strategyThe consumer decision journey   mc kinsey quarterly - marketing - strategy
The consumer decision journey mc kinsey quarterly - marketing - strategyNoah Barlow @ Blueband Media
 
E marketer overview_of_digital_cp_ms-measures_of_digital_performance_place_pr...
E marketer overview_of_digital_cp_ms-measures_of_digital_performance_place_pr...E marketer overview_of_digital_cp_ms-measures_of_digital_performance_place_pr...
E marketer overview_of_digital_cp_ms-measures_of_digital_performance_place_pr...AdCMO
 
Google and Internet Advertising
Google and Internet AdvertisingGoogle and Internet Advertising
Google and Internet AdvertisingTodd Gardner
 
Content Marketing in the Digital Driver's Seat
Content Marketing in the Digital Driver's SeatContent Marketing in the Digital Driver's Seat
Content Marketing in the Digital Driver's SeatScribbleLive
 
Marketingcharts Powerpoint The Marketing Data Box
Marketingcharts Powerpoint The Marketing Data BoxMarketingcharts Powerpoint The Marketing Data Box
Marketingcharts Powerpoint The Marketing Data BoxErgaro S.A. de C.V
 

What's hot (15)

Bye, Bye Research. Hello Data Mining!
Bye, Bye Research.  Hello Data Mining!Bye, Bye Research.  Hello Data Mining!
Bye, Bye Research. Hello Data Mining!
 
NRF Big Show: The Digital Channel
NRF Big Show: The Digital ChannelNRF Big Show: The Digital Channel
NRF Big Show: The Digital Channel
 
Amex Training 10 08 V3
Amex Training 10 08 V3Amex Training 10 08 V3
Amex Training 10 08 V3
 
The World’s 50 Most Influential CMOs Study 2015
The World’s 50 Most Influential CMOs Study 2015The World’s 50 Most Influential CMOs Study 2015
The World’s 50 Most Influential CMOs Study 2015
 
Sip digital certification couse ppt
Sip digital certification couse   pptSip digital certification couse   ppt
Sip digital certification couse ppt
 
Internet advertising
Internet advertisingInternet advertising
Internet advertising
 
MYTH-BUSTING SOCIAL MEDIA ADVERTISING - Convertro social media_report_final2
MYTH-BUSTING  SOCIAL MEDIA ADVERTISING - Convertro social media_report_final2MYTH-BUSTING  SOCIAL MEDIA ADVERTISING - Convertro social media_report_final2
MYTH-BUSTING SOCIAL MEDIA ADVERTISING - Convertro social media_report_final2
 
Evaluating True Value Vs Hype In Bto B Media
Evaluating True Value Vs Hype In Bto B MediaEvaluating True Value Vs Hype In Bto B Media
Evaluating True Value Vs Hype In Bto B Media
 
The consumer decision journey mc kinsey quarterly - marketing - strategy
The consumer decision journey   mc kinsey quarterly - marketing - strategyThe consumer decision journey   mc kinsey quarterly - marketing - strategy
The consumer decision journey mc kinsey quarterly - marketing - strategy
 
The Marketing Data Box 2011
The Marketing Data Box 2011The Marketing Data Box 2011
The Marketing Data Box 2011
 
E marketer overview_of_digital_cp_ms-measures_of_digital_performance_place_pr...
E marketer overview_of_digital_cp_ms-measures_of_digital_performance_place_pr...E marketer overview_of_digital_cp_ms-measures_of_digital_performance_place_pr...
E marketer overview_of_digital_cp_ms-measures_of_digital_performance_place_pr...
 
Google and Internet Advertising
Google and Internet AdvertisingGoogle and Internet Advertising
Google and Internet Advertising
 
Content Marketing in the Digital Driver's Seat
Content Marketing in the Digital Driver's SeatContent Marketing in the Digital Driver's Seat
Content Marketing in the Digital Driver's Seat
 
The Marketing Data Box from Hubspot
The Marketing Data Box from HubspotThe Marketing Data Box from Hubspot
The Marketing Data Box from Hubspot
 
Marketingcharts Powerpoint The Marketing Data Box
Marketingcharts Powerpoint The Marketing Data BoxMarketingcharts Powerpoint The Marketing Data Box
Marketingcharts Powerpoint The Marketing Data Box
 

Viewers also liked

Personality driven to standards driven management
Personality driven to standards driven managementPersonality driven to standards driven management
Personality driven to standards driven managementpadtheleadershiproundtable
 
Web 2.0 - Metrics in a Post Page Impression World - eMetrics 2009
Web 2.0 - Metrics in a Post Page Impression World - eMetrics 2009Web 2.0 - Metrics in a Post Page Impression World - eMetrics 2009
Web 2.0 - Metrics in a Post Page Impression World - eMetrics 2009Deepak Nadig
 
Global Challenges At The Corner of Content And Commerce - David Braun, Ralph ...
Global Challenges At The Corner of Content And Commerce - David Braun, Ralph ...Global Challenges At The Corner of Content And Commerce - David Braun, Ralph ...
Global Challenges At The Corner of Content And Commerce - David Braun, Ralph ...Akamai Technologies
 
Real User Monitoring: Getting Real Data from Real Users in the Real World - S...
Real User Monitoring: Getting Real Data from Real Users in the Real World - S...Real User Monitoring: Getting Real Data from Real Users in the Real World - S...
Real User Monitoring: Getting Real Data from Real Users in the Real World - S...Akamai Technologies
 
Edge 2014: Increasing Control with Property Manager with eBay
Edge 2014: Increasing Control with Property Manager with eBayEdge 2014: Increasing Control with Property Manager with eBay
Edge 2014: Increasing Control with Property Manager with eBayAkamai Technologies
 
eBay - The Science of Making Better Predictions
eBay - The Science of Making Better PredictionseBay - The Science of Making Better Predictions
eBay - The Science of Making Better PredictionsIncubeta NMPi
 
eBay Architecture
eBay Architecture eBay Architecture
eBay Architecture Tony Ng
 
CDN Performance at eBay from Thousandeyes Connect
CDN Performance at eBay from Thousandeyes ConnectCDN Performance at eBay from Thousandeyes Connect
CDN Performance at eBay from Thousandeyes ConnectThousandEyes
 
ebay marketing
ebay marketingebay marketing
ebay marketingAnil Kumar
 

Viewers also liked (10)

Personality driven to standards driven management
Personality driven to standards driven managementPersonality driven to standards driven management
Personality driven to standards driven management
 
Web 2.0 - Metrics in a Post Page Impression World - eMetrics 2009
Web 2.0 - Metrics in a Post Page Impression World - eMetrics 2009Web 2.0 - Metrics in a Post Page Impression World - eMetrics 2009
Web 2.0 - Metrics in a Post Page Impression World - eMetrics 2009
 
Global Challenges At The Corner of Content And Commerce - David Braun, Ralph ...
Global Challenges At The Corner of Content And Commerce - David Braun, Ralph ...Global Challenges At The Corner of Content And Commerce - David Braun, Ralph ...
Global Challenges At The Corner of Content And Commerce - David Braun, Ralph ...
 
Real User Monitoring: Getting Real Data from Real Users in the Real World - S...
Real User Monitoring: Getting Real Data from Real Users in the Real World - S...Real User Monitoring: Getting Real Data from Real Users in the Real World - S...
Real User Monitoring: Getting Real Data from Real Users in the Real World - S...
 
eBay Advertising_ Audience Guide_2016
eBay Advertising_ Audience Guide_2016eBay Advertising_ Audience Guide_2016
eBay Advertising_ Audience Guide_2016
 
Edge 2014: Increasing Control with Property Manager with eBay
Edge 2014: Increasing Control with Property Manager with eBayEdge 2014: Increasing Control with Property Manager with eBay
Edge 2014: Increasing Control with Property Manager with eBay
 
eBay - The Science of Making Better Predictions
eBay - The Science of Making Better PredictionseBay - The Science of Making Better Predictions
eBay - The Science of Making Better Predictions
 
eBay Architecture
eBay Architecture eBay Architecture
eBay Architecture
 
CDN Performance at eBay from Thousandeyes Connect
CDN Performance at eBay from Thousandeyes ConnectCDN Performance at eBay from Thousandeyes Connect
CDN Performance at eBay from Thousandeyes Connect
 
ebay marketing
ebay marketingebay marketing
ebay marketing
 

Similar to eBay's SEM example that proves worthless advertising

Consumer heterogeneity and paid search effectiveness: A large scale field exp...
Consumer heterogeneity and paid search effectiveness: A large scale field exp...Consumer heterogeneity and paid search effectiveness: A large scale field exp...
Consumer heterogeneity and paid search effectiveness: A large scale field exp...Ира Пустовит
 
Consumer Heterogeneity and Paid Search EFFectiveness: A Large Scale Field Exp...
Consumer Heterogeneity and Paid Search EFFectiveness: A Large Scale Field Exp...Consumer Heterogeneity and Paid Search EFFectiveness: A Large Scale Field Exp...
Consumer Heterogeneity and Paid Search EFFectiveness: A Large Scale Field Exp...PhoneTrack
 
The Rocky Relationship Between Facebook & General Motors
The Rocky Relationship Between Facebook & General MotorsThe Rocky Relationship Between Facebook & General Motors
The Rocky Relationship Between Facebook & General MotorsStacey Troup
 
Internet advertising an interplay among advertisers,online publishers, ad exc...
Internet advertising an interplay among advertisers,online publishers, ad exc...Internet advertising an interplay among advertisers,online publishers, ad exc...
Internet advertising an interplay among advertisers,online publishers, ad exc...Trieu Nguyen
 
The InstantPot: A Marketing Sensation
The InstantPot:  A Marketing SensationThe InstantPot:  A Marketing Sensation
The InstantPot: A Marketing SensationStacey Troup
 
eMarketer Webinar: Keys to Online Display Advertising
eMarketer Webinar: Keys to Online Display AdvertisingeMarketer Webinar: Keys to Online Display Advertising
eMarketer Webinar: Keys to Online Display AdvertisingeMarketer
 
Google ads vs facebook ads
Google ads vs facebook adsGoogle ads vs facebook ads
Google ads vs facebook adsPurnangaDas
 
overview on online advertising
overview on  online advertisingoverview on  online advertising
overview on online advertisingNITK
 
E marketer integrating_search_and_display-tactics_for_more_effective_advertising
E marketer integrating_search_and_display-tactics_for_more_effective_advertisingE marketer integrating_search_and_display-tactics_for_more_effective_advertising
E marketer integrating_search_and_display-tactics_for_more_effective_advertisingAdCMO
 
Using Online Advertising To Build Brands
Using Online Advertising To Build BrandsUsing Online Advertising To Build Brands
Using Online Advertising To Build BrandsKantar
 
Yahoo! Study: Does retail advertising work?
Yahoo! Study: Does retail advertising work?Yahoo! Study: Does retail advertising work?
Yahoo! Study: Does retail advertising work?Yahoo Deutschland
 
What Would Don Draper Do ?
What Would Don Draper Do ?What Would Don Draper Do ?
What Would Don Draper Do ?rdoherty60
 
Azizul Hakim Poster PDF1
Azizul Hakim Poster PDF1Azizul Hakim Poster PDF1
Azizul Hakim Poster PDF1Aziz hakim
 
Amex Training 10 08 V3
Amex Training 10 08 V3Amex Training 10 08 V3
Amex Training 10 08 V3aquigley76
 
Com score ars when advertising goes digital
Com score ars   when advertising goes digitalCom score ars   when advertising goes digital
Com score ars when advertising goes digitalDigitalReport
 
Search Engine Marketing and The Internet for Distribution
Search Engine Marketing and The Internet for DistributionSearch Engine Marketing and The Internet for Distribution
Search Engine Marketing and The Internet for Distributiontutubitika
 
Internet Advertising Report
Internet Advertising ReportInternet Advertising Report
Internet Advertising ReportSiddhant Bhatia
 
Online display eco system
Online display eco systemOnline display eco system
Online display eco systemAdCMO
 

Similar to eBay's SEM example that proves worthless advertising (20)

Consumer heterogeneity and paid search effectiveness: A large scale field exp...
Consumer heterogeneity and paid search effectiveness: A large scale field exp...Consumer heterogeneity and paid search effectiveness: A large scale field exp...
Consumer heterogeneity and paid search effectiveness: A large scale field exp...
 
Consumer Heterogeneity and Paid Search EFFectiveness: A Large Scale Field Exp...
Consumer Heterogeneity and Paid Search EFFectiveness: A Large Scale Field Exp...Consumer Heterogeneity and Paid Search EFFectiveness: A Large Scale Field Exp...
Consumer Heterogeneity and Paid Search EFFectiveness: A Large Scale Field Exp...
 
The Rocky Relationship Between Facebook & General Motors
The Rocky Relationship Between Facebook & General MotorsThe Rocky Relationship Between Facebook & General Motors
The Rocky Relationship Between Facebook & General Motors
 
E marketer SEM
E marketer SEME marketer SEM
E marketer SEM
 
Internet advertising an interplay among advertisers,online publishers, ad exc...
Internet advertising an interplay among advertisers,online publishers, ad exc...Internet advertising an interplay among advertisers,online publishers, ad exc...
Internet advertising an interplay among advertisers,online publishers, ad exc...
 
The InstantPot: A Marketing Sensation
The InstantPot:  A Marketing SensationThe InstantPot:  A Marketing Sensation
The InstantPot: A Marketing Sensation
 
eMarketer Webinar: Keys to Online Display Advertising
eMarketer Webinar: Keys to Online Display AdvertisingeMarketer Webinar: Keys to Online Display Advertising
eMarketer Webinar: Keys to Online Display Advertising
 
Google ads vs facebook ads
Google ads vs facebook adsGoogle ads vs facebook ads
Google ads vs facebook ads
 
overview on online advertising
overview on  online advertisingoverview on  online advertising
overview on online advertising
 
E marketer integrating_search_and_display-tactics_for_more_effective_advertising
E marketer integrating_search_and_display-tactics_for_more_effective_advertisingE marketer integrating_search_and_display-tactics_for_more_effective_advertising
E marketer integrating_search_and_display-tactics_for_more_effective_advertising
 
Using Online Advertising To Build Brands
Using Online Advertising To Build BrandsUsing Online Advertising To Build Brands
Using Online Advertising To Build Brands
 
Yahoo! Study: Does retail advertising work?
Yahoo! Study: Does retail advertising work?Yahoo! Study: Does retail advertising work?
Yahoo! Study: Does retail advertising work?
 
What Would Don Draper Do ?
What Would Don Draper Do ?What Would Don Draper Do ?
What Would Don Draper Do ?
 
Azizul Hakim Poster PDF1
Azizul Hakim Poster PDF1Azizul Hakim Poster PDF1
Azizul Hakim Poster PDF1
 
Amex Training 10 08 V3
Amex Training 10 08 V3Amex Training 10 08 V3
Amex Training 10 08 V3
 
Com score ars when advertising goes digital
Com score ars   when advertising goes digitalCom score ars   when advertising goes digital
Com score ars when advertising goes digital
 
Search Engine Marketing and The Internet for Distribution
Search Engine Marketing and The Internet for DistributionSearch Engine Marketing and The Internet for Distribution
Search Engine Marketing and The Internet for Distribution
 
Internet Advertising Report
Internet Advertising ReportInternet Advertising Report
Internet Advertising Report
 
Online display eco system
Online display eco systemOnline display eco system
Online display eco system
 
Can Old Media enhance New Media
Can Old Media enhance New MediaCan Old Media enhance New Media
Can Old Media enhance New Media
 

More from Titus Capilnean

DigitalGenius - Human+AI for Customer Service
DigitalGenius - Human+AI for Customer ServiceDigitalGenius - Human+AI for Customer Service
DigitalGenius - Human+AI for Customer ServiceTitus Capilnean
 
Digital Doughnut - 2013 Inbound marketing report
Digital Doughnut - 2013 Inbound marketing reportDigital Doughnut - 2013 Inbound marketing report
Digital Doughnut - 2013 Inbound marketing reportTitus Capilnean
 
Report on social media 04 - 26 - 2013
Report on social media 04 - 26 - 2013Report on social media 04 - 26 - 2013
Report on social media 04 - 26 - 2013Titus Capilnean
 
Poznan 2013-homeless-world-cup-first-press-release-2
Poznan 2013-homeless-world-cup-first-press-release-2Poznan 2013-homeless-world-cup-first-press-release-2
Poznan 2013-homeless-world-cup-first-press-release-2Titus Capilnean
 
Technorati's 2013 Digital Influence Report
Technorati's 2013 Digital Influence ReportTechnorati's 2013 Digital Influence Report
Technorati's 2013 Digital Influence ReportTitus Capilnean
 
IAB Europe Mediascope 2012 Romania
IAB Europe Mediascope 2012 RomaniaIAB Europe Mediascope 2012 Romania
IAB Europe Mediascope 2012 RomaniaTitus Capilnean
 
Gamification Nation - digital marketing forum 2012
Gamification Nation - digital marketing forum 2012Gamification Nation - digital marketing forum 2012
Gamification Nation - digital marketing forum 2012Titus Capilnean
 
De la utilizator de internet la client - Marketing 24/7 2011
De la utilizator de internet la client - Marketing 24/7 2011De la utilizator de internet la client - Marketing 24/7 2011
De la utilizator de internet la client - Marketing 24/7 2011Titus Capilnean
 
Online communication strategy - 2011- 2012 - aiesec
Online communication strategy - 2011- 2012 - aiesecOnline communication strategy - 2011- 2012 - aiesec
Online communication strategy - 2011- 2012 - aiesecTitus Capilnean
 
Ziua digitala a copilului 2011
Ziua digitala a copilului 2011Ziua digitala a copilului 2011
Ziua digitala a copilului 2011Titus Capilnean
 
Branding personal bizcamp
Branding personal   bizcampBranding personal   bizcamp
Branding personal bizcampTitus Capilnean
 
Prezentare retargeting final
Prezentare retargeting finalPrezentare retargeting final
Prezentare retargeting finalTitus Capilnean
 
Cum sa te folosesti de social media
Cum sa te folosesti de social mediaCum sa te folosesti de social media
Cum sa te folosesti de social mediaTitus Capilnean
 
Winners - Portoroz Piran Genius Loci
Winners - Portoroz Piran Genius LociWinners - Portoroz Piran Genius Loci
Winners - Portoroz Piran Genius LociTitus Capilnean
 
Promoting Romania - the Google Way
Promoting Romania - the Google WayPromoting Romania - the Google Way
Promoting Romania - the Google WayTitus Capilnean
 

More from Titus Capilnean (15)

DigitalGenius - Human+AI for Customer Service
DigitalGenius - Human+AI for Customer ServiceDigitalGenius - Human+AI for Customer Service
DigitalGenius - Human+AI for Customer Service
 
Digital Doughnut - 2013 Inbound marketing report
Digital Doughnut - 2013 Inbound marketing reportDigital Doughnut - 2013 Inbound marketing report
Digital Doughnut - 2013 Inbound marketing report
 
Report on social media 04 - 26 - 2013
Report on social media 04 - 26 - 2013Report on social media 04 - 26 - 2013
Report on social media 04 - 26 - 2013
 
Poznan 2013-homeless-world-cup-first-press-release-2
Poznan 2013-homeless-world-cup-first-press-release-2Poznan 2013-homeless-world-cup-first-press-release-2
Poznan 2013-homeless-world-cup-first-press-release-2
 
Technorati's 2013 Digital Influence Report
Technorati's 2013 Digital Influence ReportTechnorati's 2013 Digital Influence Report
Technorati's 2013 Digital Influence Report
 
IAB Europe Mediascope 2012 Romania
IAB Europe Mediascope 2012 RomaniaIAB Europe Mediascope 2012 Romania
IAB Europe Mediascope 2012 Romania
 
Gamification Nation - digital marketing forum 2012
Gamification Nation - digital marketing forum 2012Gamification Nation - digital marketing forum 2012
Gamification Nation - digital marketing forum 2012
 
De la utilizator de internet la client - Marketing 24/7 2011
De la utilizator de internet la client - Marketing 24/7 2011De la utilizator de internet la client - Marketing 24/7 2011
De la utilizator de internet la client - Marketing 24/7 2011
 
Online communication strategy - 2011- 2012 - aiesec
Online communication strategy - 2011- 2012 - aiesecOnline communication strategy - 2011- 2012 - aiesec
Online communication strategy - 2011- 2012 - aiesec
 
Ziua digitala a copilului 2011
Ziua digitala a copilului 2011Ziua digitala a copilului 2011
Ziua digitala a copilului 2011
 
Branding personal bizcamp
Branding personal   bizcampBranding personal   bizcamp
Branding personal bizcamp
 
Prezentare retargeting final
Prezentare retargeting finalPrezentare retargeting final
Prezentare retargeting final
 
Cum sa te folosesti de social media
Cum sa te folosesti de social mediaCum sa te folosesti de social media
Cum sa te folosesti de social media
 
Winners - Portoroz Piran Genius Loci
Winners - Portoroz Piran Genius LociWinners - Portoroz Piran Genius Loci
Winners - Portoroz Piran Genius Loci
 
Promoting Romania - the Google Way
Promoting Romania - the Google WayPromoting Romania - the Google Way
Promoting Romania - the Google Way
 

eBay's SEM example that proves worthless advertising

  • 1. Consumer Heterogeneity and Paid Search E↵ectiveness: A Large Scale Field Experiment Thomas Blake⇤ Chris Nosko† Steven Tadelis‡ March 6, 2013§ Abstract Internet advertising has been the fastest growing advertising channel in recent years with paid advertisements on search platforms (e.g., Google and Bing) comprising the bulk of this revenue. We present results from a series of large-scale field experiments done at eBay that are designed to detect the causal e↵ectiveness of paid search advertisements. Results show that brand-keyword ads have no short-term benefits, and that returns from all other keywords are a fraction of conventional estimates. We find that new and infrequent users are positively influenced by ads but that existing loyal users whose purchasing behavior is not influenced by paid search account for most of the advertising expenses, resulting in average returns that are negative. We discuss substitution to other channels and implications for advertising decisions in large firms. ⇤ eBay Research Labs. Email: thblake@ebay.com † University of Chicago and eBay Research Labs. Email: cnosko@chicagobooth.edu ‡ UC Berkeley and eBay Research Labs. Email: stadelis@ebay.com § Work in progress - preliminary and incomplete.
  • 2. 1 Introduction Advertising expenses account for a sizeable portion of costs for many firms and corpo- rations across the globe. In recent years the internet advertising industry has grown disproportionately, with revenues in the United States alone totaling $31.7 billion for 2011, up 21.9 percent from 2010. Of the di↵erent forms of internet advertising, paid search advertising, also known in industry as “search engine marketing” (SEM) remains the largest online advertising revenue format, accounting for 46.5 percent of 2011 revenues, or $14.8 billion, up almost 27 percent from $11.7 billion in 2010.1 Google Inc., the leading SEM provider, registered $37.9 billion in global revenues in 2011, of which $36.5 billion, or 96 percent, were attributed to advertising.2 In this study we report the results from a series of controlled experiments conducted at eBay Inc., where large-scale SEM campaigns were randomly executed across the U.S. Our contributions can be summarized by three main findings. First, “brand” keyword advertising (where firms purchase advertisements on searches for their own brand name), a practice used by many companies, is ine↵ective because, absent paid search links, consumers simply substitute to (unpaid) organic search links. This implies that brand keyword advertising expenses have neither persuasive nor informative value to well known corporations, and arguably, for other companies as well. Second, the e↵ectiveness of SEM for non-branded keywords is small for a large and well-known brand like eBay and the channel has been ine↵ective on average. Finally, we show that there is a small yet detectable positive impact of SEM on new user acquisition and on informing infrequent users about the value of using eBay. This last finding supports the informative view of advertising and implies that targeting uninformed users is a critical factor for successful advertising. The actual e↵ects of advertising on business performance have always been considered hard to measure. A famous quote attributed to the late 19th century retailer John Wannamaker states that “I know half the money I spend on advertising is wasted, but I can never find out which half.” Traditional advertising channels such as TV, radio, print and billboards have somewhat limited targeting capabilities, and advertisers often waste 1 These estimates were reported in the IAB Internet Advertising Revenue Report conducted by PwC and Sponsored by the Interactive Advertising Bureau (IAB) 2011 Full Year Results published in April 2012. See http://www.iab.net/media/file/IAB_Internet_Advertising_Revenue_Report_FY_2011.pdf 2 See Google’s webpage http://investor.google.com/financial/tables.html 1
  • 3. valuable marketing dollars on “infra-marginal” consumers who are not a↵ected by ads to get to those marginal consumers who are. The advent of internet marketing channels has been lauded as the answer to this long-standing dilemma for two main reasons. First, the technology allows advertisers to target their ads to the activity that potential consumers are engaged in (Goldfarb (2012) argues this is the main di↵erentiator between online and o✏ine advertising channels). For instance, when a person is reading content related to sports, like ESPN.com or Yahoo! Sports, advertisers can bid to have display ads appear on the pages that are being read. Similarly, if a user is searching Google or Bing for information about flat-screen TVs, retailers and manufacturers of these goods can bid for sponsored search ads that are related to the user’s query. The belief is that these ads will better target the intent of the user, and not waste valuable resources on uninterested shoppers. Second, the technology allows advertisers to track variables that are supposed to help measure the e cacy of the ads. An online advertiser will receive detailed data on which of its website’s visitors were directed by the ad, how much was paid for the ad, and using its own internal data flow, whether or not the visitor purchased anything from the website. In theory, this should allow the advertiser to compute the returns on investment because both cost and revenue data is available at the individual visitor level. Despite these advantages, endogeneity concerns present serious challenges to correctly detecting the causal returns from internet advertising. Traditionally, economists have focused on endogeneity stemming from firm decisions to increase advertising during times of high demand (e.g., advertising during the Holidays) or when revenues are high (e.g., advertising budgets that are set as a percentage of previous-quarter revenue).3 Our concern, instead, is that the amount spent on SEM (and many other internet marketing channels) is a function not only of the advertiser’s campaign, but is also determined by the behavior and intent of consumers. For example, the amount spent by an advertiser on an ad in the print edition of the New York Times is independent of consumer response to that advertisement (regardless of whether this response is correlated or causal). In contrast, if an advertiser purchases SEM ads, expenditures rise with usage (i.e., consumer click-through).4 Our research highlights one potential drawback inherent in this form of targeting: While these 3 See Berndt (1991), Chapter 8, for a survey of this literature. 4 Pay per click and pay per impression models are the predominant pricing regimes for these channels. Many of the problems of evaluating the causal returns from pay-per-click advertising also apply to tracking coupon usage. 2
  • 4. consumers may look like good targets for advertising campaigns, they are also the types of consumer that are already informed about the advertiser’s product, making them the less susceptible to informative advertising channels. In many cases, the consumers who choose to click on these SEM ads are loyal brand customers or otherwise already informed about a firm’s product. Advertising may appear like it is successfully attracting these consumers, when in reality they would have found other channels to the firm’s website. It is this challenging endogeneity concern that we are able to alleviate with the design of our controlled experiments. We begin our analysis with experiments that test the e cacy of what is referred to as “brand” keyword advertising, a practice that has been used by most major corporations to date. For example, when this paragraph was written (February 16, 2013), Google searches for the keywords “AT&T”, “Macy”, “Safeway”, “Ford” and “Amazon” resulted in paid ads at the top of the search results page directly above natural (also known as organic) unpaid links to the companies’ sites. Arguably, consumers who query such a narrow term intend to go to that firm’s website and are seeking the easiest route there. Paid search links simply intercept consumers at the last point in their navigational process. Thus, brand keyword advertising highlights an extreme version of the endogeneity concern described above. We seek to quantify any value from advertising in this setting and then generalize to non-brand advertising, where these concerns might be less extreme but still present.5 Our brand keyword experiments show that there is no short-term value in brand keyword advertising. In March of 2012, eBay conducted a test to study the returns of brand keyword advertising (all queries that included the term eBay, including multi-word terms such as “ebay shoes”) by halting SEM queries on these keywords on both Yahoo! and Microsoft (MSN), while continuing to pay for these terms on Google, which we use as a control in our estimation routine. The results show that almost all of the forgone click tra c and attributed sales was immediately captured by natural search.6 That is, substitution between paid and unpaid tra c was nearly complete. Removal of these advertisements simply raised the prominence of the eBay natural search result. Shutting 5 A quick search for the term “brand keyword advertising” will yield dozens of sites many from online ad service agencies that discuss the importance of paying for your own branded keywords. Most of the discussions are somewhat obfuscated, but one reasonable argument is that competitors may bid on a company’s branded keywords in an attempt to “steal” visitor tra c. Such behavior was absent in our studies and we discuss this issue further in section 6. 6 Throughout, we refer to sales as the total dollar value of goods purchased by users on eBay. Revenue is close to a constant fraction of sales, so percentage changes in the two are equivalent. 3
  • 5. o↵ paid search advertisements closed one (costly) path to a firm’s website but diverted tra c to the next easiest path (natural search), which is free to the advertiser. We confirm this result further using a geography-based experiment on Google’s search platform in Europe. Halting brand keyword advertising also resulted in no detectable drop in tra c and sales. Non-branded keyword advertising presents a more general problem. eBay historically managed over 170 million keywords and keyword combinations using algorithms that are updated daily and automatically feed into Google’s, Microsoft’s and Yahoo!’s search platforms.7 Examples of such keyword strings are “memory”, “cell phone” and “used gibson les paul”. Unlike branded search, where a firm’s website is usually in the top organic search slot, organic placement for non-branded terms vary widely. Furthermore, even if substitution between paid and organic search does not occur (for instance, if eBay does not appear in the organic search results), consumers may use other channels to navigate to a firm’s website, such as directly typing in the website name or navigating through other internet advertising channels. Hence, with non-branded search, we suspect that organic search substitution may be less of a problem but substitution to other channels could continue to drive purchases even in the absence of SEM. To address this question, we designed a controlled experiment using Google’s geographic bid feature that can determine, with a reasonable degree of accuracy, the geographic area of the user conducting each query. We designate a random sample of 30 percent of eBay’s U.S. tra c in which we stopped all bidding for eBay’s non-brand keywords for 60 days. The test design we implemented lends itself to a standard di↵erence-in-di↵erences estimation of the e↵ect of paid search on sales. This design allows us to explore heterogeneous responses across a wider consumer base, not just those searching for eBay directly.8 The non-brand keyword experiments show that SEM had a very small and statistically insignificant e↵ect on sales. This suggests that on average, U.S. consumers do not shop more on eBay when they are exposed to paid search ads on Google. To explore this further, we segmented users according to the frequency at which they visited eBay the year before the test. We find that SEM accounted for a statistically significant increase in new 7 see “Inside eBay’s business intelligence” by Jon Tullett, news analysis editor for ITWeb at http://www.itweb.co.za/index.php?option=com_content&view=article&id=60448: Inside-eBay-s-business-intelligence&catid=218 8 A number of papers have looked at topics related to paid search advertising. See Sahni (2011), Rutz and Bucklin (2011), Yao and Mela (2011), Chan et al. (2011), and Yang and Ghose (2010). 4
  • 6. registered users and purchases made by users who bought only one or two items the year before. For consumers who bought more frequently, SEM does not have a significant e↵ect on their purchasing behavior. We calculate that the short-term returns on investment for SEM were negative because more frequent eBay shoppers are accountable for most of paid search sales. To interpret our results in light of the economics literature, consider the informative view of advertising, which suggests that advertising informs consumers of the characteristics, location and prices of products and services that they may otherwise be ignorant about. This will promote competition among producers, and allow consumers to find better and/or cheaper products for purchase. Intuitively, SEM is an advertising medium that a↵ects the information that people have, and is unlikely to play a persuasive role.9 It is possible that display ads, which appear on pages without direct consumer queries, may play more of a persuasive role, a↵ecting the demand of people who are interested in certain topics.10 The heterogeneous response of di↵erent customer segments to paid search advertising supports the intuition that SEM plays an informative role. Consumers who have completed at least three eBay transactions in the year before our experiment are likely to be familiar with eBay’s o↵erings and value proposition, and are una↵ected by the presence of paid search advertising. In contrast, more new users sign up when they are exposed to these ads, and users who only purchased one or two items in the previous year increase their purchases when exposed to SEM. These results echo findings in Ackerberg (2001) who considers the e↵ects of ads on the purchasing behavior of consumers and shows, using a reduced form model, that consumers who were not experienced with the product were more responsive to ads than consumers who had experienced the product. To the best of our knowledge, our analysis o↵ers the first large scale field experiment that documents the heterogeneous behavior of customers as a causal response to changes in advertising. We are also able to demonstrate a more refined set of responses based on purchase recency and frequency. 9 A recent survey by Bagwell (2007) gives an excellent review of the economics literature on advertising as it evolved over more than a century. Aside from the informational view, two other views were advocated. The persuasive view of advertising suggests that consumers who are exposed to persuasive advertising will develop a preference for the advertised brand, increasing the advertiser’s market power. The complementary view posits that advertising enters directly into the utility function of consumers. 10 A few papers have explored the e↵ects of display ads on oflline and online sales: Manchanda et al. (2006), Goldfarb and Tucker (2011a) and Lewis and Reiley (2010). 5
  • 7. A simple rationalization of our results is that a large majority of potential consumers have fairly good information about eBay’s site and its o↵erings, and they receive no additional information from paid search ads. Only a relatively small fraction of consumers are unaware of the brand, or have used it infrequently enough to not fully understand the scope of its o↵erings. It is this small set of consumers who are impacted positively by ads because of their interest in purchasing once they become informed of the products and prices o↵ered. The results and arguments laid out above, and the analysis described in detail in sections 3-5 below, suggest that the e cacy of SEM is weak, a conclusion that is likely to apply to other large brands that together spend billions of dollars a year on internet marketing. Of the $31.7 billion that was spent in the U.S. in 2011 on internet advertising, estimates project that the top 10 spenders in this channel account for about $2.36 billion.11 If, as we suspect, our results generalize to other well known brands that are in most consumers’ considerations sets, then our study suggests that the amount spend on internet advertising overall is beyond the peak of its e cacy. We discuss the challenges that companies face in choosing optimal levels of advertising, as well as some of the reasons that they seem to overspend on internet marketing in Section 7. 2 An Overview of Search Engine Marketing SEM has been celebrated for allowing advertisers to place ads that directly relate to the queries entered by consumers in search platforms such as Google, Microsoft (Bing) and Yahoo!, to name a few.12 SEM ads link to a landing page on the advertiser’s website, which typically showcases a product that is relevant to the search query. Figure 1a shows a Google search results page for the query “used gibson les paul”. The results fall into two categories: paid (or sponsored) search ads that appear in the shaded upper area (two ads) and on the right (seven ads), and unpaid (also called “natural” or “organic”) search results that appear below the shaded area. 11 These include, in order of dollars spent, IAC/Interactive Group; Experian Group; GM; AT&T; Progressive; Verizon; Comcast; Capital One; Amazon; and eBay. See the press release by Kantar Me- dia on 3/12/2012, http://kantarmediana.com/sites/default/files/kantareditor/Kantar_Media_ 2011_Full_Year_US_Ad_Spend.pdf 12 These di↵er from Display (or banner) ads that appear on websites that the consumer is browsing, and are not a response to a search query entered by the consumer. We focus most of our discussion on Google primarily because it is the leading search platform. 6
  • 8. Figure 1: Google Ad Examples (a) Used Gibson Les Paul (b) Macys The ranking of the unpaid results is determined by Google’s “PageRank” algorithm, which ranks the results based on relevance, while the ranking of the paid search ads depend on the bids made by advertisers for appearing when the particular query is typed by a user, and on a proprietary “quality score” that depends on the click-through rate of the bidder’s previous ads. For a more detailed explanation of the bidding and scoring process of SEM, see Edelman et al. (2007) and Varian (2007). Advertisers pay only when a user clicks on the paid search ad, implying that ad expenses are only made on consumers who respond to the ad. Furthermore, because firms pay when a consumer clicks on their ad, and because they must bid higher in order to appear more prominently above other paid listings, it has been argued that these “position auctions” align advertiser incentives with consumer preferences. Namely, lower-quality firms that expect clicks on their ads not to convert will not bid for positions, while higher-quality firms will submit higher bids and receive higher positions, expecting more satisfied users who will convert their clicks to purchases.13 13 Indeed, Athey and Ellison (2011) suggest that, sponsored link auctions create surplus by providing consumers with information about the quality of sponsored links which allows consumers to search more e ciently. 7
  • 9. The example in Figure 1a describes what is referred to as a non-brand keyword search, despite the fact that a particular branded product (Gibson Les Paul) is part of the query. The reason is that many retailers with their own brand names will o↵er this guitar for sale as the search results clearly show. This is in contrast to a branded keyword such as “macys”. Figure 1b shows the results page from searching for “macys” on Google, and as the figure shows there is only one paid ad that links to Macy’s main webpage. Notice, however, that right below the paid ad is the natural search result that links to the same page. In this case, if a user clicks on the first paid search result then Macy’s will have to pay Google for this referral, while if the user clicks on the link below then Macy’s will attract this user without paying Google. 3 Brand Search Advertising - A Natural Experiment In March of 2012, eBay conducted a test to study the returns of brand keyword search advertising. Brand terms are any queries that include the term eBay such as “ebay shoes.” It is our hypothesis that users searching for “eBay” are in fact using Google as a navigational tool with the intent to go to ebay.com. If so, there would be little need to advertise for these terms and “intercept” those searches because the natural search results provided by Google will serve as a perfect substitute. To test this hypothesis, eBay halted advertising for its brand related terms on a smaller search advertising platform (MSN). As suspected, almost all of the forgone click tra c from turning o↵ brand keyword paid search was immediately captured by natural search tra c from the platform, in this case Bing. That is, substitution between paid and unpaid tra c was nearly complete.14 Figure 2a plots the paid and natural clicks originating from the search platform. By design, paid clicks were driven to zero when advertising spending was suspended. At the same time, there was a noticeable uptake in natural clicks. This is strong evidence that the removal of the advertisement raises the prominence of the eBay natural search result. Since users’ intent is to find eBay, it is not surprising that shutting down the paid search path to their desired destination simply diverts tra c to the next easiest path, natural search, which is free to the advertiser. 14 In a recent paper, Yang and Ghose (2010) similarly switched o↵ and back on paid search advertising for a random set of 90 keywords. We find much smaller di↵erences in total tra c, most likely because we experimented with a brand term where the substitution e↵ect is much larger. 8
  • 10. Figure 2: Brand Keyword Click Substitution 01jan2012 08jan2012 15jan2012 22jan2012 29jan2012 05feb2012 12feb2012 19feb2012 26feb2012 04mar2012 11mar2012 18mar2012 25mar2012 01apr2012 08apr2012 15apr2012 22apr2012 29apr2012 06may2012 13may2012 20may2012 27may2012 03jun2012 10jun2012 17jun2012 24jun2012 01jun2012 08jun2012 15jun2012 22jun2012 29jun2012 06jul2012 13jul2012 20jul2012 27jul2012 03aug2012 10aug2012 17aug2012 24aug2012 31aug2012 07sep2012 14sep2012 MSN Paid MSN Natural Goog Natural Goog Paid Goog Natural (a) MSN Test (b) Google Test MSN and Google click tra c is shown for two events where paid search was suspended (Left) and suspended and resumed (Right). To quantify this substitution, Table 1 shows estimates from a simple pre-post comparison as well as a simple di↵erence-in-di↵erences across search platforms. In the pre-post analysis we regress the log of total daily clicks from MSN to eBay on an indicator for whether days were in the period with ads turned o↵. Column 1 shows the results which suggest that click volume was only 5.6 percent lower in the period after advertising was suspended. This approach lacks any reasonable control group. It is apparent from Figure 2a that tra c increases in daily volatility and begins to decline after the advertising is turned o↵. Both of these can be attributed to the seasonal nature of e-commerce. We look to another search platform which serves as a source for eBay tra c, Google, as a control group to account for seasonal factors. During the test period on MSN, eBay continued to purchase brand keyword advertising on Google which can serve as a control group. With this data, we calculate the impact of brand keyword advertising on total click tra c. In the di↵erence-in-di↵erences approach, we add observations of daily tra c from Google and Yahoo! and include in the specification search engine dummies and trends.15 The variable of interest is thus the interaction between a dummy for the MSN platform and a dummy for treatment (ad o↵) period. Column 2 of Table 1 show a much smaller impact 15 The estimates presented include date fixed e↵ects and platform specific trends but the results are very similar without these controls. 9
  • 11. Table 1: Quantifying Brand Keyword Substitution MSN Google (1) (2) (3) Log Clicks Log Clicks Log Clicks Period -0.0560⇤⇤⇤ -0.0321⇤ (0.00861) (0.0124) Interaction -0.00529 (0.0177) Google 5.088 (10.06) Yahoo 1.375 (5.660) Constant 12.82⇤⇤⇤ 11.33⇤ 14.34⇤⇤⇤ (0.00583) (5.664) (0.00630) Date FE Yes Platform Trends Yes N 118 180 120 Standard errors in parentheses ⇤ p < 0.05, ⇤⇤ p < 0.01, ⇤⇤⇤ p < 0.001 once the seasonality is accounted for. Only 0.529 percent of the click tra c is lost so 99.5 percent is retained. These results inspired a follow-up test on the larger Google platform that was executed in July of 2012 which yielded similar results. Figure 2b shows both the substitution to natural tra c when search advertising was suspended and the substitution back to paid tra c when advertising resumed. Column 3 of Table 1 show the estimated impacts: total tra c referred by Google dropped by three percent. It is likely that a well constructed control group would reduce this estimate as was evident in the MSN test. During this test, there was no viable control group available because there was no other contemporaneous paid search brand advertising campaign. In the Appendix, we describe a test we designed and executed that preserved a control group in a European market which confirms the results described here. In summary, the evidence strongly supports the intuitive notion that for brand keywords, natural search is close to a perfect substitute for paid search, making brand keyword SEM ine↵ective for short-term sales. After all, the users who type the brand keyword in the search query intend to reach the company’s website, and most likely will execute on their 10
  • 12. intent regardless of the appearance of a paid search ad. This substitution is less likely to happen for non-brand keywords, which we explore in the next section. 4 Non-Brand Terms Controlled Experiment When typing queries for non-brand terms, users may be searching for information on goods and services that they wish to explore further, or even to purchase. If ads appear for users who do not know the these products are available at the advertiser’s website, then there is greater potential to bring these users to the site, which in turn might generate additional sales that would not have occurred without the ads. Because eBay bids on a universe of over 170 million keywords, it provides an ideal environment to test the e↵ectiveness of paid search ads for non-brand keywords. The broad set of keywords place ads in front of a wider set of users: anyone searching for queries related to millions of products and not just those searching specifically for eBay. Measuring the e↵ects of the full keyword set more directly addresses the value of informative advertising because we can examine how consumers with di↵erent levels of familiarity with the site respond to advertising. In particular, we have past purchase behavior for users who visit and purchase items on eBay, and we can use measures of past activity to segment users into groups that would be more or less familiar with eBay’s o↵erings. Non-brand ads have the ability to attract users that are not directly searching for eBay but the endogeneity remains because the ads may attract users who are already familiar with eBay for which the ad provided little or no information. In short, these users may have visited eBay eventually if the ad were not present. 4.1 Experimental Design and Basic Results To determine the impact of advertising on the broader set of search queries we designed and implemented a large scale field experiment that exposes a random subset of users to ads and preserves a control group of users who did not see ads.16 This was accomplished by leveraging Google’s relatively new technology that allows advertisers to target their ads to the geography of the user. We use Google’s geographic bid feature that can determine, 16 Whereas the previous section referred to a test of advertising for branded keywords and their variants, this test specifically excluded brand terms. That is, eBay continued to purchase brand ads nationally until roughly 6 weeks into the geographic test when the brand ads were halted nationwide. 11
  • 13. with a reasonable degree of accuracy, the Nielsen Designated Market Area (DMA) of the user conducting each query. There are 210 DMAs in the United States, which typically correspond to large metropolitan areas. For example, Google’s home market includes the San Francisco, Oakland, and San Jose metropolitan areas. For the test, advertising was suspended in roughly 30 percent of DMAs. This was done simply to reduce the scope of the test and minimize the potential cost and impact to the business (in the event that the ads created considerable profits). To select these markets, a purely random sub sample of DMAs were chosen as candidates for the test. Next, candidate DMAs were divided into test and control DMAs using an algorithm that matched historical serial correlation in sales between the two regions. This was done to create a control group that mirrored the test group in seasonality. This procedure implies that the test group is not a purely random sample, but it is certainly an arbitrary sample that does not exhibit any historical (or, ex post) di↵erence in sales trends. The test design therefore lends itself neatly to a standard di↵erence-in-di↵erences estimation of the e↵ect of paid search on sales. The execution can be seen in Figure 3a which plots total attributed sales for the three regions of the U.S.: the 65 test DMAs where advertising ceased, 68 matched control DMAs, and the remaining 77 control DMAs. As before, attributed sales is the total sales of all purchases to users within 24 hours of that user clicking on a Google paid search link.17 Note that attributed sales do not completely zero out in the test DMAs after the test was launched in late May. The remaining ad sales from test DMAs is an artifact of the error both in Google’s ability to determine a user’s location and our determination of the user’s location. We use the user’s shipping zip code registered with eBay to determine the user’s DMA and whether or not the user was exposed to ads. If a user makes a purchase while traveling to a region exposed to ads but still has the product shipped to her home, we would assign the associated sales to the o↵ region. Attributed sales falls by over 72 percent.18 A very simple assessment of the di↵erence-in-di↵erences results is plotted in Figure 3b. We plot the simple di↵erence, ratio, and log di↵erence between daily average sales in the designated control regions where search remained on and the test regions where search is o↵. As is apparent, the regions where search remained on are larger (about 30 17 The y-axis is suppressed to protect properietary sales data. It is in units of dollars per DMA, per day. 18 This classification error will attenuate the estimated e↵ect towards zero. 12
  • 14. Figure 3: Non-Brand Keyword Region Test 1.2 1.4 80 100 60 .4 .3 .2 01apr2012 08apr2012 15apr2012 22apr2012 29apr2012 06may2012 13may2012 20may2012 27may2012 03jun2012 10jun2012 17jun2012 24jun2012 01jul2012 08jul2012 15jul2012 22jul2012 01apr2012 08apr2012 15apr2012 22apr2012 29apr2012 06may2012 13may2012 20may2012 27may2012 03jun2012 10jun2012 17jun2012 24jun2012 01jul2012 08jul2012 15jul2012 22jul2012 On/Off (On−Off) Test Control Rest of U.S. Log(On−Off) Test (a) Attributed Sales by Region (b) Di↵erences in Total Sales percent) than the regions switched o↵.19 This is an artifact of the selection algorithm Table 2: Di↵-in-Di↵ Regression Estimates (1) (2) Log Sales Log Sales Interaction 0.00440 0.00440 (0.00628) (0.00629) Experiment Period -0.0579⇤⇤⇤ (0.00531) Search Group -0.0130 (0.169) Constant 11.75⇤⇤⇤ 11.77⇤⇤⇤ (0.133) (0.00856) Date Fixed E↵ects Yes DMA Fixed E↵ects Yes N 23730 23730 Standard errors, clustered on the DMA, in parentheses ⇤ p < .1, ⇤⇤ p < .05, ⇤⇤⇤ p < .01 that optimized for historical trends. This di↵erence is constant through the pre and post experimental period demonstrating the muted overall impact of paid search. To quantify the impact of paid search, we preform a di↵erence-in-di↵erences calculation using the period of April through July and the full national set of DMAs. The entire regime of paid search adds only 0.44 percent to sales. The regression equivalent estimates are shown 19 The Y-axis is shown for the ratio, the log di↵erence, and in di↵erences in thousands of dollars per day, per DMA. 13
  • 15. in Table 2. A regression setting allows us to add precision to the estimates because we can control for inter-DMA variation with DMA clustered standard errors and DMA fixed e↵ects. The point estimates are robust to di↵erent specifications, and adding additional controls substantially reduces the standard error of the estimator.20 We examine the e↵ects of the endogeneity on estimates of returns in Table 3. Columns 1 and 2 show the estimates of a regression of log revenue on log spending during period prior to our test. As is evident, a simple OLS yields unrealistic returns suggesting that every 10 percent increase in spending raises revenues by 9 percent. The inclusion of controls lowers this estimate but still suggests that paid search contributes a substantial portion of revenues. Our discussions with industry practitioners suggest that most firms similarly use a number of controls, which reduce the bias but still yield large positive returns. However, as we explain in the introduction, the amount spent on ads depends on the search behavior of users, which is correlated with their intent to purchase. It is this endogeneity problem that our experiment overcomes. Table 3: Instrument for Return, Dep Var: Log Revenue OLS IV (1) (2) (3) Log Spending 0.895⇤⇤⇤ 0.102⇤⇤⇤ 0.00563 (0.0136) (0.0325) (0.0411) DMA Fixed E↵ects Yes Date Fixed E↵ects Yes N 10500 10500 23730 Standard errors in parentheses ⇤ p < .1, ⇤⇤ p < .05, ⇤⇤⇤ p < .01 Column 3 of Table 3 shows an estimation of spending’s impact on revenue using the di↵erence-in-di↵erences indicators as excluded instruments. The instruments isolate the exogenous experimental variation in spending to estimate the causal impact of spending on changes in revenue. True returns are an order of magnitude smaller and no longer statistically di↵erent from zero suggesting that even eBay’s large spending may have no return at all. 20 The weekly cycle of e-commerce purchase behavior produces a sizable negative intra-DMA correlation. Thus, panel variable clustered standard errors are substantially smaller than simple standard errors. The inclusion of DMA fixed e↵ects increases precision for the same reason. 14
  • 16. 4.2 Consumer Response Heterogeneity The advantage of an experimental design that varies treatments across geographic markets is that we can now compare many outcome metrics between markets. This allows us to separate outcomes by observable user characteristics because each subset of the user base will now be observed in markets that are experimentally exposed to advertising. Econometrically, this can be accomplished by interacting the treatment dummy with dummies for each subgroup which produces a set of coe cients representing the total average e↵ect from the advertising regime on that subgroup. We examine user characteristics that are common in the literature: recency and frequency of a user’s prior purchase history. First, we interact the treatment dummy with indicators for the number of purchases by that user in the year leading up to the experiment window.21 Figure 4a plots the point estimates of the treatment interactions. The experiment generated the largest e↵ect on sales for users that had not purchased before. Interestingly, the treatment e↵ect diminishes quickly with purchase frequency - causal returns to revenue are largest for new and infrequent customers. Estimates are consistently near zero for users who buy regularly (e.g. more than 3 times per year). Figure 4: Paid Search Impact by User Segment 0.15 0.15 0.10 0.10 % Change in Sales % Change in Sales 0.05 0.05 0.00 0.00 −0.05 −0.05 −0.10 0 2 4 6 8 10 0 30 60 90 120 150 180 210 240 270 300 330 360 User’s Purchase Count for the 12 months ending Days since User’s Last Purchase Parameter estimate 95% Conf Interval Parameter estimate 95% Conf Interval (a) User Frequency (b) User Recency Second, Figure 4b plots the interactions by time since last purchase. Estimates become noisier as we look at longer periods of inactivity because there are fewer observations 21 Transaction counts exclude the pre-test period used for the di↵erence-in-di↵erences analysis. 15
  • 17. that return after longer absences. The estimates are tightly estimated zero impacts for 0, 30, 60 and even 90 day absences, suggesting that advertising has little impact on active and moderately active customer. However, the e↵ect then steadily rises with absence and impacts are once again large and statistically significant when looking at customers who have not purchased in over a year. The implication of Figure 4 is clear: search advertising works only on a firm’s least active customers. These are traditionally considered a firms “worst” customers, and advertising is often aimed a high value repeat consumers (Fader et al., 2005). This evidence supports an advertising model that a↵ects consumption choice only when the advertising updates a consumer’s information set. Bluntly, search advertising only works if the consumer has no idea that the firm has the desired product. Large firms like eBay with powerful brands will see little benefit from paid search advertising because most consumers already know that they exist, as well as what they have to o↵er. The modest returns on infrequent users likely come from informing them that eBay has products they did not think were available on eBay. Active consumers already know this and hence are not e↵ectively influenced. While the least active customers are the most desirable targets for search advertising, we find that most paid search tra c and attributed sales are high volume, frequent purchasers. Figure 5 demonstrates the relationship between attribution and user purchase frequency. Figure 5a plots the count of buyers by how many purchases buyers make in a year. The Figure 5: Paid Search Attribution by User Segment 25% 6.0% 5.0% 20% 4.0% 15% 3.0% 10% 2.0% 5% 1.0% 0% 10 11 12 13 14 15 16 17 18 19 20 21 22 23 24 25 26 27 28 29 30 31 32 33 34 35 36 37 38 39 40 41 42 43 44 45 46 47 48 49 1 2 3 4 5 6 7 8 9 >100 50-100 0.0% 10 11 12 13 14 15 16 17 18 19 20 21 22 23 24 25 26 27 28 29 30 31 32 33 34 35 36 37 38 39 40 41 42 43 44 45 46 47 48 49 50 1 2 3 4 5 6 7 8 9 User's Purchase Count for the 12 Months Ending 2/1/2012 User's Purchase Count for the 12 Months Ending 2/1/2012 Buyers Paid Search Buyers Proportion Tracked Sales Paid Search Sales Proportion Paid Search (a) Buyer Count Mix (b) Transaction Count Mix 16
  • 18. counts are shown separately for all buyers and for that subset of buyers that buy, at any point in the year, after clicking on a paid search ad. The ratio of the two rises with purchase frequency because frequent purchasers are more likely to use paid search at some point. Figure 5b shows the same plot for shares of transaction counts. Even users who buy more than 50 times in a year (i.e. once a week) still use paid search clicks for 4 percent of their purchases. The large share of heavy users suggests that most of paid search spending is wasted because the majority of spending on Google is related to clicks by those users that would purchase anyway. This explains the large negative ROI computed in Section 4. We have searched for other indicators of consumer’s propensity to respond in localized demographic data. Although randomization was done at the DMA level, we can measure outcomes at the zip code level, and so we estimate a zip code level regression where we interact zip code demographic data with our treatment indicator. We find no di↵erential response across several demographic measures that is statistically significant: income, population size, unemployment rates, household size, and eBay user penetration. The coe cient on user eBay penetration (the proportion of registered eBay users per DMA) is negative, which complements the finding that uninformed and potential customers are more responsive than regular users. 4.3 Product Response Heterogeneity As argued above, a consumer’s susceptibility to internet search ads depends on how well informed they are about where such products are available. Given that the availability of products varies widely, the e↵ectiveness of paid search may vary by product type. As a large e-commerce platform, eBay’s paid search advertising campaigns present an opportunity to test the returns to advertising across product categories which vary in competitiveness, market thickness and general desirability. To our surprise, di↵erent product attributes did not o↵er any significant variation in paid search e↵ectiveness. As in Section 4.2, we decompose the response by interacting the treatment indicator with dummies for sub-groupings of revenue using the category of sales. We found no systematic relationship between returns and category. The estimates center around zero and are generally not statistically significant. At the highest level, only one category is significant, but with 38 coe cients, at least one will be significant by chance. We explored multiple layers of categorization, ranging from the broadest groupings of hundreds of categories. The extensive inventory eBay o↵ers suggests that some categories 17
  • 19. would generate returns because customers would be unaware of their availability on eBay. However, we have looked for di↵erential responses in very granular product categories and found no consistent pattern of response. Moreover, less than 5 percent of categories are statistically significant at the 5 percent confidence level. Moreover, in an examination of the estimates at finer levels of categorization, we found no connection between ordinal ranking of treatment impact product features like sales volume or availability. It is thus evident that for a well known company like eBay, product attributes are less important in search advertising than user intent and, more importantly, user information. 5 Channel Substitution The brand query tests demonstrated that causal (incremental) returns were small because users easily substituted paid search clicks for natural search clicks. Metaphorically, we closed one door and users simply switched to the next easiest door. This substitution was expected because users were using brand queries as simple navigational tools. Unbranded queries are not simply navigational because users are using the search platform to find any destination that has the desired product. Only experimental variation can quantify the number of users who are actually informed by the presence of search advertising. Such experimentation can also measure the extent to which paid and natural search are substitutes for non-brand terms. This substitution exists because non-brand searches for many products that eBay sells should produce some amount of natural search tra c. For example, in Figure 1a we showed Google’s search results page for the query “used gibson les paul”. Notice that the second ad from the top, as well as the center image of the guitar below it, are both paid ads that link to eBay. At the same time, the two bottom results of the natural search part of the page also link to eBay. Hence, some substitution from paid to natural search may occur for non-brand keywords as well. We measure this potential substitution by regressing natural search attributed sales on paid search attributed sales. The two are naturally highly correlated because shocks to purchase intent are common to both channels. We again use the experimental treatment dummies as excluded instruments to measure the causal impact of increases in paid search sales on natural search sales. The experimental dummies are correlated with paid search sales because paid search spending, which was turned o↵ in the experiment is a driver of 18
  • 20. attributed sales, and the dummies are random by design so they are otherwise uncorrelated with natural search sales. Table 4: Natural Search Substitution Dep Var: Log Non-Brand SEO Tracked Sales (1) (2) (3) (4) OLS OLS-FE IV IV-FE Log Paid Search Sales 0.699⇤⇤⇤ 0.00560 -0.182 -0.0391⇤⇤⇤ (0.0223) (0.00433) (0.126) (0.0110) Constant 3.724⇤⇤⇤ 9.038⇤⇤⇤ 10.41⇤⇤⇤ (0.174) (0.0439) (0.932) DMA,Date Fixed E↵ects YES YES Observations 23178 23178 14706 14706 Table 4 shows the OLS and IV estimates with and without date and DMA fixed e↵ects. Fixed e↵ects greatly reduce the bias but still leave the estimates wrongly positive. The IV estimates show that paid and natural search are in fact substitutes but the estimates are remarkably small with an an elasticity of -.039. This leaves open the question about tra c substitution. To extend the metaphor, we closed the paid search door, saw no increase in tra c through the natural search door, but still saw the same number of total purchases as evidenced by the una↵ected total sales. Where did the additional take up come from? A decrease in the use of the search platform without a corresponding drop in sales suggests a more complex relationship between paid tra c origination and user purchase behavior. A natural hypothesis may again be the sheer name recognition of eBay. Most people who are searching for goods may already have eBay in their consideration set, and plan to visit the site directly unless they are guided to the site with a convenient paid search ad. In lieu of this ad, therefore, the user may just open a browser and type “www.ebay.com” directly into the address bar. We hope to explore this hypothesis in future work. 6 Deriving Returns on Investment To make the importance of our results clear and interpret their implications for business decisions, we compute the implied return on investment (ROI) associated with spending on paid search. To derive the ROI from the estimates of impacts on revenue we need to 19
  • 21. add information on spending. Imagine that initially the amount spent on paid search was S 0 associated with revenues equal to R0 . Let R = R1 R0 be the di↵erence in revenues as a consequence of a di↵erence in spending, S = S1 S 0 , and by definition, R ROI = S 1. R Let = ln(R) ⇡ R0 be our estimated coe cient on paid search e↵ectiveness, that is, the e↵ect of an increase in spend on revenues as estimated in tables 2 and 3.22 After some simple algebra on this approximation we have, R⇡ (1+ ) ⇤ R0 . Using the definition of ROI and setting S 0 = 0 (no spending on paid search), we have, R0 ROI ⇡ 1 (1) (1 + ) S 0 It should be noted that this calculation of ROI considers only short term, immediate revenues. The long term benefits of adding customers or informing customers of new product holdings that leads to future returns are not accounted for. We discuss this further in Section 7. In order to actually calculate the ROI from paid search we would need to use actual revenues and costs from the DMAs used for the experiment (or total revenues and costs of paid search), but these are proprietary information that we cannot reveal due to company policy. Instead, we use revenues and costs from public sources regarding eBay’s operations. Revenue in the U.S. is derived from eBay’s financial disclosures using Marketplaces net revenue prorated to U.S. levels using the ratio of gross market volume (sales) in the U.S. to global levels, which results in U.S. gross revenues of $2,880.64 (in millions).23 We obtain paid search spending from the release of information about the expenditures of several top advertising spenders on Google. Our estimate of eBay’s yearly paid search spending for the U.S. is $51 million.24 Table 5 presents the ROI estimates using our experimental results, coe cients from Tables 2 and 3, and the publicly available reports on revenue and spending as described above. 22 Recall that = ln(R1 ) ln(R0 ) = ln(1 + RR ) which for small values of RR equals approximately RR . 0 0 0 23 Total revenues for 2012 were $7,398 and the share of eBay’s activity in the U.S. was $26,424/$67,763. See http://files.shareholder.com/downloads/ebay/2352190750x0x628825/ e8f7de32-e10a-4442-addb-3fad813d0e58/EBAY_News_2013_1_16_Earnings.pdf 24 The information reports a monthly spend of $4.25 million, which we impute to be $51 million. See http://mashable.com/2010/09/06/brand-spending-google/ 20
  • 22. Table 5: Return on Investment OLS IV DnD (1) (2) (3) (4) 0.895 0.102 0.00563 0.0044 A Spend (Millions of $) $ 51.00 $ 51.00 $ 51.00 $ 51.00 B Gross Revenue (R0 ) 2,880.64 2,880.64 2,880.64 2,880.64 C Net Revenue (R0 ) 1,520.13 2,614.01 2,864.51 2,868.02 D=C/(1+A) R 1,360.51 266.63 16.13 12.62 E=C-D ROI 2568% 423% -68% -75% F=E/A-1 As is evident, simple OLS estimation yields unrealistic returns of over 2500 percent and even accounting for daily and geographic e↵ects implies returns that are greater than 400 percent, as shown in Column 2. The IV estimation reduces the ROI estimate significantly below zero to negative 68 percent and our best estimate of average ROI using the direct di↵erence-in-di↵erences estimation is negative 75 percent as shown in Column 4.25 7 Discussion The results of our study show that for a well-known brand like eBay, the e cacy of SEM is limited at best. For the most part, paid-search expenditures are concentrated on consumers who would shop on eBay regardless of whether they were shown paid search ads. As we outline in the introduction, of the $31.7 billion that was spent in the U.S. in 2011 on internet advertising, the top 10 spenders in this channel account for about $2.36 billion. These companies generally use the same methods and the same consulting firms to design their ad campaigns and there are many reasons to think that the results we presented above would generalize to these large and well known corporations. This would most likely not be true for small and new entities that have no brand recognition, which must pay in order to appear at the top of a search page for any given query.26 25 As described above, this calculation is done for revenue and spending obtained from public sources about the U.S. portion of eBay. We can instead use reported global revenue from eBay’s 10K together with spending estimates from Kantar Media as a robustness calculation (http://kantarmediana.com/ sites/default/files/kantareditor/Kantar_Media_2011_Full_Year_US_Ad_Spend.pdf). Since they report total internet marketing expenditures globally, we can pro-rate the amount spent on paid search using the IAB report, which states that paid search is about 46.5% of total internet marketing spend. This places ROI at negative 60 percent, which is close to the negative 75 percent reported above in column 4. Columns 1 through 3 use a coe cient that is log-log and hence requires a slightly di↵erent derivation. 26 If you were to start a new online presence selling a high quality and low-priced widget, someone querying the word “widget” would still most likely not see your site. This is a consequence of the PageRank 21
  • 23. This begs the question: why do well-known branded companies spend such large amounts of money on what seems to be a rather ine↵ective marketing channel? We believe that the reason is the challenges that these companies face in generating causal measures of the returns to advertising. As the results in Table 5 demonstrate, a naive regression of sales on advertising spend would result in an ROI estimate of 2500 percent, while a more thoughtful regression that accounts for seasonal and geographic variation would drop that number to about 400 percent. Still, this vastly overestimates the negative 75 percent that we estimate using the experiments. This is in line with other experimental results obtained recently by Lewis et al. (2011) regarding the e↵ectiveness of display ads.27 Of course, this overstated e↵ect from using regressions on observational data should not be a surprise. It is precisely for this reason that scholars resort to natural experiments (e.g., Goldfarb and Tucker (2011b)) or controlled experiments (e.g., Lewis et al. (2011)), in order to correctly assess a variety of e↵ects related to internet marketing. This is, however, not the norm in industry. Not only do most consulting firms who provide marketing analytics services use observational data, recommendations from Google o↵er analytical advice that is not consistent with true causal estimates of ad e↵ectiveness. As an example, consider the advice that Google o↵ers its customers to calculate ROI: “Determining your AdWords ROI can be a very straightforward process if your business goal is web-based sales. You’ll already have the advertising costs for a specific time period for your AdWords account in the statistics from your Campaigns tab. The net profit for your business can then be calculated based on your company’s revenue from sales made via your AdWords advertising, minus the cost of your advertising. Divide your net profit by the advertising costs to get your AdWords ROI for that time period.”28 This advice is very much akin to running a regression of sales on adwords expenditures, which is not too di↵erent from the approach that result in the inflated ROIs that we report in columns 1 and 2 of Table 5. It does not, however account for the endogeneity concern algorithm that relies on established links to webpages. Only after many websites link to your site, related to the word widget, will you stand a chance of rising to the top of the organic search results. 27 Using a controlled experiment they demonstrated that displaying a certain brand ad resulted in an increase of 5.4 percent in the number of users performing searches on a set of keywords related to that brand. They then compared the experimental estimate to an observational regression estimate, which resulted in an increase ranging from 871 percent to 1198 percent. 28 See http://support.google.com/adwords/answer/1722066 22
  • 24. that our study highlights where consumers who use paid search advertising on their way to a purchase may have completed that purchase even without the paid search ads. The only way to circumvent this measurement concern is to adopt a controlled test that is able to distinguish between the behavior of consumers who see ads and those who don’t. As we have shown, once this is done correctly, estimates of ROI shrink dramatically, and for our case become very negative.29 The experimental design that we use exploits the ability of an advertiser to geograph- ically control the ad expenses across DMAs, thus yielding a large-scale test-bed for ad e↵ectiveness. The idealized experiment would have been conducted on a more refined user-level randomization, which would allow us to control for a host of observable user-level characteristics.30 Still, given the magnitude of our experiment and our ability to aggregate users by measures of recency, frequency, and other characteristics, we are able to detect heterogeneous responses that shed light on the way users respond to ads. As targeting technology is developed further in the near future, individual-level experiments can be performed and more insights will surely be uncovered. 29 As mentioned earlier, this is only a short term estimate. Still, to overcome the short-term negative ROI of 75% it is possible to calculate the lifetime value of a customer acquired that would be required to make the investment worthwhile. This is beyond the scope of our current research. 30 For example, Anderson and Simester (2010) analyze results from experiments using direct mailing catalogs which are addressed to specific individuals for which the company has lots of demographic information. This level of targeting is not currently feasible with online ads. 23
  • 25. References Ackerberg, Daniel A, “Empirically distinguishing informative and prestige e↵ects of advertising,” RAND Journal of Economics, 2001, pp. 316–333. Anderson, Eric T and Duncan I Simester, “Price stickiness and customer antagonism,” The Quarterly Journal of Economics, 2010, 125 (2), 729–765. Athey, Susan and Glenn Ellison, “Position auctions with consumer search,” The Quarterly Journal of Economics, 2011, 126 (3), 1213–1270. Bagwell, Kyle, “The economic analysis of advertising,” Handbook of industrial organization, 2007, 3, 1701–1844. Berndt, Ernst R, The practice of econometrics: classic and contemporary, Addison-Wesley Reading, MA, 1991. Chan, Tat Y, Chunhua Wu, and Ying Xie, “Measuring the lifetime value of customers acquired from google search advertising,” Marketing Science, 2011, 30 (5), 837–850. Edelman, Benjamin, Michael Ostrovsky, and Michael Schwarz, “Internet advertising and the generalized second price auction: Selling billions of dollars worth of keywords,” The American Economic Review, 2007, 97 (1), 242–259. Fader, P.S., B.G.S. Hardie, and K.L. Lee, “RFM and CLV: Using iso-value curves for customer base analysis,” Journal of Marketing Research, 2005, pp. 415–430. Goldfarb, A., “What is di↵erent about online advertising?,” Review of Industrial Organization, forth- coming, 2012. Goldfarb, Avi and Catherine Tucker, “Online display advertising: Targeting and obtrusiveness,” Marketing Science, 2011, 30 (3), 389–404. and , “Search engine advertising: Channel substitution when pricing ads to context,” Management Science, 2011, 57 (3), 458–470. Lewis, R.A., J.M. Rao, and D.H. Reiley, “Here, there, and everywhere: correlated online behaviors can lead to overestimates of the e↵ects of advertising,” in “Proceedings of the 20th international conference on World wide web” ACM 2011, pp. 157–166. Lewis, Randall and David Reiley, “Does retail advertising work: Measuring the e↵ects of advertising on sales via a controlled experiment on Yahoo!,” Technical Report, Working paper 2010. Manchanda, Puneet, Jean-Pierre Dub´, Khim Yong Goh, and Pradeep K Chintagunta, “The e e↵ect of banner advertising on internet purchasing,” Journal of Marketing Research, 2006, pp. 98–108. Rutz, Oliver J and Randolph E Bucklin, “From Generic to Branded: A Model of Spillover in Paid Search Advertising,” Journal of Marketing Research, 2011, 48 (1), 87–102. Sahni, Navdeep, “E↵ect of Temporal Spacing between Advertising Exposures: Evidence from an Online Field Experiment,” 2011. Varian, Hal R, “Position auctions,” International Journal of Industrial Organization, 2007, 25 (6), 1163–1178. 24
  • 26. Yang, S. and A. Ghose, “Analyzing the relationship between organic and sponsored search advertising: Positive, negative, or zero interdependence?,” Marketing Science, 2010, 29 (4), 602–623. Yao, Song and Carl F Mela, “A dynamic model of sponsored search advertising,” Marketing Science, 2011, 30 (3), 447–468. 25